Article

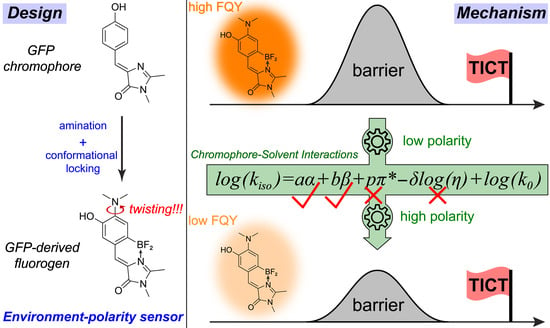
A Novel Dialkylamino GFP Chromophore as an Environment-Polarity Sensor Reveals the Role of Twisted Intramolecular Charge Transfer

1
Department of Chemistry, Oregon State University, 153 Gilbert Hall, Corvallis, OR 97331, USA
2
Institute of Bioorganic Chemistry, Russian Academy of Sciences, Miklukho-Maklaya 16/10, 117997 Moscow, Russia
3
Pirogov Russian National Research Medical University, Ostrovitianov 1, 117997 Moscow, Russia
*
Author to whom correspondence should be addressed.
Web: https://fanglab.oregonstate.edu/.
Chemosensors 2021, 9(8), 234; https://doi.org/10.3390/chemosensors9080234
Submission received: 10 August 2021 / Revised: 18 August 2021 / Accepted: 20 August 2021 / Published: 23 August 2021
(This article belongs to the Special Issue Organic Fluorescent Materials as Chemical Sensors)

Abstract

:
We discovered a novel fluorophore by incorporating a dimethylamino group (–NMe2) into the conformationally locked green fluorescent protein (GFP) scaffold. It exhibited a marked solvent-polarity-dependent fluorogenic behavior and can potentially find broad applications as an environment-polarity sensor in vitro and in vivo. The ultrafast femtosecond transient absorption (fs-TA) spectroscopy in combination with quantum calculations revealed the presence of a twisted intramolecular charge transfer (TICT) state, which is formed by rotation of the –NMe2 group in the electronic excited state. In contrast to the bright fluorescent state (FS), the TICT state is dark and effectively quenches fluorescence upon formation. We employed a newly developed multivariable analysis approach to the FS lifetime in various solvents and showed that the FS → TICT reaction barrier is mainly modulated by H-bonding capability instead of viscosity of the solvent, accounting for the observed polarity dependence. These deep mechanistic insights are further corroborated by the dramatic loss of fluorogenicity for two similar GFP-derived chromophores in which the rotation of the –NMe2 group is inhibited by structural locking.

Graphical Abstract

1. Introduction

Environment-sensitive dyes have long been popular research subjects due to their importance in chemistry and chemical biology [1]. In particular, fluorescence imaging and sensing techniques greatly rely on the functionality of these chemical dyes to provide unprecedented accuracy and resolution. The development of fluorescent probes such as fluorogenic dyes to bind fluorogen-activating proteins [2,3] and fluorescent sensors to detect metal ions [4,5] has significantly facilitated the advancement of imaging and sensing toolsets for modernized life sciences. There is currently strong interest and ongoing research to discover and create more photosensitive molecules with appealing traits for the development of next-generation fluorescent probes and sensors across chemical and biological fields. To achieve this goal, a fundamental understanding of the molecular origin underlying the fluorescence–structure–environment relationships is crucial.
Extensive efforts have been reported on environmental factors that influence the chemical and bio-probe fluorescence properties, which range from color (e.g., solvatochromic dyes) to intensity (e.g., fluorogenic dyes). The external factors include the polarity, viscosity, pH, metal ions, temperature, etc. Among them, polarity has drawn the most attention because the energy and transition states of all molecules with certain degrees of polarity (essentially due to intrinsic electronic charge separation and the resultant dipoles) are prone to environmental polarity and the optical transition gap and reaction barrier to nonfluorescent states could thereby be modified. On the other hand, suppression of solvatochromism with minimized quenching in water has proven useful with bioimaging applications such as two-photon fluorescence in vivo [6], and intramolecular hydrogen (H)-bonding could help to stabilize the initially accessed excited state and lead to dual fluorescence for some ortho-amino analogues of the GFP chromophore [7], both substantiating the rich photochemistry and applications of GFP derivatives with amino substituents.
The twisted intramolecular charge transfer (TICT) represents a common nonradiative pathway to depopulate the excited-state chromophores [8,9]. Though undesirable for bright fluorophore development [10,11], TICT may provide a useful strategy to achieve fluorogenicity. Previously, it has been shown that site-specific incorporation of an amino group to fluorescent scaffolds (e.g., coumarin and naphthalimide) could enable altered fluorescence quantum yields (FQYs) in solvents with different polarities [12,13,14]. The formation of a dark TICT state due to twisting of the dialkylamino group was typically suggested to result in fluorescence loss in polar solvents [15,16]. In very rare cases, the TICT state is fluorescent such as 4-(dimethylamino)benzonitrile, which shows dual fluorescence bands due to the emission of both the fluorescent state (FS) and TICT state [8,17,18,19]. This peculiar phenomenon was ascribed to radiative emission from higher vibronic levels of the TICT state and thus referred to as hot fluorescence [20]. Nevertheless, the TICT-induced fluorescence sensitivity to solvent polarity renders it possible to develop polarity sensors for in vitro and in vivo applications (typically with nanomolar concentration and photostability under visible light irradiation for tens of minutes in fluorescence microscopy) [21,22,23] with a quantitative characterization of the solute–fluorescence–solvent–polarity relationships in various regions of interest.
In this work, we present a novel fluorogenic dye (p-NMe2-m-HBDI:BF2, compound 1) engineered from the green fluorescent protein (GFP) chromophore through strategic placement of a dimethylamino group (–NMe2) on the electron-donating phenolic ring and conformational locking of the chromophore backbone [24,25]. This new compound exhibits dramatic polarity-dependent FQYs in 11 solvents being examined, in sharp contrast to two control compounds. Quantum calculations by systematic scanning of nuclear coordinates suggested the formation of a TICT state as a result of –NMe2 rotation to be the main driver for the chromophore fluorogenicity. With femtosecond transient absorption (fs-TA) spectroscopy and a newly developed multivariable analysis approach [26], we quantitatively characterized the intrinsic relationship between the solvent polarity and the solute nonradiative decay rate (mainly due to twisting motion of –NMe2 reaching a TICT state) and found that the FQY is mainly modulated by H-bonding interactions between the chromophore and solvent molecules.

2. Materials and Methods

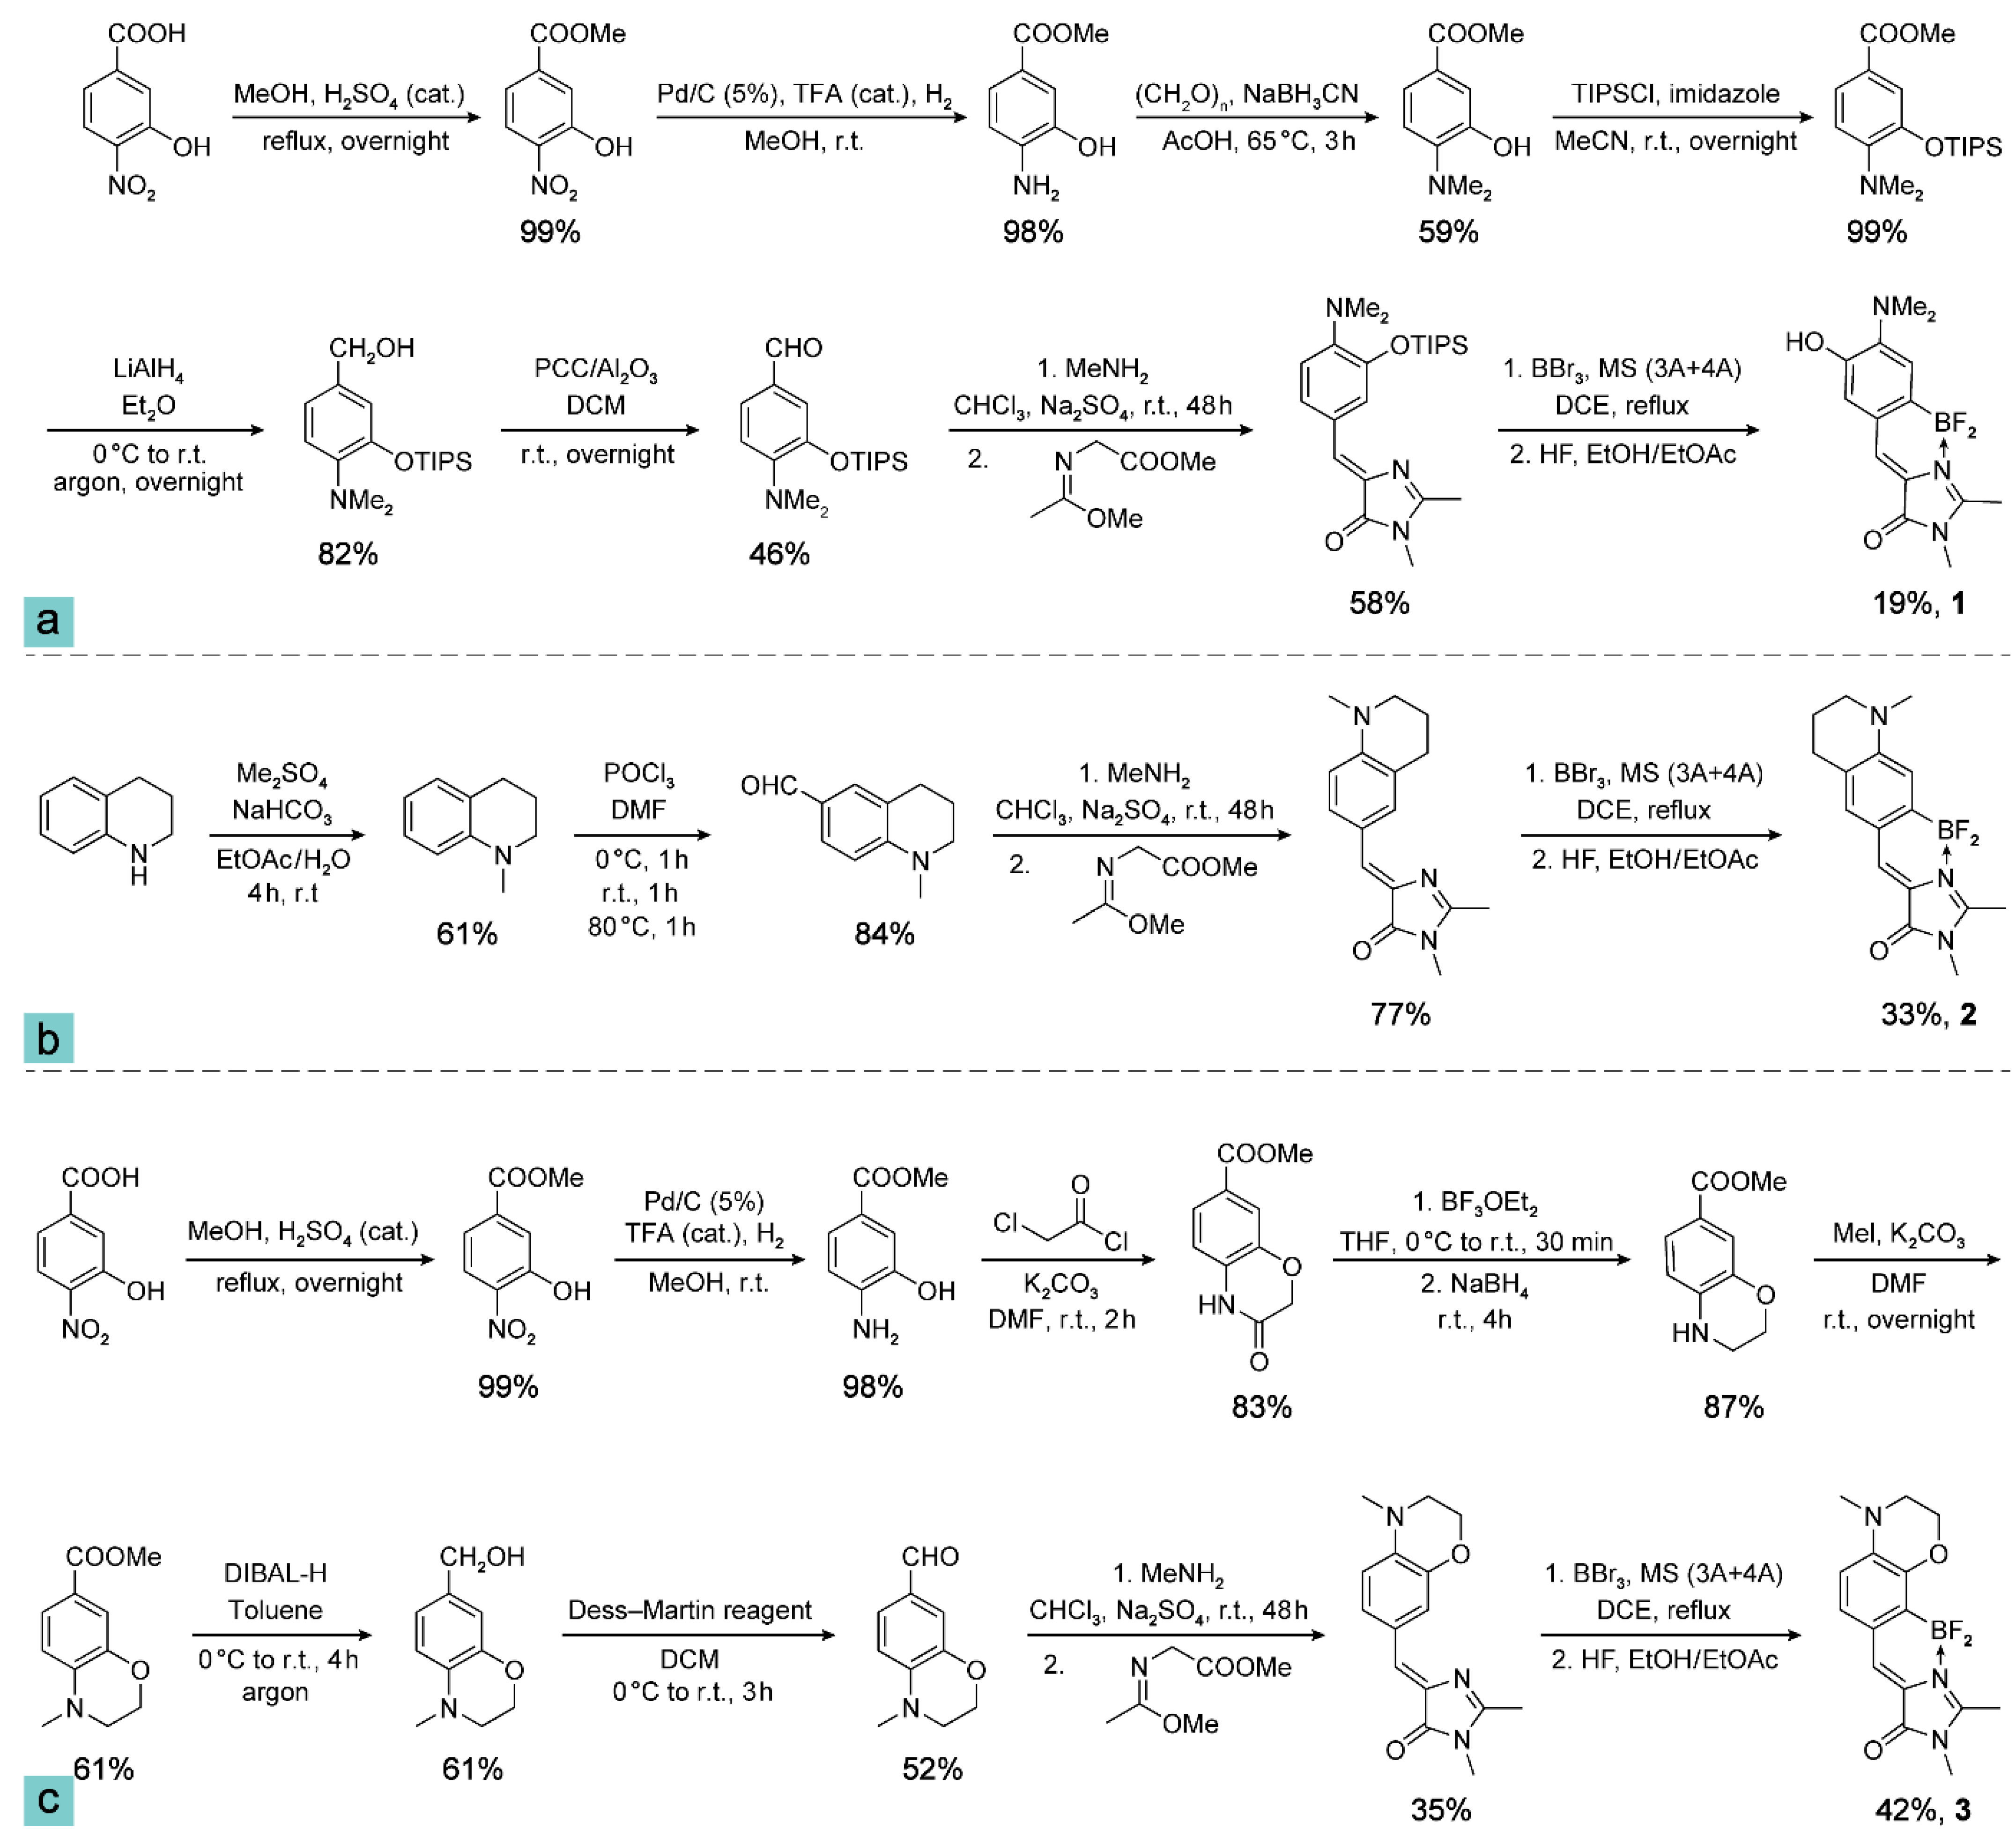
2.1. Synthesis of Compounds 1, 2, and 3

Commercially available reagents were used without additional purification for the ensuing synthesis. Merck Kieselgel 60 was used for column chromatography. Thin-layer chromatography (TLC) was performed on silica gel 60 F254 glass-backed plates (MERCK). Visualization was performed using ultraviolet (UV) light (wavelength at 254 or 312 nm) and staining with KMnO4.
NMR spectra were recorded on a 700 MHz Bruker Avance III NMR at 303 K, Avance III 800 MHz (with a 5-mm CPTXI cryoprobe), and Bruker Fourier 300. Chemical shifts were reported relative to solvent residual peaks of CDCl3 (7.27 ppm for 1H and 77.0 ppm for 13C) or DMSO-d6 (2.51 ppm for 1H and 39.5 ppm for 13C). Melting points (m.p.) were measured on a Stuart SMP 30 apparatus without correction. High-resolution mass spectra (HRMS) were recorded on a Bruker micrOTOF II instrument and AB Sciex TripleTOF 5600+ system using electrospray ionization (ESI). The measurements were conducted in a positive ion mode (interface capillary voltage of 5500 V on TripleTOF, and 4500 V on micrOTOF II) or in a negative ion mode (4500 V on TripleTOF, and 3200 V on micrOTOF II); mass range (m/z) from 50 to 3000; external or internal calibration was done with the ESI Tuning Mix by Agilent Technologies (Santa Clara, CA, USA). A syringe injection was used for solutions in acetonitrile, methanol, or water (flow rate 20 μL/min on TripleTOF; 3 mL/min on micrOTOF II). Nitrogen was applied as a dry gas; interface temperature was set at 180 °C. The synthesis procedures of compounds 1, 2, and 3 are illustrated in Scheme 1. The structural characterization data including NMR spectra for the pertinent intermediate compounds are provided in the Supplementary Materials.
Compound 1: (Z)-5-(2-(difluoroboryl)-4-(dimethylamino)-5-hydroxybenzylidene)-2,3-dimethyl-3,5-dihydro-4H-imidazol-4-one. Eluent—CHCl3/EtOH (v/v = 100/8). Dark solid, m.p. 227–229 °C. Yield 116 mg (19%). 1H NMR (700 MHz, DMSO-d6) δ = 2.70 (s, 3H), 2.88 (s, 6H), 3.21 (s, 3H), 6.88–6.96 (m, 2H), 7.46 (s, 1H), 9.32 ppm (s, 1H) (see Supplementary S1). 13C NMR (201 MHz, DMSO-d6) δ = 12.8, 26.4, 41.9, 118.1, 119.5, 123.9, 125.8, 129.4, 145.0, 147.6, 162.5, 163.8 ppm (see Supplementary S2). HRMS (ESI) m/z [M–H] calculated for C14H15BF2N3O2: 306.1231, found: 306.1233 (detection in negative ion mode).
Compound 2: (Z)-5-((7-(difluoroboryl)-1-methyl-1,2,3,4-tetrahydroquinolin-6-yl)methylene)-2,3-dimethyl-3,5-dihydro-4H-imidazol-4-one. Eluent—CHCl3/EtOH (v/v = 100/2). Dark red solid, m.p. 276–279 °C. Yield 212 mg (33%). 1H NMR (700 MHz, DMSO-d6) δ = 1.87 (p, J = 6.2 Hz, 2H), 2.64–2.69 (m, 5H), 3.02 (s, 3H), 3.20 (s, 3H), 3.37–3.41 (m, 2H), 6.75 (s, 1H), 7.12 (s, 1H), 7.40 ppm (s, 1H) (see Supplementary S3). 13C NMR (176 MHz, DMSO-d6) δ = 12.6, 21.2, 26.3, 26.8, 38.4, 50.8, 113.0, 121.1, 121.1, 121.4, 130.1, 132.6, 149.7, 160.8, 162.0 ppm (see Supplementary S4). HRMS (ESI) m/z [M+H]+ calculated for C16H19BF2N3O: 318.1584, found: 318.1586 (detection in positive ion mode).
Compound 3: (Z)-5-((8-(difluoroboryl)-4-methyl-3,4-dihydro-2H-benzo[b][1,4]oxazin-7-yl)methylene)-2,3-dimethyl-3,5-dihydro-4H-imidazol-4-one. Gradient elution using CHCl3/MeOH (v/v = 100/0 to 100/3). Dark red solid, m.p. >330 °C. Yield 268 mg (42%). 1H NMR (700 MHz, DMSO-d6) δ = 2.67 (s, 3H), 2.99 (s, 3H), 3.20 (s, 3H), 3.41–3.45 (m, 2H), 4.11–4.17 (m, 2H), 6.65 (d, J = 8.4 Hz, 1H), 7.15 (d, J = 8.3 Hz, 1H), 7.41 ppm (s, 1H) (see Supplementary S5). 13C NMR (201 MHz, DMSO-d6) δ = 12.4, 26.2, 37.9, 48.2, 62.8, 110.3, 121.8, 123.1 (t, J = 3.5 Hz), 129.1, 130.1, 140.8, 146.3, 161.0, 162.1 ppm (see Supplementary S6). HRMS (ESI) m/z [M+H]+ calculated for C15H17BF2N3O2: 320.1376, found: 320.1376 (detection in positive ion mode).

2.2. Steady-State Spectroscopy and Fluorescence Quantum Yield

The steady-state absorption and fluorescence spectra of the sample chromophores in solution at room temperature (22 °C) were measured in a 5-mm pathlength four-sided quartz cuvette with a Thermo Scientific Evolution 201 UV/Visible spectrophotometer (Waltham, MA, USA) and a Shimadzu RF-6000 spectrofluorophotometer (Pleasanton, CA, USA), respectively.
The FQYs of compounds 1, 2, and 3 in various solvents were measured according to the procedure described in the literature [27] with 4-(dicyanomethylene)-2-methyl-6-(4-dimethylaminostyryl)-4H-pyran (DCM dye) in ethanol (for compound 1) and rhodamine 6G (R6G) in ethanol (for compounds 2 and 3) as standards. The excitation wavelengths at 480 nm for compound 1 as well as 490 nm for compounds 2 and 3 were used. All measurements were performed with five concentration values (optical density or OD of 0.02, 0.04, 0.06, 0.08, and 0.1 per 5 mm). The new compound FQY was calculated by Equation (1):
ϕ x = ϕ s t × F x F s t × f s t f x × n x 2 n s t 2
where F is the area (integrated intensity) under the emission peak; f (calculated by 1 − 10A, while A is the unitless absorbance value at the excitation wavelength) is the absorption factor; n is the refractive index of the solvent used; ϕ is the FQY; the subscript x corresponds to the sample to be measured (e.g., compounds 13 in this work); and the subscript s t stands for the known standard (e.g., DCM dye, FQY = 0.435) [28].

2.3. Time-Resolved Electronic Spectroscopy and Global Analysis

The excited-state electronic spectra of compounds 1, 2, and 3 in various solvents were collected using a home-built femtosecond transient absorption (fs-TA) setup. The detailed description of the optical setup can be found in our previous work [26,29,30]. Excitation wavelengths of 490–505, 500–520, 500–510 nm were used for compound 1, 2, and 3 in various solvents (Figure S1), respectively, with the pump power in the range of 0.2–0.3 mW. The sample concentrations for fs-TA measurements were in the OD range of 0.1–0.5 per mm, and all spectral data were collected using a 1-mm-pathlength quartz cuvette (1-Q-1, Starna Cells, Inc., Atascadero, CA, USA).
Global analysis of the fs-TA spectra was performed using the open-access Glotaran program [31]. A sequential kinetic model was deemed sufficient [32,33] and used to retrieve the intrinsic rate constants underlying the chromophore excited-state dynamics in the nonequilibrium regime after actinic photoexcitation.

2.4. Computational Methods

Ground- and excited-state calculations were performed with density functional theory (DFT) and time-dependent (TD)-DFT using the commercial Gaussian 16 program [34]. The geometries of the ground singlet state (S0) and bright state/dark TICT of the first excited singlet state (S1) were optimized using DFT and TD-DFT methods, respectively, at the B3LYP/6-31G+(d,p) level. The specific dihedral-angle (defined in Figure 1a, see pertinent bonds highlighted in red to characterize the rotational angle between the amino substituent and main chromophore scaffold—a single bond torsion) scans in S0 and S1 were performed by DFT and TD-DFT, respectively, at the same theory level and with identical basis sets. All calculations were carried out with the implicit polarizable continuum model (default IEFPCM method in Gaussian software) to account for solvation effects.

3. Results and Discussion

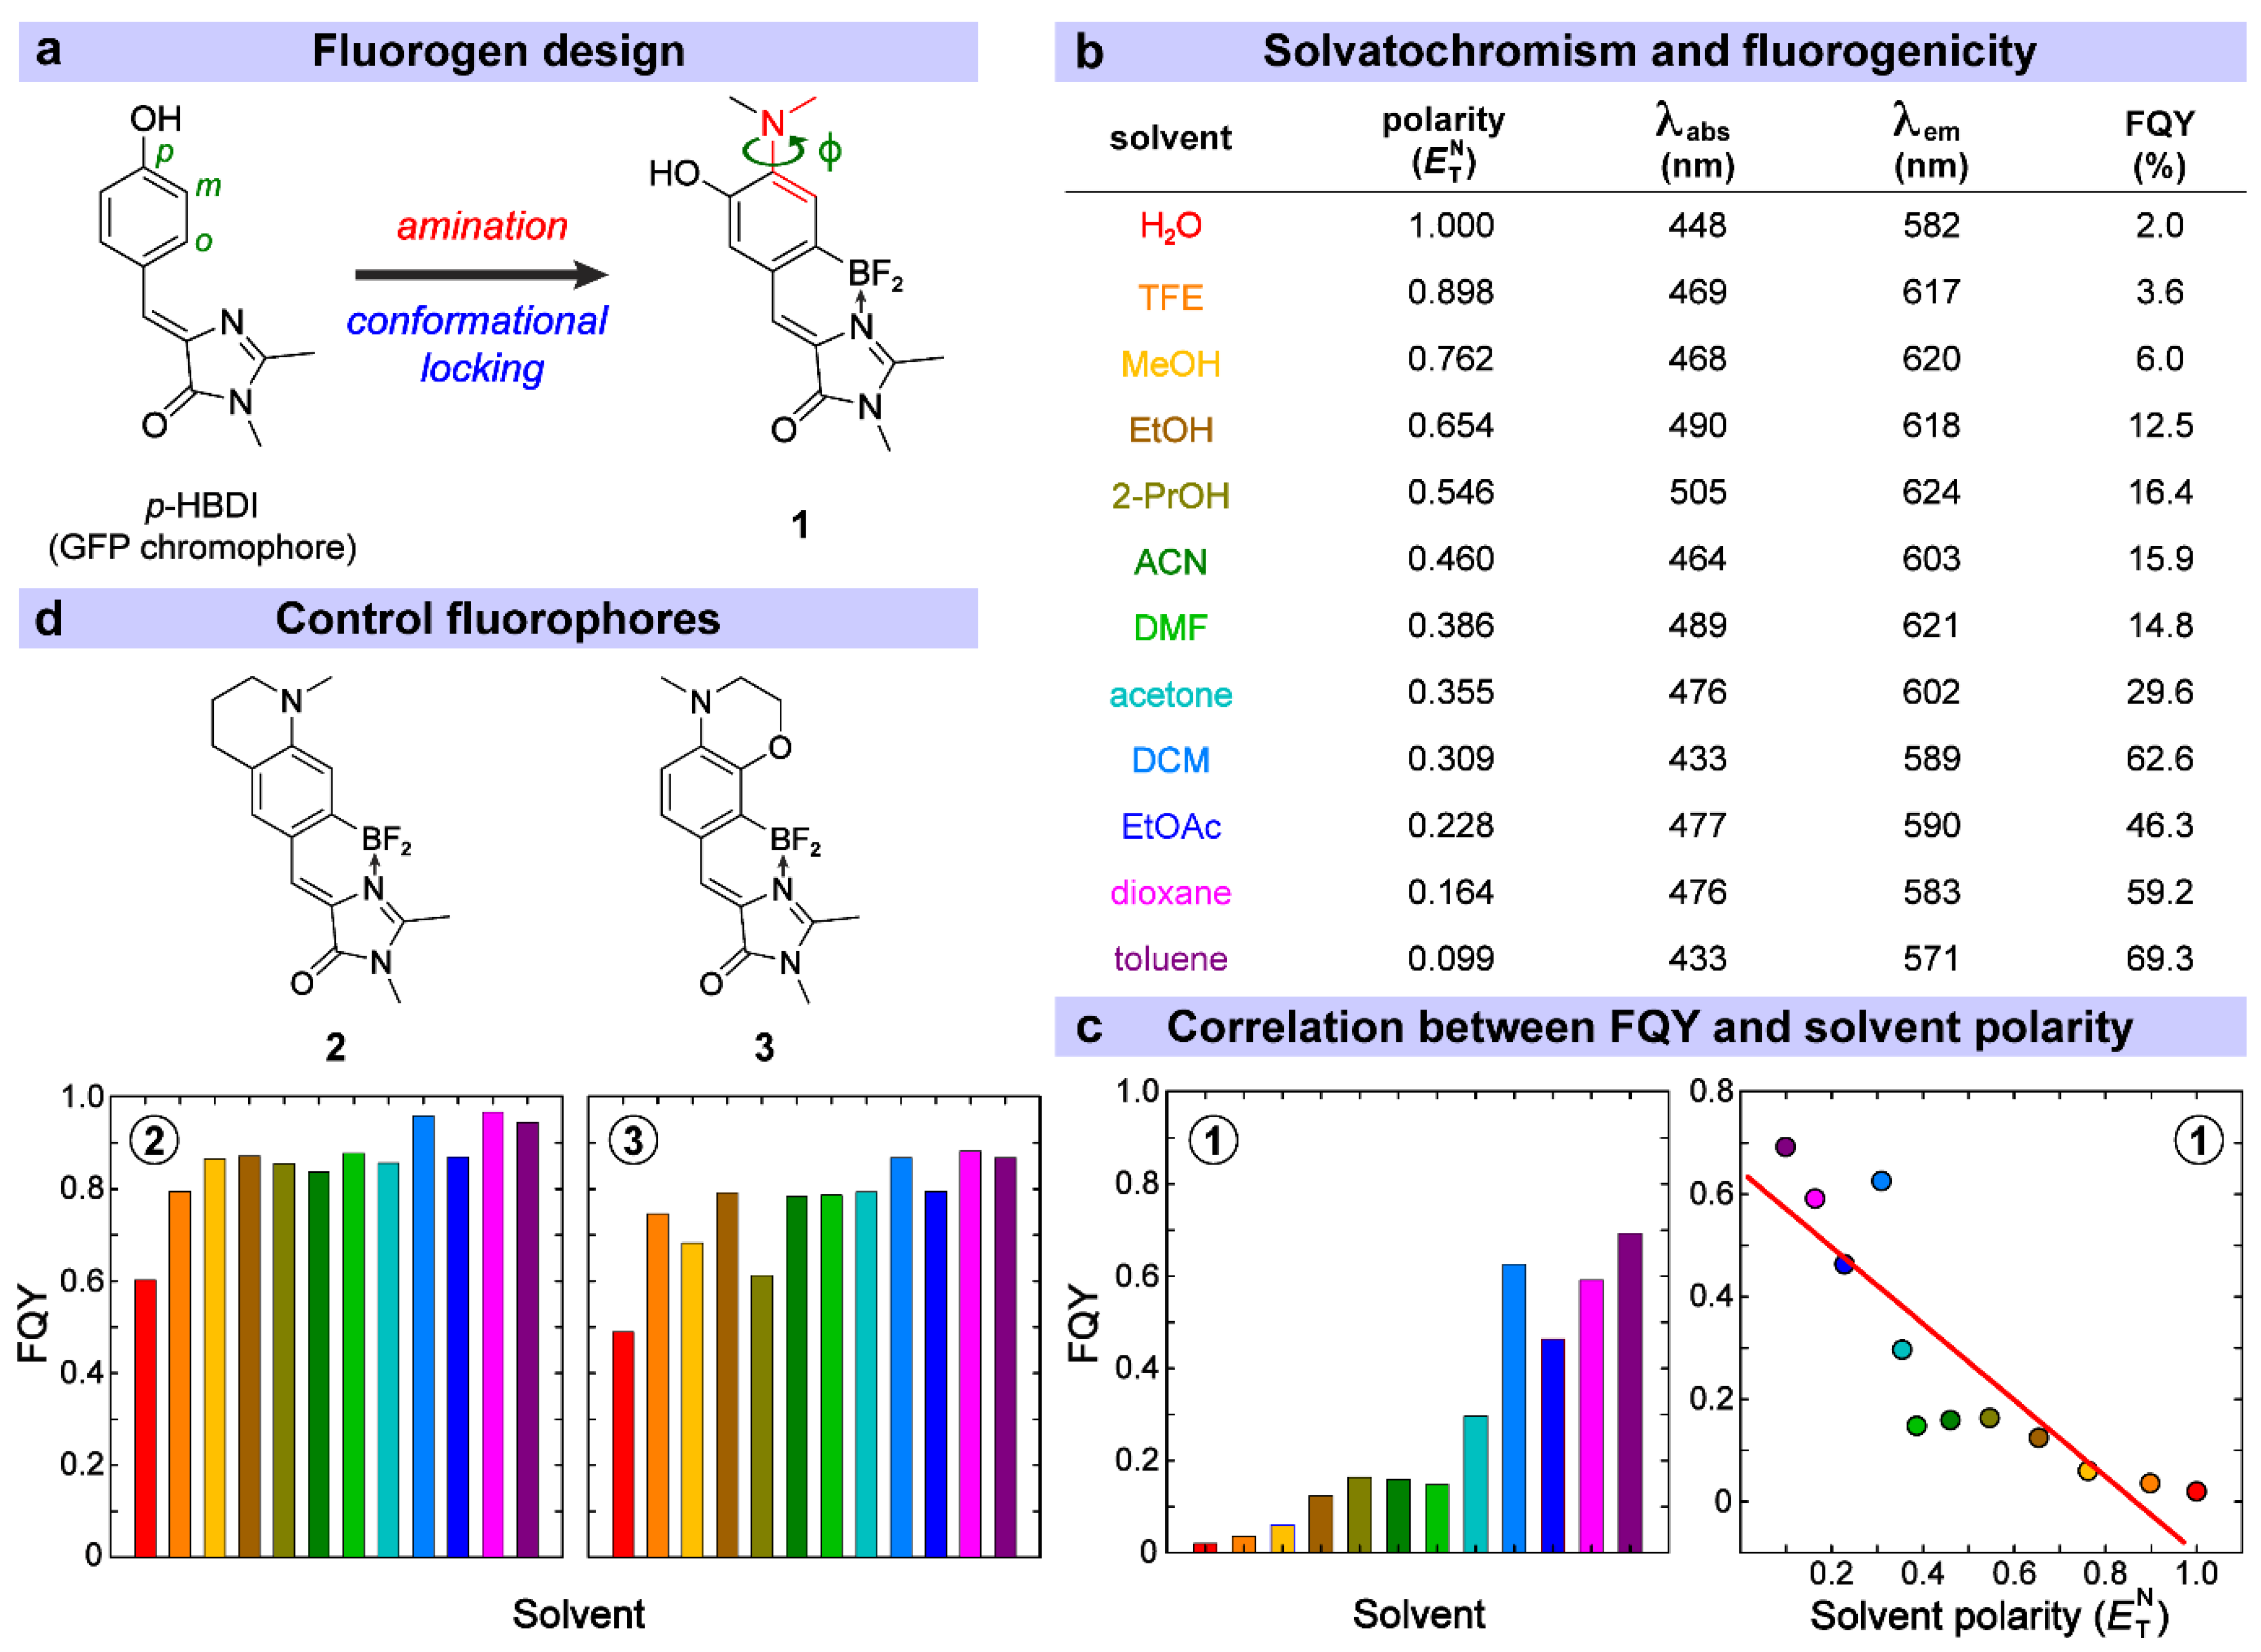
3.1. Rational Design and Photophysical Properties of the GFP-Derived Fluorogen

It is well-known that the GFP chromophore loses its characteristic bright fluorescence outside the protein matrix due to facile ring-twisting motions, which induce ultrafast nonradiative decay pathways [35,36], as exhibited by the synthetic chromophore p-HBDI (Figure 1a) in solution [37,38,39]. To avoid the interference or destruction of the proposed amino-group-enabled fluorogenicity by the highly favorable Z/E isomerization coordinate, a coordination-assisted borylation reaction was utilized to conformationally lock the HBDI backbone and hence suppress the two-ring twisting motions [24,25]. Previously locked GFP chromophore derivatives have exhibited high FQYs in solution [24,32]. A dimethylamino group (–NMe2) is then incorporated into the para site of the phenolic (P-) ring as the electron donor while the original para-hydroxy group (commonly found in GFP or HBDI motifs [40,41,42]) is moved to the meta site. This structure is in accordance with our previously proposed double-donor-one-acceptor structure, wherein the –NMe2 and –OH groups on the P-ring act as electron donors while the 2-position-substituent on the imidazolinone (I-) ring acts as an electron acceptor [43,44]. The associated notable excited-state intramolecular charge transfer (ICT) likely contributes to a large Stokes shift as well as red emission of the chromophore (Figure 1b).
The resultant compound 1 (Figure 1a) named p-NMe2-m-HBDI:BF2 demonstrates pronounced solvatochromism and marked fluorogenicity as a function of solvent polarity. From the most polar (water) to nonpolar (toluene) solvents investigated, we observed the increase in FQY from 2% to 69.3%, a 35-fold fluorescence enhancement (Figure 1b). Using the empirical polarity parameter E T (30) or its normalized value E T N [45], a general linear correlation between FQY and E T N can be observed (Figure 1c, red line). This solvent-dependent FQY change is corroborated by a previous report on a red-shifted (versus p-HBDI) fluorescent aminated derivative of a conformationally locked GFP chromophore (compound 2b in that work) without the meta-OH group [46], which shows a smaller increase in FQY from water (5%) to dioxane (78%) and bluer emission (e.g., ~564 nm in water, 552 nm in ACN, and 532 nm in dioxane) than compound 1 in this work. In addition, the opposite direction of the chromophore emission wavelength change from water to ACN for these two aminated compounds suggests the important role played by the meta-OH group on the P-ring, both spatially (steric hindrance with the adjacent para-NMe2 group) and electronically (double-donor strategy in effectively red-shifting the emission peak), for compound 1 to acquire the appealing properties (e.g., prominent fluorogenicity, high sensitivity of TICT formation rate to solvent polarity/H-bonding parameters) as dissected and discussed in detail below.
Notably, the electronic absorption and emission wavelengths of compound 1 were not in line with this single polarity parameter, indicating its inadequacy in fully describing the solute–solvent interactions. Instead, Kamlet–Taft solvent polarity parameters [47] are more robust in modeling and explaining solvatochromism (see Equation (2)) due to the separation of specific (H-bonding) and nonspecific (dipolar) solute–solvent interactions:
ν ˜ = ν ˜ 0 + a α + b β + p π *
where ν ˜ is the absorption or emission energy with a unit of 103 cm−1; α and β describe the solvent H-bond donating (acidity) and accepting (basicity) capability, respectively; and π * measures the dipolarity/polarizability of the solvent. This solvatochromic analysis shows that the emission wavelength for compound 1 is dominated by the solvent basicity or β (Table S1). This is likely due to the presence of an –OH group in the protonated chromophore (e.g., pH = 7.4 in aqueous buffer that is below the chromophore –OH/−O equilibrium pKa) acting as the H-bond donor, while all the observed emission band maxima can be attributed to a single excited state (S1). The same analysis for absorption is complicated by the complex spectral profile of the absorption band (with uncertainty of recording a peak value) and hence not reliably obtained (see Figure S1).
The polarity-dependent FQY of compound 1 can be attributed to the twisting of the –NMe2 group that forms a dark (nonfluorescent or weakly emissive) TICT state after the electronic excitation. This mechanism has been suggested for some amino-substituted fluorophores with similar fluorogenic properties such as 7-aminocoumarin and 4-aminonaphthalimide [11,15]. For example, a coumarin dye with an –NMe2 group showed a ~9-fold FQY increase from 50:50 ethanol/water mixture (0.11) to dioxane (0.94) [15], and an aminonaphthalimide dye with an –NMe2 group showed a ~76-fold FQY increase from MeOH (0.01) to dioxane (0.76) [13]. To substantiate this mechanism for compound 1, we synthesized two other similar fluorophores with a locked amino group, compounds 2 and 3, so that the aforementioned twisting is inhibited [46]. As a consequence, the fluorogenicity significantly diminishes while the observed FQY stays high and only varies slightly in different solvents (see Figure 1d and Table S2). The FQY ratios of the chromophore in toluene over water are ~1.6- and 1.8-folds for compounds 2 and 3, respectively, in contrast to 35-fold for compound 1 (Figure 1c). In comparison, a similar fluorophore to compound 2 by replacing the methyl group with a hydrogen atom on the aromatic amino group (nitrogen site) displayed essentially no solvent-dependent FQY change (e.g., ~63% in water, 67% in ACN, and 65% in dioxane) [46], indicating that the increased electron-donating capability of the rigid cycloalkylamino substituent with the methyl group (this work) contributes to the observed small fluorogenicity of compound 2 (a mainly electronic effect, see discussions below), although it primarily serves as a control sample for compound 1 with pronounced fluorogenicity (Figure 1). In addition, a previous report by introducing various substituents around the nitrogen site of conformationally locked GFP derivatives adopted multiple strategies (rigid analogues, cyclic substituents at the nitrogen site) in reducing TICT state formation and observed much less FQY variation than chromophores with free alkyls, and also proposed that the electronic effects of amino substituents exert a greater impact on the solvent-dependent FQY variation of chromophore than conformational factors [48].

3.2. Theoretical Calculations for Elucidation of the TICT State

To provide further insights into the TICT intermediate in compound 1, we performed DFT calculations to identify the presence and characteristics of such a TICT state. By scanning the twisting coordinate defined as the dihedral angle (ϕ) between one arm of the –NMe2 group and P-ring of the chromophore (see Figure 1a, relaxed coordinates for rest of the molecule), two local energy minima were found in all solvents investigated (see Figure 2, Figures S2 and S3). The one with a relatively flat –NMe2 geometry (ϕ ≈ 20°) is attributed to the bright fluorescent state (FS). The non-zero dihedral angle is due to steric hindrance from the adjacent –OH group to achieve a local minimum in the excited state. The other one with a perpendicular geometry (ϕ ≈ 90°) is readily assigned to a TICT state that lies lower in energy than FS, also featuring a much reduced energy gap with respect to its ground state counterpart (see Figure 2, two downward arrows) [9,49].
The assignments for FS and TICT states are supported by their dramatic difference in oscillator strength (OS). For example, the former state has a calculated OS of 0.8381 in water (Figure 2) while the latter state is zero, confirming its dark-state nature. This intrinsic difference between FS and TICT states persists for many other solvents being systematically calculated (Figures S4 and S5), which could be rationalized by the electron density distribution and overlap of molecular orbitals (MOs) during the vertical S1-to-S0 transition of the chromophore. For both FS and TICT states, the S0–S1 transition is solely contributed by HOMO–LUMO transition. At the largely flat geometry (FS), the HOMO–LUMO transition mainly has a ππ* character with slight charge transfer (CT) from the P-ring to I-ring (Figure S4) [38,39]. At the perpendicular geometry (TICT), it becomes an nπ* transition with significant CT from the –NMe2 group to the conjugated chromophore backbone (supporting a notable electronic effect, see Figure S5). The minimal orbital overlap between HOMO and LUMO for the TICT state accounts for its forbidden transition with the calculated OS being zero, in contrast to FS with a significant orbital overlap, and hence a large downward transition OS.
Meanwhile, the calculated dipole moment for the TICT state is 4.3–4.9 Debye, much larger than that of FS at 0.5–1.7 Debye (Table S3). This result is consistent with previous reports on TICT systems where FS is referred to more as a locally excited (LE) state with medium polarity [8,17]. The large dipole moment (and polarity) of the TICT state has also been suggested to explain its solvatochromic emission for dual-fluorescence chromophores [7,8,20].
Notably, the orientation of the –OH group has noticeable impacts on the calculated energy and even potential energy surface (PES) profile in some nonpolar solvents. The calculated energy path with –OH pointing toward –NMe2 yields consistently higher energy than that with –OH pointing away from –NMe2 in S1 (Figure S3). Therefore, the latter orientation with less steric hindrance is considered the preferred structure during the –NMe2 twisting process following photoexcitation. For the former orientation, TICT is absent for dioxane and toluene as the PES profile is drastically changed (see Figure S3, dark traces in the last two panels). The ground state (S0) scan always converges to the same PES with –OH pointing away from –NMe2 regardless of the initial set-up orientation, confirming the preferred –OH group orientation in solution at equilibrium.
Despite these useful insights, some discrepancy remains between the calculations and experimental observations. The fact that FQY of compound 1 decreases with increasing solvent polarity indicates that the light-induced twisting reaction barrier is reduced as solvent polarity increases (also see fs-TA analysis in Section 3.3). The calculated barrier in the excited state, however, shows an opposite trend (see Figure S2, see the S1 energy plot in red from water to toluene). This is likely due to intrinsic limitations of the current calculation method to accurately describe CT processes in the excited state [50,51] and/or the lack of consideration of specific solute–solvent H-bonding interactions as the implicit IEFPCM solvent model was used (Section 2.4) [9,33,49].

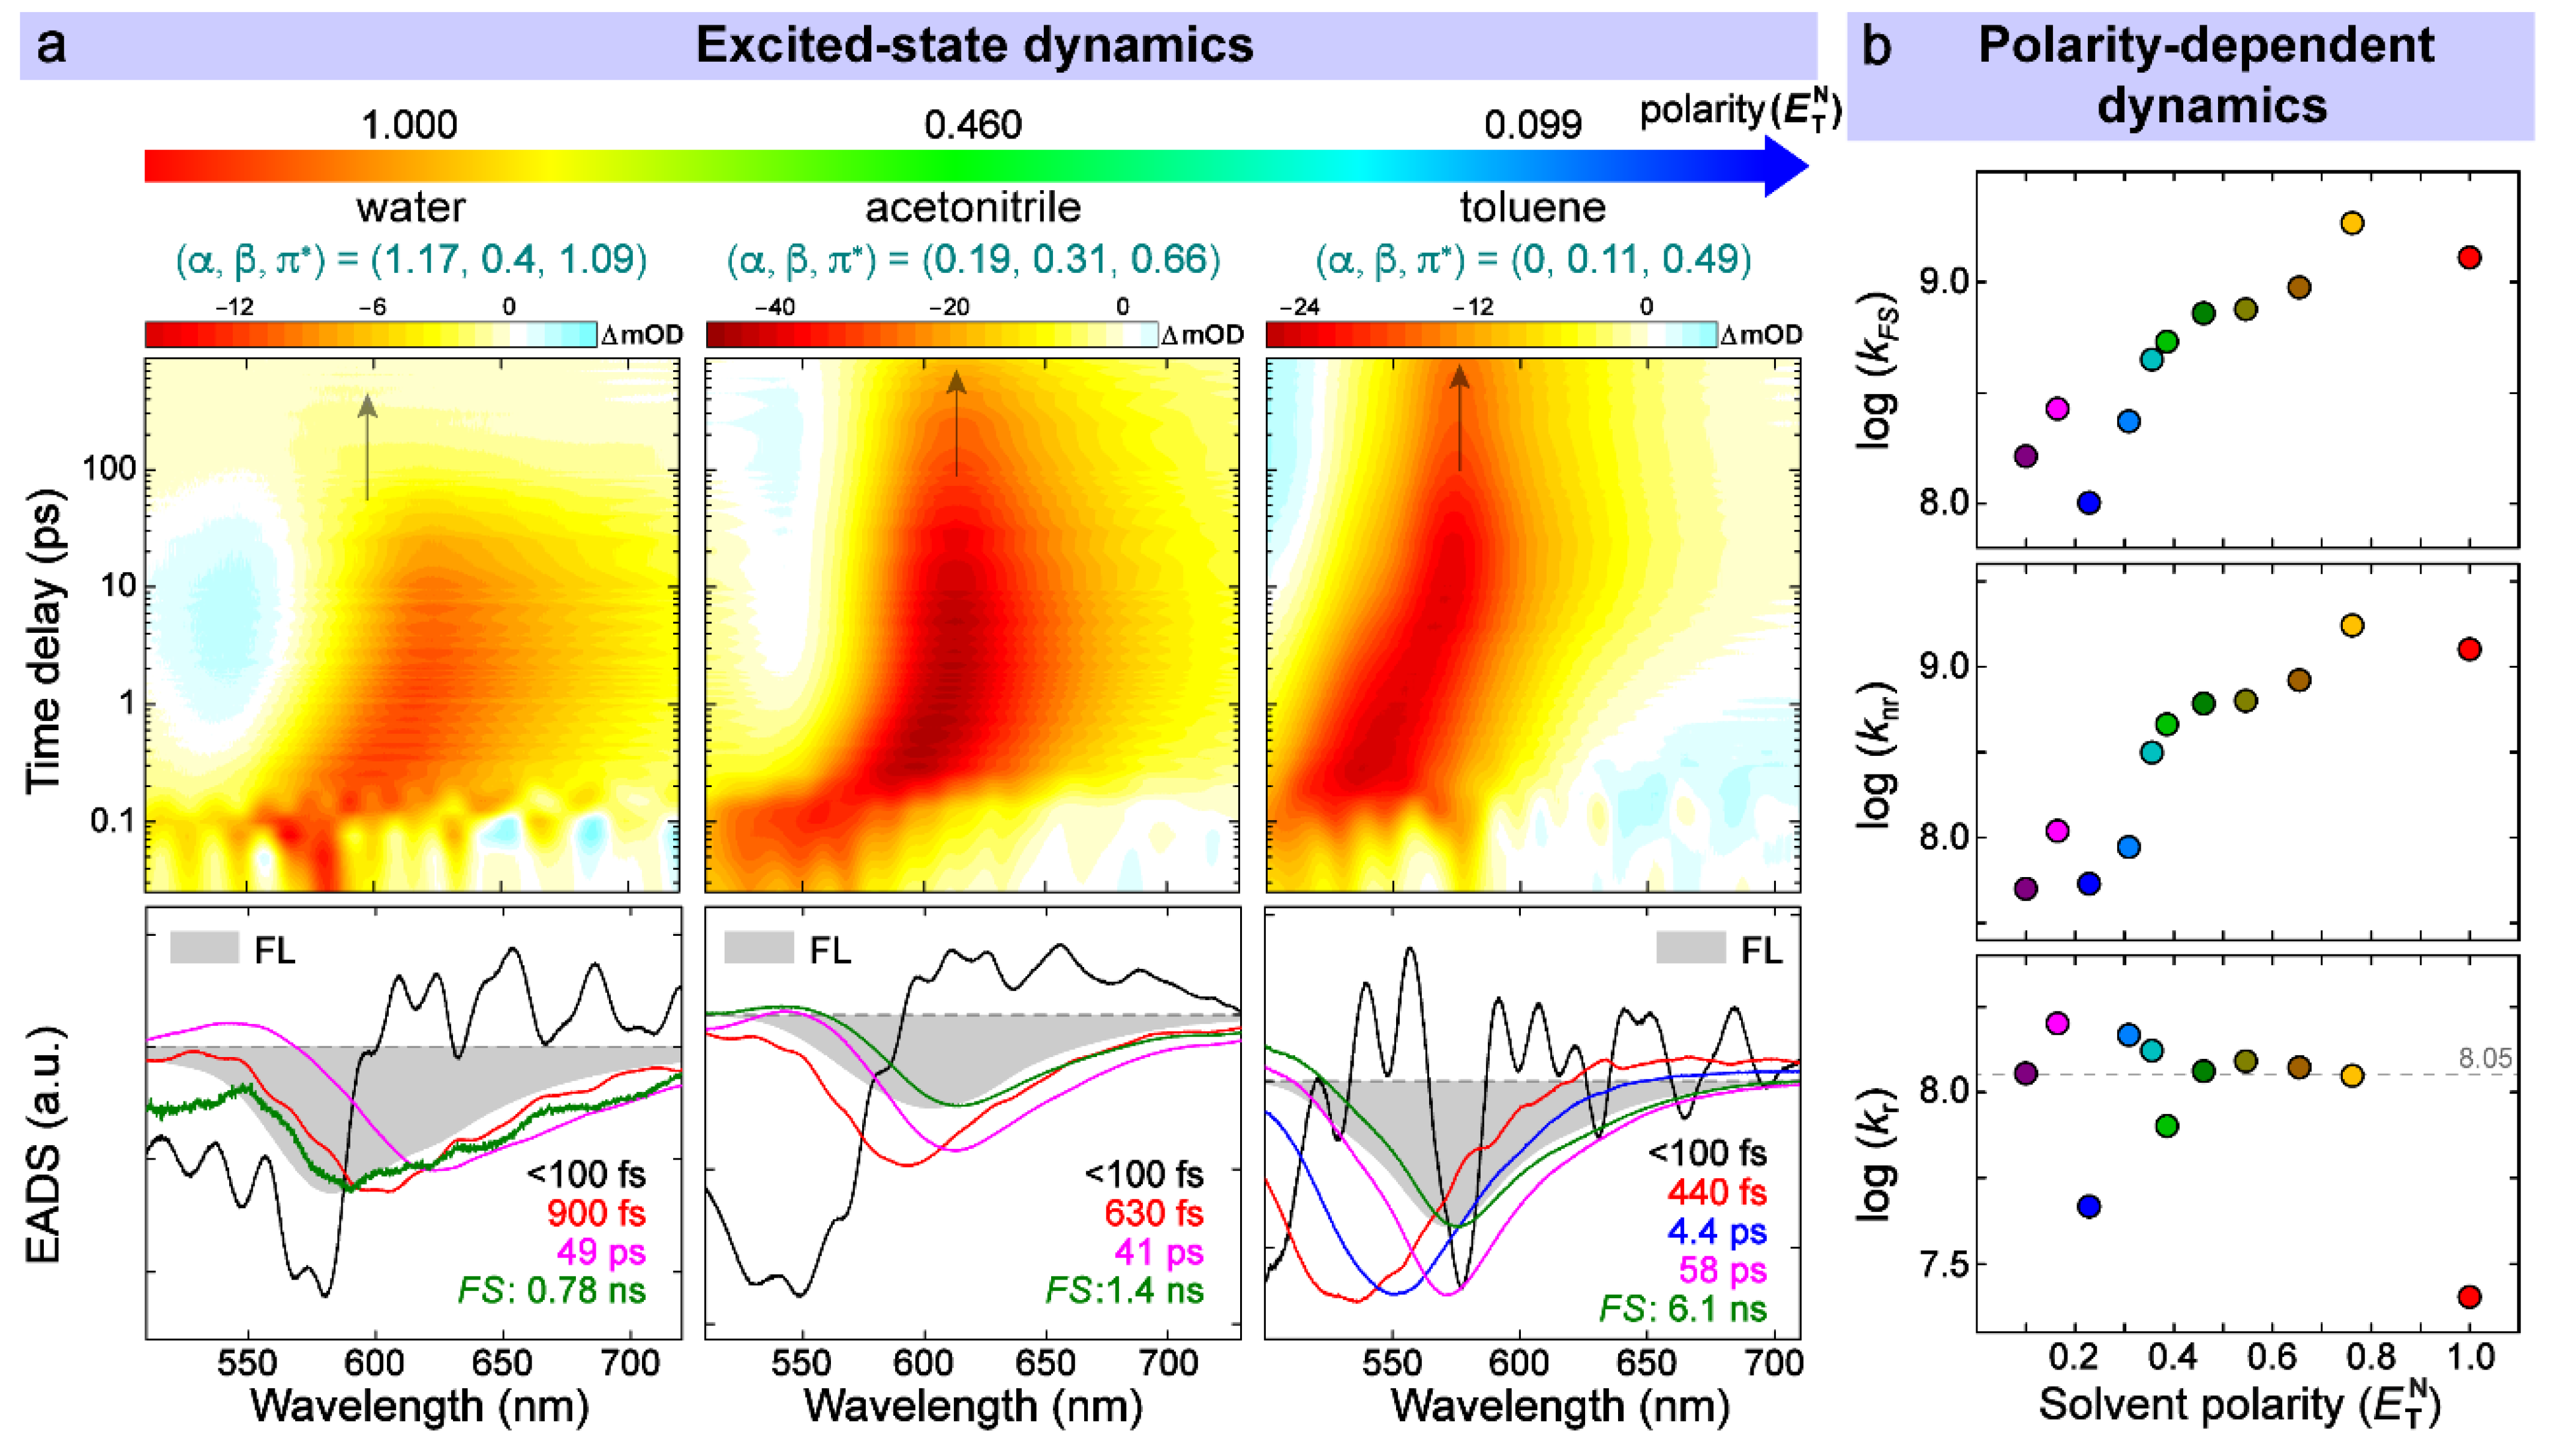
3.3. Time-Resolved Spectroscopic Characterization in the Electronic Domain

We employed fs-TA spectroscopy to probe the excited-state dynamics underlying the solvent-polarity-dependent FQY of compound 1. The fs-TA spectra in all solvents exhibited a dominant negative stimulated emission band that red-shifts in time (Figure 3a and Figure S6). This observed redshift from early time to tens of picoseconds (ps) is due to the ultrafast solvation process that stabilizes the chromophore electronic excited state (commonly S1), which has been extensively studied [25,52,53,54]. After solvation, the chromophore reaches its relaxed FS and decays thereafter on the hundreds-of-ps to nanosecond (ns) time scales via both radiative and nonradiative pathways.
To uncover the intrinsic rate constants, we performed global analysis [55] of the fs-TA spectra by simultaneously treating the transient spectral data in spectral and temporal dimensions. The resultant spectra termed as evolution-associated difference spectra (EADS) under a sequential kinetic scheme provide useful information on transient states/species with their intrinsic lifetimes on the excited-state PES. Four to five components were consistently required to achieve the best fit due to the difference in solvation processes among various solvents.
Taking water, for example (Figure 3a), black (<100 fs) and red (900 fs) EADS can be attributed to the multistep solvation process evinced by a continuous redshift in SE band maximum from black to red, and then to the next magenta EADS (Figure 3a, leftmost bottom panel). An additional component (blue EADS) is needed to fit the solvation process for some solvents (e.g., Figure 3a for compound 1 in toluene and Figure S7). The magenta EADS (49 ps) could be attributed to a rotational diffusion step of the photoexcited chromophore as corroborated by some previous reports [9,32,53,56]. It is likely because of the same polarization instead of polarizations at the magic angle (54.7°) for pump and probe pulses during the measurement. However, our main focus was to collect fs-TA spectra with high signal-to-noise ratio and perform a quantitative analysis using the retrieved fluorescence time constant (the longest time constant on the ns timescale, colored in green in Figure 3a and Figure S7 for compound 1) and the aforementioned FQY (see more details below), while this dimethylamino group twisting motion differed from the two-ring twisting motions of the chromophore backbone that lead to a more red-shifted stimulated emission band with much shorter lifetimes in solution [39,57,58]. The last green EADS was associated with the decay of FS with an apparent lifetime of 0.78 ns. This assignment was firmly supported by its high resemblance to steady-state fluorescence (the gray-shaded band overlaid in Figure 3a bottom panels) in peak wavelength [26].
Through systematic analysis of the newly synthesized compound 1 in 11 solvents (see detailed global analysis results of fs-TA spectra in Figure S7), a clear trend in the FS lifetime (green EADS) was observed as the solvent polarity was altered (Table 1). It is largely consistent with the ordering in their FQYs and indicates that the contribution of nonradiative pathways increases primarily due to the formation of a TICT state. The following equations (Equations (3)–(5)) were used to calculate all the characteristic decay time constants from the experimental observables:
1 τ F S = k F S = k n r + k r
k n r = k F S   ·   1 ϕ
k r = k F S · ϕ
where τ F S is the apparent FS lifetime obtained directly from green EADS in global analysis; k F S , k n r , and k r are rate constants of FS, nonradiative, and intrinsic radiative decay pathways, respectively (all with the unit of s−1); and ϕ is the FQY of the chromophore (see Figure 1b and Table S2). Interestingly, such systematic use and mathematical treatment of fluorescence lifetimes is reminiscent of the previously reported phasor approach to fluorescence lifetime imaging analysis with a readily available software [59,60], although the pertinent focus on microscopy significantly differs from our current work on the spectroscopy-aided multivariable analysis in retrieving the fundamental effects of various molecular parameters in governing the observed FQY (see Section 3.4 below). In other words, we aimed to dissect the fluorogenicity in real time (along the reaction coordinate on ultrafast timescales like the schematic in Section 3.4 below after the multivariable analysis), but there is no spatial resolution such as the focus of the aforementioned phasor approach.
Although the specific TICT features were not readily observed in fs-TA spectra likely because of its dark-state nature (i.e., calculated OS is zero), the related rate constants can be inferred from the apparent FS lifetime when the FS → TICT transition dominates the nonradiative energy relaxation pathway (see below). The logarithmic plots of rate constants against the solvent polarity show that log k F S and log k n r are almost linearly correlated with E T N (Figure 3b, top and middle panels) while log k r largely stays constant except for water and EtOAc (Figure 3b, bottom panel; and Table 1, rightmost column). The latter part serves as an intrinsic validation since the radiative transition (fluorescence) lifetime of these GFP-derived chromophores is typically on the few ns timescale [9,26,33,61], in accordance with the current average value of ~8.9 ns (see the dashed line in bottom panel of Figure 3b). In particular, the clear correlation between log k n r and E T N , reminiscent of the Arrhenius equation, suggests that the barrier crossing from FS to TICT is significant with an activation energy strongly dependent on solvent polarity. For further corroboration, compounds 2 and 3 exhibit high FQYs (close to unity) and a lack of the aforementioned strong correlation due to an effective inhibition of twisting motions of the electron donor (i.e., the cycloalkylamino substituent on the P-ring in Figure 1d, also see Figures S8–S12). It was also noted for these two control compounds that weak correlations (e.g., much smaller slopes than that in compound 1, see Figure S12 middle panels and Table S2) were present between log k n r and E T N , which implies that some other nonradiative channels via electronic means could occur in the presence of molecular structural rigidities. In aggregate, these results suggest that the TICT pathway is the main cause of fluorogenicity for compound 1 and higher solvent polarity favors the formation of a TICT state (large k n r in Table 1) with a reduced excited-state twisting energy barrier.

3.4. Multivariable Analysis of Chromophore-Solvent Interactions Regarding TICT

Though the single-parameter ( E T N ) analysis for compound 1 showed a strong correlation between log k n r , mainly determined by the TICT-state formation, and E T N , it remains inadequate to demonstrate a rigorous linear relationship as seen from the noticeably curved trend of log k n r in Figure 3b (middle panel). This is because the empirical polarity scale ( E T N ) does not discriminate the nonspecific (dipolar) and specific (H-bonding) solute–solvent interactions, which could exert different effects on the twisting barrier. Meanwhile, solvent viscosity has been overlooked throughout the correlation analysis and is also an important influencer for many twisting molecular systems.
To take these factors into consideration for a more inclusive and comprehensive investigation, we have recently developed a multivariable linear analysis approach to identify primary contributing interactions for the observed fluorogenicity [26], though the GFP-derived chromophore in that work was unlocked (i.e., no –BF2 group) and the fluorogenicity is readily achieved inside a fluorogen-activating protein (e.g., inhibiting two-ring twisting motions of the chromophore). In brief, the isomerization (e.g., a rotation around a specific dihedral angle for the GFP chromophore derivatives) reaction rate can typically be described by the Kramer’s expression (Equation (6)) [62] that has the same form as the Arrhenius equation,
k i s o = F η   ·   e x p E a k B T
where E a represents the isomerization energy barrier for the chromophore in a specific solvent of interest; k B is the Boltzmann constant; and T is temperature for experimental data collection. The viscosity-dependent prefactor F η can be described by an empirical expression (Equation (7)) that has satisfactorily modeled spectral data for many molecular systems [61,63,64],
F η = A · η δ
where A is the proportionality constant and δ reflects the dependence on η ( 0 < δ < 1 , while δ = 1 at the high friction limit). Similar to the Kamlet–Taft analysis, E a can be linearly modeled by the H-bonding ( α and β ) and dipolar ( π * ) solvent parameters, reflecting the potential energy difference between the FS and transition state. The k i s o can finally be described by all four parameters in a linear manner (Equation (8)) using the logarithm of k i s o to base 10,
log k i s o = a α + b β + p π * δ log η + log k 0
where k 0 can be understood as the original rate constant in the absence of chromophore–solvent interactions.
With this sophisticated separation of electrostatic ( α , β , π * ) and steric ( η ) effects, one can quantitatively figure out dominant factors for the fluorogenicity through a rigorous linear regression analysis directly using Equation (8), which should be generalizable for chromophores with an isomerization coordinate in solution. We applied this numerical analysis to compound 1 in 11 solvents that yielded log k i s o = 0.68 α + 1.27 β + 7.05 , which was corroborated by systematic spectral data (e.g., fluorescence lifetimes from fs-TA spectra in Figure S7, and FQYs from steady–state emission spectra/data in Figure S1/Table S2 for compound 1) in a sufficient number of solvents for a robust linear regression. This finding indicates that H-bond donating ( α ) and accepting ( β ) capabilities of the solvent govern k n r . In particular, positive prefactor coefficients mean that the higher H-bonding capabilities of the solvent led to a faster TICT state formation ( k i s o k n r , see Equation (4)) and reduced FQY. Meanwhile, the dipolar interaction ( π * ) from the solvent was much less important for the fluorogenicity due to the associated statistical insignificance (i.e., p-value is large, Table S4). This result explains the slight deviation from linearity between log k n r and E T N as dipolarity of the solvent does not contribute as much as its H-bonding capabilities, both of which constitute the dimensionless normalized E T N value [45]. Similar to the interpretation of the Kamlet–Taft analysis, we can infer that strengthening of H-bonding interactions between the chromophore and solvent stabilizes the transition state more than FS and hence reduces the excited-state twisting barrier height (Figure 4) for a more effective formation of the TICT state and decrease in the observed chromophore FQY. In addition, the creation of a larger dipole moment in TICT state (see Table S3) is consistent with better stabilization by ultrafast solvation (e.g., 900 fs in water, 7.7 ps in MeOH, and 16.8 ps in EtOH, see Figure S7 for compound 1) for a nonstationary dialkylamino group in the excited state, and the pertinent electronic interaction map over the solute–solvent complex (likely including H-bonding to both –OH and –NMe2 groups) governs the ultrafast charge separation and twisting-assisted relaxation of the photoexcited solute molecules. Such effects exerted by multiple H-bonds for GFP derivatives have been explored for anti-solvatochromic emission in an aqueous environment with rational design and tuning of the two-ring substituents and electronic structure (mainly via extending the I-ring with an aminobenzene moiety), although the light-induced P-ring-twisting motion therein [6] differed from the dominant TICT state formation via a dimethylamino group on the P-ring of a conformationally locked GFP chromophore in this work (see Figure 1a and Figure 4).
Notably, the steric effect ( η ) plays a negligible role compared to electrostatics ( α , β , π * , or E T N ). The same conclusion holds with a similar but coarse fitting of the rate constant with E T N and η ,
log k i s o = e E T N δ log η + log k 0
The least-squares fitting with Equation (9) yielded log k i s o = 1.84 E T N + 7.63 without any significant dependence on solvent viscosity (Table S4), which is in accordance with the rotatory decay barrier for ICT → TICT deactivation of an amino-substituted coumarin in room-temperature fluid media [15]. We note that highly viscous solvents like glycerol could expand the solvent space for us to further investigate the steric effect using Equation (8) or Equation (9), however, three hydroxy groups per glycerol molecule could modify the H-bonding interactions to the chromophore and complicate the ensuing multivariable analysis. The insignificant effect from sterics for compound 1 is in contrast to many molecules with facile twisting coordinates. For example, a fluorescent marker for detection of amyloid fibrils in Alzheimer’s disease, thioflavin-T (ThT), exhibits a strong linear correlation between ϕ / 1 ϕ (i.e., k r / k n r ) and η [65]. The GFP chromophore in solution also showed some viscosity-dependent dynamics in the excited state due to characteristic ring-twisting motions [38,61]. This interesting difference may arise from the small size of the –NMe2 group in compound 1 (conjugated two-ring locked by BF2) that could hardly result in significant intermolecular frictions (via conformational change) with the surrounding solvent molecules, however, the polarity-induced reaction energy barrier change (via more electronic effects for charge stabilization) [39,66] in the electronic excited state (see Figure 4) dominates the functional group twisting rate, as shown in Equation (6). The relative position of the –NMe2 group with respect to the adjacent –OH group on the P-ring of the chromophore also contributes to the intricate electronic map over the conjugated scaffold (see Figures S4 and S5). These spectroscopic and mechanistic insights could facilitate future engineering of this environment–polarity sensor with higher fluorogenicity by further modification of the H-bonding network around this compact and locked GFP-derived chromophore.

4. Conclusions

In this work, we reported a novel GFP chromophore-derived fluorogenic dye (compound 1) that adopted dimethylamine (–NMe2) as an electron donor and exhibited a dramatic dependence of FQY on solvent polarity, making this small organic molecule (with current and engineerable properties: non-toxic, cell-permeable, robust fluorescence, photostable, on-demand labeling) a potential polarity sensor for in vitro or in vivo applications [2,23,67]. Quantum calculations suggested the favorable formation of a dark TICT state from the near-planar FS, caused by facile rotation of the –NMe2 group in the electronic excited state. The fluorogenicity loss of two other control compounds with the amino group locked (compounds 2 and 3) indicates that TICT is the main cause of the fluorogenicity for compound 1. For a mechanistic investigation, we employed fs-TA spectroscopy and global analysis to systematically retrieve the nonradiative rate constant being dominated by a light-induced FS → TICT reaction in 11 different solvents, covering a broad range in solvent parameters that include polarity. The excited-state decay rate constant demonstrates a strong correlation with solvent polarity by the E T N scale. With a more sophisticated multivariable regression approach using the finer Kamlet–Taft solvatochromic parameters, we found that solvent H-bonding (donating and accepting) capabilities govern the barrier crossing rate of the FS → TICT reaction while solvent dipolarity and viscosity play insignificant roles. These deep mechanistic insights from multivariable analysis provide fundamental knowledge about the fluorescence modulation by amino groups, which can enable future precise and targeted design of more fluorophores with controllable photophysical properties for more versatile and advanced sensing and imaging applications.

Supplementary Materials

The following materials are available online at https://www.mdpi.com/article/10.3390/chemosensors9080234/s1, Figure S1: Steady-state absorption and emission spectra of compounds 1, 2, and 3 in various solvents at room temperature, Figure S2: Calculated S0 and S1 potential energy surfaces and S1 → S0 transition oscillator strength along the dimethylamine twisting coordinate ϕ for compound 1 in various solvents, Figure S3: Calculated potential energy surfaces with different –OH group orientations for compound 1 in various solvents, Figure S4: HOMO and LUMO electron density distributions for FS of compound 1, Figure S5: HOMO and LUMO electron density distributions for TICT state of compound 1, Figure S6: Contour plots of fs-TA spectra for compound 1 in 11 different solvents, Figure S7: Global analysis of fs-TA spectra for compound 1 in 11 different solvents, Figure S8: Contour plots of fs-TA spectra for compound 2 in 12 different solvents, Figure S9: Global analysis of fs-TA spectra for compound 2 in 12 different solvents, Figure S10: Contour plots of fs-TA spectra for compound 3 in 12 different solvents, Figure S11: Global analysis of fs-TA spectra for compound 3 in 12 different solvents, Figure S12: Relationships between decay rate constants and the solvent polarity parameter E T N for compounds 2 and 3, Table S1: Kamlet–Taft analysis for absorption and emission of compounds 1, 2, and 3, Table S2: Photophysical properties of compounds 1, 2, and 3 in various solvents, Table S3: Calculated optical and structural properties for compound 1 in various solvents, Table S4: Multivariable regression of nonradiative decay rate constant for compound 1, Supplementary S1–S26: Supplementary NMR spectra of compounds 1, 2, 3, and key intermediate compounds during the synthesis of novel compounds in Scheme 1.

Author Contributions

Conceptualization, C.C. and C.F.; Methodology, C.C., S.A.B. and A.I.S.; Software, C.C.; Validation, C.C., S.A.B., A.I.S., M.S.B. and C.F.; Formal analysis, C.C.; Investigation, C.C., S.A.B. and A.I.S.; Resources, M.S.B. and C.F.; Data curation, C.C. and C.F.; Writing—original draft preparation, C.C.; Writing—review and editing, M.S.B. and C.F.; Visualization, C.C. and C.F.; Supervision, C.F.; Project administration, C.F.; Funding acquisition, M.S.B. and C.F. All authors have read and agreed to the published version of the manuscript.

Funding

This research was funded by the U.S. NSF grant CHE-2003550 (to C.F.) and the Russian Science Foundation grant no. 18-73-10105 (to M.S.B.).

Institutional Review Board Statement

Not applicable.

Informed Consent Statement

Not applicable.

Data Availability Statement

The data presented in this study are available on request from the corresponding author. The datasets with analysis and discussions supporting this article have been incorporated and presented as part of the comprehensive Supplementary Materials.

Acknowledgments

We appreciate the Wei Family Private Foundation Scholarship (2014–2020) at Oregon State University to C.C. We thank Longteng Tang for his helpful discussions.

Conflicts of Interest

The authors declare no conflict of interest.

References

  1. Klymchenko, A.S. Solvatochromic and fluorogenic dyes as environment-sensitive probes: Design and biological applications. Acc. Chem. Res. 2017, 50, 366–375. [Google Scholar] [CrossRef] [PubMed] [Green Version]
  2. Plamont, M.-A.; Billon-Denis, E.; Maurin, S.; Gauron, C.; Pimenta, F.M.; Specht, C.G.; Shi, J.; Quérard, J.; Pan, B.; Rossignol, J.; et al. Small fluorescence-activating and absorption-shifting tag for tunable protein imaging in vivo. Proc. Natl. Acad. Sci. USA 2016, 113, 497–502. [Google Scholar] [CrossRef] [PubMed] [Green Version]
  3. Povarova, N.V.; Zaitseva, S.O.; Baleeva, N.S.; Smirnov, A.Y.; Myasnyanko, I.N.; Zagudaylova, M.B.; Bozhanova, N.G.; Gorbachev, D.A.; Malyshevskaya, K.K.; Gavrikov, A.S.; et al. Red-shifted substrates for fast fluorogen-activating protein based on the GFP-like chromophores. Chem. Eur. J. 2019, 25, 9592–9596. [Google Scholar] [CrossRef] [PubMed]
  4. Carter, K.P.; Young, A.M.; Palmer, A.E. Fluorescent sensors for measuring metal ions in living systems. Chem. Rev. 2014, 114, 4564–4601. [Google Scholar] [CrossRef]
  5. Oscar, B.G.; Liu, W.; Zhao, Y.; Tang, L.; Wang, Y.; Campbell, R.E.; Fang, C. Excited-state structural dynamics of a dual-emission calmodulin-green fluorescent protein sensor for calcium ion imaging. Proc. Natl. Acad. Sci. USA 2014, 111, 10191–10196. [Google Scholar] [CrossRef] [Green Version]
  6. Ren, T.-B.; Xu, W.; Zhang, Q.-L.; Zhang, X.-X.; Wen, S.-Y.; Yi, H.-B.; Yuan, L.; Zhang, X.-B. Enhancing the anti-solvatochromic two-photon fluorescence for cirrhosis imaging by forming a hydrogen-bond network. Angew. Chem. Int. Ed. 2018, 57, 7473–7477. [Google Scholar] [CrossRef]
  7. Sung, R.; Sung, K. Insights into the unusual dual fluorescence of the ortho-amino analogue of green fluorescent protein chromophore. J. Lumin. 2018, 202, 163–167. [Google Scholar] [CrossRef]
  8. Grabowski, Z.R.; Rotkiewicz, K.; Rettig, W. Structural changes accompanying intramolecular electron transfer:  Focus on twisted intramolecular charge-transfer states and structures. Chem. Rev. 2003, 103, 3899–4032. [Google Scholar] [CrossRef]
  9. Kumpulainen, T.; Lang, B.; Rosspeintner, A.; Vauthey, E. Ultrafast elementary photochemical processes of organic molecules in liquid solution. Chem. Rev. 2017, 117, 10826–10939. [Google Scholar] [CrossRef]
  10. Grimm, J.B.; English, B.P.; Chen, J.; Slaughter, J.P.; Zhang, Z.; Revyakin, A.; Patel, R.; Macklin, J.J.; Normanno, D.; Singer, R.H.; et al. A general method to improve fluorophores for live-cell and single-molecule microscopy. Nat. Methods 2015, 12, 244–250. [Google Scholar] [CrossRef]
  11. Liu, X.; Qiao, Q.; Tian, W.; Liu, W.; Chen, J.; Lang, M.J.; Xu, Z. Aziridinyl fluorophores demonstrate bright fluorescence and superior photostability by effectively inhibiting twisted intramolecular charge transfer. J. Am. Chem. Soc. 2016, 138, 6960–6963. [Google Scholar] [CrossRef]
  12. Jones, G., II; Jackson, W.R.; Halpern, A.M. Medium effects on fluorescence quantum yields and lifetimes for coumarin laser dyes. Chem. Phys. Lett. 1980, 72, 391–395. [Google Scholar] [CrossRef]
  13. Saha, S.; Samanta, A. Influence of the structure of the amino group and polarity of the medium on the photophysical behavior of 4-amino-1,8-naphthalimide derivatives. J. Phys. Chem. A 2002, 106, 4763–4771. [Google Scholar] [CrossRef]
  14. Koppal, V.V.; Melavanki, R.M.; Kusanur, R.A.; Bhavya, P.; Patil, N.R. A role of solvent polarity on bimolecular quenching reactions of 3-acetyl-7-(diethylamino)-2h-chromen-2-one in binary solvent mixtures. J. Mol. Liq. 2018, 260, 221–228. [Google Scholar] [CrossRef]
  15. Jones, G.; Jackson, W.R.; Choi, C.Y.; Bergmark, W.R. Solvent effects on emission yield and lifetime for coumarin laser dyes. Requirements for a rotatory decay mechanism. J. Phys. Chem. 1985, 89, 294–300. [Google Scholar] [CrossRef]
  16. Pedone, A. Role of solvent on charge transfer in 7-aminocoumarin dyes: New hints from TD-CAM-B3LYP and state specific PCM calculations. J. Chem. Theory Comput. 2013, 9, 4087–4096. [Google Scholar] [CrossRef]
  17. Rotkiewicz, K.; Rubaszewska, W. Intramolecular charge transfer state and unusual fluorescence from an upper excited singlet of a nonplanar derivative of p-cyano-N,N-dimethylaniline. J. Lumin. 1982, 27, 221–230. [Google Scholar] [CrossRef]
  18. Rettig, W.; Gleiter, R. Dependence of intramolecular rotation in p-cyano-N,N-dialkylanilines on the twist angle. A fluorescence, UV absorption, and photoelectron spectroscopic study. J. Phys. Chem. 1985, 89, 4676–4680. [Google Scholar] [CrossRef]
  19. Rappoport, D.; Furche, F. Photoinduced intramolecular charge transfer in 4-(dimethyl)aminobenzonitrile—A theoretical perspective. J. Am. Chem. Soc. 2004, 126, 1277–1284. [Google Scholar] [CrossRef]
  20. Rettig, W. Charge separation in excited states of decoupled systems—TICT compounds and implications regarding the development of new laser dyes and the primary process of vision and photosynthesis. Angew. Chem. Int. Ed. Engl. 1986, 25, 971–988. [Google Scholar] [CrossRef]
  21. Loving, G.; Imperiali, B. A versatile amino acid analogue of the solvatochromic fluorophore 4-N,N-dimethylamino-1,8-naphthalimide: A powerful tool for the study of dynamic protein interactions. J. Am. Chem. Soc. 2008, 130, 13630–13638. [Google Scholar] [CrossRef] [Green Version]
  22. Jiang, N.; Fan, J.; Xu, F.; Peng, X.; Mu, H.; Wang, J.; Xiong, X. Ratiometric fluorescence imaging of cellular polarity: Decrease in mitochondrial polarity in cancer cells. Angew. Chem. Int. Ed. 2015, 54, 2510–2514. [Google Scholar] [CrossRef]
  23. Xiao, H.; Li, P.; Tang, B. Recent progresses in fluorescent probes for detection of polarity. Coord. Chem. Rev. 2021, 427, 213582. [Google Scholar] [CrossRef]
  24. Baranov, M.S.; Lukyanov, K.A.; Borissova, A.O.; Shamir, J.; Kosenkov, D.; Slipchenko, L.V.; Tolbert, L.M.; Yampolsky, I.V.; Solntsev, K.M. Conformationally locked chromophores as models of excited-state proton transfer in fluorescent proteins. J. Am. Chem. Soc. 2012, 134, 6025–6032. [Google Scholar] [CrossRef]
  25. Chen, C.; Liu, W.; Baranov, M.S.; Baleeva, N.S.; Yampolsky, I.V.; Zhu, L.; Wang, Y.; Shamir, A.; Solntsev, K.M.; Fang, C. Unveiling structural motions of a highly fluorescent superphotoacid by locking and fluorinating the GFP chromophore in solution. J. Phys. Chem. Lett. 2017, 8, 5921–5928. [Google Scholar] [CrossRef] [Green Version]
  26. Chen, C.; Tachibana, S.R.; Baleeva, N.S.; Myasnyanko, I.N.; Bogdanov, A.M.; Gavrikov, A.S.; Mishin, A.S.; Malyshevskaya, K.K.; Baranov, M.S.; Fang, C. Developing bright green fluorescent protein (GFP)-like fluorogens for live-cell imaging with nonpolar protein−chromophore interactions. Chem. Eur. J. 2021, 27, 8946–8950. [Google Scholar] [CrossRef]
  27. Würth, C.; Grabolle, M.; Pauli, J.; Spieles, M.; Resch-Genger, U. Relative and absolute determination of fluorescence quantum yields of transparent samples. Nat. Protoc. 2013, 8, 1535–1550. [Google Scholar] [CrossRef]
  28. Rurack, K.; Spieles, M. Fluorescence quantum yields of a series of red and near-infrared dyes emitting at 600−1000 nm. Anal. Chem. 2011, 83, 1232–1242. [Google Scholar] [CrossRef]
  29. Liu, W.; Wang, Y.; Tang, L.; Oscar, B.G.; Zhu, L.; Fang, C. Panoramic portrait of primary molecular events preceding excited state proton transfer in water. Chem. Sci. 2016, 7, 5484–5494. [Google Scholar] [CrossRef] [Green Version]
  30. Tang, L.; Zhu, L.; Taylor, M.A.; Wang, Y.; Remington, S.J.; Fang, C. Excited state structural evolution of a GFP single-site mutant tracked by tunable femtosecond-stimulated Raman spectroscopy. Molecules 2018, 23, 2226. [Google Scholar] [CrossRef] [Green Version]
  31. Snellenburg, J.J.; Laptenok, S.P.; Seger, R.; Mullen, K.M.; van Stokkum, I.H.M. Glotaran: A Java-based graphical user interface for the R-package TIMP. J. Stat. Softw. 2012, 49, 1–22. [Google Scholar] [CrossRef] [Green Version]
  32. Chen, C.; Zhu, L.; Baranov, M.S.; Tang, L.; Baleeva, N.S.; Smirnov, A.Y.; Yampolsky, I.V.; Solntsev, K.M.; Fang, C. Photoinduced proton transfer of GFP-inspired fluorescent superphotoacids: Principles and design. J. Phys. Chem. B 2019, 123, 3804–3821. [Google Scholar] [CrossRef] [PubMed]
  33. Fang, C.; Tang, L.; Chen, C. Unveiling coupled electronic and vibrational motions of chromophores in condensed phases. J. Chem. Phys. 2019, 151, 200901. [Google Scholar] [CrossRef] [PubMed]
  34. Frisch, M.J.; Trucks, G.W.; Schlegel, H.B.; Scuseria, G.E.; Robb, M.A.; Cheeseman, J.R.; Scalmani, G.; Barone, V.; Petersson, G.A.; Nakatsuji, H.; et al. Gaussian 16, Rev. C.01; Gaussian, Inc.: Wallingford, CT, USA, 2016. [Google Scholar]
  35. Weber, W.; Helms, V.; McCammon, J.A.; Langhoff, P.W. Shedding light on the dark and weakly fluorescent states of green fluorescent proteins. Proc. Natl. Acad. Sci. USA 1999, 96, 6177–6182. [Google Scholar] [CrossRef] [Green Version]
  36. Altoè, P.; Bernardi, F.; Garavelli, M.; Orlandi, G.; Negri, F. Solvent effects on the vibrational activity and photodynamics of the green fluorescent protein chromophore:  A quantum-chemical study. J. Am. Chem. Soc. 2005, 127, 3952–3963. [Google Scholar] [CrossRef]
  37. Mandal, D.; Tahara, T.; Meech, S.R. Excited-state dynamics in the green fluorescent protein chromophore. J. Phys. Chem. B 2004, 108, 1102–1108. [Google Scholar] [CrossRef]
  38. Taylor, M.A.; Zhu, L.; Rozanov, N.D.; Stout, K.T.; Chen, C.; Fang, C. Delayed vibrational modulation of the solvated GFP chromophore into a conical intersection. Phys. Chem. Chem. Phys. 2019, 21, 9728–9739. [Google Scholar] [CrossRef]
  39. Boulanger, S.A.; Chen, C.; Tang, L.; Zhu, L.; Baleeva, N.S.; Myasnyanko, I.N.; Baranov, M.S.; Fang, C. Shedding light on ultrafast ring-twisting pathways of halogenated GFP chromophores from the excited to ground state. Phys. Chem. Chem. Phys. 2021, 23, 14636–14648. [Google Scholar] [CrossRef]
  40. Zimmer, M. GFP: From jellyfish to the Nobel prize and beyond. Chem. Soc. Rev. 2009, 38, 2823–2832. [Google Scholar] [CrossRef]
  41. Jung, G. (Ed.) Fluorescent Proteins I: From Understanding to Design; Springer: Berlin/Heidelberg, Germany, 2012; Volume 11, p. 268. [Google Scholar]
  42. Fang, C.; Tang, L. Mapping structural dynamics of proteins with femtosecond stimulated Raman spectroscopy. Annu. Rev. Phys. Chem. 2020, 71, 239–265. [Google Scholar] [CrossRef] [Green Version]
  43. Chen, C.; Baranov, M.S.; Zhu, L.; Baleeva, N.S.; Smirnov, A.Y.; Zaitseva, S.; Yampolsky, I.V.; Solntsev, K.M.; Fang, C. Designing redder and brighter fluorophores by synergistic tuning of ground and excited states. Chem. Commun. 2019, 55, 2537–2540. [Google Scholar] [CrossRef]
  44. Chen, C.; Fang, C. Devising efficient red-shifting strategies for bioimaging: A generalizable donor-acceptor fluorophore prototype. Chem. Asian J. 2020, 15, 1514–1523. [Google Scholar] [CrossRef]
  45. Reichardt, C. Solvatochromic dyes as solvent polarity indicators. Chem. Rev. 1994, 94, 2319–2358. [Google Scholar] [CrossRef]
  46. Baranov, M.S.; Solntsev, K.M.; Baleeva, N.S.; Mishin, A.S.; Lukyanov, S.A.; Lukyanov, K.A.; Yampolsky, I.V. Red-shifted fluorescent aminated derivatives of a conformationally locked GFP chromophore. Chem. Eur. J. 2014, 20, 13234–13241. [Google Scholar] [CrossRef]
  47. Kamlet, M.J.; Abboud, J.-L.M.; Abraham, M.H.; Taft, R.W. Linear solvation energy relationships. 23. A comprehensive collection of the solvatochromic parameters, π*, α, and β, and some methods for simplifying the generalized solvatochromic equation. J. Org. Chem. 1983, 48, 2877–2887. [Google Scholar] [CrossRef]
  48. Baleeva, N.S.; Zaitseva, S.O.; Gorbachev, D.A.; Smirnov, A.Y.; Zagudaylova, M.B.; Baranov, M.S. The role of N-substituents in radiationless deactivation of aminated derivatives of a locked GFP chromophore. Eur. J. Org. Chem. 2017, 2017, 5219–5224. [Google Scholar] [CrossRef]
  49. Tang, L.; Fang, C. Nitration of tyrosine channels photoenergy through a conical intersection in water. J. Phys. Chem. B 2019, 123, 4915–4928. [Google Scholar] [CrossRef]
  50. Iikura, H.; Tsuneda, T.; Yanai, T.; Hirao, K. A long-range correction scheme for generalized-gradient-approximation exchange functionals. J. Chem. Phys. 2001, 115, 3540–3544. [Google Scholar] [CrossRef]
  51. Rohrdanz, M.A.; Martins, K.M.; Herbert, J.M. A long-range-corrected density functional that performs well for both ground-state properties and time-dependent density functional theory excitation energies, including charge-transfer excited states. J. Chem. Phys. 2009, 130, 054112. [Google Scholar] [CrossRef] [Green Version]
  52. Maroncelli, M.; Fleming, G.R. Picosecond solvation dynamics of coumarin 153: The importance of molecular aspects of solvation. J. Chem. Phys. 1987, 86, 6221–6239. [Google Scholar] [CrossRef] [Green Version]
  53. Pérez-Lustres, J.L.; Rodriguez-Prieto, F.; Mosquera, M.; Senyushkina, T.A.; Ernsting, N.P.; Kovalenko, S.A. Ultrafast proton transfer to solvent: Molecularity and intermediates from solvation- and diffusion-controlled regimes. J. Am. Chem. Soc. 2007, 129, 5408–5418. [Google Scholar] [CrossRef]
  54. Tang, L.; Zhu, L.; Wang, Y.; Fang, C. Uncovering the hidden excited state toward fluorescence of an intracellular pH indicator. J. Phys. Chem. Lett. 2018, 9, 4969–4975. [Google Scholar] [CrossRef]
  55. Van Stokkum, I.H.M.; Larsen, D.S.; van Grondelle, R. Global and target analysis of time-resolved spectra. Biochim. Biophys. Acta 2004, 1657, 82–104. [Google Scholar] [CrossRef] [Green Version]
  56. Krueger, T.D.; Boulanger, S.A.; Zhu, L.; Tang, L.; Fang, C. Discovering a rotational barrier within a charge-transfer state of a photoexcited chromophore in solution. Struct. Dyn. 2020, 7, 024901. [Google Scholar] [CrossRef] [Green Version]
  57. Solntsev, K.M.; Poizat, O.; Dong, J.; Rehault, J.; Lou, Y.; Burda, C.; Tolbert, L.M. Meta and para effects in the ultrafast excited-state dynamics of the green fluorescent protein chromophores. J. Phys. Chem. B 2008, 112, 2700–2711. [Google Scholar] [CrossRef]
  58. Chen, C.; Tutol, J.N.; Tang, L.; Zhu, L.; Ong, W.S.Y.; Dodani, S.; Fang, C. Excitation ratiometric chloride sensing in a standalone yellow fluorescent protein is powered by the interplay between proton transfer and conformational reorganization. Chem. Sci. 2021. [Google Scholar] [CrossRef]
  59. Digman, M.A.; Caiolfa, V.R.; Zamai, M.; Gratton, E. The phasor approach to fluorescence lifetime imaging analysis. Biophys. J. 2008, 94, L14–L16. [Google Scholar] [CrossRef] [Green Version]
  60. Ranjit, S.; Malacrida, L.; Jameson, D.M.; Gratton, E. Fit-free analysis of fluorescence lifetime imaging data using the phasor approach. Nat. Protoc. 2018, 13, 1979–2004. [Google Scholar] [CrossRef]
  61. Litvinenko, K.L.; Webber, N.M.; Meech, S.R. Internal conversion in the chromophore of the green fluorescent protein:  Temperature dependence and isoviscosity analysis. J. Phys. Chem. A 2003, 107, 2616–2623. [Google Scholar] [CrossRef]
  62. Kramers, H.A. Brownian motion in a field of force and the diffusion model of chemical reactions. Physica 1940, 7, 284–304. [Google Scholar] [CrossRef]
  63. Rettig, W.; Fritz, R.; Braun, D. Combination of pressure and temperature dependent measurements:  A simple access to intrinsic thermal activation energies. J. Phys. Chem. A 1997, 101, 6830–6835. [Google Scholar] [CrossRef]
  64. Sumi, H. Solvent-fluctuation control of solution reactions and its manifestation in protein functions. In Advances in Chemical Physics: Electron Transfer—From Isolated Molecules to Biomolecules. Part 2; Prigogine, I., Rice, S.A., Eds.; John Wiley & Sons, Inc.: Hoboken, NJ, USA, 1999; Volume 107, pp. 601–646. [Google Scholar]
  65. Amdursky, N.; Erez, Y.; Huppert, D. Molecular rotors: What lies behind the high sensitivity of the thioflavin-T fluorescent marker. Acc. Chem. Res. 2012, 45, 1548–1557. [Google Scholar] [CrossRef] [PubMed]
  66. Romei, M.G.; Lin, C.-Y.; Mathews, I.I.; Boxer, S.G. Electrostatic control of photoisomerization pathways in proteins. Science 2020, 367, 76–79. [Google Scholar] [CrossRef] [PubMed]
  67. Bozhanova, N.G.; Baranov, M.S.; Baleeva, N.S.; Gavrikov, A.S.; Mishin, A.S. Red-shifted aminated derivatives of GFP chromophore for live-cell protein labeling with lipocalins. Int. J. Mol. Sci. 2018, 19, 3778. [Google Scholar] [CrossRef] [Green Version]
Scheme 1. Synthesis of compounds 1 (a), 2 (b), and 3 (c). “MS (3 A + 4 A)” represents molecular sieves with 3 Å and 4 Å pore sizes.
Chemosensors 09 00234 sch001
Figure 1. Rational design and photophysical properties of a GFP-derived fluorogen and control fluorophores. (a) Design of the fluorogenic compound 1. (b) Solvatochromism and fluorogenicity of compound 1 in a variety of solvents. (c) Correlation between the observed FQY and solvent polarity. (d) Structures and FQYs of two control compounds 2 and 3 in the same solvents for direct comparison with compound 1. The colors for various solvents in (c,d) are defined in (b).
Chemosensors 09 00234 g001
Figure 2. Calculated potential energy surfaces (PESs) along the twisting coordinate of the dimethylamine in S0 and S1 for compound 1. Red circles, red squares, and green squares denote the optimized S1 energy, S0 energy at the optimized S1 geometry, and optimized S0 energy, respectively. The grayed-out red trace with red circles displays the S1 energy scan with –OH pointing toward –NMe2 on the phenol ring. Electron density distributions of HOMO (H) and LUMO (L) are shown for the FS and TICT states, accompanied by the S1 → S0 transition oscillation strengths and energy gaps.
Chemosensors 09 00234 g002
Figure 3. Excited-state dynamics and decay rate constants of the newly designed polarity sensor. (a) Semilogarithmic contour plots and global analysis of fs-TA spectra for compound 1 in solvents with decreasing polarity. The arrow in each contour plot denotes the position and decay of the relaxed FS. The lifetimes retrieved from global analysis are color-coded in accordance with the corresponding EADS. Steady-state fluorescence spectrum is inversed and overlaid as a gray shaded band for each sample. (b) Relationships between the observed decay rate constants and intrinsic solvent polarity E T N . The colors for solvents are defined the same way as Figure 1.
Chemosensors 09 00234 g003
Figure 4. Schematic of PESs for compound 1 governing the polarity effect. The dashed gray curve depicts the shifted excited-state PES due to strengthened H-bonding interactions between the chromophore and solvent, leading to an effectively reduced energy barrier. The reaction coordinate could mainly consist of the dimethylamine twisting angle. Abbreviations: Ex., excitation; Fl., fluorescence; IC, internal conversion; TS, transition state. These oversimplified 2D PESs capture the essence of the working mechanism of this polarity sensor.
Chemosensors 09 00234 g004
Table 1. Decay rate constants of compound 1 in 11 solvents.
Solvent τ F S
(ns)
k F S
(108 s−1)
k n r
(108 s−1)
k r
(108 s−1)
1H2O0.7812.9012.650.25
2MeOH0.5418.5517.431.12
3EtOH1.059.508.311.19
42-PrOH1.327.566.321.24
5ACN1.387.256.101.15
6DMF1.855.394.590.80
7acetone2.234.483.151.33
8DCM4.242.360.881.48
9EtOAc9.941.010.540.47
10dioxane3.722.691.101.59
11toluene6.101.640.501.14
Publisher’s Note: MDPI stays neutral with regard to jurisdictional claims in published maps and institutional affiliations.

