Article

Quantitative Assessment of Periodontal Bacteria Using a Cell-Based Immunoassay with Functionalized Quartz Crystal Microbalance

by
Satit Rodphukdeekul
1,2,
Miyuki Tabata
2,
Chindanai Ratanaporncharoen
2,
Yasuo Takeuchi
3,
Pakpum Somboon
1,
Watcharee Boonlue
4,5,
Yuji Miyahara
2,* and
Mana Sriyudthsak
6,*
1
Biomedical Engineering Program, Faculty of Engineering, Chulalongkorn University, Bangkok 10330, Thailand
2
Institute of Biomaterials and Bioengineering, Tokyo Medical and Dental University, Tokyo 101-0062, Japan
3
Department of Periodontology, Faculty of Dentistry, Tokyo Medical and Dental University, Tokyo 113-8510, Japan
4
Department of Nutrition and Dietetics, Faculty of Allied Health Sciences, Chulalongkorn University, Bangkok 10330, Thailand
5
Biosensors and Bioanalytical Technology for Cells and Innovative Testing Device Research Unit, Chulalongkorn University, Bangkok 10330, Thailand
6
Department of Electrical Engineering, Faculty of Engineering, Chulalongkorn University, Bangkok 10330, Thailand
*
Authors to whom correspondence should be addressed.
Chemosensors 2021, 9(7), 159; https://doi.org/10.3390/chemosensors9070159
Submission received: 15 April 2021 / Revised: 16 June 2021 / Accepted: 22 June 2021 / Published: 25 June 2021

Abstract

:
Periodontal disease is an inflammatory disorder that is triggered by bacterial plaque and causes the destruction of the tooth-supporting tissues leading to tooth loss. Several bacteria species, including Porphyromonas gingivalis and Aggregatibacter actinomycetemcomitans, are considered to be associated with severe periodontal conditions. In this study, we demonstrated a quartz crystal microbalance (QCM) immunoassay for quantitative assessment of the periodontal bacteria, A. actinomycetemcomitans. An immunosensor was constructed using a self-assembled monolayer of 11-mercaptoundecanoic acid (11-MUA) on the gold surface of a QCM chip. The 11-MUA layer was evaluated using a cyclic voltammetry technique to determine its mass and packing density. Next, a monoclonal antibody was covalently linked to 11-MUA using 1-ethyl-3-(3-dimethylaminopropyl) carbodiimide/N-hydroxysuccinimide to act as the biorecognition element. The specificity of the monoclonal antibody was confirmed by an enzyme-linked immunosorbent assay. A calibration curve, for the relationship between the frequency shifts and number of bacteria, was used to calculate the number of A. actinomycetemcomitans bacteria in a test sample. Based on a regression equation, the lower detection limit was 800 cells, with a dynamic range up to 2.32 × 10⁶ cells. Thus, the QCM biosensor in this study provides a sensitive and label-free method for quantitative analysis of periodontal bacteria. The method can be used in various biosensing assays for practical application and routine detection of periodontitis pathogens.

1. Introduction

Oral disorders caused by dental caries and periodontal diseases have a profound effect on general health and quality of life. Periodontitis, the sixth most prevalent disease worldwide [1], is a chronic inflammation of periodontal tissue leading to tooth loss. Periodontal diagnosis is conventionally based on clinical and radiographical evaluations that mainly consist of measurements of probing depth, bone level, bleeding and tooth mobility. However, the data obtained from these methods only reflect the results of disease progression and do not necessarily present the current disease activities [2].
Inflammatory periodontal destruction is mainly caused by chronic infection of bacteria. More than 700 bacterial species are reportedly found in the oral cavity [3] and multiple bacterial species form biofilm and reside in periodontal pockets. It is presently recognized that an imbalance of microbiota, called dysbiosis, disrupts host homeostasis and causes periodontal destruction. Previous studies have reported the involvement of specific bacterial species as keystone pathogens that cause dysbiosis [4] and increase the number of some specific bacteria in periodontitis patients.
The main cause of periodontitis is the appearance of a mixed red-complex bacterial infection, including Porphyromonas gingivalis (P. gingivalis), Treponema denticola (T. denticola), Tannerella forsythia (T. forsythia) and other Gram-negative anaerobic species, particularly, Aggregatibacter actinomycetemcomitans (A. actinomycetemcomitans) and Prevotella intermedia (P. intermedia), that is colocalized in dental plaque [5,6,7]. Evidence from previous studies suggests that the concentrations of some bacteria in the oral cavity of the patients are higher than those in healthy people. The existence of a single or multiple species of the red-complex bacteria with a specific threshold may serve as a potential indicator and predictor of periodontitis progression [8,9,10]. However, it is difficult to diagnose pathogenic bacteria, as the most conventional methods rely on laboratory-based techniques, such as cell culture, microscopic analysis and biochemical assays [11]. Additionally, specific pathogens are difficult to culture in vitro or require a long cultivation period. Nevertheless, extensive efforts have been made to diagnose bacterial infections in an early state to prevent irreversible damage of the patient’s tooth.
In 2018, He et al. reported chairside microorganisms test kits, i.e., the Omnigene diagnostics test, Evalusite kit and PerioScan kit [2]. These test kits were developed to detect multiple bacteria, such as P. gingivalis, P. intermedia and A. actinomycetemcomitans, using different principles: a nucleic acid hybridization-based assay, sandwich enzyme immunoassay [12] and a N-benzoyl-DL-arginine-2 naphthylamide (BANA) hydrolysis reaction [13], respectively. However, these clinical tools are not ideal for rapid diagnosis because the Omnigene diagnostics test is time-consuming, the Evalusite kit has low sensitivity and the PerioScan kit is a qualitative test for disease severity [2]. Furthermore, polymerase chain reaction (PCR), the most sensitive technique for clinical specimens, is dependent on target genes, primer sequences and requires DNA extraction procedures [14]. As a result, biosensor technologies have been developed to overcome the limitations. Various types of biosensors, such as electrochemical biosensors based on amperometric, potentiometric, or impedimetric transducers, have been developed for sensitive detection and easy application [15]. However, in the case of bacteria detection, cost-effective and reliable devices are required for practical use, while the fabrication processes of conventional sensors use expensive equipment and facilities.
Over the past two decades, the unique capability of the quartz crystal microbalance (QCM) biosensor-based assays has been particularly attractive in the field of cell biology [16]. QCM is a promising platform with enhanced sensitivity and specificity for the bioanalytical systems, as it was developed as a fast, inexpensive and high sensitivity tool. The aim of this work is to develop a quantitative assessment technique for periodontal bacteria detection using a QCM immunoassay.

2. Experimental Methods

2.1. Materials

Aggregatibacter actinomycetemcomitans (ATCC 43719), Porphyromonas gingivalis (ATCC 33277) Prevotella nigrescens (ATCC 33563) and Actinimyces naeslundii (ATCC 12104) were cultured according to the anaerobic cultural methodology previously described by Uekubo A. et al. [17] and Komazaki R. et al. [18]. Briefly, bacterial cells were cultured in brain–heart infusion (BHI) broth (Oxoid Ltd., Basingstoke, UK) with 5 µg/mL of hemin (Sigma, Poole, UK) at 37 °C for 2 days under anaerobic conditions. All reagents were stored under oxygen-free conditions. For harvesting, the cultured cells were centrifuged at 8000× g for 15 min at 4 °C and the cell pellets were resuspended with phosphate-buffered saline (PBS) and stored at −80 °C until use. The concentration of bacterial samples was determined using a Petroff–Hauser counting chamber under optical microscopy. Anti-A. actinomycetemcomitans monoclonal antibody (DSHB Hybridoma Product 325AA2) was purchased from the Developmental Studies Hybridoma Bank, Department of Biology, University of Iowa, USA. The following materials were obtained as indicated: 11-mercaptoundecanoic acid (11-MUA), 1-ethyl-3-[3-dimethylaminopropyl]carbodiimide hydrochloride (EDC) (Chemical Dojin Co., Ltd., Osaka, Japan), N-hydroxysuccinimide (NHS), 99.5% ethanol and bovine serum albumin (BSA, FUJIFILM Wako Pure Chemical Corporation, Osaka, Japan) and PBS with 0.05% Tween 20, pH 7.4 (Sigma, St Louis, MO, USA).
A 30 MHz piezoelectric quartz wafer with twin gold electrodes, channel 1 (CH1) and channel 2 (CH2), is illustrated in Figure 1a. In our work, CH1 was used as an antibody-immobilized sensor, while CH2 was used as a reference sensor without antibody-immobilization. The measurement system shown in Figure 1b included a NAPiCOS system (Nihon Dempa Kogyo, Tokyo, Japan), a syringe pump (Harvard Apparatus, MA, USA) and a 6-port rotary injector (Rheodyne, CA, USA).

2.2. Self-Assembled Monolayer and Surface Characterization

The 11-mercaptoundecanoic acid (11-MUA) was used in this study. First, the gold surface was cleaned with 1 M sodium hydroxide and 1 M hydrochloric acid before surface modification [19]. Then, the surface of the gold electrode was modified with the 11-MUA.
For the formation of a self-assembled monolayer (SAM) of 11-MUA, 180 µL of 2 mM 11-MUA in ethanol was applied to the gold surface and incubated for 12 h to form the SAM. After incubation, the gold surface was washed with ethanol and deionized water and dried with nitrogen gas. The evaluation for 11-MUA SAM on the gold surface was performed with the cyclic voltammetry technique using an Autolab PGSTAT100 and GPES software [20]. Briefly, the 11-MUA SAM-modified gold electrode was used as a working electrode. A platinum wire (diameter = 1 mm) and a silver (Ag)/silver chloride (AgCl) wire in a 3.3 M KCl solution with a salt bridge were used as the counter and the reference electrode, respectively. Ramp voltages were applied from −0.0 to −1.2 V with a scan rate of 0.1 V/s in a 0.5 M potassium hydroxide solution. The dissolved oxygen was removed from the solution by bubbling nitrogen gas before measurement. The total surface area of the gold electrode was 0.176 cm2. The SAM density was calculated with the peak area of the reduction current (QSAM) from −0.80 to −1.00 V vs. Ag/AgCl at the first sweep. The density of the SAM on the gold surface was estimated using the following equation:
ƳSAM = QSAM NA/FA
where NA, F and A are the Avogadro constant (6.02 × 10²³ mol−1), Faraday constant (96,500 C mol−1) and surface area (2 × 8.8 × 1012 nm2), respectively.

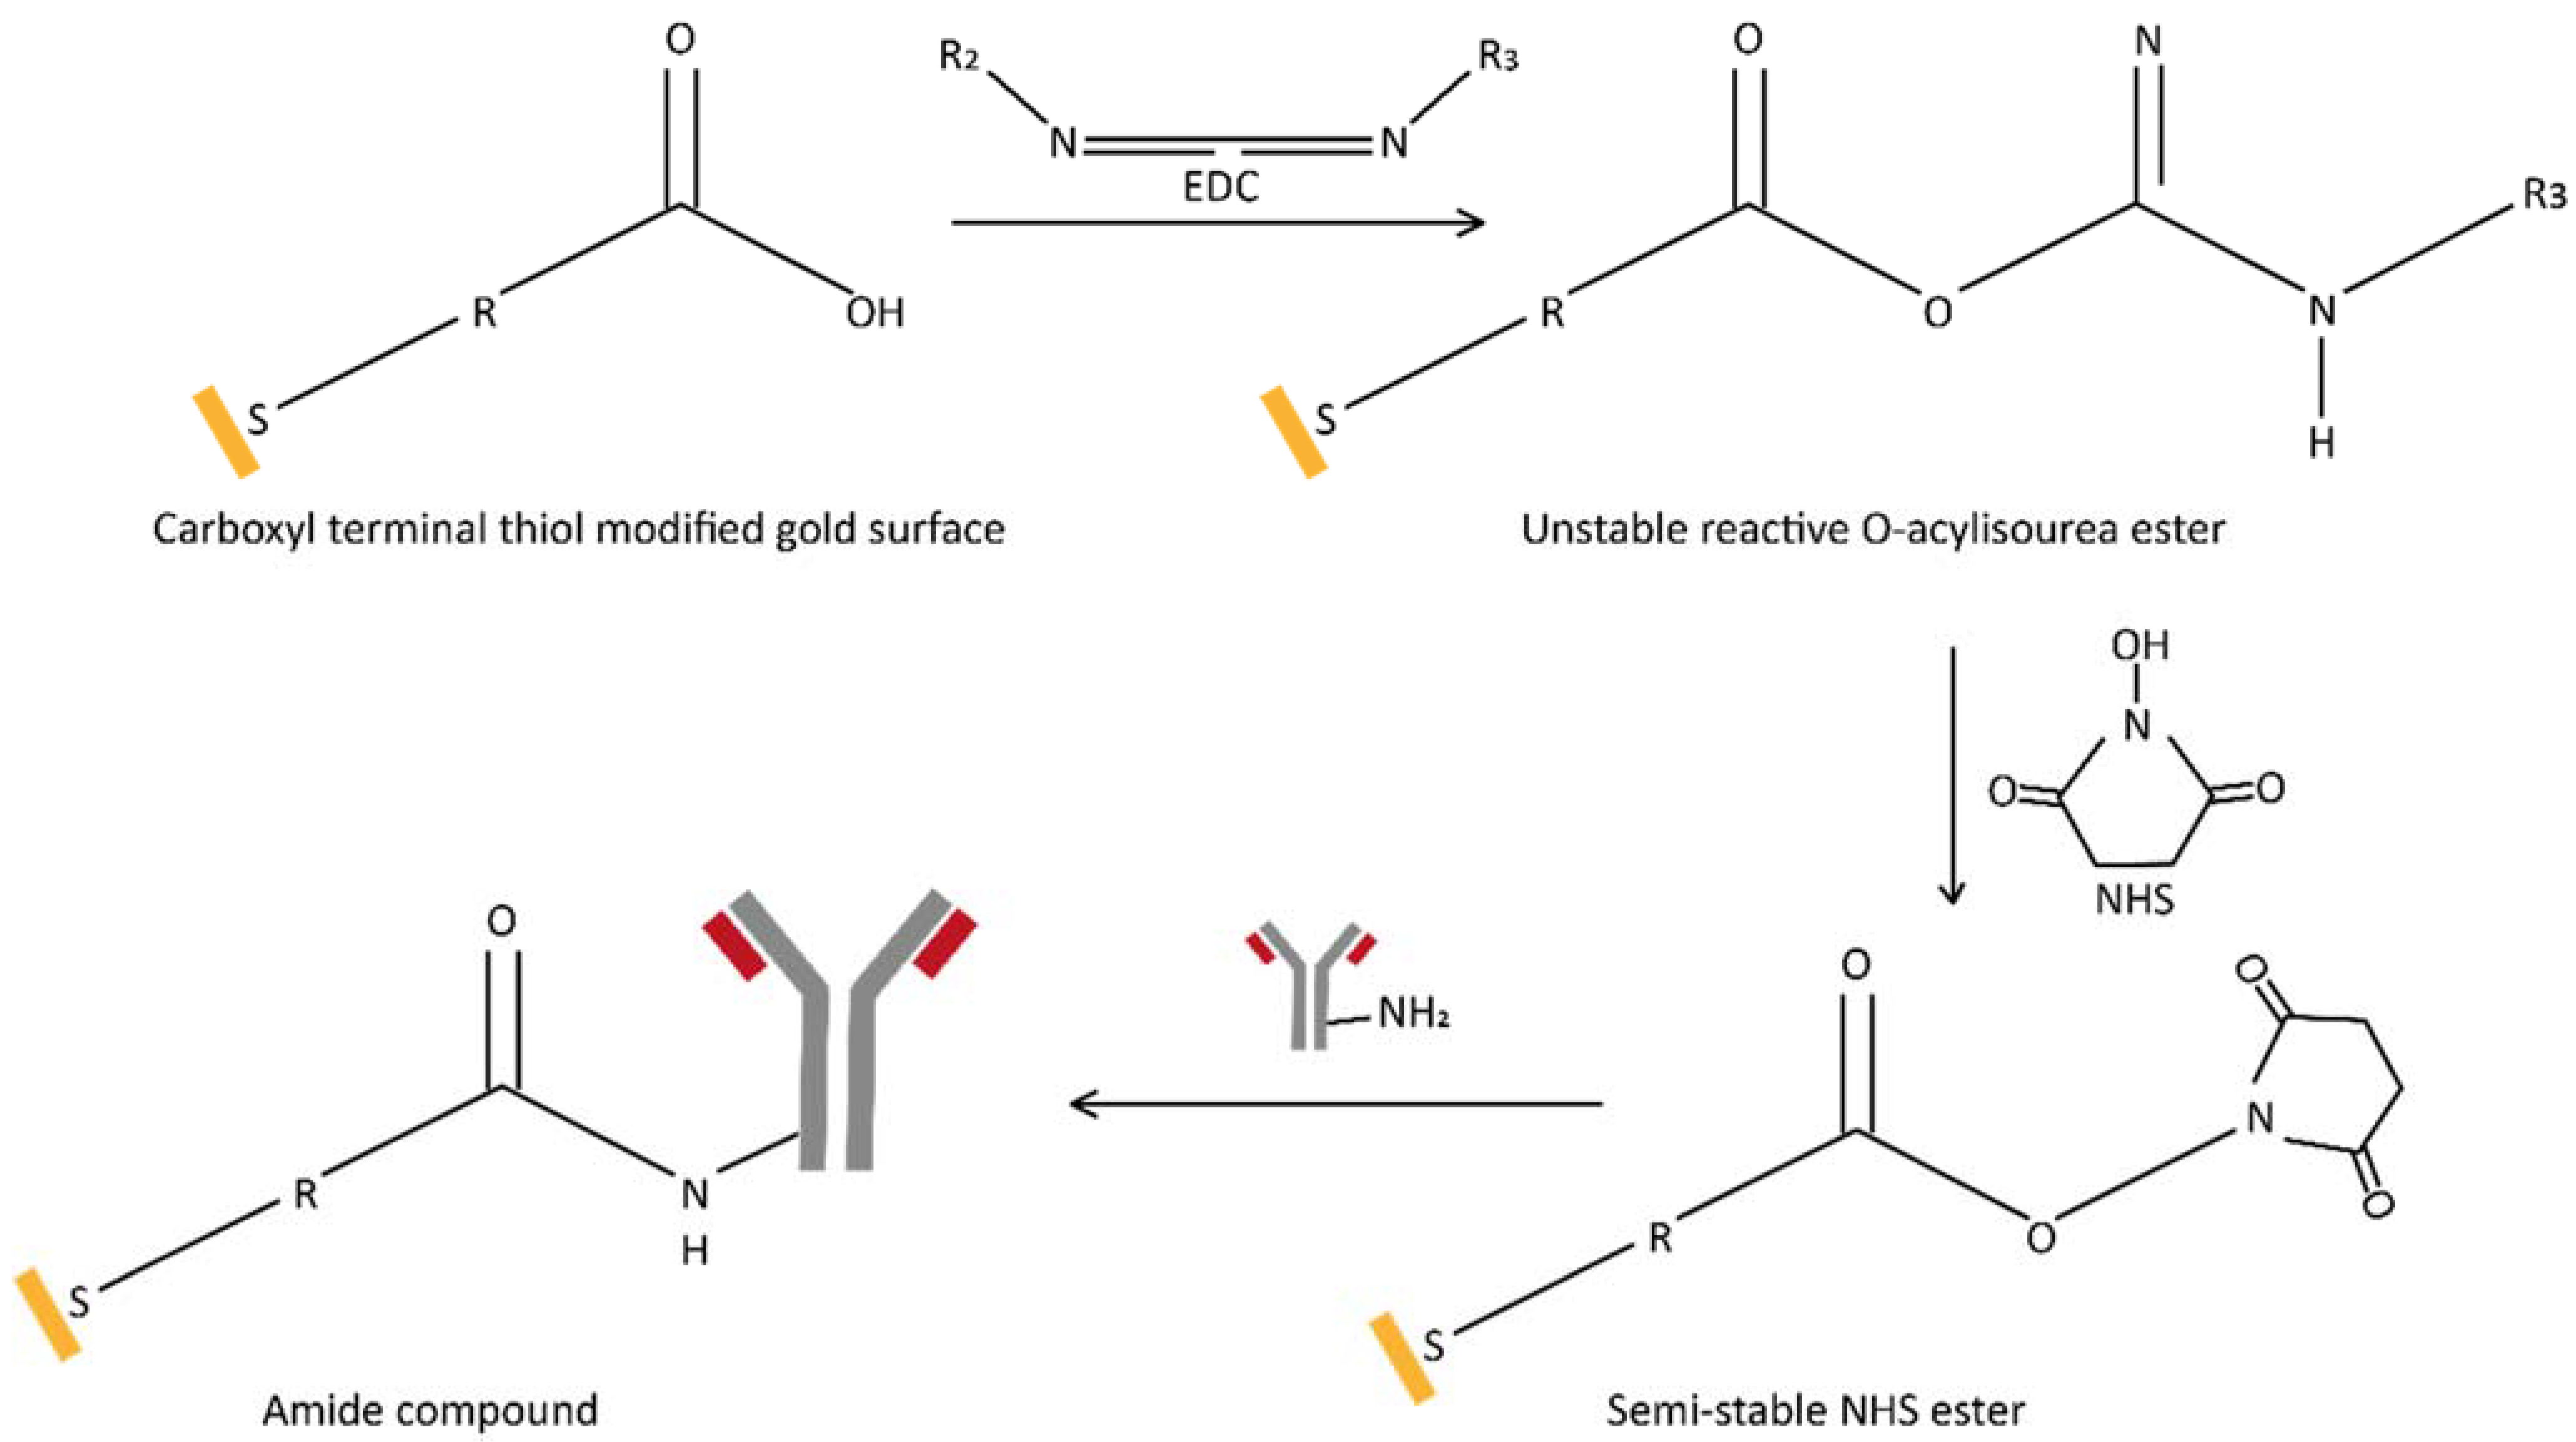
2.3. Antibody Immobilization on a Carboxy-Terminated Self-Assembled Monolayer Surface

The antibody immobilization scheme on a carboxy-terminated SAM is shown in Figure 2.
The 11-MUA modified surface was first activated by adding a mixed solution of 0.5 M NHS and 0.2 M EDC in deionized water and incubated for 90 min at room temperature. Then, 100 µL of 5 µg/mL anti-A. actinomycetemcomitans in 0.1 M acetate buffer (pH 5.0) were added directly to the activated SAM surface, while 0.1 M acetate buffer without antibody was used as negative control and incubated for 60 min at room temperature. The resulting immobilized surface was then washed with PBS, followed by 100 µL of 1 M ethanolamine (pH 8.8) for 20 min to inactivate the unreacted esters of the gold surfaces. The frequency signals of the modified sensor in response to two types of bacteria were measured and compared in a real time.

2.4. Enzyme-Linked Immunosorbent Assay

An enzyme-linked immunosorbent assay (ELISA) was used to confirm the specific binding of anti-A. actinomycetemcomitans antibody used in this study. Standard 96-well microplates (Sumitomo Bakelite Co., Ltd., Osaka, Japan) and a microplate reader (Tecan Group Ltd., Männedorf, Switzerland) were used throughout the assays. Briefly, the wells of a microplate were individually seeded with 1 × 10⁶ cells/mL of A. actinomycetemcomitans and P. gingivalis and incubated at 37 °C overnight. BSA (2% (w/v)) was used as a blocking agent. Next, anti-A. actinomycetemcomitans antibody was then applied to A. actinomycetemcomitans and P. gingivalis coated wells and incubated for 30 min. After incubation, the coated wells were washed with 0.05% Tween 20 in PBS. Protein G-conjugated horseradish peroxidase (0.1 µg/mL, Invitrogen™, Waltham, MA, USA), a secondary detector, was applied to the well and incubated for another hour at 25 °C. Unbound molecules were removed with PBS containing 0.1% (w/w) Tween 20. Finally, 3,3′,5,5′-tetramethylbenzidine (Abcam, Cambridge, UK) was added to the wells to generate the colorimetric reaction and 0.5 M sulfuric acid was used to stop the reaction. Optical density measurements were performed using a microplate reader at a wavelength of 450 nm.

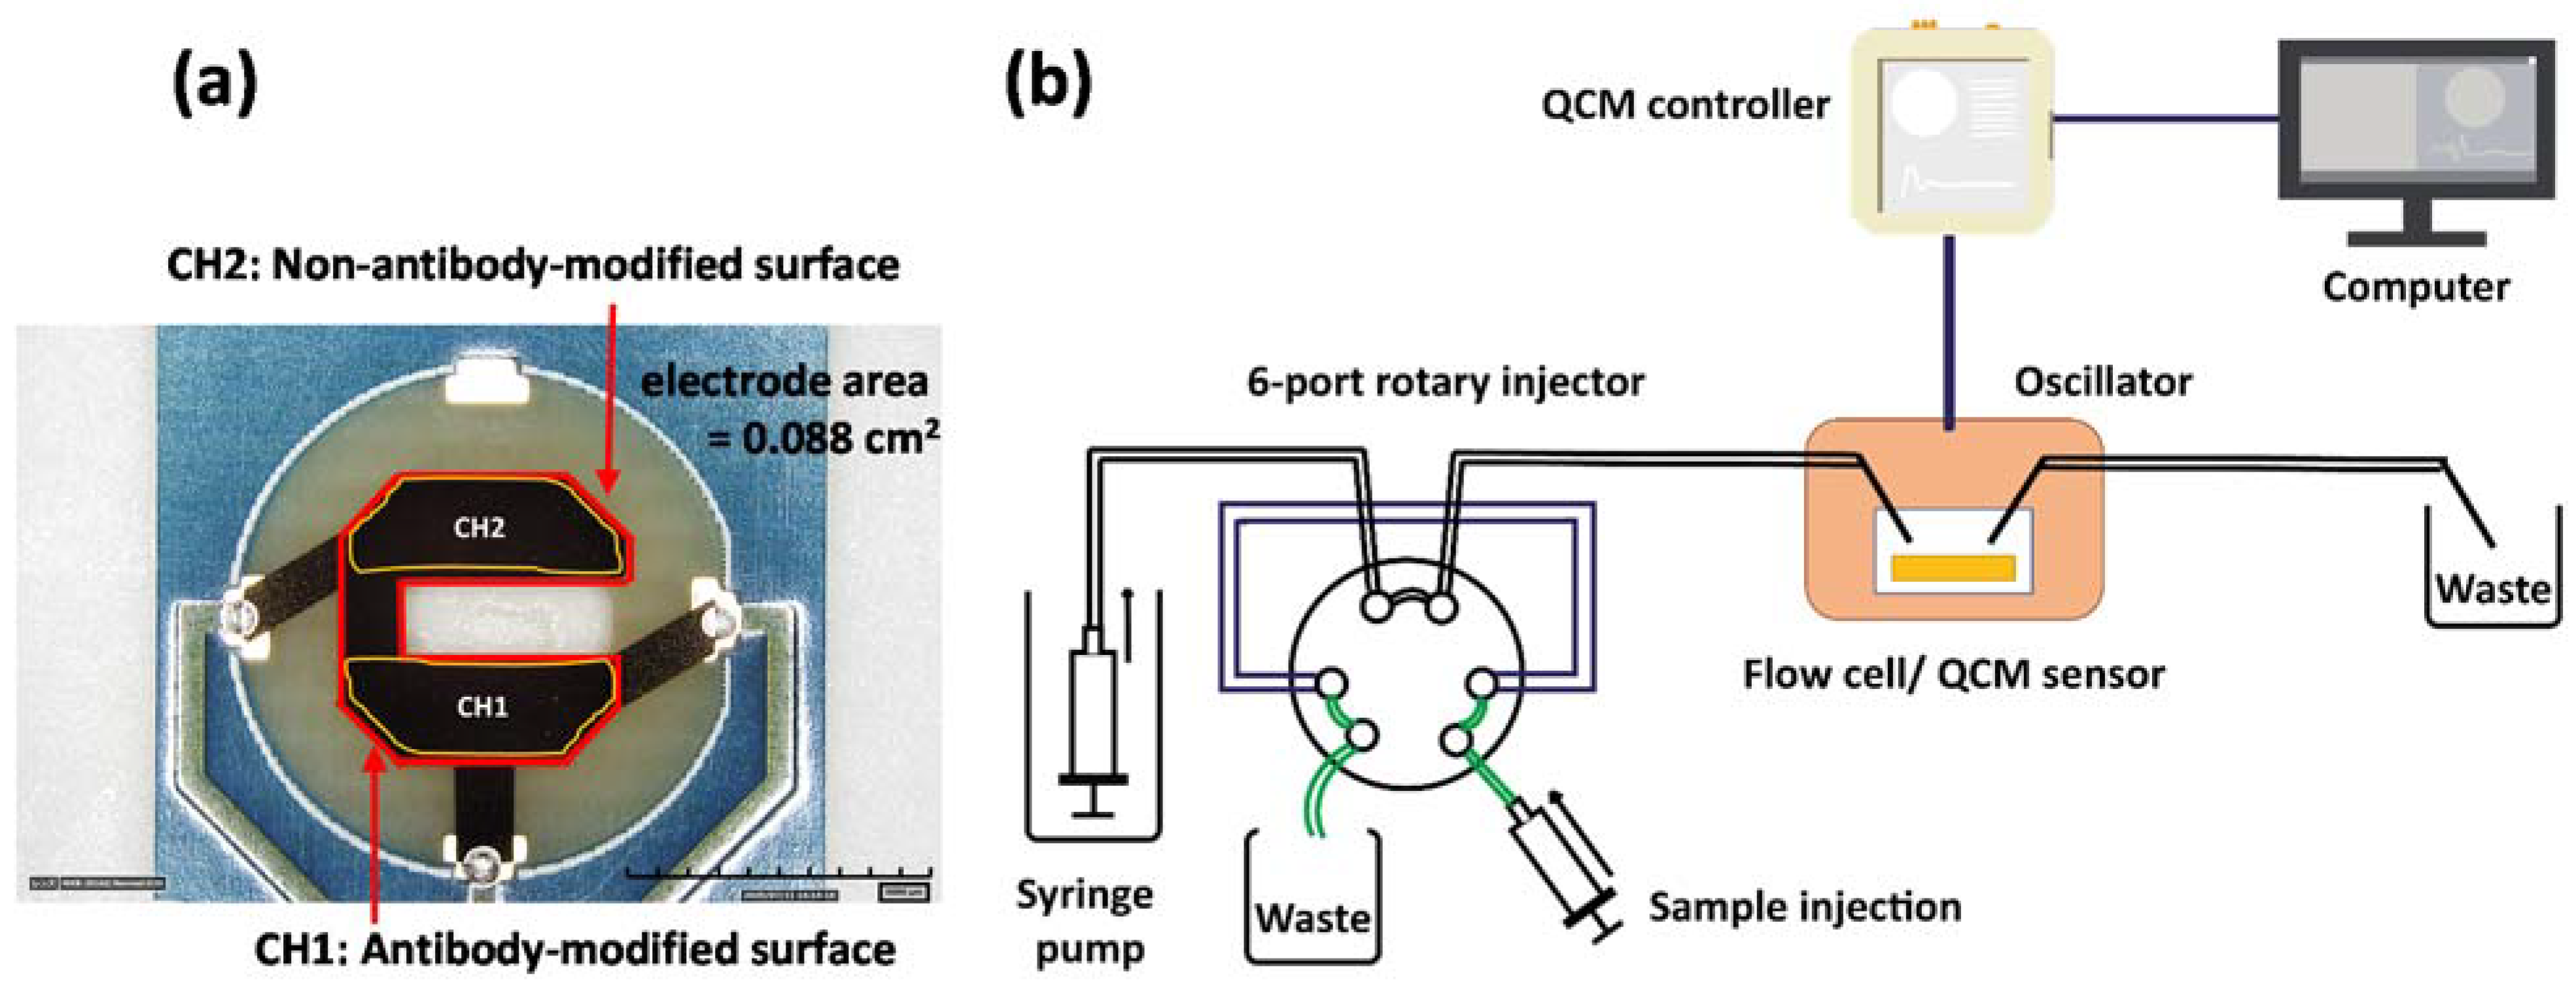
2.5. Fabrication of the QCM Immunosensor

To fabricate the QCM immunosensor, the 11-MUA modification was performed on the gold surfaces (both CH1 and CH2) for 12 h at room temperature. The 11-MUA layer was activated by adding a mixed solution of 0.5 M NHS and 0.2 M EDC in deionized water (both CH1 and CH2) and incubated for 90 min at room temperature. Then, 100 µL of 5 µg/mL anti-A. actinomycetemcomitans antibody in 0.1 M acetate buffer (pH 5.0) were added directly to the activated CH1, while 0.1 M acetate buffer without antibody (negative control) was added to the activated CH2 and incubated for 60 min at room temperature. The resulting QCM sensors were then washed with PBS followed by 100 µL of 1 M ethanolamine (pH 8.8) for 20 min to inactivate the unreacted esters of the Au surfaces.

2.6. Quartz Crystal Microbalance Measurement

For the detection of A. actinomycetemcomitans, the modified QCM chip was first equilibrated with PBS buffer for at least 10 min. Then, 200 µL of A. actinomycetemcomitans samples at a concentration ranging from 1.16 × 10³ to 1.16 × 10⁷ cells/mL (10-fold serial dilution) were separately applied to the QCM measurement system via the 6-port rotary injector. The flow of the liquid phase was driven by the syringe pump with a flow rate of 50 μL/min and PBS was used as a running buffer. The decrease in frequency caused by the binding of various concentrations of A. actinomycetemcomitans were measured in real time. The detection time was 1200 s. The background signal (obtained from CH2) was subtracted from the binding signal (obtained from CH1) and, thus, a real binding signal of each detection was used to obtain the calibration curve and the limit of detection was determined. The limit of detection was calculated based on the regression equation using the standard deviation of the blank samples with the confidence value of 3. Microscope imaging was also performed to confirm the binding of the target bacteria to the QCM electrode with immobilized antibody.

3. Results and Discussion

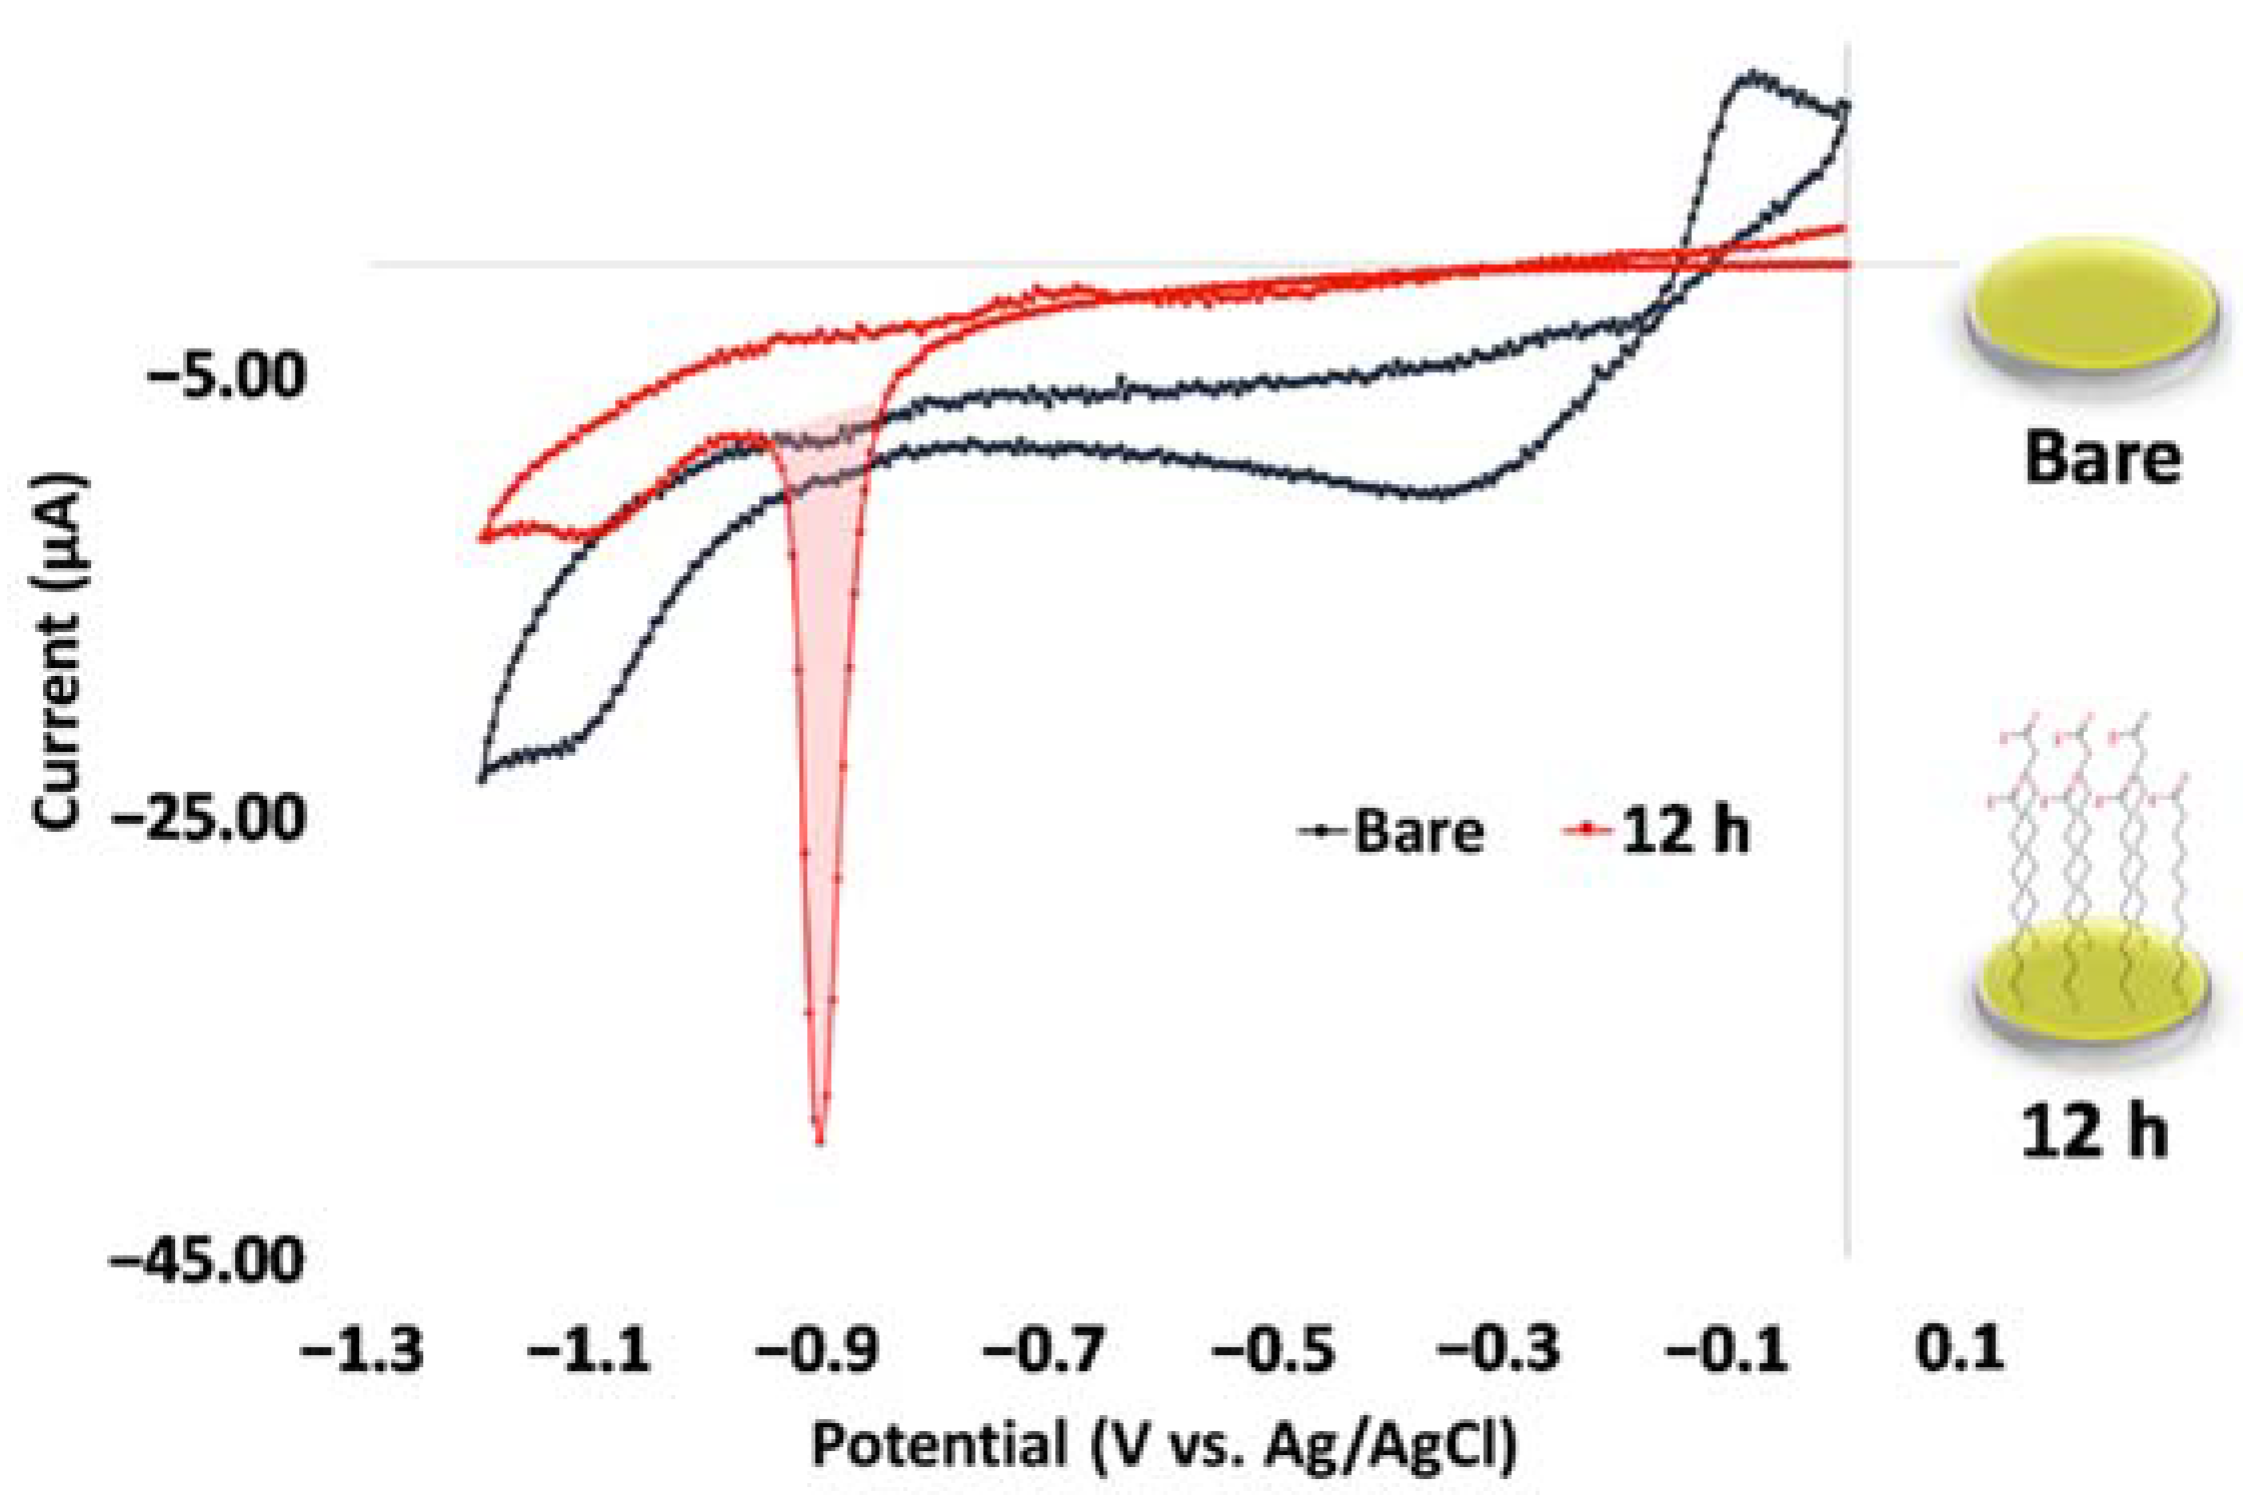
3.1. Characterization of the Self-Assembled Monolayer of 11-MUA

According to the results of the cyclic voltammetry measurement, as shown in Figure 3, the SAM density was confirmed as 4.46–4.54 molecules/nm2, which was a maximum density of alkanethiol molecules that could be adsorbed on the gold surface [21,22].
Table 1 shows the 11-MUA formation on the gold surface in both incubation times of 12 h and 24 h. The amount of 11-MUA on the gold area of the QCM sensor can be 144 ng/cm2 for both incubation times. The surface modification time of 12 h had better repeatability and was used in the next study.

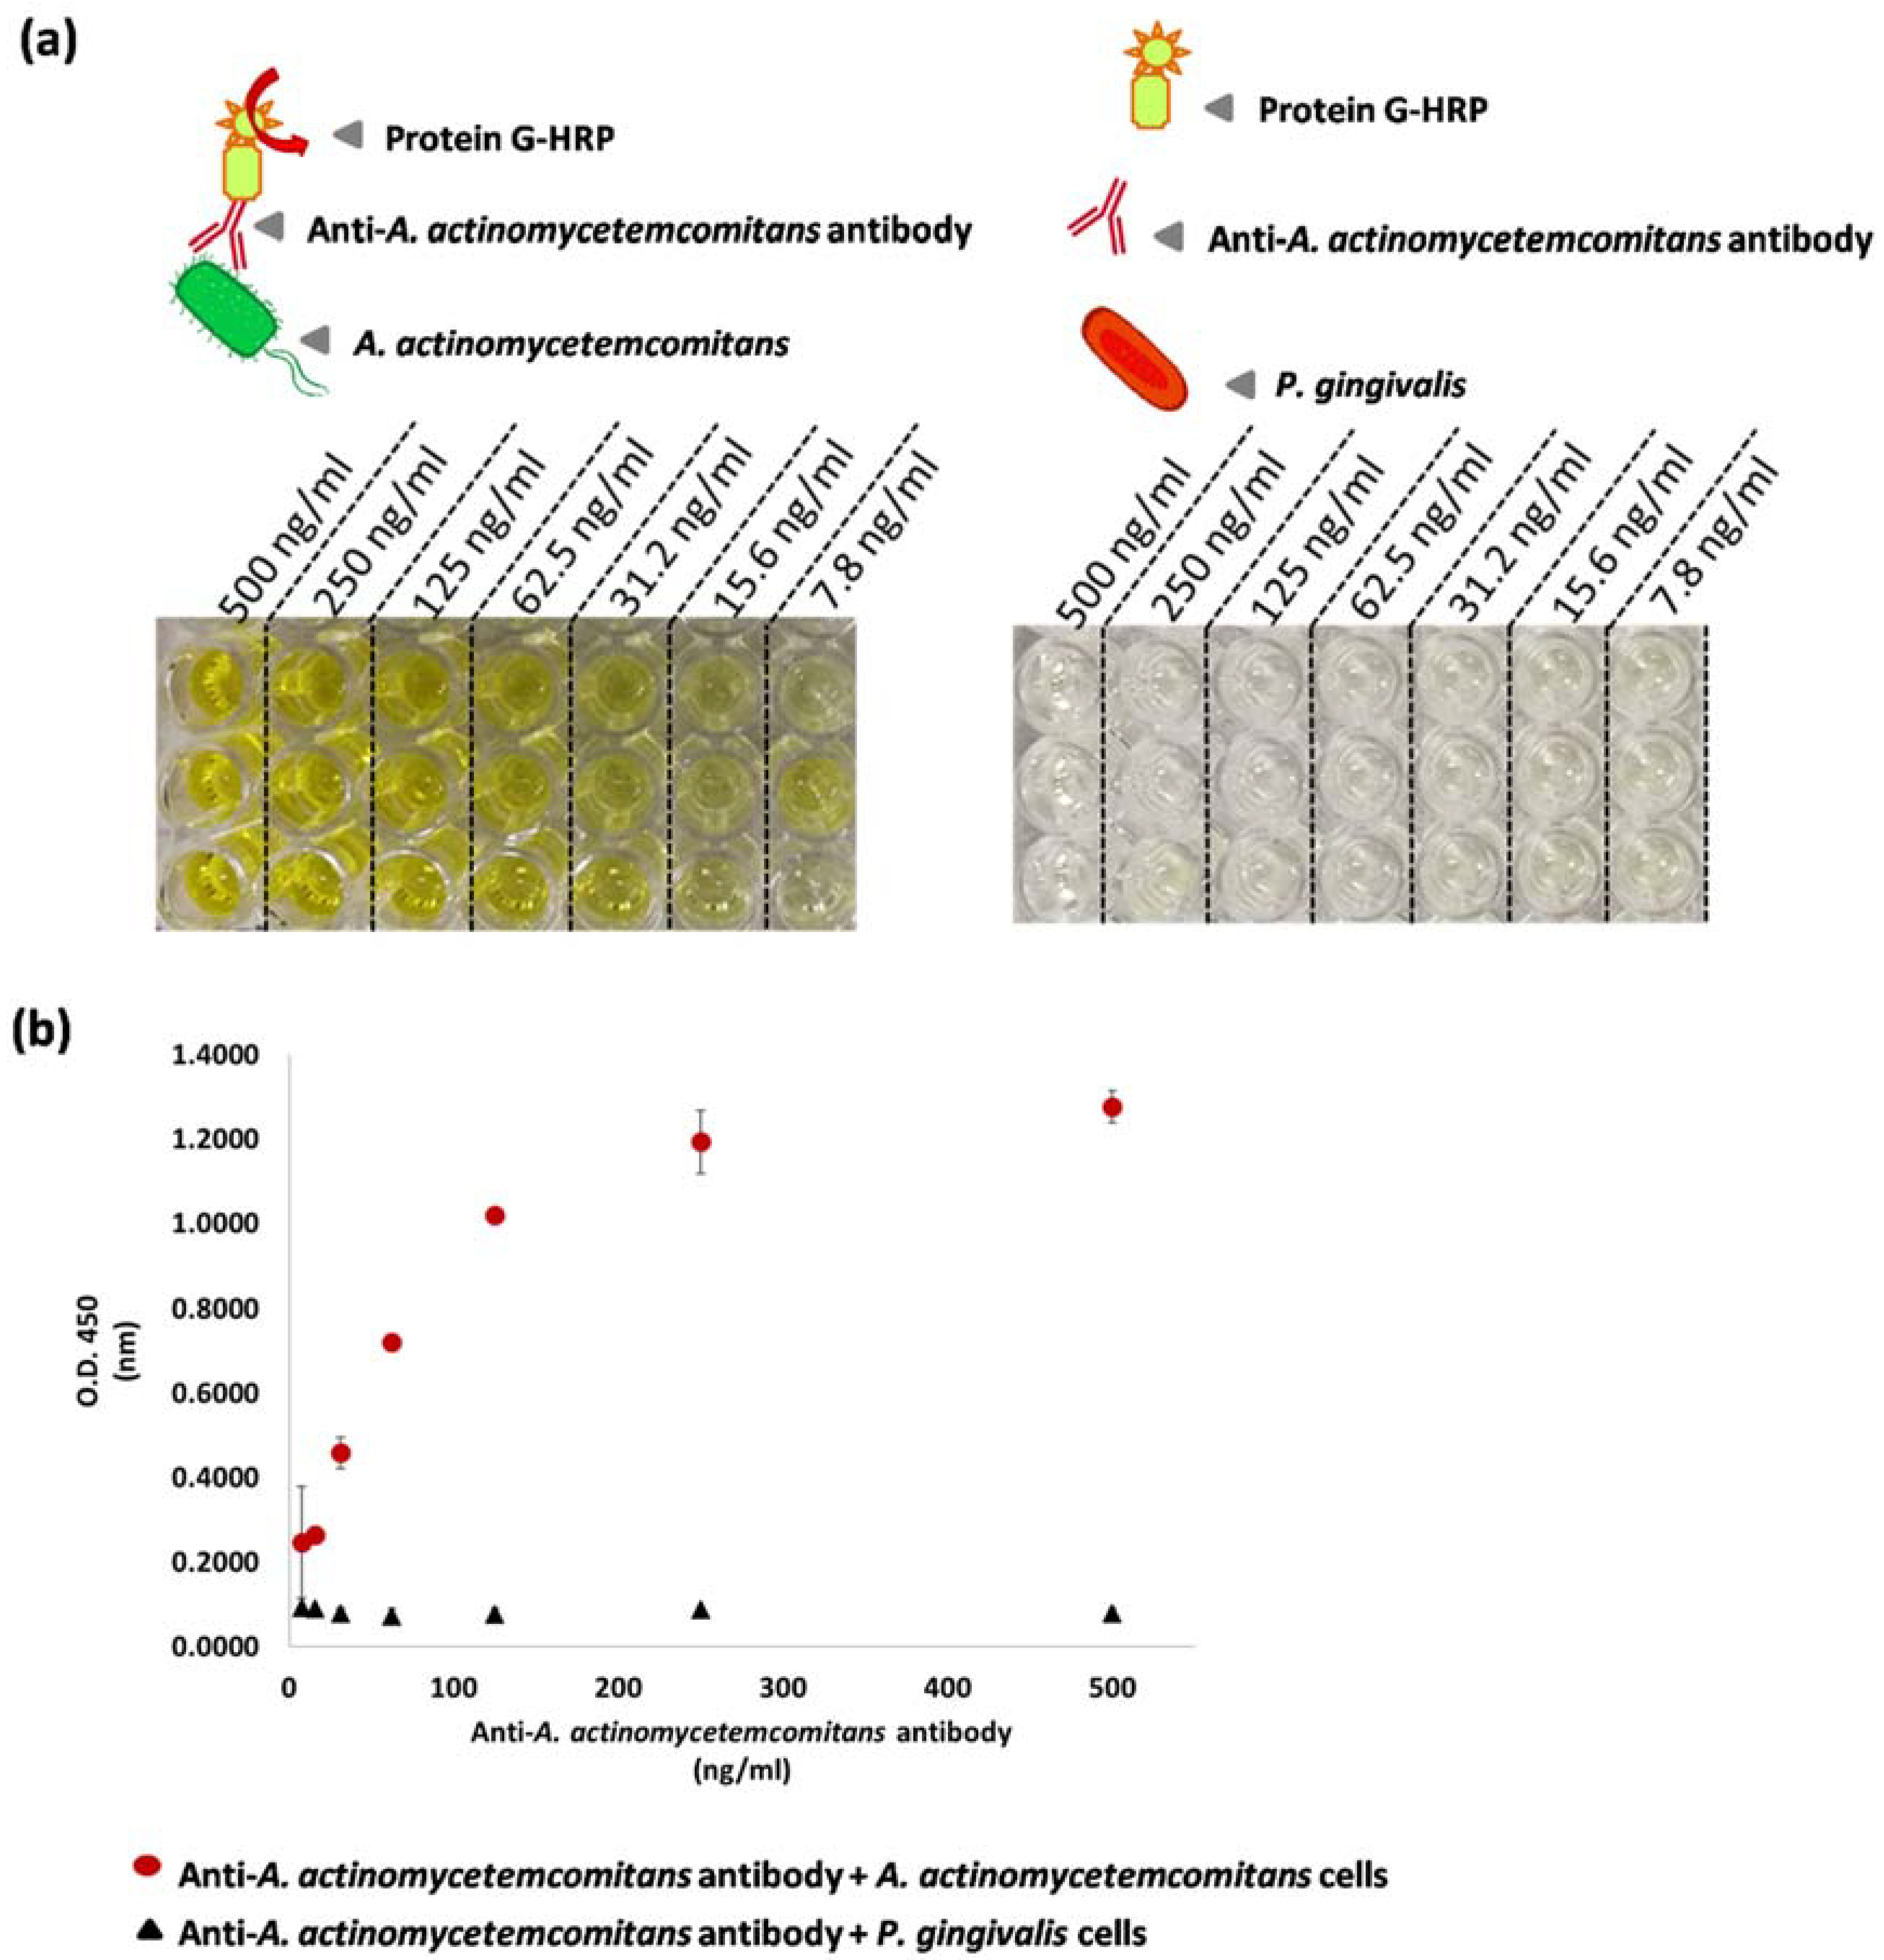
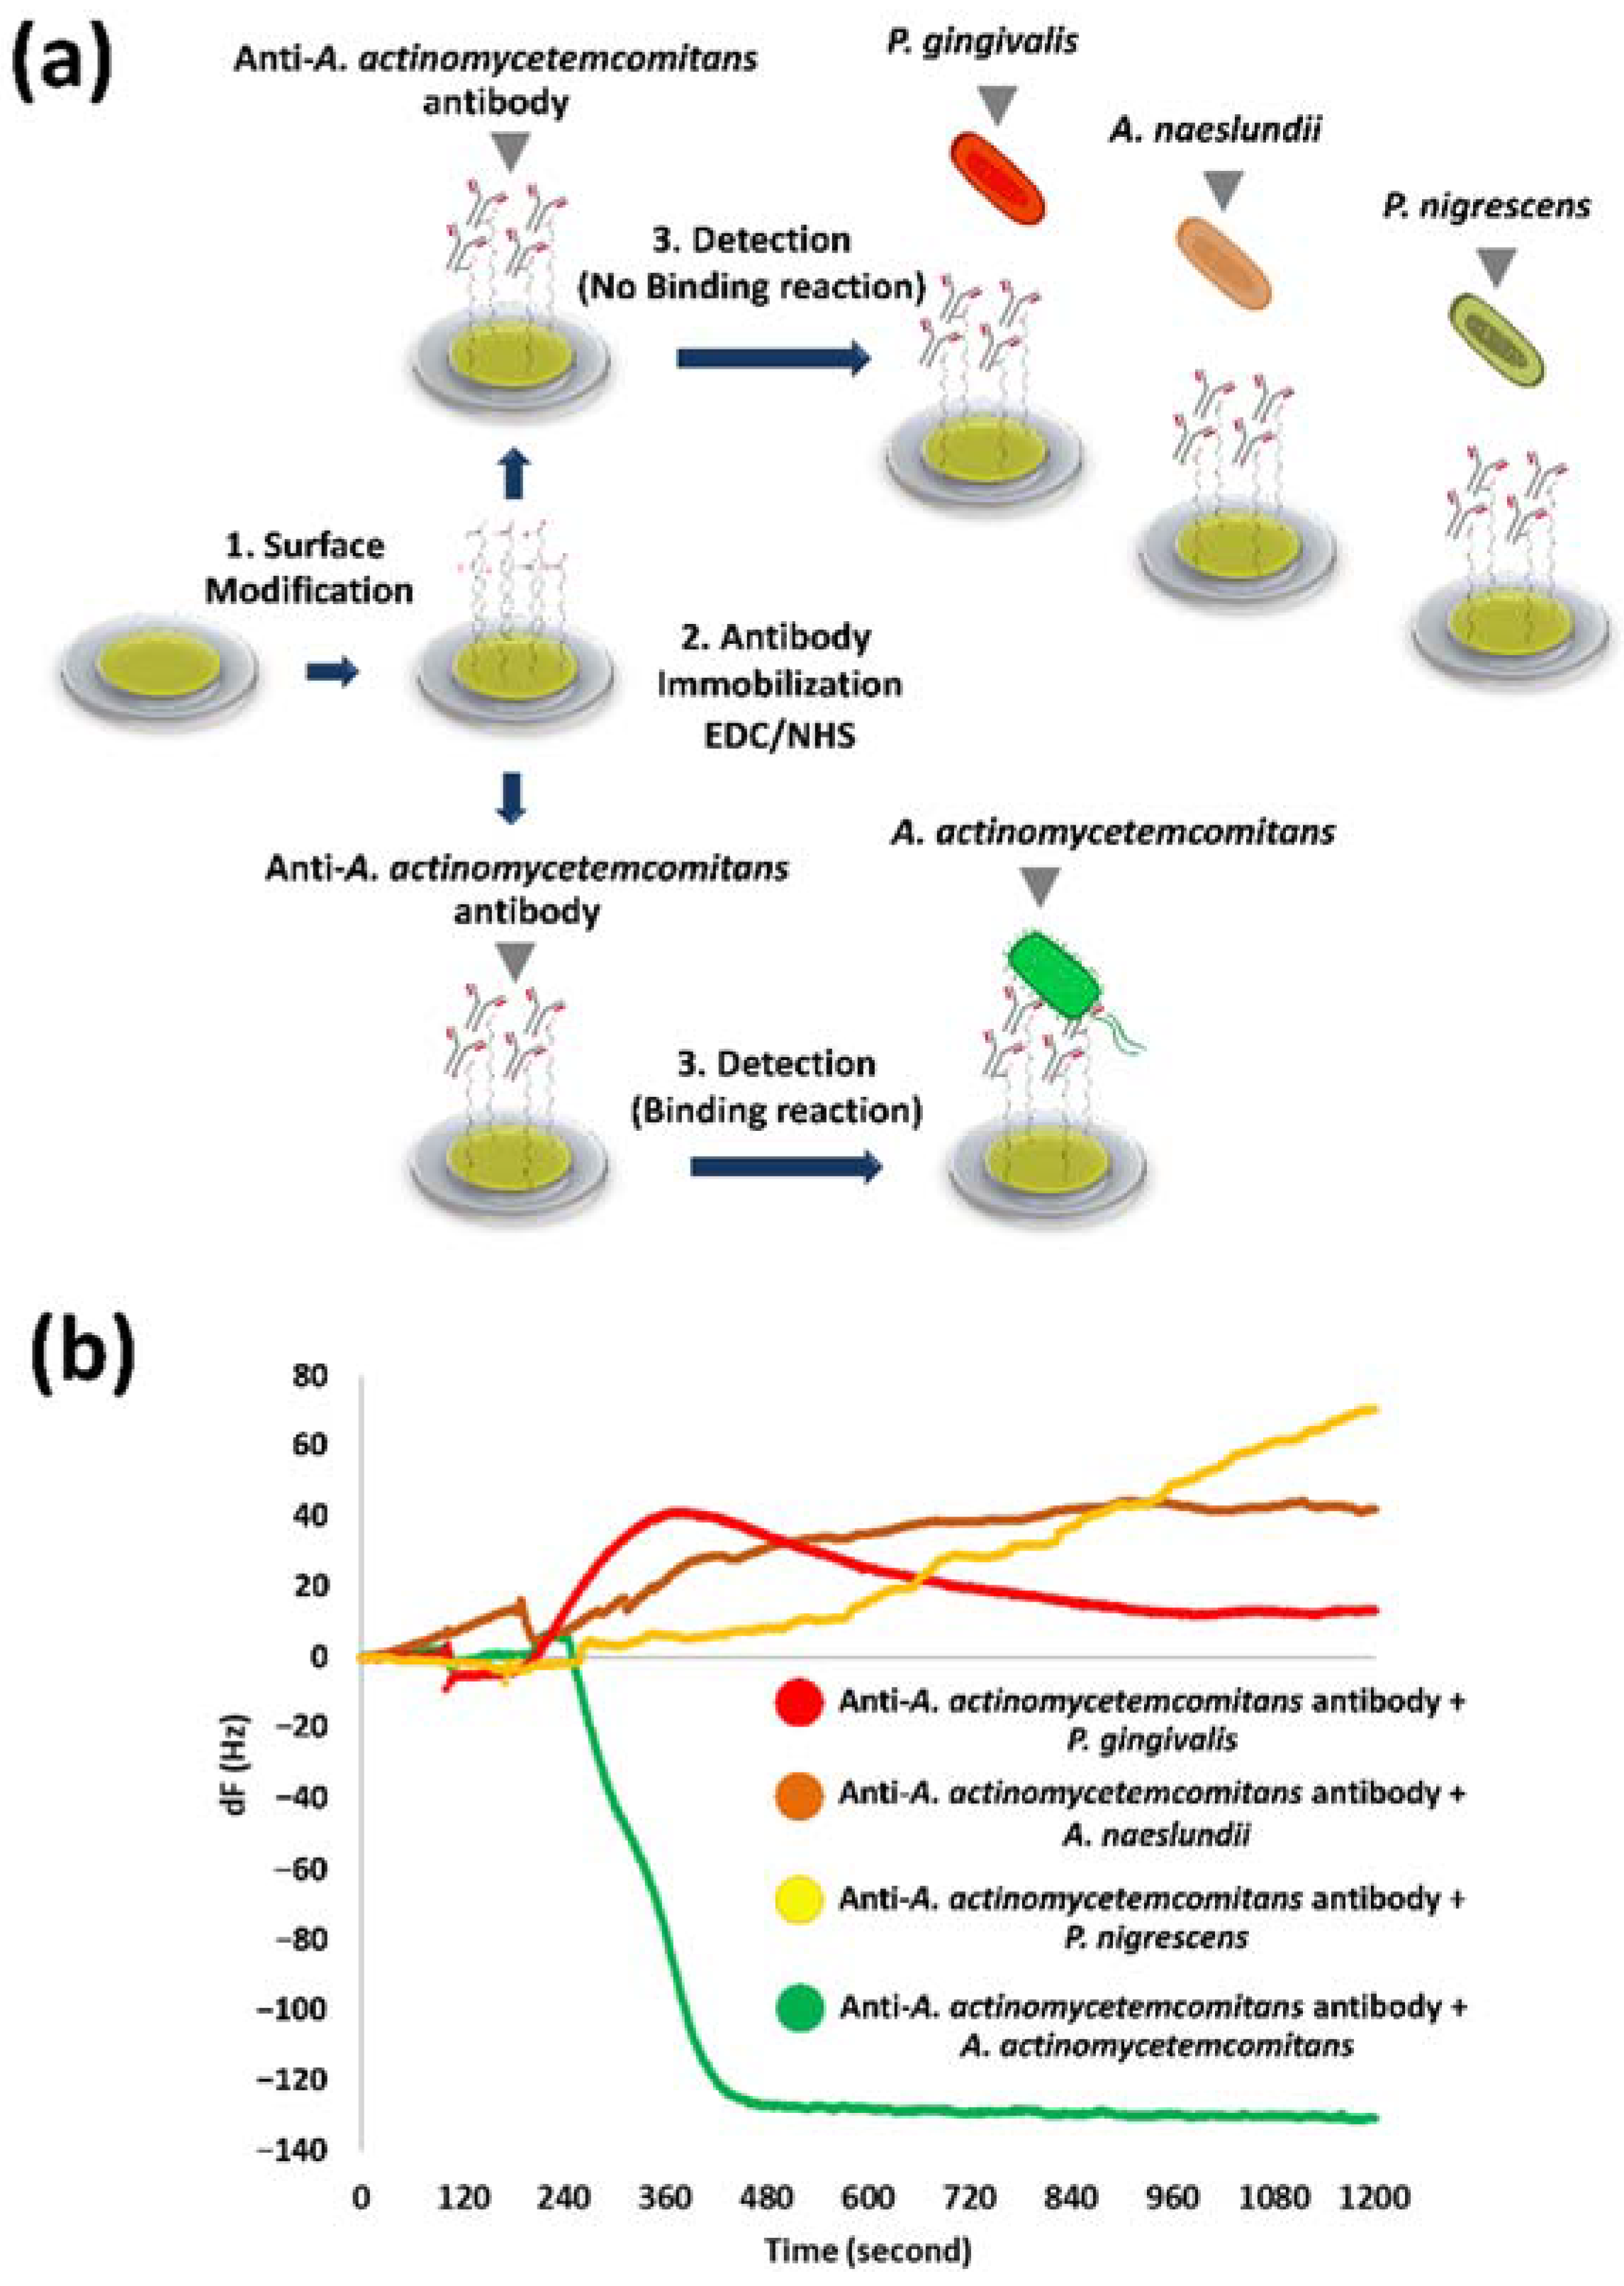
3.2. Specificity of Anti-A. actinomycetemcomitans Antibody

The ELISA experiment was performed to check the specificity of the antibody used in this study. A. actinomycetemcomitans and P. gingivalis cells were separately seeded in a 96-well plate overnight. Then, anti-A. actinomycetemcomitans antibody was added to test the binding with two different types of bacteria. The results shown in Figure 4 revealed that the absorbance at the wavelength of 450 nm was observed only in A. actinomycetemcomitans coated wells. The color of the A. actinomycetemcomitans coated wells turned yellow, while color change was not observed in P. gingivalis coated wells, as can be seen in Figure 4a. The concentration-dependent absorption at 450 nm could be obtained only for A. actinomycetemcomitans coated wells, as shown in Figure 4b. Thus, the specificity of the antibody for the detection of A. actinomycetemcomitans could be proved in the ELISA experiments.

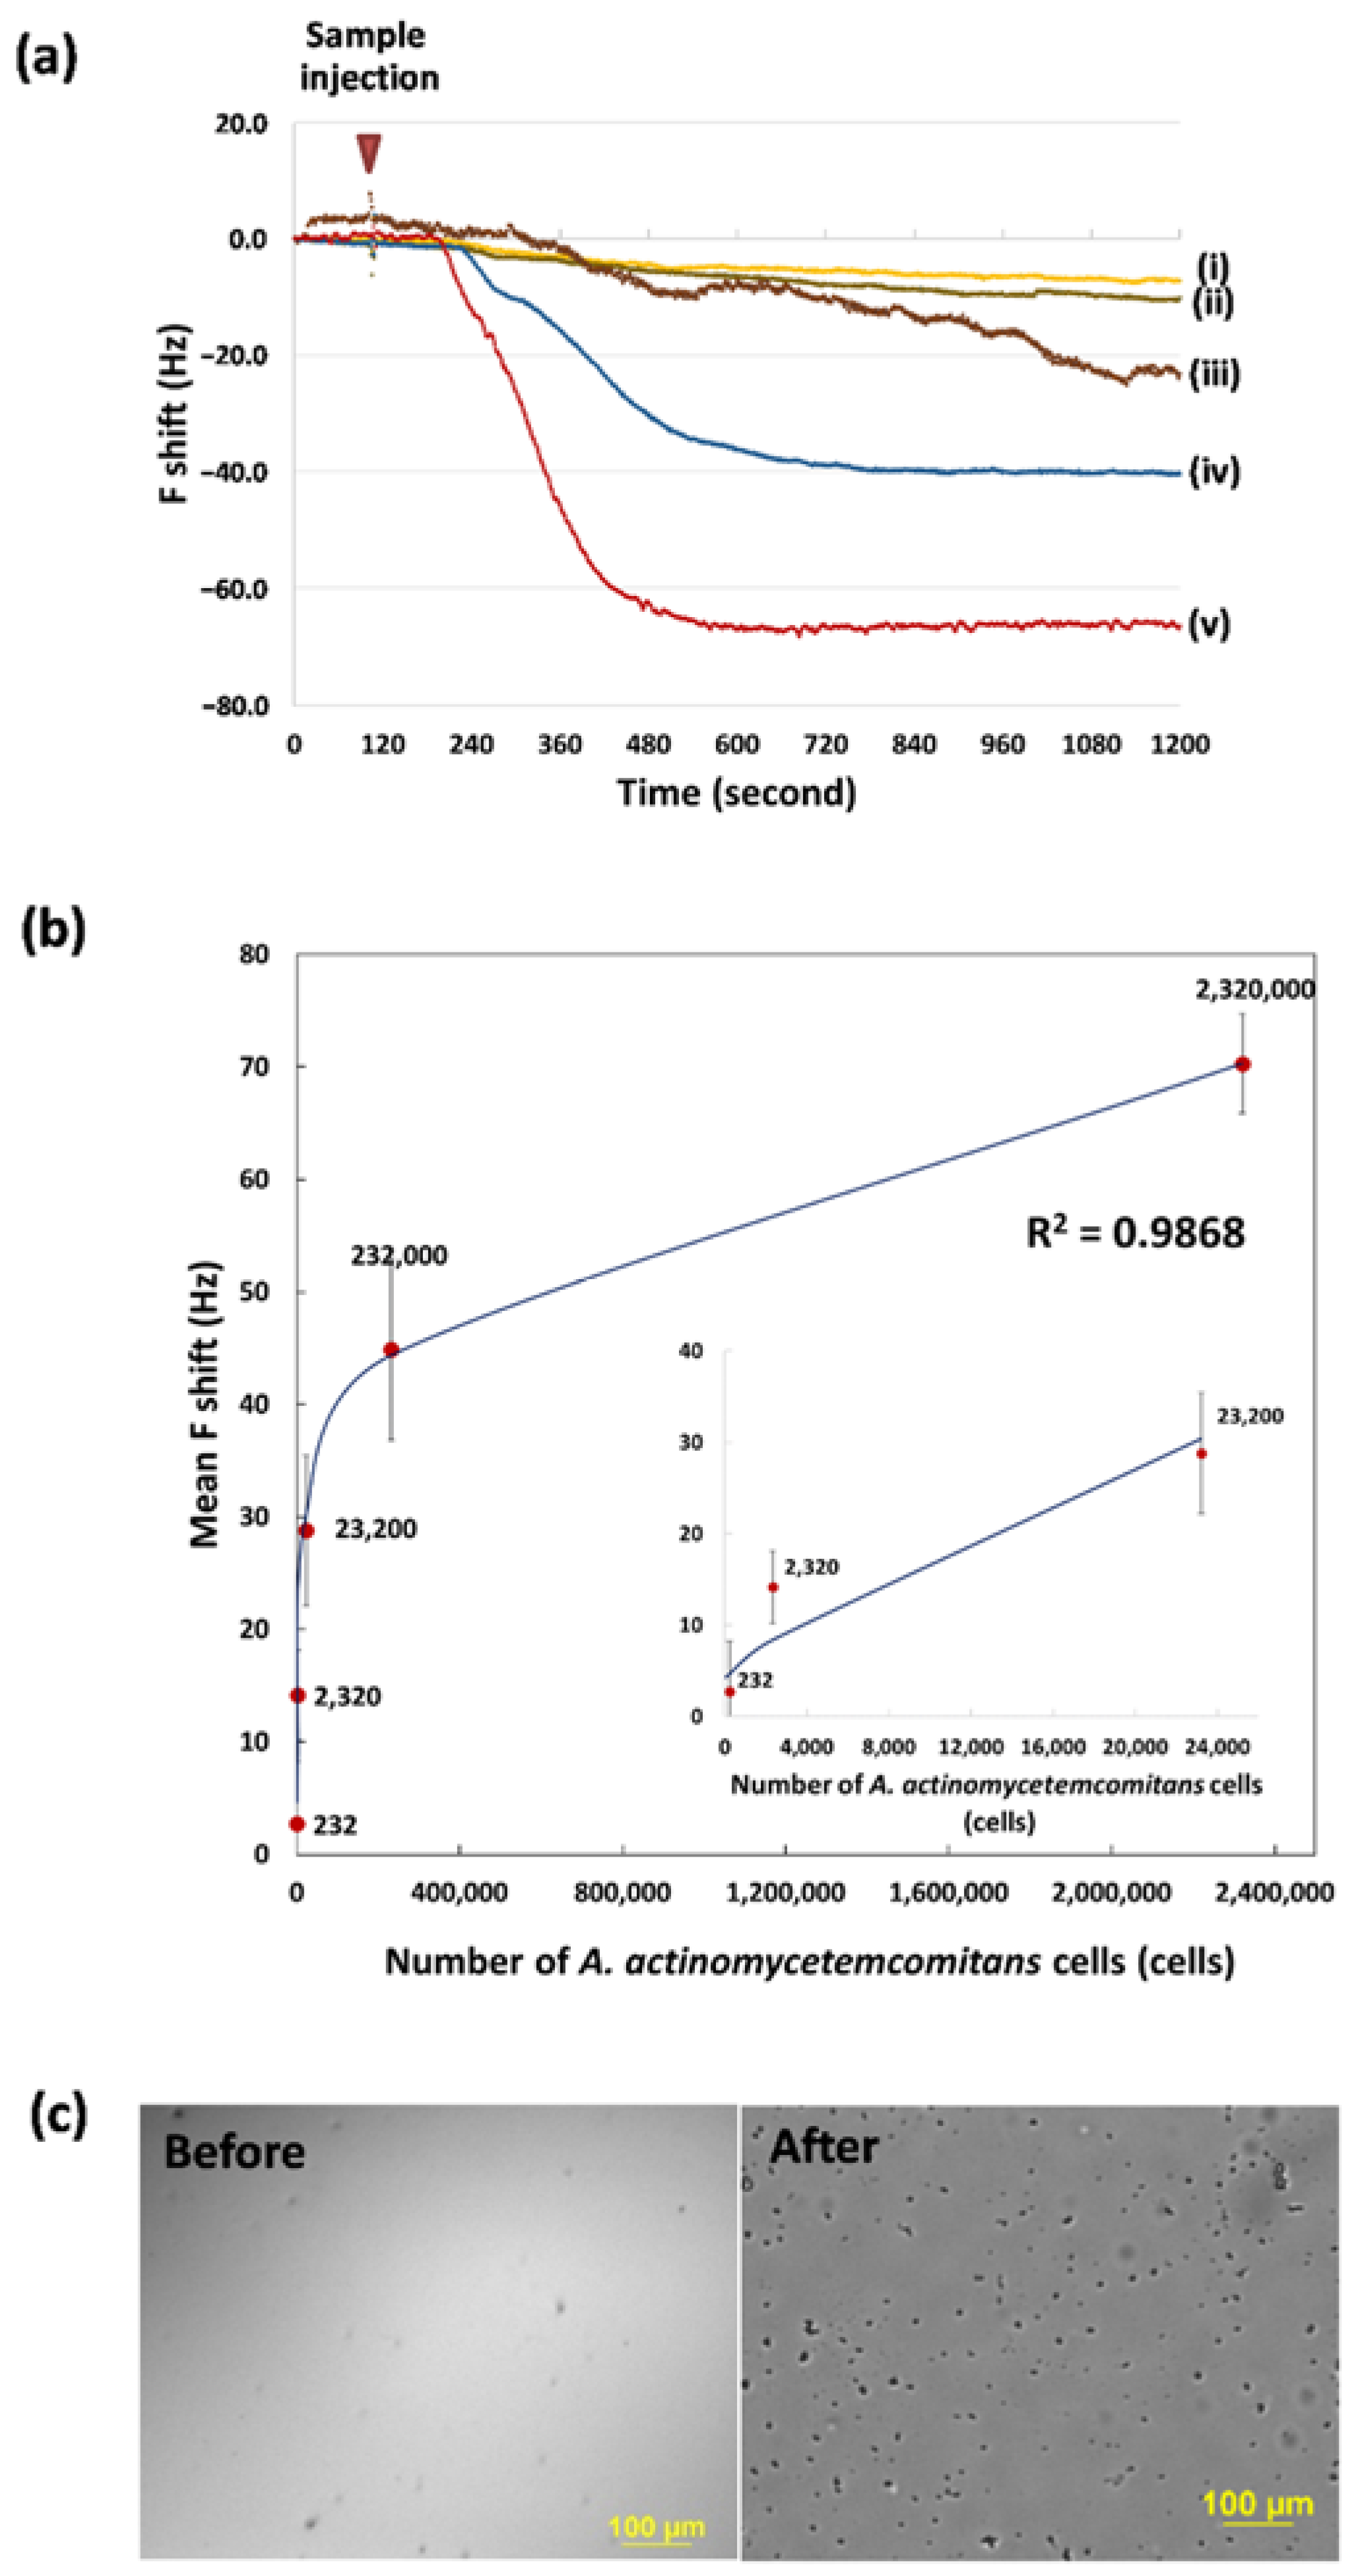
3.3. Determination of the Bacteria Concentration and Calibration Curves

QCM measurements were performed to determine the concentration of bacteria that were bound to their specific antibody on the modified gold surface of the QCM chip. As described previously, anti-A. actinomycetemcomitans antibody was immobilized on the gold surface using the 11-MUA SAM.
Figure 5b shows comparison of the responses of the QCM sensor to A. actinomycetemcomitans, P. gingivalis, P. nigrescens and A. naeslundii, respectively. The frequency signal of the QCM sensor gradually decreased upon adding the A. actinomycetemcomitans cells (200 µL of 1.16 × 10⁸ cells/mL) to the QCM surface and the frequency shift reached about 120 Hz in 7 min. On the other hand, the frequency shift could not be observed when P. gingivalis cells (200 µL of 1.16 × 10⁸ cells/mL), P. nigrescens cells (200 µL of 1.16 × 10⁸ cells/mL) and A. naeslundii cells (200 µL of 1.16 × 10⁸ cells/mL) were added to the sensor surface. Excellent specificity was therefore confirmed for detection of A. actinomycetemcomitans using the functionalized QCM chip with the 11-MUA SAM. The study by Reeves et al., 2014, confirmed the usability of A. actinomycetemcomitans mAb (325AA2) [23]. The monoclonal antibody was shown to be highly specific for A. actinomycetemcomitans cells [24].
For the calibration curve, 10-fold diluted solutions of A. actinomycetemcomitans cells were separately injected into the flow system. The response profiles of the QCM sensors to various concentrations of bacteria are shown in Figure S1 in the Supplementary Materials. Figure 6a shows the typical examples of the time courses for the frequency changes of the functionalized QCM chip in response to various concentrations of A. actinomycetemcomitans. The frequencies decreased in a concentration-dependent manner. The frequency shifts were approximately 7, 16, 24, 40 and 67 Hz for the numbers of A. actinomycetemcomitans cells in the range from 232 to 2.32 × 10⁶ cells. Figure 6b shows the calibration curve for A. actinomycetemcomitans, illustrating the correlation between the frequency shifts and the number of bacteria. Based on a regression equation, the lower detection limit was 800 cells with a dynamic range up to 2.32 × 10⁶ cells. Figure 6c shows the photographs of the surface of the functionalized QCM chip before and after adding the A. actinomycetemcomitans cells at the concentration of 1.16 × 10⁸ cells/mL. The surface functionalized with anti-A. actinomycetemcomitans antibody using the 11-MUA SAM was found to capture A. actinomycetemcomitans cells directly, suggesting that the antibody immobilization was successful and that bacteria attachment was rigid. These results clearly indicated that the frequency responses were resulted from specific binding after A. actinomycetemcomitans injection.
The limit of detection for the functionalized QCM chip developed in this study is comparable with other detection platforms, such as impedance detection, potentiometry, or surface plasmon resonance. Conventional detection methods of periodontal bacteria suffer from the multistep processing, such as bacteria culture and labelling of several reagents and signal enhancers. Among several kinds of periodontal bacteria, the threshold concentrations for T. denticola and P. intermedia were reported to be more than 100 folds higher than the threshold for A. actinomycetemcomitans [10], suggesting that the latter species may be more virulent. The relatively low threshold concentration for A. actinomycetemcomitans was also reported in other studies [25,26]. Their findings suggested that the levels above the critical threshold concentration would serve as a better predictor of periodontitis than its presence or absence. In our study, the specific antibody was used to develop the QCM immunosensor for the detection of A. actinomycetemcomitans, a periodontal pathogen and quantitative detection with a dynamic range up to 2.32 × 10⁶ cells. Moreover, a response time of 20 min has been demonstrated without any labelling materials.

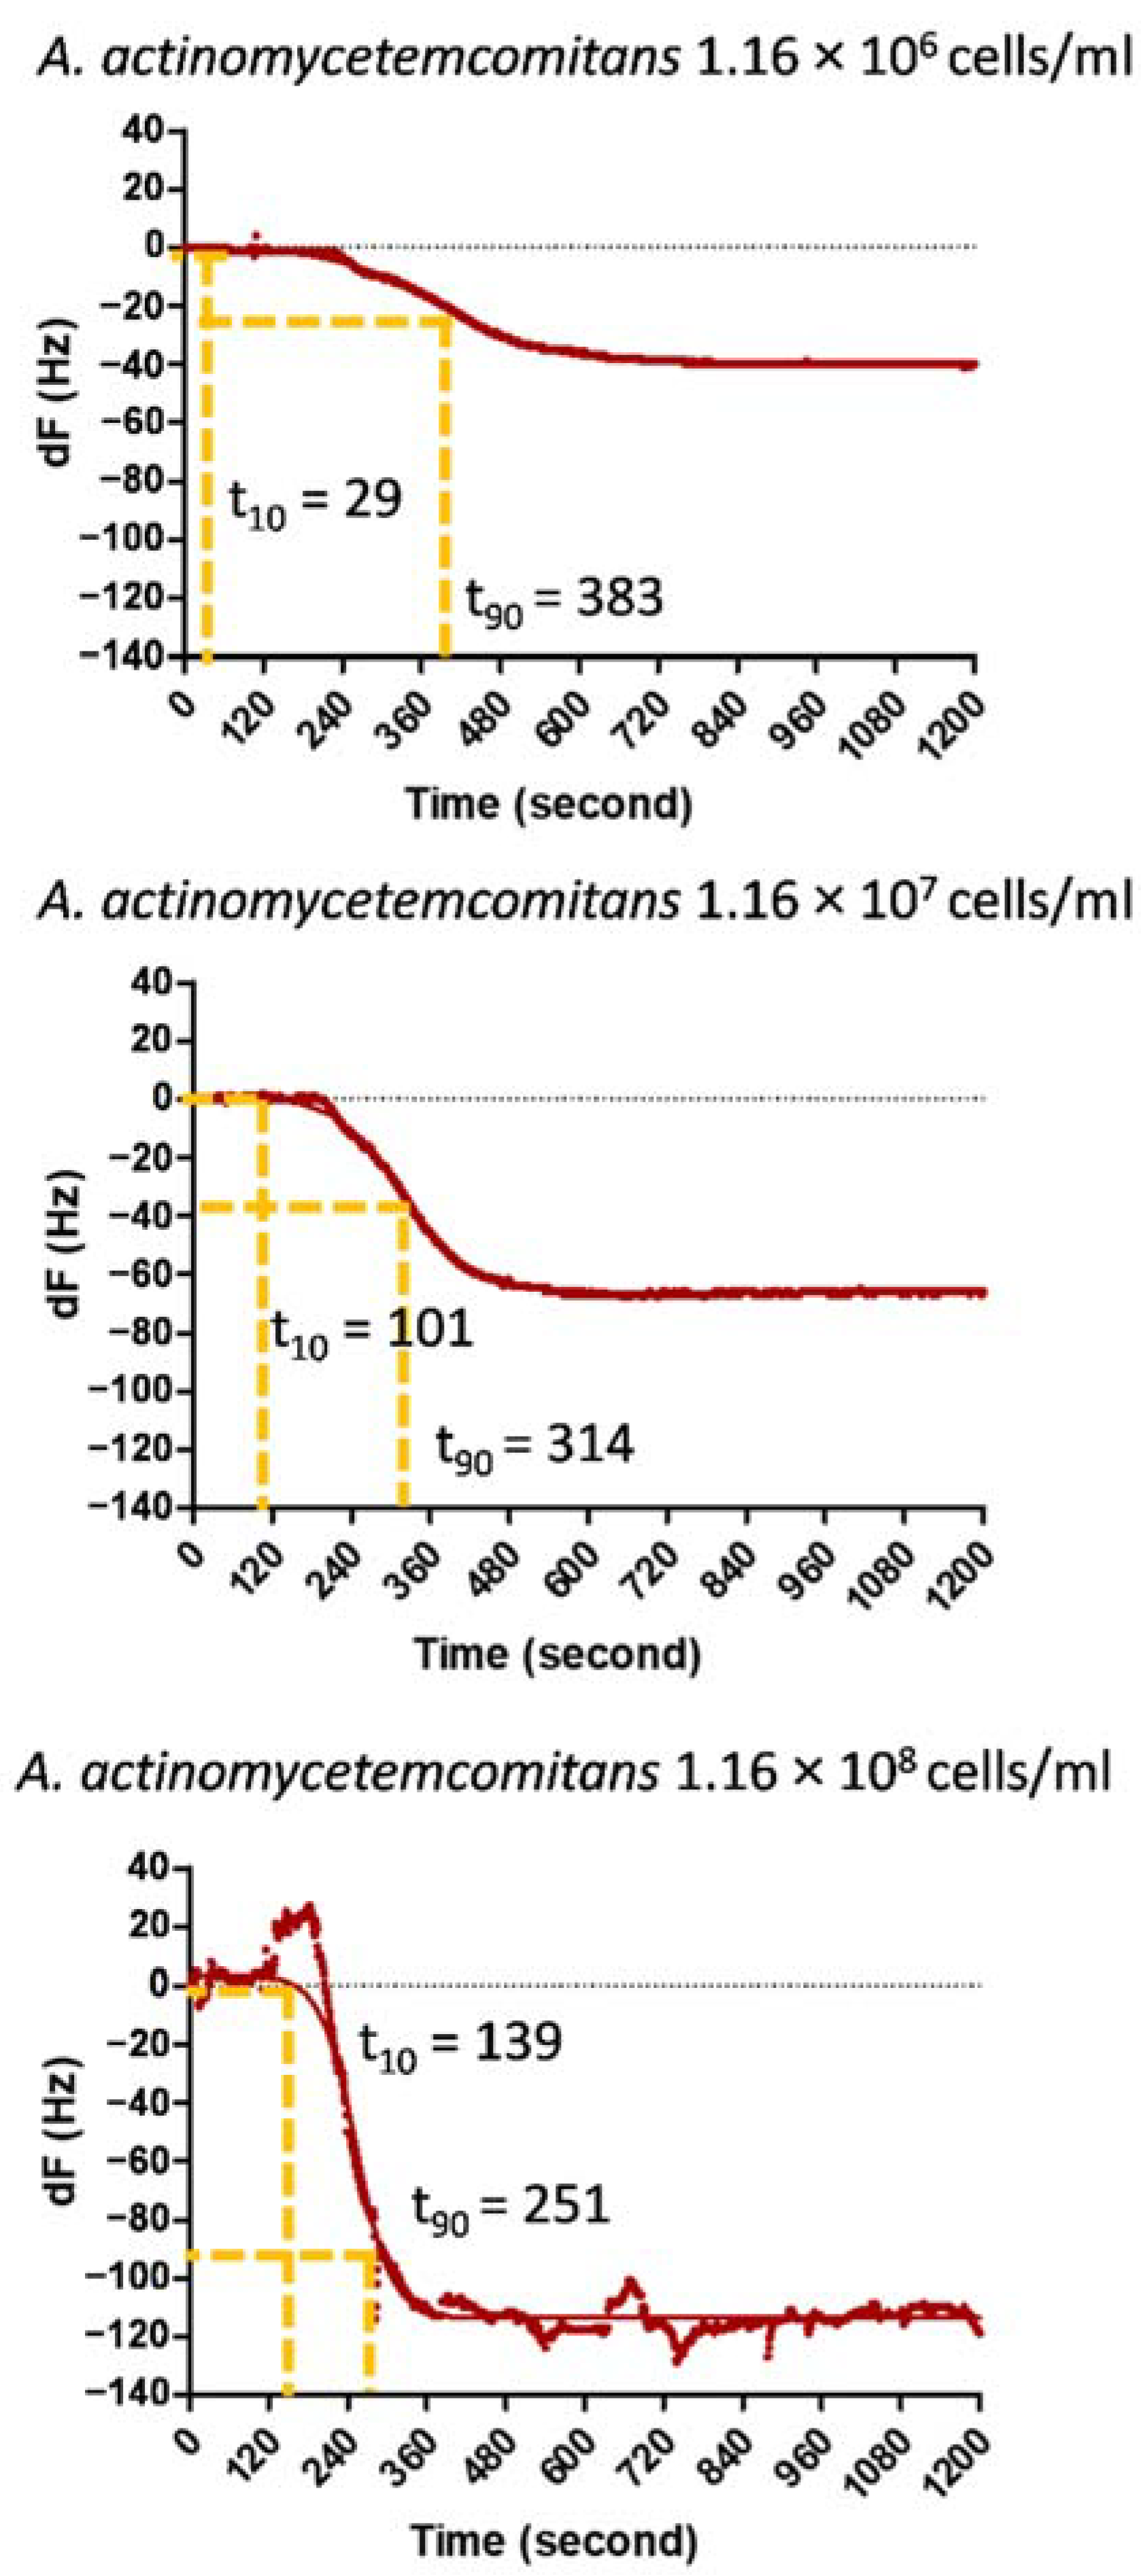
3.4. Response Time Analysis for the Frequency Shift

The frequency shifts (1200 datapoints) from all binding conditions were also used for analyzing the response times to investigate the binding kinetics between the antibody and the cell. In Figure 7, the curve fitting was performed by using nonlinear regression analysis. The times which are required for the QCM signal to reach 10% and 90% of the saturated values are expressed as t10 and t90, respectively. The t10 and t90 were calculated from the equation of the fitted curve and the response time (τ) of the binding was defined as the difference between t90 and t10. The response times were compared among each A. actinomycetemcomitans concentration, as shown in Table 2. It was found that the mean of the τ values decreased from 243 to 134 s, when the concentration of the A. actinomycetemcomitans cells increased from 1.16 × 10⁶ to 1.16 × 10⁸.
In the measurement system and the protocol in this study, A. actinomycetemcomitans cells in a sample solution were captured on the antibody modified QCM surface during the continuous sample flow. The binding between the immobilized antibody and the bacterial surface antigen was therefore performed at non-equilibrium state. In such a case, transient cell–surface interactions occur in addition to adhesion and binding at the surface of the antibody modified QCM. Some cells, such as MCF-7 cells and mesenchymal stem cells, were reported to exhibit the rolling behavior on specific antibody-immobilized surfaces under continuous flow conditions [27,28]. Cell rolling involves continuous formation and dissociation of affinity bonds between cells and the surface under fluid flow. On the surface of the gold electrode of the QCM sensor, the antibody was immobilized with high density and A. actinomycetemcomitans cells could be captured on the QCM surface with multi-site binding after transient cell–surface molecular interactions. Multi-site binding was effective to enhance binding strength and capturing efficiency [22,29]. As shown in Figure 7 and Table 2, the response time of the QCM sensor became shorter when the concentration of A. actinomycetemcomitans cells increased from 1.16 × 10⁶ to 1.16 × 10⁸ cells/mL, because the collision probability of the cells to the surface increased in the higher concentration. Cell capture performance was reported to be improved by increasing cell–substrate contact frequency using three-dimensional twisting flow with a patterned nanostructured channel. [30] Control of orientation of the immobilized antibody on the gold electrode would also be important to improve capture performance of the bacterial cells. The detailed study of the binding kinetic between antibody and the cell under flow condition is now in the process.
A comparison of the different detection methods for bacterial cells is given in Table 3. Although potentiometric and amperometric detection methods show better sensitivity, pretreatment of bacteria or secondary enzymatic reaction are required. The limit of detection achieved in this study was more or less similar to those of the reported methods using QCM and surface plasmon resonance (SPR) technique. Although, SPR and QCM have many features in common, they measure the signal in different ways. SPR detects the change in permittivity based on the plasmonic principle and is less sensitive to mechanical disruptions and viscoelastic effects. QCM measures the frequency of oscillations for a thin film deposited on the surface [31]. The method and the device developed in this study would be useful for assessment of periodontal disease.
Overall, QCM measurement, in this study, is an effective method that enables extremely sensitive, quantitative, real-time, label-free and noninvasive detection of molecules adsorbed on a solid surface.

4. Conclusions

We have successfully developed a cell-based immunoassay for the detection of A. actinomycetemcomitans utilizing a QCM sensor. A specific antibody was immobilized on the surface of the QCM chip and therefore the developed method did not require a labelling process. Simple, rapid and sensitive detection of periodontal bacteria would be realized just by adding the sample solution containing bacteria onto the surface of the QCM chip. In the present study, dual gold electrodes formed on the surface of the quartz substrate were used as a sample and a reference QCM sensor, respectively. It is possible to integrate several gold electrodes on the single quartz substrate for simultaneous detection of multiple periodontal bacteria. In order to understand periodontal disease in more detail and predict progression of periodontitis, it is desirable to analyze information of multiple bacteria simultaneously. Periodontal disease is a complex host response composed of a broad array of inflammatory cells and the mediators derived from cells resident in the gingival tissues, as well as emigrating inflammatory cells. Recent studies revealed that Gram-negative anaerobic bacteria, such as A. actinomycetemcomitans, P. gingivalis, T. forsythia, T. denticola and P. intermedia, were strongly associated with periodontal disease [10,38]. Moreover, the development of periodontal and peri-implant lesions was reported to be related to real raise of bacterial counts estimated for A. actinomycetemcomitans, P. gingivalis, T. forsythia, P. intermedia, T. denticola [39]. Based on the method and the device developed in this study, integrated QCM sensors with different kinds of antibodies can be developed to detect the above five bacteria simultaneously and to analyze the trends of the concentrations of these bacteria for clinical diagnostics of periodontal disease at an early stage. Since the QCM technology is well established and reliable measurements can be performed with a small instrument, our device would be useful as a simple, rapid and sensitive detection tool not only for clinical research but also for a chairside device in a dental office.

Supplementary Materials

The following are available online at https://www.mdpi.com/article/10.3390/chemosensors9070159/s1, Figure S1: Response profiles of A. actinomycetemcomitans antibody-immobilized sensors for A. actinomycetemcomitans cells detection.

Author Contributions

Conceptualization, Y.M., M.T. and S.R.; methodology, S.R.; C.R. and W.B.; software, S.R. and P.S.; validation, S.R. and M.S.; formal analysis, S.R. and M.S.; investigation, Y.M. and M.S.; resources, Y.M., M.T. and Y.T.; data curation, S.R.; writing—original draft preparation, S.R.; writing—review and editing, S.R., Y.M., M.S. and M.T.; visualization, S.R.; supervision, Y.M., M.S. and M.T.; project administration, M.T.; funding acquisition, S.R., Y.M., M.S. and M.T. All authors have read and agreed to the published version of the manuscript.

Funding

This work was supported in part by the OVERSEAS RESEARCH EXPERIENCE SCHOLARSHIP for Graduate Student, Graduate School and Faculty of Engineering, Chulalongkorn University, by THE JAPAN SCIENCE AND TECHNOLOGY AGENCY (JST) through COI Grant Number JPMJCE1305, by THE MINISTRY OF EDUCATION, CULTURE, SPORTS, SCIENCE AND TECHNOLOGY (MEXT) as part of the Research Center for Biomedical Engineering and by THE NIPPON SHEET GLASS FOUNDATION FOR MATERIALS SCIENCE AND ENGINEERING.

Conflicts of Interest

The authors declare that they have no known competing financial interests or personal relationships that could have appeared to influence the work reported in this paper.

References

  1. Chang, H.-J.; Lee, S.-J.; Yong, T.-H.; Shin, N.-Y.; Jang, B.-G.; Kim, J.-E.; Huh, K.-H.; Lee, S.-S.; Heo, M.-S.; Choi, S.-C.; et al. Deep Learning Hybrid Method to Automatically Diagnose Periodontal Bone Loss and Stage Periodontitis. Sci. Rep. 2020, 10, 7531. [Google Scholar] [CrossRef]
  2. He, W.; You, M.; Wan, W.; Xu, F.; Li, F.; Li, A. Point-of-Care Periodontitis Testing: Biomarkers, Current Technologies, and Perspectives. Trends Biotechnol. 2018, 36, 1127–1144. [Google Scholar] [CrossRef]
  3. Dewhirst, F.E.; Chen, T.; Izard, J.; Paster, B.J.; Tanner, A.C.R.; Yu, W.-H.; Lakshmanan, A.; Wade, W.G. The Human Oral Microbiome. J. Bacteriol. 2010, 192, 5002. [Google Scholar] [CrossRef] [Green Version]
  4. Hajishengallis, G.; Liang, S.; Payne, M.A.; Hashim, A.; Jotwani, R.; Eskan, M.A.; McIntosh, M.L.; Alsam, A.; Kirkwood, K.L.; Lambris, J.D.; et al. Low-Abundance Biofilm Species Orchestrates Inflammatory Periodontal Disease through the Commensal Microbiota and Complement. Cell Host Microbe 2011, 10, 497–506. [Google Scholar] [CrossRef] [PubMed] [Green Version]
  5. Slots, J. Periodontitis: Facts, fallacies and the future. Periodontology 2000 2017, 75, 7–23. [Google Scholar] [CrossRef]
  6. Nomura, Y.; Takeuchi, H.; Okamoto, M.; Sogabe, K.; Okada, A.; Hanada, N. Chair-side detection of Prevotella Intermedia in mature dental plaque by its fluorescence. Photodiagn. Photodyn. Ther. 2017, 18, 335–341. [Google Scholar] [CrossRef] [PubMed]
  7. Suzuki, N.; Yoneda, M.; Hirofuji, T. Mixed Red-Complex Bacterial Infection in Periodontitis. Int. J. Dent. 2013, 2013, 587279. [Google Scholar] [CrossRef]
  8. Park, O.J.; Yi, H.; Jeon, J.H.; Kang, S.S.; Koo, K.T.; Kum, K.Y.; Chun, J.; Yun, C.H.; Han, S.H. Pyrosequencing Analysis of Subgingival Microbiota in Distinct Periodontal Conditions. J. Dent. Res. 2015, 94, 921–927. [Google Scholar] [CrossRef] [PubMed]
  9. Scapoli, L.; Girardi, A.; Palmieri, A.; Martinelli, M.; Cura, F.; Lauritano, D.; Carinci, F. Quantitative Analysis of Periodontal Pathogens in Periodontitis and Gingivitis. J. Biol. Regul. Homeost. Agents 2015, 29, 101–110. [Google Scholar] [PubMed]
  10. Torrungruang, K.; Jitpakdeebordin, S.; Charatkulangkun, O.; Gleebbua, Y. Porphyromonas gingivalis, Aggregatibacter actinomycetemcomitans, and Treponema denticola/Prevotella intermedia Co-Infection are Associated with Severe Periodontitis in a Thai Population. PLoS ONE 2015, 10, e0136646. [Google Scholar] [CrossRef]
  11. Ahmed, A.; Rushworth, J.V.; Hirst, N.A.; Millner, P.A. Biosensors for Whole-Cell Bacterial Detection. Clin. Microbiol. Rev. 2014, 27, 631. [Google Scholar] [CrossRef] [PubMed] [Green Version]
  12. Malagi, S. Chairside Diagnostic Test Kits In Periodontics—A Review. Int. Arab J. Dent. 2015, 30, 99–102. [Google Scholar]
  13. Ravishankar, P.; Mithra, D.; Chakraborty, P.; Kumar, A. Chairside diagnostics in periodontics. SRM J. Res. Dent. Sci. 2017, 8, 78–81. [Google Scholar] [CrossRef]
  14. Yamamoto, Y. PCR in diagnosis of infection: Detection of bacteria in cerebrospinal fluids. Clin. Diagn. Lab. Immunol. 2002, 9, 508–514. [Google Scholar] [CrossRef] [Green Version]
  15. Brosel-Oliu, S.; Abramova, N.; Uria, N.; Bratov, A. Impedimetric transducers based on interdigitated electrode arrays for bacterial detection—A review. Anal. Chim. Acta 2019, 1088, 1–19. [Google Scholar] [CrossRef] [PubMed]
  16. Chen, J.Y.; Penn, L.S.; Xi, J. Quartz crystal microbalance: Sensing cell-substrate adhesion and beyond. Biosens. Bioelectron. 2018, 99, 593–602. [Google Scholar] [CrossRef] [PubMed]
  17. Uekubo, A.; Hiratsuka, K.; Aoki, A.; Takeuchi, Y.; Abiko, Y.; Izumi, Y. Effect of antimicrobial photodynamic therapy using rose bengal and blue light-emitting diode on Porphyromonas gingivalis in vitro: Influence of oxygen during treatment. Laser Ther. 2016, 25, 299–308. [Google Scholar] [CrossRef] [PubMed] [Green Version]
  18. Komazaki, R.; Katagiri, S.; Takahashi, H.; Maekawa, S.; Shiba, T.; Takeuchi, Y.; Kitajima, Y.; Ohtsu, A.; Udagawa, S.; Sasaki, N.; et al. Periodontal pathogenic bacteria, Aggregatibacter actinomycetemcomitans affect non-alcoholic fatty liver disease by altering gut microbiota and glucose metabolism. Sci. Rep. 2017, 7, 13950. [Google Scholar] [CrossRef]
  19. Hai, W.; Goda, T.; Takeuchi, H.; Yamaoka, S.; Horiguchi, Y.; Matsumoto, A.; Miyahara, Y. Human influenza virus detection using sialyllactose-functionalized organic electrochemical transistors. Sens. Actuators B Chem. 2018, 260, 635–641. [Google Scholar] [CrossRef]
  20. Goda, T.; Miyahara, Y. Thermo-responsive molecular switches for ATP using hairpin DNA aptamers. Biosens. Bioelectron. 2011, 26, 3949–3952. [Google Scholar] [CrossRef]
  21. Poirier, G.E.; Tarlov, M.J.; Rushmeier, H.E. Two-Dimensional Liquid Phase and the px.sqroot.3 Phase of Alkanethiol Self-Assembled Monolayers on Au(111). Langmuir 1994, 10, 3383–3386. [Google Scholar] [CrossRef]
  22. Horiguchi, Y.; Goda, T.; Matsumoto, A.; Takeuchi, H.; Yamaoka, S.; Miyahara, Y. Direct and label-free influenza virus detection based on multisite binding to sialic acid receptors. Biosens. Bioelectron. 2017, 92, 234–240. [Google Scholar] [CrossRef] [PubMed]
  23. Reeves, B.D.; Young, M.; Grieco, P.A.; Suci, P. Aggregatibacter actinomycetemcomitans biofilm killing by a targeted ciprofloxacin prodrug. Biofouling 2013, 29, 1005–1014. [Google Scholar] [CrossRef] [Green Version]
  24. Gmur, R. Monoclonal antibodies for the rapid identification in clinical samples of Peptostreptococcus micros and Actinobacillus actinomycetemcomitans serotypes a, d, and e. Med. Microbiol. Lett. 1996, 5, 335–349. [Google Scholar]
  25. Papapanou, P.N.; Teanpaisan, R.; Obiechina, N.S.; Pithpornchaiyakul, W.; Pongpaisal, S.; Pisuithanakan, S.; Baelum, V.; Fejerskov, O.; Dahlén, G. Periodontal microbiota and clinical periodontal status in a rural sample in southern Thailand. Eur. J. Oral Sci. 2002, 110, 345–352. [Google Scholar] [CrossRef] [PubMed]
  26. Laine, M.L.; Moustakis, V.; Koumakis, L.; Potamias, G.; Loos, B.G. Modeling Susceptibility to Periodontitis. J. Dent. Res. 2012, 92, 45–50. [Google Scholar] [CrossRef]
  27. Mahara, A.; Yamaoka, T. Continuous separation of cells of high osteoblastic differentiation potential from mesenchymal stem cells on an antibody-immobilized column. Biomaterials 2010, 31, 4231–4237. [Google Scholar] [CrossRef]
  28. Myung, J.H.; Launiere, C.A.; Eddington, D.T.; Hong, S. Enhanced Tumor Cell Isolation by a Biomimetic Combination of E-selectin and anti-EpCAM: Implications for the Effective Separation of Circulating Tumor Cells (CTCs). Langmuir 2010, 26, 8589–8596. [Google Scholar] [CrossRef] [Green Version]
  29. Myung, J.H.; Gajjar, K.A.; Chen, J.; Molokie, R.E.; Hong, S. Differential detection of tumor cells using a combination of cell rolling, multivalent binding, and multiple antibodies. Anal. Chem. 2014, 86, 6088–6094. [Google Scholar] [CrossRef] [Green Version]
  30. Stroock, A.D.; Dertinger, S.K.; Ajdari, A.; Mezic, I.; Stone, H.A.; Whitesides, G.M. Chaotic mixer for microchannels. Science 2002, 295, 647–651. [Google Scholar] [CrossRef] [PubMed] [Green Version]
  31. Fang, J.; Ren, C.; Zhu, T.; Wang, K.; Jiang, Z.; Ma, Y. Comparison of the different responses of surface plasmon resonance and quartz crystal microbalance techniques at solid–liquid interfaces under various experimental conditions. Analyst 2015, 140, 1323–1336. [Google Scholar] [CrossRef]
  32. Zhu, T.; Pei, Z.; Huang, J.; Xiong, C.; Shi, S.; Fang, J. Detection of bacterial cells by impedance spectra via fluidic electrodes in a microfluidic device. Lab Chip 2010, 10, 1557–1560. [Google Scholar] [CrossRef]
  33. Wan, Y.; Zhang, D.; Hou, B. Selective and specific detection of sulfate-reducing bacteria using potentiometric stripping analysis. Talanta 2010, 82, 1608–1611. [Google Scholar] [CrossRef]
  34. Li, Y.; Fang, L.; Cheng, P.; Deng, J.; Jiang, L.; Huang, H.; Zheng, J. An electrochemical immunosensor for sensitive detection of Escherichia coli O157:H7 using C60 based biocompatible platform and enzyme functionalized Pt nanochains tracing tag. Biosens. Bioelectron. 2013, 49, 485–491. [Google Scholar] [CrossRef] [PubMed]
  35. Yang, X.; Gu, C.; Qian, F.; Li, Y.; Zhang, J.Z. Highly Sensitive Detection of Proteins and Bacteria in Aqueous Solution Using Surface-Enhanced Raman Scattering and Optical Fibers. Anal. Chem. 2011, 83, 5888–5894. [Google Scholar] [CrossRef]
  36. Gasparyan, V.K.; Bazukyan, I.L. Lectin sensitized anisotropic silver nanoparticles for detection of some bacteria. Anal. Chim. Acta 2013, 766, 83–87. [Google Scholar] [CrossRef]
  37. Jiang, X.; Wang, R.; Wang, Y.; Su, X.; Ying, Y.; Wang, J.; Li, Y. Evaluation of different micro/nanobeads used as amplifiers in QCM immunosensor for more sensitive detection of E. coli O157:H7. Biosens. Bioelectron. 2011, 29, 23–28. [Google Scholar] [CrossRef] [PubMed]
  38. Farias, B.C.; Souza, P.R.E.; Ferreira, B.; Melo, R.S.A.; Machado, F.B.; Gusmão, E.S.; Cimões, R. Occurrence of periodontal pathogens among patients with chronic periodontitis. Braz. J. Microbiol. 2012, 43, 909–916. [Google Scholar] [CrossRef] [PubMed] [Green Version]
  39. Nastych, O.; Goncharuk-Khomyn, M.; Foros, A.; Cavalcanti, A.; Yavuz, I.; Tsaryk, V. Comparison of Bacterial Load Parameters in Subgingival Plaque during Peri-implantitis and Periodontitis Using the RT-PCR Method. Acta Stomatol. Croat. 2020, 54, 32–43. [Google Scholar] [CrossRef] [PubMed]
Figure 1. Measurement system: (a) QCM sensor chip surfaces; (b) schematic of the QCM sensing system for quantitative assessment of periodontal bacteria.
Chemosensors 09 00159 g001
Figure 2. Strategy for immobilizing antibody to carboxylate-terminated SAM (11-MUA) on gold through EDC/NHS chemistry.
Chemosensors 09 00159 g002
Figure 3. Characterization of the self-assembled monolayer of 11-MUA on a gold electrode by cyclic voltammetry. The cyclic voltammograms of the bare gold electrode (black) and 11-MUA-modified gold electrode (red) after 12 h of 11-MUA modification. The cyclic voltammogram of 11-MUA-modified-gold indicates the Au-S bond reduction peak area at −0.95 V vs. Ag/AgCl (red area). Electrodes: working electrode, Au; counter electrode, Pt; reference electrode, Ag/AgCl wire (in 3.3 M KCl with a salt bridge). Scan rate: 0.1 V/s.
Chemosensors 09 00159 g003
Figure 4. Specificity of Anti-A. actinomycetemcomitans antibody. Anti-A. actinomycetemcomitans antibody specifically binds to A. actinomycetemcomitans cells and not to P. gingivalis cells. (a) A 96-well plate of Anti-A. actinomycetemcomitans antibody and A. actinomycetemcomitans cells (left). A 96-well plate of Anti-A. actinomycetemcomitans antibody and P. gingivalis cells (right). (b) ELISA results when executed with different concentrations of Anti-A. actinomycetemcomitans antibody for A. actinomycetemcomitans (red). P. gingivalis cells (black) were used as negative control. Mean and SD values were obtained from three measurements.
Chemosensors 09 00159 g004
Figure 5. Selectivity of the modified QCM sensor. (a) The processes of the 11-MUA formation on a gold electrode in conjunction with immobilization of antibodies and binding reaction are schematically shown. (b) The representative response profile of A. actinomycetemcomitans antibody-immobilized sensors for A. actinomycetemcomitans (green line) detection is shown, while P. gingivalis (red line), P. nigrescens (yellow line) and A. naeslundii (brown line) were used as negative control.
Chemosensors 09 00159 g005
Figure 6. Label-free periodontal bacteria detection using QCM measurements. (a) The representative sensorgram showing the sensor response at different A. actinomycetemcomitans concentrations: 200 µL A. actinomycetemcomitans suspension having: (i) 1.16 × 10³; (ii) 1.16 × 10⁴; (iii) 1.16 × 10⁵; (iv) 1.16 × 10⁶ and (v) 1.16 × 10⁷ cells/mL. (b) The calibration curve of the QCM immunoassay for A. actinomycetemcomitans illustrating the correlation between frequency shift and bacterial number. The mean and SD values were obtained from three measurements. (c) Optical microscopy visualization of the QCM sensor surface. The images are obtained from the bare gold surface (before surface modification) and after injection of A. actinomycetemcomitans (1.16 × 10⁸ cells/mL) on the modified QCM sensor.
Chemosensors 09 00159 g006
Figure 7. The t10 and t90 obtained from the fitted curve of the measurements are indicated by the yellow lines.
Chemosensors 09 00159 g007
Table 1. Mass changes of the 11-MUA-modified QCM sensor chips converted from frequency changes at 12 and 24 h of incubation.
Incubation Time (h)AUC (QSAM, C)Packing Density (Molecule·nm−2)Weight11-MUA on Au Surface (ng)
121.28 × 10−54.54144.5
(n = 4)
241.26 × 10−54.46142.3
(n = 2)
Table 2. Response time of the binding between A. actinomycetemcomitans cells and Anti-A. actinomycetemcomitans antibody.
A. actinomycetemcomitans Cells Density
(Cells/mL)
t10t90Response Time (τ =t90 − t10)
1.16 × 10⁶N1124302177
N229383354
N3185384198
mean113356243
SD64.238.578.6
1.16 × 10⁷N123027444
N2101314212
N324409385
mean119332214
SD84.756.7138.9
1.16 × 10⁸N1139251112
N2137289152
N3201339138
mean159293134
SD29.636.016.5
The mean and SD values were obtained from three measurements.
Table 3. Performance of the different biosensor types for bacterial detection.
Target PathogenTransducerSensing StrategyLimit of DetectionRef.
P. gingivalisMicrofluidic cell-hydrodynamic focusingNo immobilization, impedance reading during sample flow103 cells/mL[32]
E. coli
Sulfate-reducing bacteriaGlassy carbon electrodePotentiometric analysis, bacterial processing is required2.3 × 10–2.3 × 10⁷ CFU/mL[33]
Heat-killed E. coliSaturated calomel electrodeAmperometric detection of secondary antibody using glucose oxidase3 × 101−3.2 × 10⁶ CFU/mL[34]
S. oneidensisSERSSilver nanoparticles sandwiched by analyte binding on optical fiber tip106 cells/mL[35]
E. coliSPRLectin-functionalized anisotropic silver nanoparticles1.5 × 104 CFU/mL[36]
S. aureus
B. subtilis
E. coli O157:H7QCMAntibody for capture, antibody-functionalized nanoparticles for signal enhancement106 cells/mL[37]
A. actinomycetemcomitansQCMAntibody immobilization by using 11-MUA-EDC/NHS1.16 × 104 cells/mLThis study
Abbreviations: SERS, surface-enhanced Raman scattering; SPR, surface plasmon resonance; QCM, quartz crystal microbalance; CFU, colony-forming unit.
Publisher’s Note: MDPI stays neutral with regard to jurisdictional claims in published maps and institutional affiliations.

