Article

Electrochemical Detection of Prostate Cancer Biomarker PCA3 Using Specific RNA-Based Aptamer Labelled with Ferrocene

1
Material and Engineering Research Institute, Sheffield Hallam University, City Campus, Howard Street, Sheffield S1 1WB, UK
2
Department of Biology, College of Science, University of Basrah, Basrah IQ-61002, Iraq
3
Biomolecular Research Centre, Sheffield Hallam University, City Campus, Howard Street, Sheffield S1 1WB, UK
*
Author to whom correspondence should be addressed.
Chemosensors 2021, 9(4), 59; https://doi.org/10.3390/chemosensors9040059
Submission received: 25 February 2021 / Revised: 19 March 2021 / Accepted: 21 March 2021 / Published: 24 March 2021
(This article belongs to the Special Issue Electrochemical Immunosensor)

Abstract

:
This paper reports on a feasibility study of electrochemical in-vitro detection of prostate cancer biomarker PCA3 (prostate cancer antigen 3) in direct assay with specific RNA aptamer labelled with a redox group (ferrocene) and immobilized on a screen-printed gold electrode surface. The cyclic voltammograms and electrochemical impedance spectroscopy methods yield encouraging results on the detection of PCA3 in a range of concentrations from 1 μg/mL down to 0.1 ng/mL in buffer solutions. Both anodic and cathodic current values in cyclic voltammograms measurements and charge transfer resistance values in electrochemical impedance spectroscopy experiments correlate with the PCA3 concentration in the sample. Kinetics studies of the binding of the PCA3 to our aptamer demonstrated high specificity of the reaction with a characteristic affinity constant of approximately 4 · 10 10 molar. The results of this work provide a background for the future development of novel, highly sensitive and cost-effective diagnostic methodologies for prostate cancer detection.

1. Introduction

Prostate cancer (PCa) is considered one of the most common types of cancer in the UK, Europe, US and worldwide and is the second leading cause of mortality among men after lung cancer [1,2,3]. PCa is usually detected in elderly men, with a proportion of cases being observed in middle-aged men between 40 to 50 years old [1,4,5]. The cancer is slow-growing and asymptomatic; hence, its early stage detection is challenging for clinicians. Clinical symptoms are similar to benign prostatitis, making it challenging to distinguish between the two accurately [6]. Because of the lack of effective and timely diagnostics, the prognosis of PCa is generally poor, which is due to the high risk of metastatic development [6,7]. Early diagnosis of PCa can reduce mortality rates and increase the opportunity for effective medical interventions. Therefore, the development of reliable diagnostics at the early stages of PCa is of high importance [8,9].
Current diagnostics of PCa are based on the detection and quantification of total serum prostate-specific antigen (PSA) in blood followed by (if PCa suspected) digital rectal examination and imaging studies [10,11]. The so-called PSA test was introduced in the late 1980s and led to a dramatic improvement in PCa diagnostics [7]. However, limitations in its use are related to its lack of specificity as high PSA concentrations may not always be cancer-related [12]. Elevated PSA levels can also be attributed to several benign conditions such as benign prostatic hyperplasia (BPH) or infection [13]. Additionally, tumours may develop before the concentration of PSA increases [12]. False-positive PSA tests have led to both overdiagnosis and eventually overtreatment; of large populations of men who undergo needless prostate biopsies, which is used as the gold standard diagnosis method in clinical practice [10,14,15,16]. Hence, identifying alternative specific prostate cancer biomarkers and developing methods for their detection in the early stage of the disease is required [17,18].
A promising wide range of PCa biomarkers, such as TMPRSS2: ERG gene fusion, PSMA 11, RNA urine biomarker (DD3PCA3) and PCGEM 1, have all been identified as being over-expressed in prostate tumours [19]. The differential display code 3 (DD3PCA3) gene, also known as prostate cancer antigen 3 (PCA3), was discovered in 1999 [20] and it is one of the specific markers for malignant PCa [21,22,23]. The PCA3 gene expresses a 3992 nt long non-coding RNA (lncRNA) known to be elevated in prostate cancer [20]. PCA3 levels can predict prostatic biopsies’ outcome, especially in combination with other PCa biomarkers such as PSA and can reduce the likelihood of false-positive results [24,25,26]. PCA3 is detectable in; blood, urine collected after DRE and standard urine tests; these characteristics of PCA3 make it an ideal biomarker for non-invasive early diagnostics of PCa [27].
Typically, the detection of PCA3 has been performed using RT-qPCR amplification [28,29]. Currently, the detection of PCA3 in post-DRE urine samples is part of the Progensa test developed commercially and approved in the USA for clinical use [30]. The Progensa assay is based on detecting both PSA and PCA3 markers using quantitative nucleic acid amplification with high sensitivity and specificity [31]. However, such a test is time-consuming and expensive. The development of PCA3 biosensors for express, accurate and cost-effective diagnostics of PCa is a subject of high importance. Substantial progress in biosensors’ development for cancer diagnostics (including prostate cancer) has been made. [32,33]. Recent developments in electrochemical biosensing involving nano-carbon materials, i.e., carbon nanotubes, graphene, graphene oxide, allow a substantial enhancement in the sensitivity of detection [32,33,34,35,36]. A comprehensive review of recent applications of nano-carbon materials in biosensing [32] demonstrated the detection of several cancer biomarkers in low concentrations down to fM level. Electrochemical detection of PSA with a LOD of 13 pg/mL has been reported [33]; however, the detection of PCA3 was not mentioned in this study. Electrochemical biosensors are particularly attractive for biomedical applications because of their unique combination of high sensitivity, low cost and simplicity of use.
The optical detection of PCA3 at concentrations between 200 fM to 5 nM using graphene-oxide nanoparticles modified with short oligonucleotides specific to sections of PCA3 has been reported in [37]; however, the specificity of such detection was not assessed. Both electrochemical [38] and optical [38,39] detection of a short PCA3 ssDNA sequence mimicking the real lncRNA sequence of PCA3 was recently attempted. The reported detection limits were 83 pM for impedance spectroscopy, 2 nM for cyclic voltammograms and 0.9 nM for UV-vis absorption spectroscopy [39]. However, the detection of lncRNA PCA3 was attempted only qualitatively. These sensors could distinguish between PCA3 extracted from different cell lines containing high, low and negligible concentrations of PCA3 [38,39].
In this study, we focus on the further development of electrochemical sensors for the detection of PCa biomarkers. One specific problem of electrochemical biosensing, i.e., the need for redox chemicals in the tested solution [33], can be resolved using redox-labelled aptamers as bioreceptors. Aptamers are artificial, relatively short DNA- or RNA-based constructs with a particular nucleotides sequence designed to bind specific targets from small organic and inorganic molecules to large biomolecules such as proteins [40,41]. The combination of high selectivity and stability with low cost of synthesis and easy modification with various functional groups makes aptamers attractive for a wide range of applications [40,41,42]. For example, labelling aptamers with electrochemically active redox groups makes them particularly attractive for electrochemical biosensing [42]. The approach is based on changes in the secondary structure of the aptamer upon binding the target molecule. Conformational change brings the redox label closer to the electrode resulting in a subsequent increasing in charge transfer. This approach has been successfully adapted for electrochemical detection of mycotoxins, particularly ochratoxin A, in food analysis [43] and has been applied to the detection of heavy metal ions (Hg2+ and Pb2+) in water [44] and the in-vitro detection of dopamine [45].
Here, we use a novel high affinity CG-3 RNA-based aptamer specific to 277 bases of the PCA3 transcript [46]. The aptamer is labelled with ferrocene allowing the detection of a 277 nt fragment of lncRNA from PCA3. The results are of interest to fundamental science since the outcomes resulting from changes in secondary structures of both the PCA3 and aptamer during binding are not known. Our observations are a step towards the long-term aim of developing a novel, accurate, simple and cost-effective diagnostic tool for prostate cancer.

2. Materials and Methods

2.1. Step-by-Step Fabrication of Aptasensor

The CG-3 RNA-based aptamer specific to 277-bases of PCA3 transcript was functionalized by thiol and ferrocene groups on 3′ and 5′ termini, respectively and were acquired from Sangon-Biotech, China. The sequence of nucleotides of the CG-3 aptamer 5′-AGUUUUUGCGUGUGCCCUUUUUGUCCCC-3′ is known to bind to a 277 nt section of PCA3 transcript [46] as schematically shown in Figure 1.
The aptamers were immobilized on the surface of gold screen-printed electrodes by the following procedure outlined schematically in Figure 2. The aptamer stock solution (a) was diluted to 1 µM with HEPES binding buffer (HBB) pH 7.2–7.6 supplemented with 1 mM of 1,4-dithiothretiol (DTT) and 3mM of MgCl2 (HEPES buffer was purchased from Thermo Fisher Scientific; all other chemicals used were purchased from Sigma Aldrich, UK). DTT is used to break the disulfide bridges between two aptamers, subsequently releasing the 3′ thiol (-SH) end groups, (b) the free thiol groups allow covalent binding of the aptamers to the surface of screen-printed gold electrodes. Before immobilization, the aptamer liquid samples were activated (c) by rapid heating to 95 °C for 1 min, followed by 1 min cooling at 4 °C in a thermocycler (Prime TC3600). Immobilization was carried out by casting an aptamers solution onto the surface of screen-printed gold electrodes; the samples were then incubated for 4 h at room temperature in a humidity chamber (d).
Unreacted aptamers were removed from the electrode surface by several rinses with non-folding buffer (HBB). The screen-printed gold electrodes with immobilized aptamers were kept at 4 °C in HBB to prevent the aptamers from coiling. The 277 nt target analyte fragment of lncRNA PCA3, was acquired from CiteAb, Bath, UK. Solutions of PCA3 resuspended in phosphate buffer saline (PBS) pH 7.2–7.4 at concentrations from 1000 ng/mL down to 0.1 ng/mL were used in electrochemical measurements.

2.2. Electrochemical Measurements

Three-electrode DropSens gold screen-printed assemblies with Ag/AgCl reference electrode were used for cyclic voltammograms (CV) measurements using a DropSens, Metrohm potentiostat STAT8000P. ` Voltage range from −0.5 to 0.5 V was used in CV measurements with the step of 10 mV and a scan rate of 10 mV/s. CV cycles were recorded 3 times until the current readings were stabilized. In addition to cyclic voltammetry, the time dependencies of cathodic current at −0.2 V were recorded on electrodes exposed to PCA3 of different concentrations.
Electrochemical impedance spectroscopy (EIS) measurements were carried out on interdigitated DropSens gold screen-printed electrodes having 50 fringes with a spacing of 5 μm using a 4000 A EG&G impedance analyzer. The AC signal of 50 mV amplitude (without DC off-set) with the frequency varied from 0.1 Hz to 1 MHz was used in these measurements.
Both CV and EIS measurements were carried out on electrodes with immobilized aptamers immersed in PBS pH 7.2–7.4 containing different concentrations of PCA3 from 0.1 ng/mL to 1000 ng/mL; measurements of buffer alone were used as a reference. Negative control measurements were carried out using bovine serum albumin (BSA) of 100 ng/mL concentration in PBS.

3. Results and Discussion

3.1. CV Measurements

Typical CVs recorded on electrodes with immobilized aptamers exposed to different concentrations of PCA3 are shown in Figure 3a. Characteristic peaks of anodic current (at about 0.15–0.2 V) and cathodic current (at about 0.25–0.3 V) are associated with the redox activity of the aptamer’s ferrocene label. These results are very similar to CVs observed in previous research involving aptamers labelled with ferrocene [40,41,42]; moreover, unlabelled aptamers did not show such electrochemical behaviour [41]. The amplitudes of both anodic and cathodic currents can be seen to rise with the increasing concentrations of PCA3 (Figure 3b).
Figure 2b shows the dependencies of relative changes of both cathodic and anodic currents on PCA3 concentration, which can be used as calibration curves. The CV curve for zero concentration of PCA3 was used as a reference. The level of noise in CV measurements was estimated as 5% of the signal level. The observed increase in the current correlated with the increase in PCA3 concentration can be explained by the charge transfer enhancement between the ferrocene labels and the electrode due to changes in the aptamer secondary structure on binding to the 277 nt fragment of lncRNA PCA3. This process is schematically shown in Figure 2e. As one can see, the calibration curves are not linear and most-likely represent the lower part of a standard sigmoid curve. Within the concentration range used here, saturation was not reached. The limit of detection (LOD) can be seen to be below the lowest PCA3 concentration of 0.1 ng/mL used in our experiments.
The LOD values were estimated by linear extrapolation of the calibration curves to the triple noise level, e.g., 0.015 in relative changes. As can be seen, the cathodic current measurements appeared to be more sensitive (LOD ≈ 0.04 ng/mL) as compared to those of anodic current (LOD ≈ 0.08 ng/mL). In both cases, the sensitivity is very high and approaching ppt levels. The achieved high sensitivity here in detecting PCA3 is very similar to the sensitivities of other electrochemical aptasensors reported earlier [43,44,45]. Negative controls test on binding BSA to anti-PCA3 aptamers were carried out but showed no response.

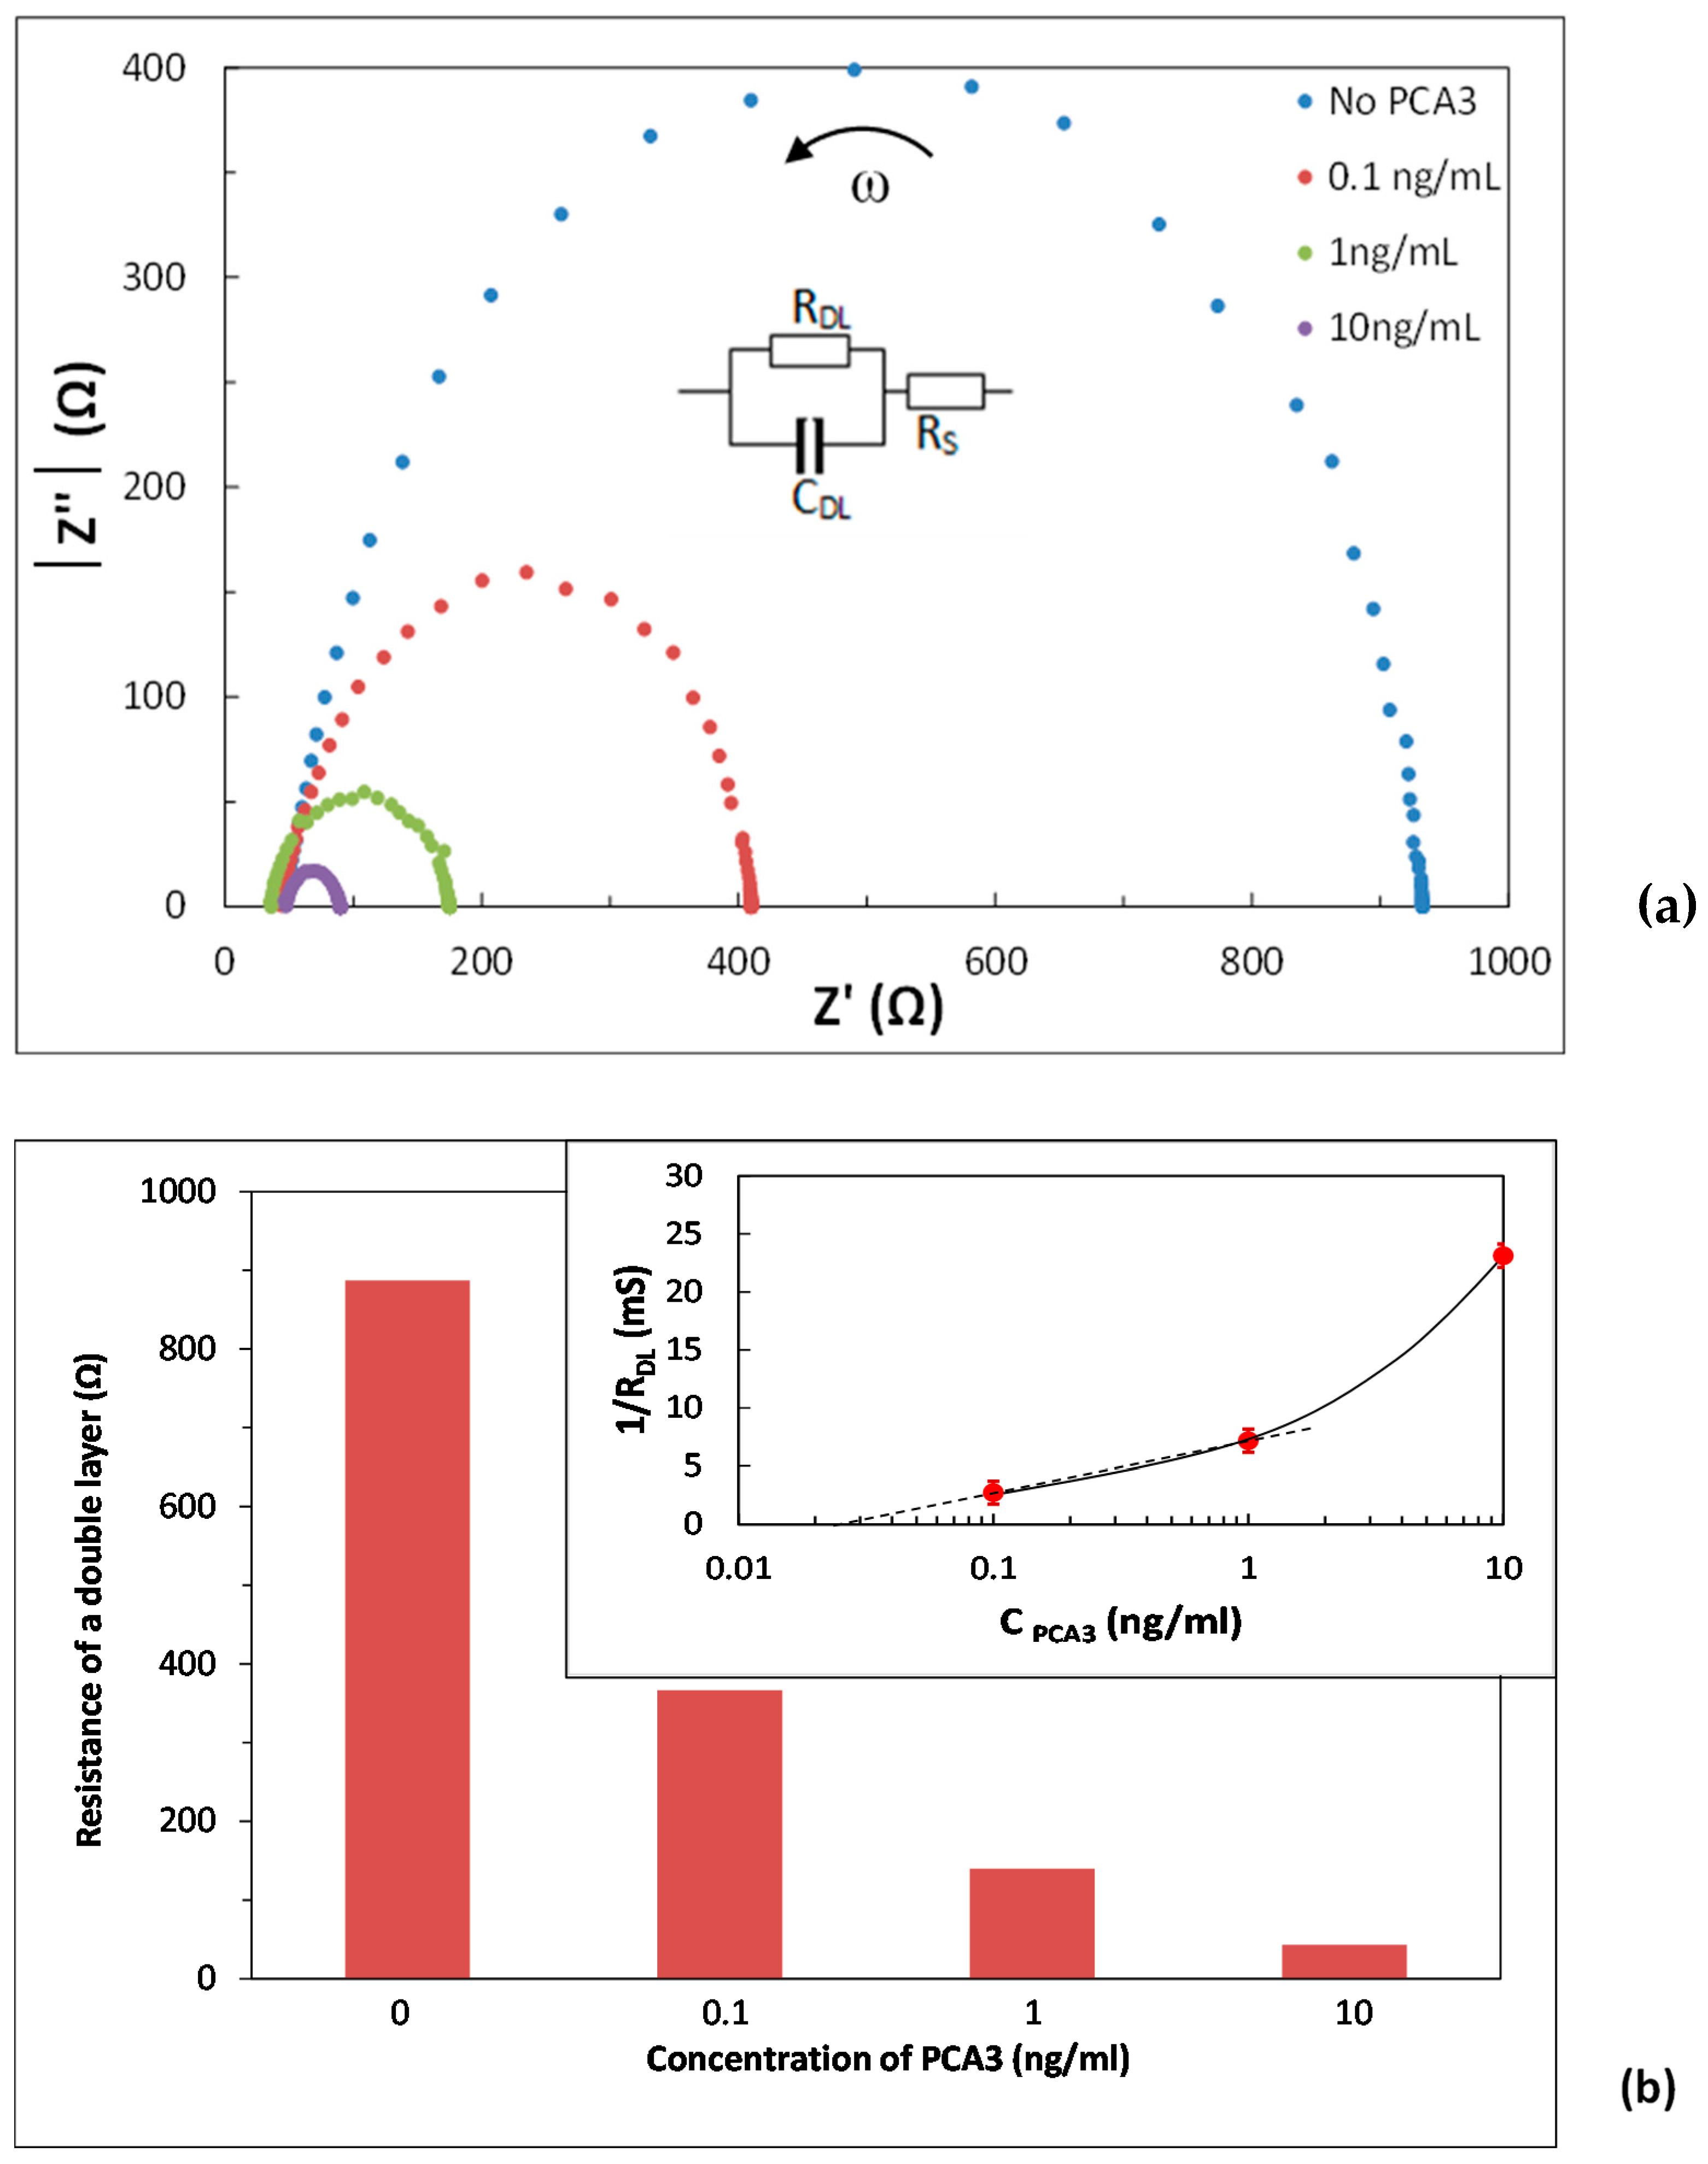
3.2. EIS Measurements

Typical results of electrochemical impedance spectroscopy (EIS) are shown in Figure 4a as dependences of the absolute value of the imaginary part of impedance (Zʺ) against the real part (Zʹ) known as Nyquist plots. The data points in each curve correspond to different AC signal frequencies; the arrow shows the frequency increase from 0.1 Hz to 1 MHz. The observed almost ideal semi-circular pattern is typical for systems without diffusion limitation in receptor-analyte interactions [47], which applies to our samples containing a monolayer of aptamers immobilized on the surface of gold electrodes. Therefore, the simplified equivalent circuit model without diffusion impedance, shown as an inset in Figure 4a, can be used to model EIS measurements’ results [47].
The impedance (Z) of the simplified equivalent circuit can be calculated as:
Z = Z j Z ;     Z = R D L 1 + ω 2 R D L 2 C D L 2 + R S   ;       Z = ω R D L 2 C D L 1 + ω 2 R D L 2 C D L 2 ,
where Z   and   Z are, respectively, real and imaginary parts of impedance, R D L   and   C D L are respectively the resistance and capacitance of a double layer on the surface of the electrode and R S is the bulk resistance of solution.
At low frequencies
( ω 0 )   Z 0 = R D L + R S   and   Z 0 = 0   ,
while at high frequencies,
( ω )   Z = R S   and   Z = 0 .
Therefore, the characteristic parameter of interest, e.g., a double layer resistance R D L , can be calculated without performing the EIS data fitting as:
R D L = Z 0 Z
In practice, Z 0   and Z are taken as the values of Z at lowest (0.1 Hz) and the highest (1 MHz) frequencies, respectively. The dependence of R D L on PCA3 concentration is given in Figure 4b. The decrease in R D L with the increase in PCA3 concentration correlates well with the DC current increase in CV measurements and confirms the concept of electrochemical apta-sensing outlined in Figure 2e.
A substantial decrease in the R D L in EIS measurements caused by binding PCA3 to aptamer in comparison with somewhat small changes of both the anodic and cathodic currents in CV measurements led to the conclusion that EIS measurements are more sensitive than CV measurements. The low detection limit of the EIS method could be estimated by plotting 1/ R D L against the PCA3 concentration; this graph is shown as an inset in Figure 4b. The EIS measurements allowed the evaluation of R D L with an accuracy of about 1 Ω. Using the value of R D L ≈ 1 k Ω at zero concentration of PCA3 as a reference, the noise level of 1/ R D L can be estimated as Δ ( 1 / R D L ) = Δ R D L R D L 2 = 10 5 ( S ) or 0.01 mS, which practically a zero level. The intercept of the linear approximation of 1/ R D L vs. CPCA3 graph at low concentrations yields the LOD value of 0.03 ng/mL. Our data demonstratethat the EIS method is more sensitive as compared to the CV method.

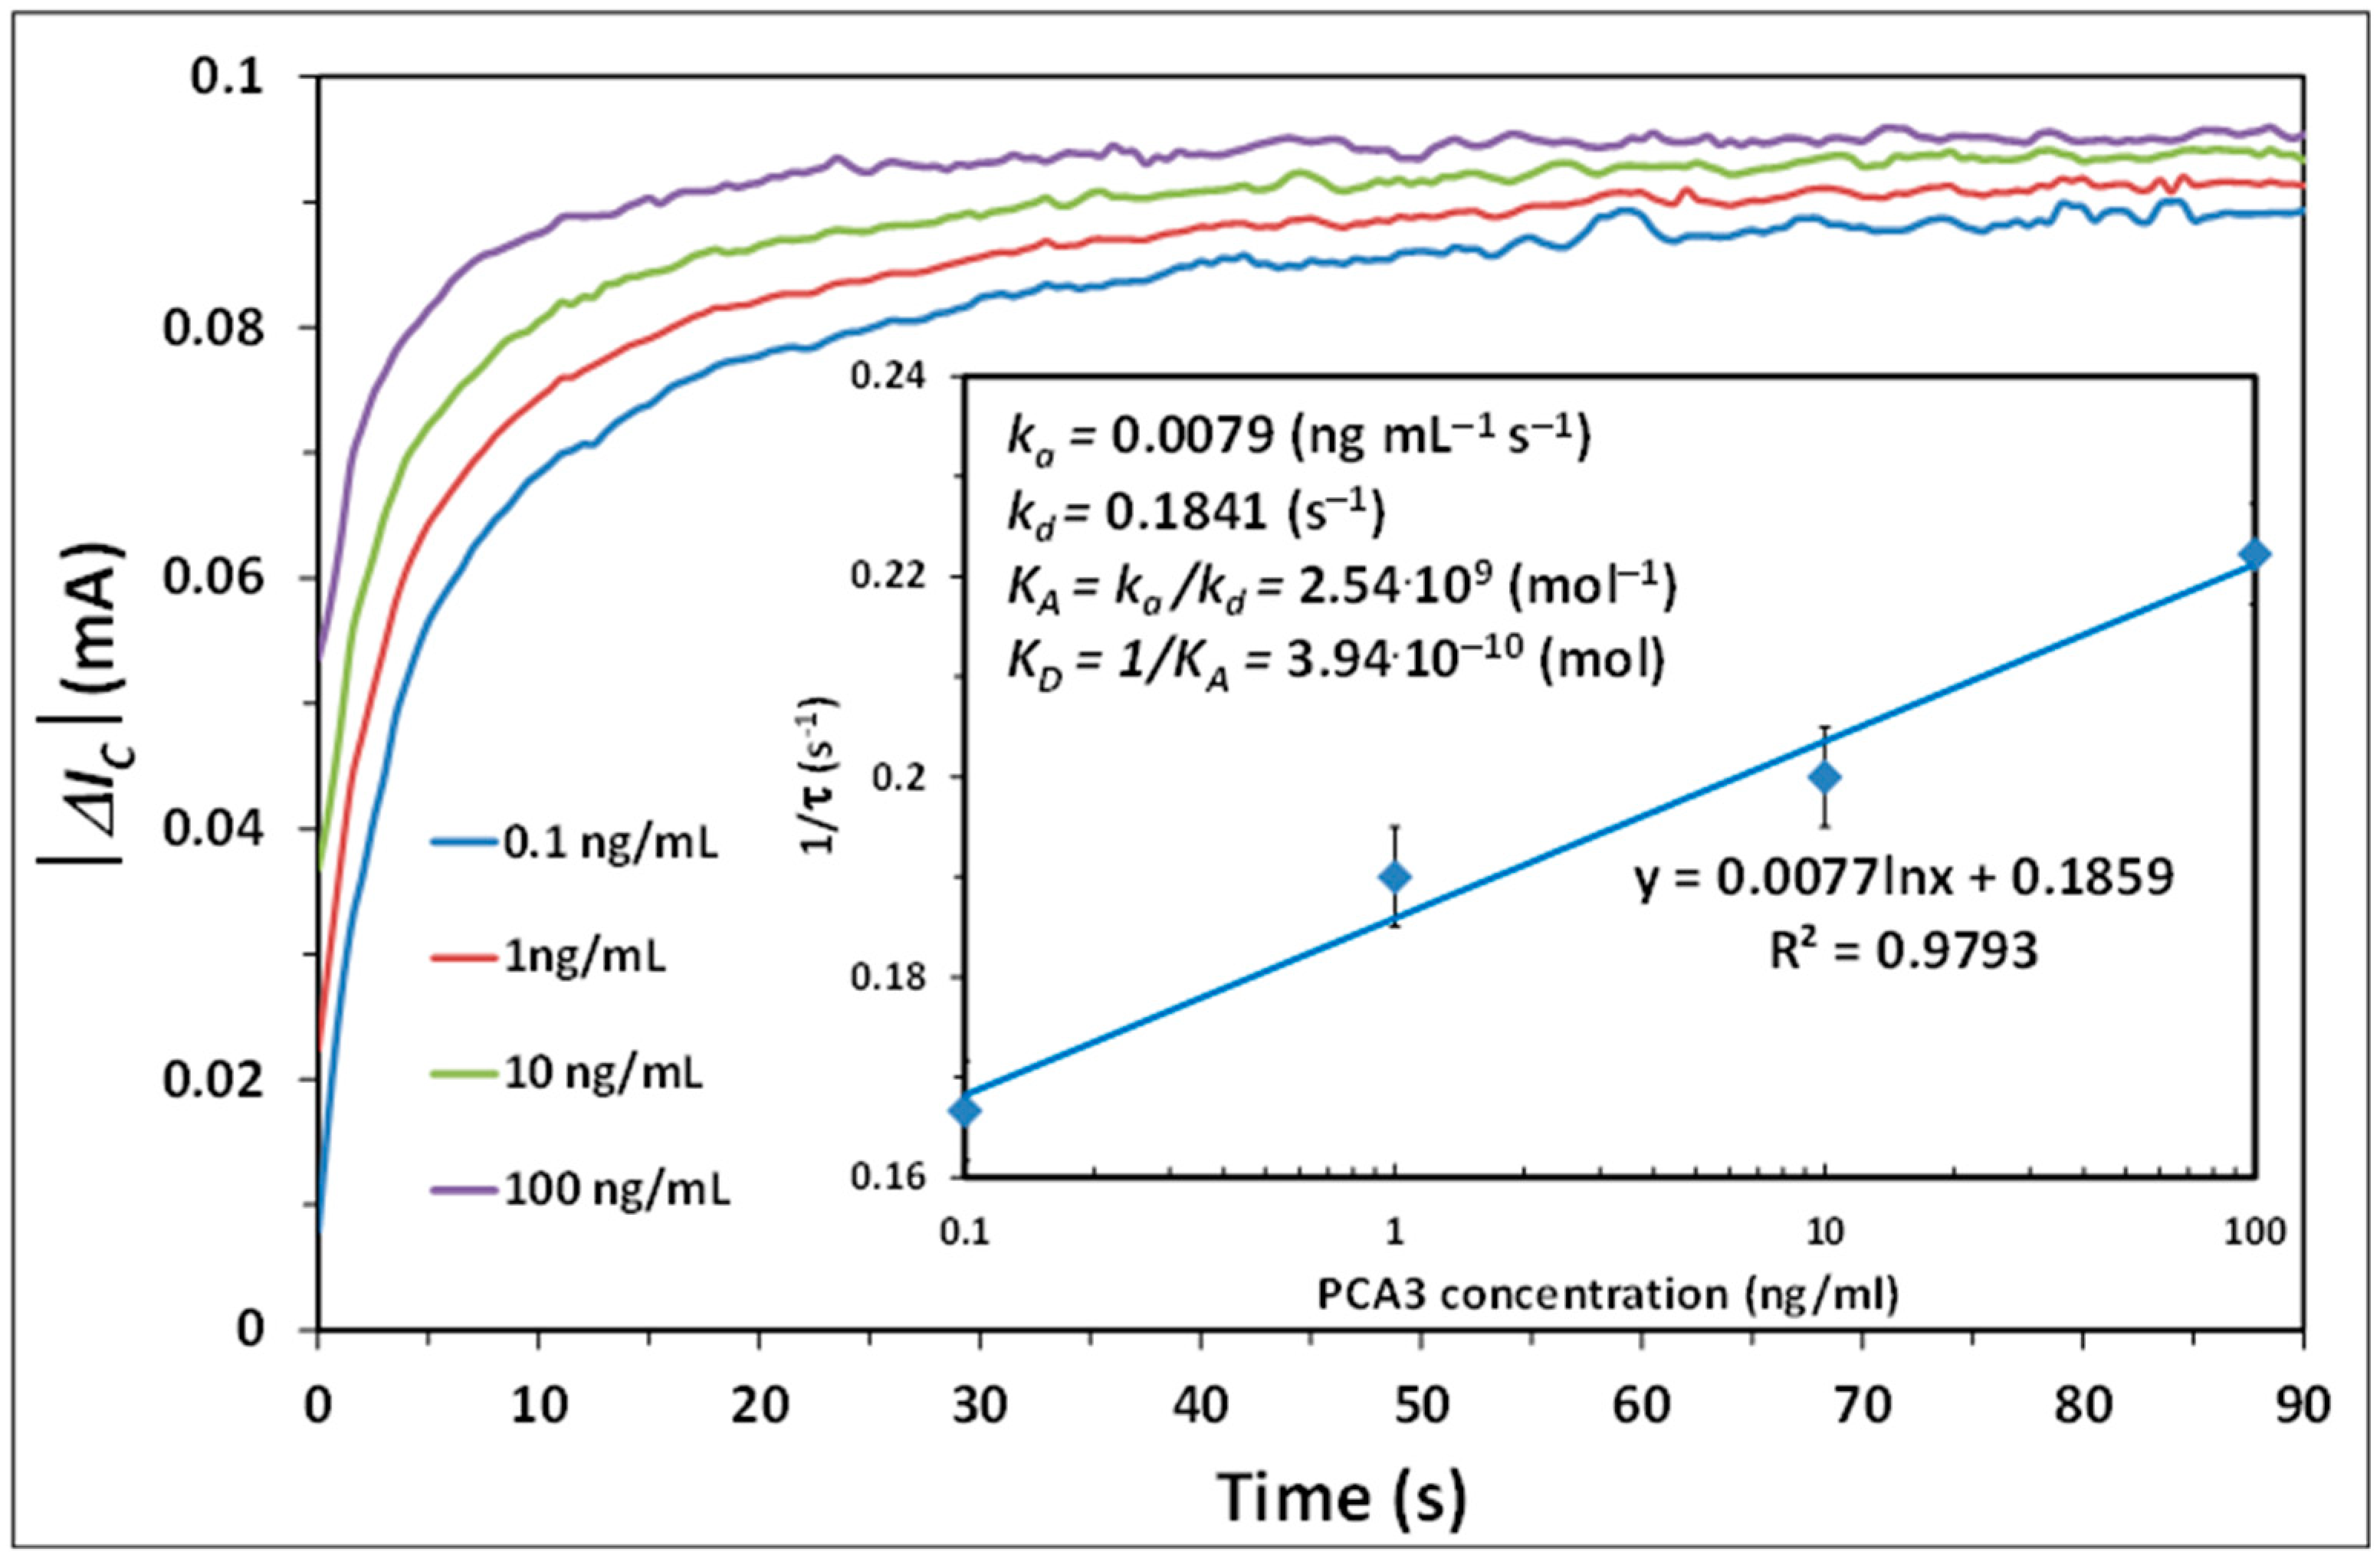
3.3. Study of the Kinetics of PCA3 to Aptamer Binding

The kinetics of binding PCA3 lncRNA to the aptamer layer on the surface of the gold electrode was studied by recording time dependencies of cathodic current at a fixed potential of −0.2 V over different concentrations of the aptamer. Typical time dependencies of absolute values of changes in cathodic current | Δ I c | = | I c I c r e f | for different concentrations of PCA3 are shown in Figure 5. The fitting of the recorded data to the rising exponential function allowed the evaluation of the time constant (τ) at different concentrations of PCA3. These data were used in the further analysis for quantification of the affinity of apatmer-PCA3 binding.
A differential equation can describe the PCA3-aptamer binding for Langmuir absorption [48], which is suitable in our case of adsorption of analyte molecules on a monolayer of binding centres:
d n d t = k a C ( N n ) k d n
The first term of the Equation (5) describes the adsorption of analyte molecules of concentration C [ M ] on the available binding sites with the concentration N n , where N is the concentration of binding sites on the surface and k a [ m o l 1 s 1 ] is the rate of adsorption. While the second term in (5) describes the desorption of analyte molecules which is proportional to the concentration of adsorbed molecules (n) and the rate of desorption k d [ s 1 ] . Another approximation used in the binding kinetics analysis is applying a single binding site assumption to a complex binding process between the aptamer and PCA3 which involves interactions between several nucleotides. However, the proposed approach has been successfully used in similarly complex systems of antibody-antigen interactions [48,49] and in our previous works on aptamer-based biosensors [45,50].
The solution of Equation (5) is a rising exponential function given as [48,49]:
n = N k a C k a C + k d [ 1 exp ( t / τ ) ]
where the characteristic time constant τ is given as:
τ = 1 k a C + k d
Equation (6) could be expressed in terms of sensor responses R and Rmax instead of n and N
R = R m a x k a C k a C + k d [ 1 exp ( t / τ ) ]
The data fitting can be done by plotting the dependence of 1/τ on the concentration of the analyte (C), which is a linear function [45,46]:
1 / τ = k a C + k d
The values of the adsorption and desorption rates ( k a and k d ) can be found as the gradient and intercept of 1/τ (C) dependence. Then, the association constant can be calculated as K A [ m o l a r 1 ] = k a / k d , while the affinity constant K D [ M ] = 1 / K A = k d / k a .
Such calculations were performed for the kinetics curves in Figure 5 and the linear plot of 1/τ vs. C is given as an inset in Figure 5 along with the evaluated parameters. The resulted values of the association and affinity constant for binding of PCA3 to the aptamer K A 2.5 · 10 9   M 1   and K D 4 · 10 10   M , respectively, indicate a very high specificity of this reaction. The strength of the binding means that it is practically irreversible since the probability of PCA3 binding is 2.5 · 10 9 larger than the probability of its desorption. The obtained values of KA and KD for PCA3-specific aptamer are similar to other aptamers’ values specific to ochratoxin A [50] and dopamine [45].

4. Conclusions

The results of a feasibility study of electrochemical detection of lncRNA PCA3 prostate cancer marker in buffer solution using specific redox-labelled aptamer are encouraging. It demonstrates that a simple concept of electrochemical aptasensing based on changes in the charge transfer between the aptamer redox label and the electrode during the aptamer-to-target binding is applicable for detecting large biomolecules such as PCA3. Both the cyclic voltammograms and impedance spectroscopy methods allowed the detection of PCA3 in concentrations from 1 μg/mL down to 0.1 ng/mL. The detection sensitivity is high, with the LOD values being 0.03 ng/mL for the EIS method and 0.04–0.09 ng/mL for the CV method. These results are equivalent to 0.26 pM and 0.35–0.78 pM, respectively, assuming the size of the PCA3 fragment of 277 nt [43] to be approximately 87 kDa. The kinetic study of binding PCA3 to our aptamer allowed the evaluation of the affinity constant at 4 · 10 10   m o l a r which is indicative of a highly specific binding reaction such as observed between antigen-to-antibody interactions. Negative control experiments (e.g., adsorption of BSA) showed no response.
The obtained high sensitivity of PCA3 detection in the sub-nanomolar range is close to the values reported in [34,35,36] and is believed to be sufficient for detecting PCA3 prostate cancer biomarker in urine. Another advantage of using redox-labelled aptamers is that the authentic urine samples can be tested without adding redox chemicals to the mixture. Potentially, the electrochemical detection of PCA3 in urine could be adapted for prostate cancer diagnostics instead of currently used methods, e.g., ELISA-based PSA blood tests and PROGENSA assay based on PCR amplification of both PSA and PCA3 markers. To achieve this ambitious goal a large amount of work must be carried out. Our current research plans include detecting PCA3 in a complex matrix such as urine containing other biomolecules that can be expanded further to testing actual urine samples from anonymous prostate cancer patients. Detection of other biomarkers associated with different stages of prostate cancer could also be explored.

Author Contributions

Conceptualization, A.N. and D.P.S.; methodology, A.N. and H.A.-A.; validation, D.P.S.; formal analysis, A.N.; investigation, H.A.-A.; resources, A.N.; writing—original draft preparation, A.N. and S.T.; writing—review and editing, D.P.S.; supervision, A.N. and D.P.S. All authors have read and agreed to the published version of the manuscript.

Funding

This research received no external funding.

Institutional Review Board Statement

Not applicable.

Informed Consent Statement

Not applicable.

Data Availability Statement

The data are not publicly available; The data files are stored on corresponding instruments and on personal computers.

Acknowledgments

One of the authors would like to acknowledge funding of his PhD study by the Ministry of High Education of Iraq.

Conflicts of Interest

The authors declare no conflict of interest.

References

  1. Siegel, R.L.; Miller, K.D.; Jemal, A. Cancer statistics, 2017. CA Cancer J. Clin. 2017, 67, 7–30. [Google Scholar] [CrossRef] [Green Version]
  2. Ferlay, J.; Soerjomataram, I.; Dikshit, R.; Eser, S.; Mathers, C.; Rebelo, M.; Parkin, D.M.; Forman, D.; Bray, F. Cancer incidence and mortality worldwide: Sources, methods and major patterns. Int. J. Cancer 2015, 136, E359–E386. [Google Scholar] [CrossRef]
  3. Liss, M.A.; Santos, R.; Osann, K.; Lau, A.; Ahlering, T.E.; Ornstein, D.K. PCA3 molecular urine assay for prostate cancer: Association with pathologic features and impact of collection protocols. World J. Urol. 2011, 29, 683–688. [Google Scholar] [CrossRef] [PubMed] [Green Version]
  4. Bax, C.; Taverna, G.; Eusebio, L.; Sironi, S.; Grizzi, F.; Guazzoni, G.; Capelli, L. Innovative diagnostic methods for early prostate cancer detection through urine analysis: A review. Cancers 2018, 10, 123. [Google Scholar] [CrossRef] [PubMed] [Green Version]
  5. Siegel, R.L.; Miller, K.D.; Jemal, A. Cancer statistics, 2018. CA Cancer J. Clin. 2018, 68, 7–30. [Google Scholar] [CrossRef] [PubMed]
  6. Daniyal, M.; Siddiqui, Z.A.; Akram, M.; Asif, H.M. Mini-review: Epidemiology, Etiology, Diagnosis and Treatment of Prostate Cancer. Asian Pac. J. Cancer Prev. 2014, 15, 9575–9578. [Google Scholar] [CrossRef] [Green Version]
  7. Jemal, A.; Siegel, R.; Ward, E.; Hao, Y.; Xu, J.; Thun, M.J. Cancer Statistics, 2009. CA Cancer J. Clin. 2009, 59, 1–25. [Google Scholar] [CrossRef] [PubMed]
  8. Filella, X.; Foj, L. Prostate cancer detection and prognosis: From prostate specific antigen (PSA) to exosomal biomarkers. Int. J. Mol. Sci. 2016, 17, 1784. [Google Scholar] [CrossRef] [PubMed]
  9. Miller, K.D.; Siegel, R.; Lin, C.C.; Mariotto, A.B.; Kramer, J.L.; Rowland, J.H.; Stein, K.D.; Alteri, R.; Jemal, A. Cancer treatment and survivorship statistics, 2016. CA Cancer J. Clin. 2016, 66, 271–289. [Google Scholar] [CrossRef] [Green Version]
  10. Buzzoni, C.; Auvinen, A.; Roobol, M.J.; Carlsson, S.; Moss, S.M.; Puliti, D.; De Koning, H.J.; Bangma, C.H.; Denis, L.J.; Kwiatkowski, M. Metastatic prostate cancer incidence and prostate-specific antigen testing: New insights from the European Randomized Study of Screening for Prostate Cancer. Eur. Urol. 2015, 68, 885–890. [Google Scholar] [CrossRef] [Green Version]
  11. Salman, J.W.; Schoots, I.G.; Carlsson, S.V.; Jenster, G.; Roobol, M.J. Prostate specific antigen as a tumor marker in prostate cancer: Biochemical and clinical aspects. In Advances in Cancer Biomarkers; Springer: Dordrecht, The Netherlands, 2015; Volume 867, pp. 93–114. ISBN 9789401772150. [Google Scholar]
  12. Adhyam, M.; Gupta, A.K. A Review on the Clinical Utility of PSA in Cancer Prostate. Ind. J. Surg. Oncol. 2012, 2, 120–129. [Google Scholar] [CrossRef] [Green Version]
  13. Center, M.M.; Jemal, A.; Lortet-Tieulent, J.; Ward, E.; Ferlay, J.; Brawley, O.; Bray, F. International variation in prostate cancer incidence and mortality rates. Eur. Urol. 2012, 6, 1079–1092. [Google Scholar] [CrossRef]
  14. Loeb, S.; Gashti, S.N.; Catalona, W.J. Exclusion of inflammation in the differential diagnosis of an elevated prostate-specific antigen (PSA). Urol. Oncol. Semin. Orig. Investig. 2009, 27, 64–66. [Google Scholar] [CrossRef]
  15. Hayes, J.H.; Barry, M.J. Screening for prostate cancer with the prostate-specific antigen test: A review of current evidence. J. Am. Med. Assoc. 2014, 311, 1143–1149. [Google Scholar] [CrossRef]
  16. Haese, A.; de la Taille, A.; van Poppel, H.; Marberger, M.; Stenzl, A.; Mulders, P.F.A.; Huland, H.; Abbou, C.C.; Remzi, M.; Tinzl, M.; et al. Clinical utility of the PCA3 urine assay in European men scheduled for repeat biopsy. Eur. Urol. 2008, 54, 1081–1088. [Google Scholar] [CrossRef] [Green Version]
  17. Mistry, K.; Cable, G. Meta-analysis of prostate-specific antigen and digital rectal exami-nation as screening tests for prostate carcinoma. J. Am. Board Fam. Pract. 2003, 16, 95–101. [Google Scholar] [CrossRef] [PubMed] [Green Version]
  18. Crawford, E.D.; de Antoni, E.P.; Ross, C.A. The role of prostate-specific antigen in the chemoprevention of prostate cancer. J. Cell. Biochem. 1996, 63, 149–155. [Google Scholar] [CrossRef]
  19. Landers, K.A.; Burger, M.J.; Tebay, M.A.; Purdie, D.M.; Scells, B.; Samaratunga, H.; Lavin, M.F.; Gardiner, R.A. Use of multiple biomarkers for a molecular diagnosis of prostate cancer. Int. J. Cancer 2005, 114, 950–956. [Google Scholar] [CrossRef]
  20. Bussemakers, M.J.G.; van Bokhoven, A.; Verhaegh, G.W.; Smit, F.P.; Karthaus, H.F.M.; Schalken, J.A.; Debruyne, F.M.J.; Ru, N.; Isaacs, W.B. DD3: A new prostate-specific gene, highly overexpressed in prostate cancer. Cancer Res. 1999, 59, 5975–5979. Available online: https://cancerres.aacrjournals.org/content/59/23/5975 (accessed on 23 March 2021). [PubMed]
  21. Chistiakov, D.A.; Myasoedova, V.A.; Grechko, A.V.; Melnichenko, A.A.; Orekhov, A.N. New biomarkers for diagnosis and prognosis of localized prostate cancer. Semin. Cancer Biol. 2018, 52, 9–16. [Google Scholar] [CrossRef]
  22. Rönnau, C.G.H.; Verhaegh, G.W.; Luna-Velez, M.V.; Schalken, J.A. Noncoding RNAs as Novel Biomarkers in Prostate. Cancer BioMed. Res. Int. 2014, 2014, 591703. [Google Scholar] [CrossRef]
  23. Schalken, J.A.; Hessels, D.; Verhaegh, G. New targets for therapy in prostate cancer: Differential display code 3 (DD3PCA3), a highly prostate cancer-specific gene. Urology 2003, 62, 34–43. [Google Scholar] [CrossRef]
  24. Bourdoumis, A.; Papatsoris, A.G.; Chrisofos, M.; Efstathiou, E.; Skolarikos, A.; Deliveliotis, C. The novel prostate cancer antigen 3 (PCA3) biomarker. Int. Braz. J. Urol. 2010, 36, 665–669. [Google Scholar] [CrossRef] [Green Version]
  25. Wu, A.K.; Reese, A.C.; Cooperberg, M.R.; Sadetsky, N.; Shinohara, K. Utility of PCA3 in patients undergoing repeat biopsy for prostate cancer. Prost. Cancer Prost. Disc. 2012, 15, 100–105. [Google Scholar] [CrossRef] [Green Version]
  26. Goode, R.R.; Marshall, S.J.; Duff, M.; Chevli, E.; Chevli, K.K. Use of PCA3 in detecting prostate cancer in initial and repeat prostate biopsy patients. Prostate 2013, 73, 48–53. [Google Scholar] [CrossRef] [PubMed]
  27. Schmid, M.; Hansen, J.; Chun, F.K.H. Urinary prostate cancer antigen 3 as a tumour marker: Biochemical and clinical aspects. In Advances in Experimental Medicine and Biology; Scatena, R., Ed.; Springer: Berlin/Heidelberg, Germany, 2015; p. 291. Available online: https://link.springer.com/book/10.1007/978-94-017-7215-0 (accessed on 23 March 2021).
  28. Ouyang, B.; Bracken, B.; Burke, B.; Chung, E.; Liang, J. A Duplex qPCR assay based on quantification of α-methylacyl- CoA Racemase transcripts and Prostate Cancer Antigen 3 in urine sediments improved diagnostic accuracy for prostate cancer. J. Urol. 2009, 181, 2508–2514. [Google Scholar] [CrossRef] [PubMed] [Green Version]
  29. Stern, E.; Vacic, A.; Rajan, N.K.; Criscione, J.M.; Park, J.; Ilic, B.R.; Mooney, D.J.; Reed, M.A.; Fahmy, T.M. Label-free biomarker detection from whole blood public access policy. Nat. Nanotechnol. 2010, 5, 138–142. [Google Scholar] [CrossRef] [PubMed] [Green Version]
  30. Rittenhouse, H.; Blase, A.; Shamel, B.; Schalken, J.; Groskopf, J. The long and winding road to FDA approval of a novel prostate cancer test: Our story. Clin. Chem. 2013, 59, 32–34. [Google Scholar] [CrossRef] [Green Version]
  31. Nicholson, A.; Mahon, J.; Boland, A.; Beale, S.; Dwan, K.; Fleeman, N.; Hockenhull, J.; Dundar, Y. The clinical effectiveness and cost-effectiveness of the PROGENSA® prostate cancer antigen 3 assay and the prostate health index in the diagnosis of prostate cancer: A systematic review and economic evaluation. Health Technol. Assess. 2015, 19, 1–191. [Google Scholar] [CrossRef] [PubMed] [Green Version]
  32. Pasinszki, T.; Krebsz, M.; Tung, T.T.; Losic, D. Carbon nanomaterial based biosensors for non-invasive detection of cancer and disease biomarkers for clinical diagnosis. Sensors 2017, 17, 1919. [Google Scholar] [CrossRef] [PubMed] [Green Version]
  33. Topkaya, S.N.; Azimzadeh, M.; Ozsoz, M. Electrochemical biosensors for cancer biomarkers detection: Recent advances and challenges. Electroanalysis 2016, 28, 1402–1419. [Google Scholar] [CrossRef]
  34. Li, G.; Xia, Y.; Tian, Y.; Wu, Y.; Liu, J.; He, Q.; Chen, D. Review-Recent Developments on Graphene-Based Electrochemical Sensors toward Nitrite. J. Electrochem. Soc. 2019, 166, B881–B895. [Google Scholar] [CrossRef]
  35. Li, Q.; Xia, Y.; Wan, X.; Yang, S.; Li, G. Morphology-dependent MnO2/nitrogen-doped graphene nanocomposites for simultaneous detection of trace dopamine and uric acid. Mater. Sci. Eng. C 2020, 109, 110615. [Google Scholar] [CrossRef] [PubMed]
  36. Díaz-Fernández, A.; Lorenzo-Gómez, R.; Miranda-Castro, R.; Santos-Álvarez, N.; Lobo-Castañón, M.J. Electrochemical aptasensors for cancer diagnosis in biological fluids–A review. Anal. Chim. Acta 2020, 1124, 1–19. [Google Scholar] [CrossRef]
  37. Vilela, P.; El-Sagheer, A.; Millar, T.M.; Brown, T.; Muskens, O.L.; Kanaras, A.G. Graphene oxide-upconversion nanoparticle based optical sensors for targeted detection of mRNA biomarkers present in Alzheimer’s disease and Prostate Cancer. ACS Sens. 2017, 2, 52–56. [Google Scholar] [CrossRef] [Green Version]
  38. Soares, J.C.; Soares, A.C.; Rodrigues, V.C.; Melendez, M.E.; Santos, A.C.; Faria, E.F.; Reis, R.M.; Carvalho, A.L.; Oliveira, O.N., Jr. Detection of the Prostate Cancer Biomarker PCA3 with Electrochemical and Impedance-Based Biosensors. ACS Appl. Mater. Interfaces 2019, 11, 46645–46650. [Google Scholar] [CrossRef]
  39. Rodrigues, V.C.; Soares, J.C.; Soares, A.C.; Braz, D.C.; Melendez, M.E.; Ribas, L.C.; Scabini, L.F.S.; Bruno, O.M.; Carvalho, A.L.; Reis, R.M.; et al. Electrochemical and optical detection and machine learning applied to images of genosensors for diagnosis of prostate cancer with the biomarker PCA3. Talanta 2020, 222, 121444. [Google Scholar] [CrossRef]
  40. Hamula, C.L.; Guthrie, J.W.; Zhang, H.; Li, X.F.; Le, X.C. Selection and Analytical Applications of Aptamers. Trends Anal. Chem. 2011, 30, 1587–1597. [Google Scholar] [CrossRef]
  41. Zhang, Y.; Lai, B.S.; Juhas, M. Recent advances in aptamer discovery and applications. Molecules 2019, 24, 941. [Google Scholar] [CrossRef] [PubMed] [Green Version]
  42. Jarczewska, M.; Górski, Ł.; Malinowska, E. Electrochemical aptamer-based biosensors as potential tools for clinical diagnostics. Anal. Meth. 2016, 8, 3861–3877. [Google Scholar] [CrossRef] [Green Version]
  43. Rhouati, A.; Yang, C.; Hayat, A.; Marty, J.-L. Aptamers: A promising tool for ochratoxin A detection in food analysis. Toxins 2013, 5, 1988–2008. [Google Scholar] [CrossRef]
  44. Abu-Ali, H.; Nabok, A.; Smith, T.J. Development of novel and highly specific ssDNA-aptamer-based electrochemical biosensor for rapid detection of mercury (II) and lead (II) ions in water. Chemosens 2019, 7, 27. [Google Scholar] [CrossRef] [Green Version]
  45. Abu-Ali, H.; Ozkaya, C.; Davis, F.; Walch, N.; Nabok, A. Electrochemical aptasensor for detection of dopamine. Chemosens 2020, 8, 28. [Google Scholar] [CrossRef] [Green Version]
  46. Marangoni, K.; Neves, A.F.; Rocha, R.M.; Faria, P.R.; Alves, P.T.; Souza, A.G.; Fujimura, P.T.; Santos, F.A.A.; Araújo, T.G.; Ward, L.S.; et al. Prostate-specific RNA aptamer: Promising nucleic acid antibody-like cancer detection. Sci. Rep. 2015, 5, 12090. [Google Scholar] [CrossRef] [Green Version]
  47. Bonanos, N.; Steele, B.C.H.; Butler, E.P. Applications of impedance spectroscopy. In Impedance Spectroscopy: Theory, Experiment, and Applications; Barsoukov, E., Macdonald, J.R., Eds.; Wiley: Hoboken, NJ, USA, 2018; pp. 175–478. [Google Scholar] [CrossRef]
  48. Nabok, A.; Tsargorodskaya, A.; Mustafa, M.K.; Szekacs, I.; Starodub, N.F.; Szekacs, A. Detection of low molecular weight toxins using optical phase detection techniques. Sens. Actuators B Chem. 2011, 154, 232–237. [Google Scholar] [CrossRef]
  49. Liu, X.; Wei, J.; Song, D.; Zhang, Z.; Zhang, H.; Luo, G. Determination of affinities and antigenic epitopes of bovine cardiac troponin I (cTnI) with monoclonal antibodies by surface plasmon resonance biosensor. Anal. Biochem. 2003, 314, 301–309. [Google Scholar] [CrossRef]
  50. Al-Rubaye, A.; Nabok, A.; Catanante, G.; Marty, J.-L.; Takacs, E.; Szekacs, A. Detection of ochratoxin A in aptamer assay. Sens. Act. B Chem. 2018, 263, 248–251. [Google Scholar] [CrossRef] [Green Version]
Figure 1. Binding of the CG-3 RNA-aptamer (red balls and line) to a subsection of PCA3 consisting of 277 bases from the lncRNA transcript (blue balls and line). Image reproduced from [46].
Chemosensors 09 00059 g001
Figure 2. The step-by-step fabrication of aptasensor: (a) purchased aptamers; (b) aptamers split in HEPES binding buffer containing DTT and MgCl2; (c) reactivated aptamers following theromcycling; (d) aptamers immobilized on Au electrodes with the 5′ redox labels away from the surface; (e) conformational changes of aptamer configuration following PCA3 binding and resulting in a subsequent increase in charge transfer.
Chemosensors 09 00059 g002
Figure 3. (a) A typical set of cyclic voltammograms (CV) for different concentrations of PCA3; (b) Concentration dependence of relative changes of cathodic and anodic currents and evaluation of LOD.
Chemosensors 09 00059 g003
Figure 4. (a) A typical set of Nyquist plots for different concentrations of PCA3; (b) Concentration dependence of the resistance of a double layer. Inset illustrates the evaluation of LOD.
Chemosensors 09 00059 g004
Figure 5. Typical kinetics of binding of PCA3 of different concentration to the aptamer. Inset illustrates the evaluation of the aptamer to PCA3 binding affinity.
Chemosensors 09 00059 g005
Publisher’s Note: MDPI stays neutral with regard to jurisdictional claims in published maps and institutional affiliations.

