Article

An Impedance Based Electrochemical Immunosensor for Aflatoxin B1 Monitoring in Pistachio Matrices

by
Michail D. Kaminiaris
1,
Sophie Mavrikou
2,*,
Maria Georgiadou
3,
Georgia Paivana
2,*,
Dimitrios I. Tsitsigiannis
1 and
Spyridon Kintzios
2
1
Laboratory of Plant Pathology, Department of Crop Science, School of Plant Sciences, Agricultural University of Athens, Iera Odos 75, 11855 Athens, Greece
2
Laboratory of Cell Technology, Department of Biotechnology, School of Applied Biology and Biotechnology, Agricultural University of Athens, Iera Odos 75, 11855 Athens, Greece
3
Laboratory of Food Process Engineering, Department Food Science & Human Nutrition, School of Food Science and Nutritional Sciences, Agricultural University of Athens, Iera Odos 75, 11855 Athens, Greece
*
Authors to whom correspondence should be addressed.
Chemosensors 2020, 8(4), 121; https://doi.org/10.3390/chemosensors8040121
Submission received: 11 September 2020 / Revised: 20 November 2020 / Accepted: 24 November 2020 / Published: 30 November 2020
(This article belongs to the Special Issue Electrochemical Immunosensor)

Abstract

:
Aflatoxins are highly toxic fungal secondary metabolites that often contaminate food and feed commodities. An electrochemical immunosensor for the determination of aflatoxin B1 (AFB1) was fabricated by immobilizing monoclonal AFB1 antibodies onto a screen-printed gold electrode that was modified with carbo-methyldextran by N-(3-dimethylaminopropyl)-N′-ethylcarbodiimide hydrochloride/N-hydroxysuccinimide cross-linking. An electrochemical interfacial modelling of biomolecular recognition was suggested and reasonably interpreted. Impedance technology was employed for the quantitative determination of AFB1. The limit of detection concentration of AFB1 for standard solutions and spiked pistachio samples was 0.5 ng/mL and 1 ng/mL, respectively. The immunosensor was able to successfully determine AFB1 concentrations in the range of 4.56–50.86 ng/mL in unknown pistachio samples. Comparative chromatographic analysis revealed that AFB1 concentrations that were higher than 345 ng/mL were not within the immunosensor’s upper limits of detection. Selectivity studies against Ochratoxin A and Aflatoxin M1 demonstrated that the proposed AFB1 immunosensor was able to differentiate between these other fungal mycotoxins. The novel electrochemical immunosensor approach has the potential for rapid sample screening in a portable, disposable format, thus contributing to the requirement for effective prevention and the control of aflatoxin B1 in pistachios.

Graphical Abstract

1. Introduction

Aspergillus is a fungal genus that consists of many different species that are adopted to diverse climate conditions and regions worldwide [1]. Some Aspergillus species have the ability to produce aflatoxins as secondary metabolites, namely four different aflatoxins (B1, B2, G1, and G2). Aflatoxins are very toxic mycotoxins and categorized amongst the most perilous ones for humans and animals. They can contaminate several agricultural products at both the pre-harvest and at post-harvest level [2]. Nowadays, the number of isolated and characterized mycotoxins is exceeding 300, indicating the severity of such molecules on human health [3]. Aflatoxins are classified by the International Agency for Cancer Research (IARC) into the most dangerous molecules (Class 1) [4]. Fungi mainly belonging to Aspergillus section Flavi have the ability to produce aflatoxins, whereas Aspergillus flavus is found to be the main aflatoxin producer amongst this section [5,6]. The EU has set maximum legal limits for aflatoxins in several foodstuffs and feed due to the hazard of aflatoxin contamination (European Commission Regulation (EC) No 1881/2006, as amended by 165/2010). Pistachio nuts are among the commodities that are prone to aflatoxin contamination by Aspergillus section Flavi.
Pistachio world trade has been severely affected by aflatoxin contamination occurrence during the last years [7]. Consequently, mycotoxin and especially aflatoxin contamination has been attracting a remarkable scientific attention. Border rejections due to mycotoxin contamination have also been widely studied [8]. Nevertheless, the problem of aflatoxin contamination still occurs [9,10,11,12,13].
The severity of the existing situation regarding mycotoxin contamination of food and feed products is highlighted by the number of notifications for mycotoxin contaminated products by the European Rapid Alert System for Food and Feed (European Commission RASFF Portal). From 1981–2017, aflatoxins were the most frequently reported hazard category in RASFF, representing around 21% of all notifications [14]. Moreover, 290 notifications have been reported in RASFF since 1/1/2020 for mycotoxin contaminated products, either for border rejection or as an alert, while 253 of them referred to aflatoxin contaminated products.
For pistachio nuts, the EU maximum legal limit is 15 μg/kg of total aflatoxins and 12 μg/kg of aflatoxin B1, when being destined for subjection to sorting, or other physical treatment, before human consumption [15]. Pistachio nuts are often found to be aflatoxin contaminated in several regions of different continents, indicating the severity of aflatoxin contamination and its impact on food safety issues. It is estimated that up to 45% of humans’ aflatoxin exposure may be attributed to the consumption of aflatoxin contaminated pistachio nuts. In Europe, Greek pistachio are found to be aflatoxin contaminated [16], in Iran also [17,18], and finally in California, USA [19].
For the determination of aflatoxins and mycotoxins, various analytical methods have been developed, including High-Performance Liquid Chromatography (HPLC) [20] and Thin-Layer Chromatography (TLC) [21]. Although these techniques provide excellent sensitivities, they require skilled operators, high-cost equipment, and considerable sample pre-treatment [22,23]. Recently, new detecting, qualitative, and quantitative methods, such as Enzyme Linked Immunosorbent Assays (ELISA) [24], Fourier Transform Infrared (FT-IR) spectroscopic methods combined with chemometrics [25], cell-based biosensors [26], and lateral flow assays (LFA) [27], are being studied and developed for the enhancement of the accuracy and the range of mycotoxins to be tested. For the development of new methodologies, miniaturized and highly efficient detection systems must be taken into account for potential point-of-care application.
Several novel sensors have been developed during the last years for the on-site detection and determination of aflatoxin contamination of food products [28]. Aptasensors have been reported for the detection of aflatoxin contamination [29,30], especially of Aflatoxin B1 in peanuts and rice [31]. An electrochemical piezoelectric sensor has been reported for the detection of aflatoxin contamination of peanut [32], while immunosensors utilizing nano-particles have also been introduced [33,34]. As technological tools become increasingly accessible, smartphone-based biomimetic sensors have also been developed for the detection of aflatoxin contamination [35]. Cell-based biosensors have also been developed for the detection of aflatoxins [26]; however, there is a lack of research for immunosensors for aflatoxin detection in pistachio nuts.
Immunosensors are analytical instruments able to perform the analyte determination in a simpler and faster way against the high-cost conventional analytical techniques. The reactions between analytes, auxiliary reagents, and Ab molecules take place onto the transducer’s (electrode) interface or onto a polymer support closely attached to the transducer, thus avoiding further losses in the redox-active species that are involved in the electron transfer between the label (indicator) and electrode [36]. Biochemical reagents (Abs, conjugates with inert proteins, etc.) are attached to the support/electrode interface in order to prevent their leaching during the incubation with the sample and washing. The antibody’s orientation on the immobilizing surface may improve the immunosensor’s analytical performance. Several methods have been proposed for the highly oriented immobilization of antibodies. A traditional strategy is the reaction of the antibody amino groups with carboxyl groups of the supporting surface activated via coupling agents N-(3-dimethylaminopropyl)-N′-ethylcarbodiimide hydrochloride (EDC)/N-hydroxysuccinimide (NHS). However, immobilization while using this strategy, results in random orientation of Ab molecules [37]. One of the simplest and easiest strategies for oriented Ab immobilization is enlisting an amine functionalized surface. Surfactant- and polymer-based coatings, such as chitosan [38], starch [39], dextran [40], and its derivatives, have widely been used as coatings for electrode surface functionalization. Among these, carboxymethyl-substituted dextran (CM-dextran), which is an anionic derivative of dextran, is frequently utilized as coating material for biosensors assemblies due to its high density of carboxymethyl groups being available for chemical conjugations [41]. The use of this polymer offers several significant properties to the sensor surface, such as the hydrophilic environment beneficial for most solution-based biomolecular interactions and a defined chemical basis for covalent attachment of biomolecules to the surface while using a wide range of well-defined chemistries, since the negatively charged carboxyl groups allow for electrostatic concentration of positively charged molecules from solution, enabling efficient immobilization from dilute ligand [42].
Electrochemical detection offers unique opportunities for measuring the signal on Ab-Ag interaction in colored, turbid, and viscous media while using minimal sample volume and conventional instrumentation. During the last years, many sensitive electrochemical immunosensors have been fabricated for the sensitive detection of AFB1 at a range of 0.03–0.15 µg/L [43,44,45,46,47,48]. Several methods have been utilized for the characterization of the different steps of biosensors fabrication, from electrochemical techniques, including electrochemical cyclic voltammetry and impedance spectroscopy [49,50] to atomic force microscopy [51], and surface plasmon resonance (SPR) [52].
An impedimetric immunosensor is a sensitive and label-free methodology for the detection of antigen–antibody binding simultaneously, since it determines alterations in the electrical properties at the interface biosensor-sample solution that are associated with specific binding events due to the recognition between an analyte and an individual ligand. The most significant step is the immobilization of biomolecules on the electrode surface, due to the importance of a stable, reproducible, and selective generation of biosensors.
Herein, an electrochemical impedance immunosensor that is based on the immobilization of the AFB1 antibody on gold screen printed electrodes has been developed for the accurate screening analysis of pistachio samples. For this purpose, the ΑFB1 antibody was immobilized onto a gold screen-printed electrode carbo-methyldextran that was modified via the reaction of the antibody amino groups with carboxyl groups of the supporting surface activated by the coupling agents N-(3-dimethylaminopropyl)-N′-ethylcarbodiimide hydrochloride (EDC)/N-hydroxysuccinimide (NHS). The immunosensor was tested with several concentrations of AFB1 standard solutions and spiked pistachio samples. In addition, selectivity studies against other fungal mycotoxins and validation studies with unknown samples were performed. Thus, the aim of this work was to provide a sensitive and quick method for the quantitative determination of AFB1 in pistachio matrices.

2. Materials and Methods

2.1. Materials

Hydroxysucciminide (NHS, 98%), carbomethyldextran sodium salt (CM-dextran), Aflatoxin M1 (AFM1), and Aflatoxin B1 (AFB1) from Aspergillus flavus were obtained from Sigma–Aldrich (Saint Louis, MO, USA). N-(3- Dimethylaminopropyl)-N′-ethylcarbodiimide hydrochloride (EDC, >99%), and Ethanolamine (NH2CH2CH2OH, >99.5%) were purchased from Thermo Fisher Scientific (Waltham, MA, USA). Ochratoxin A was provided by n’Tox (Saint Jean d’Illac, France). AflaCLEAN immunoaffinity columns for the Aflatoxins B1, B2, G1, and G2 were obtained by LCTech GmbH (Obertaufkirchen, Germany). Aflatoxin B1 antibody (anti-AFB1) (0.5 mg/mL) was purchased from Abcam [AFA-1] (ab1017) (Abcam, Cambridge, UK), while all other chemicals were provided by Merck KGaA (Darmstadt, Germany). The Milli-Q-purified water Millipore (18.2 MΩ cm) was used for the preparation of buffer solutions.
The gold screen printed electrodes (DRP-250AT) were purchased from Metrohm DropSens, S.L. (Oviedo, Asturias, Spain). The screen-printed electrodes (SPEs) incorporate a three-electrode configuration, which comprises of a round-shaped gold (Au) working electrode (4 mm diameter), a platinum counter electrode, and a silver reference electrode.

2.2. Sampling

2.2.1. Orchard Sampling

In the frame of the current study, pistachio nuts were collected from pistachio orchards that were located on the island of Aegina, prefecture of Piraeus, close to Athens, Greece. Aegina is one of the largest pistachio producing areas in Greece, and its product is categorized as Protected Designation of Origin (PDO). Aegina pistachios are considered to be premium products in the European market due to the local ideal climate that promotes yields of high quality (organoleptic characteristics, excellent flavor, and appeal). For the abovementioned reasons, this region was selected for sampling. Sampling was carried out at all of the representative pistachio producing areas of the island. A total number of nine samples were collected at the stage of harvest (end of August 2018). Sampling was performed according to European regulation regarding methods of sampling (Commission Regulation (EC) No 401/2006). The samples were stored in a portable fridge and then transferred in the Laboratory for further analysis. After aflatoxin analysis, all nine naturally aflatoxin contaminated samples were selected for further use.

2.2.2. Aflatoxin Extraction and Preparation of Extract Solutions

Nine dried pistachio samples that were obtained from different aflatoxin orchards were analyzed. The Aflatoxin B1 concentration was measured according to the method described in detail in [16] with some modifications. The pistachio kernels of each sample were finely ground using a laboratory mill (Tekmar A-10, IKA-Labortechnik Janke & Kunkel GmBH&Co) and a subsample of twenty g was subjected to aflatoxin extraction using 100 mL 70:30 methanol: water solution followed by homogenization in a high- speed blender (Ultra Turax T 25 basic IKA, Werke 6500—24,000 rpm) for 5 min. The crude sample extract was filtered through a sterilized Whatman filter paper and then collected in sterilized falcon tubes. The samples were handled for further analysis, using the chemical immunosensor formed in the current work.
For aflatoxin analysis of samples using the HPLC method, an aliquot of 14 mL of the above-mentioned extract solution was added to 86 mL of PBS buffer (pH: 7.2) and then passed through a filter paper (Whatman No. 1, 110 mm diameter) and a membrane filter (Hydrophilic Polypropylene Membrane Filter GH Polypro 47 mm 0.2 mm, Gelman Laboratory) under pressure in order to remove residual turbidity. Fifty ml of the filtrated extract was slowly passed through an immunoaffinity column (AflaClean, 3 mL widebore, LC Tech Germany) under gentle vacuum in a Vacuum—Pressure Station (Air Cadet, Baman Co., USA) with a maximum flow rate of 2 mL/min, followed by triple elution with methanol (HPLC grade), and then collected in an amber tube. The eluate was evaporated to dryness under a gentle stream of nitrogen and stored in a refrigerator in the dark until analyzed. The dried eluate was re-diluted with 0.5 mL of the mobile phase solvents and then injected to HPLC.

2.2.3. Spiked Samples

Thirty grams of dried pistachio samples were finely ground, and a subsample of twenty g was subjected to aflatoxin extraction using 100 mL 70:30 methanol: water solution followed by homogenization in a high-speed blender as described in Section 2.2.2. Twenty mL of the filtrated extract was evaporated to dryness under a gentle stream of nitrogen and then stored in a refrigerator in the dark. The dried eluate was re-diluted with 0.5 mL of several concentrations of AFB1 standard solutions (0, 0.5, 1, 5, 10, 50, and 100 ng/mL). The initial AFB1 stock solution was obtained by the solubilization of AFB1 from Aspergillus flavus in methanol. The ratio of methanol to acetate buffer (pH 5.6) at the final AFB1 solutions was 1:1 in order to reduce the matrix effect.

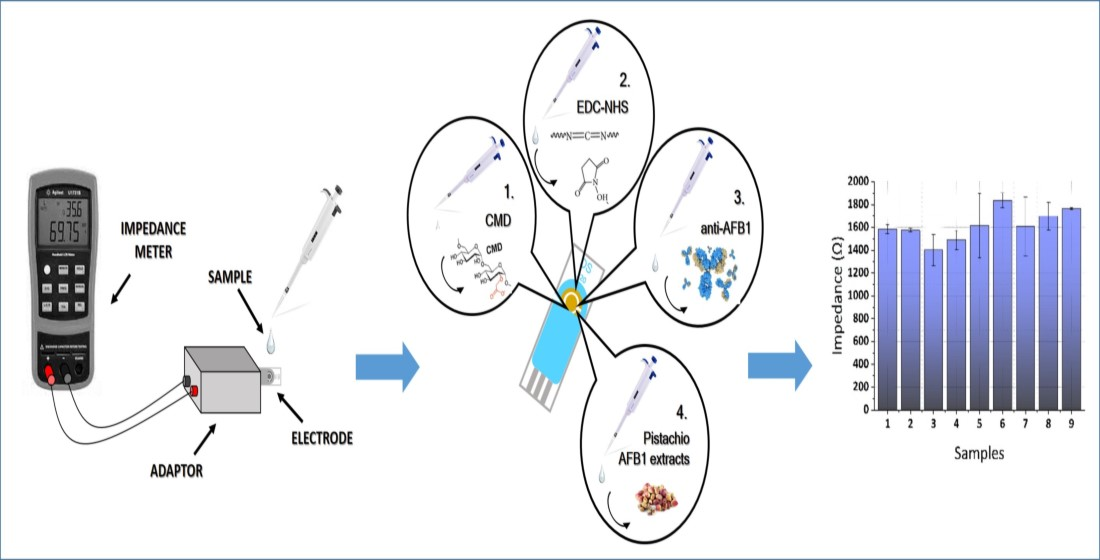
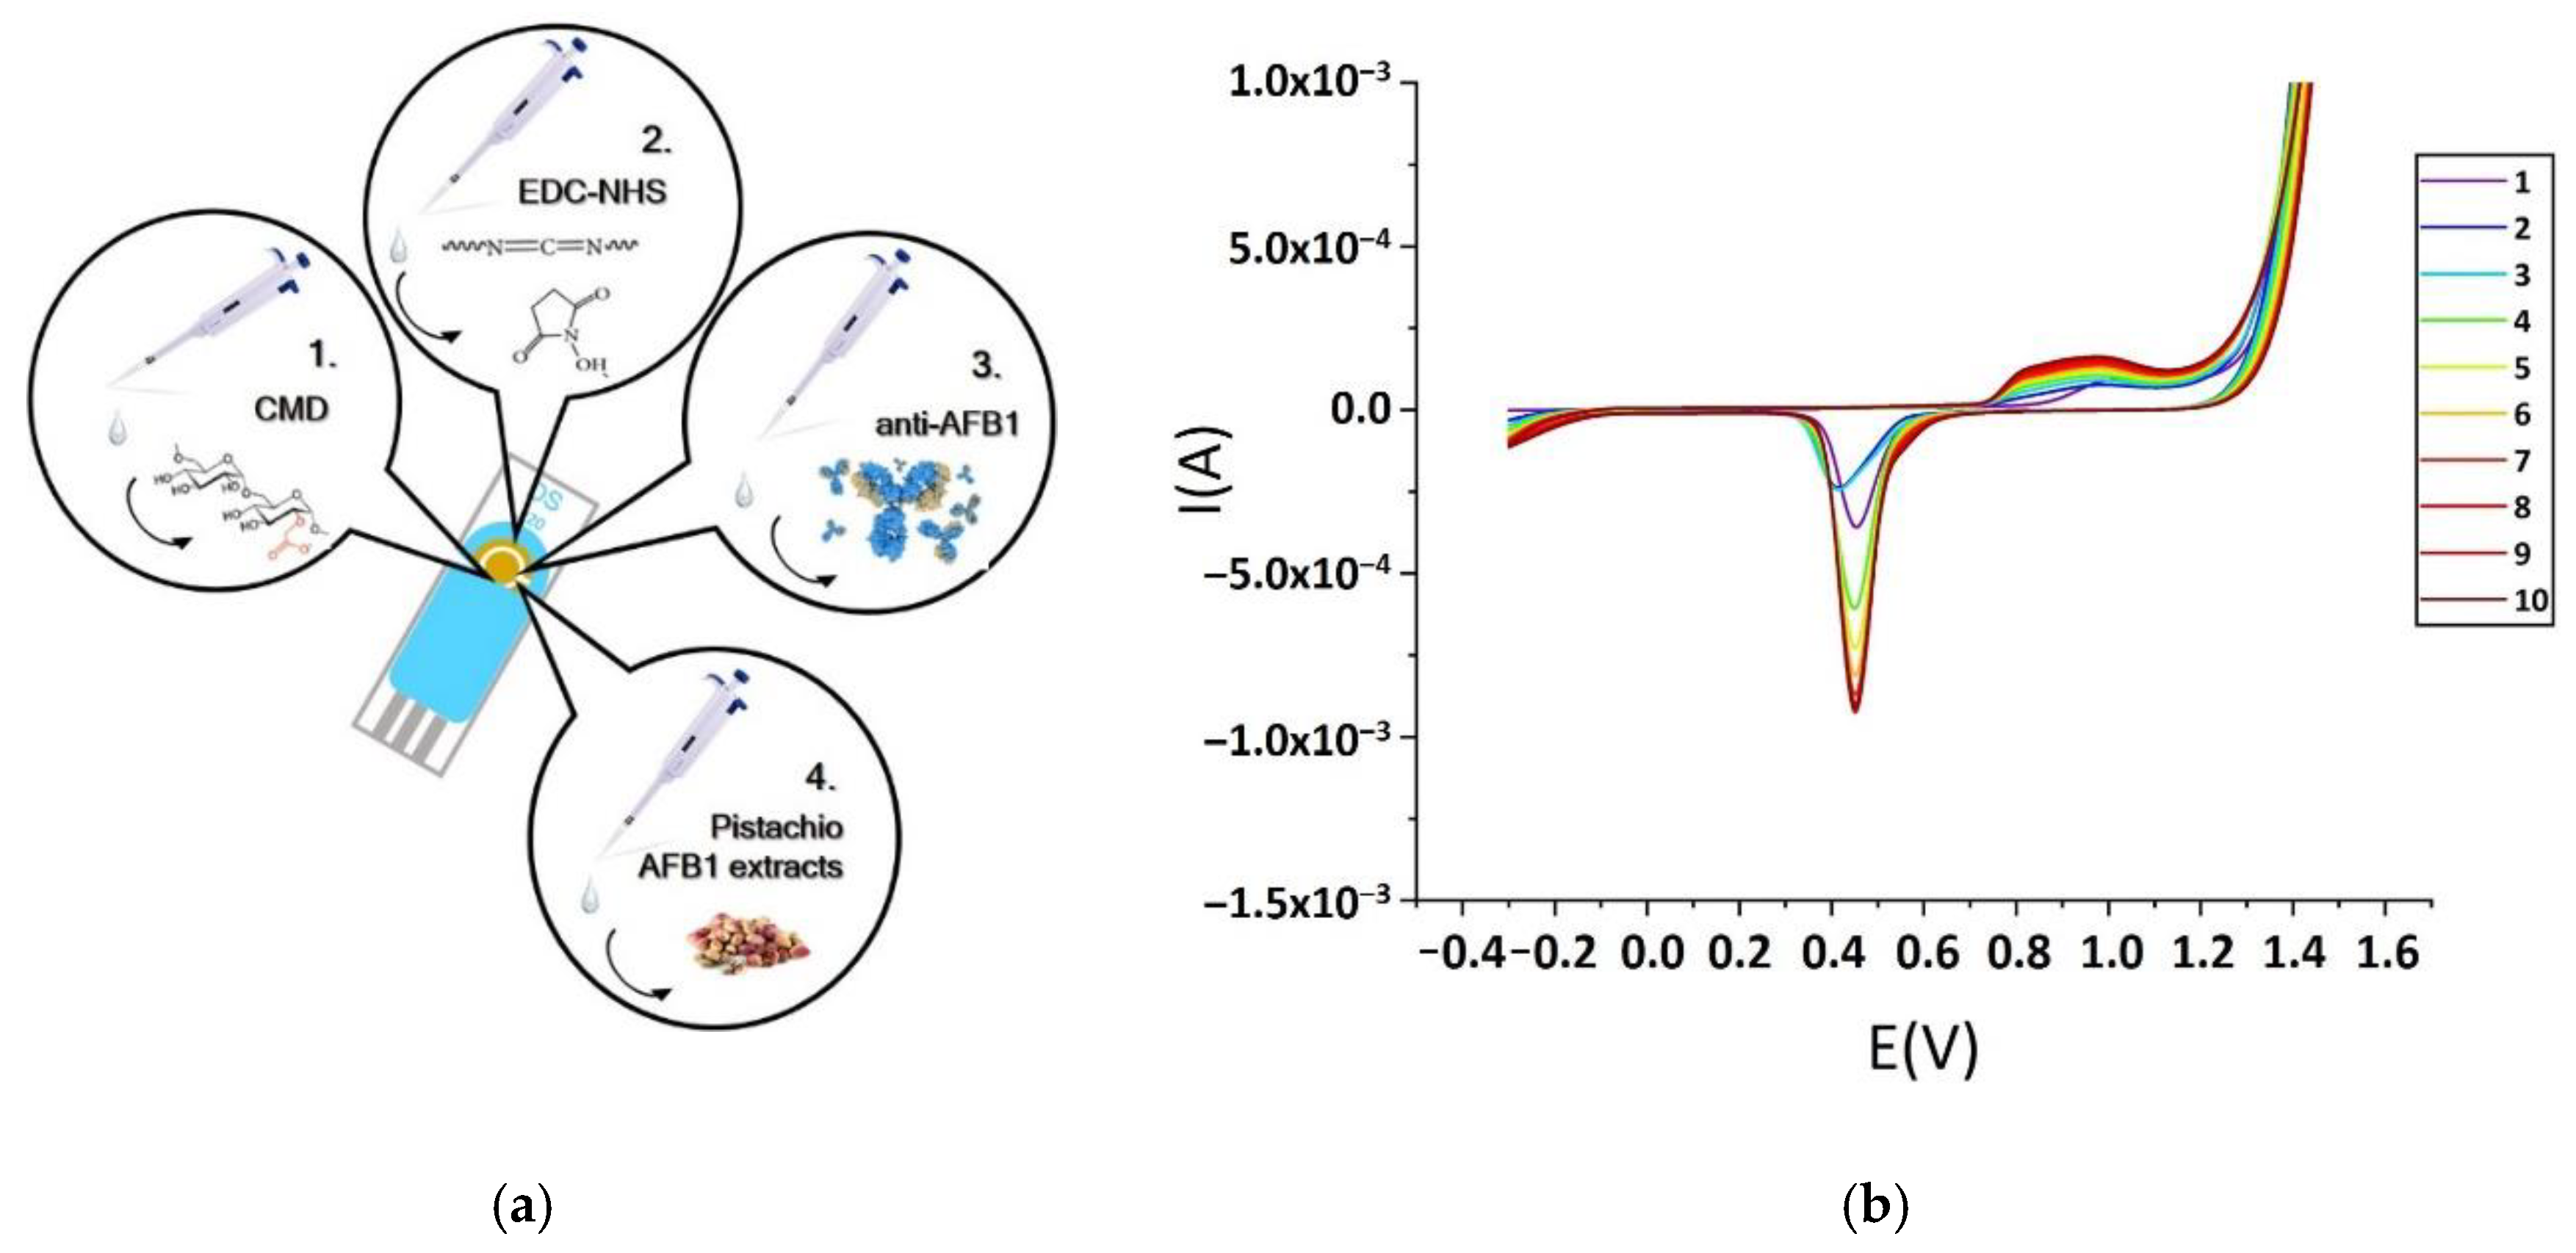
2.3. Biosensor Fabrication

2.3.1. Antibody Immobilization Procedure

Firstly, the Au screen-printed electrode was subjected to electrochemical pretreatment with 0.5 M H2SO4 solution by the application of 10 cycles of cyclic voltammetry between −1 and +1.5 V, with a 100 mV/s scan rate in order to obtain the characteristic voltammograms of the clean Au surface (Figure 1b). The electrode was then rinsed twice with 100 mL of double-distilled and sterilized water each time and finally dried in air. Subsequently, the working electrode was coated with 30 μL of CM-dextran solution (50 mg/mL in water) and was stored at 4 °C overnight.
For the antibody immobilization on the CM-dextran, the crosslinker EDC was used as a coupling agent and NHS as an activator [53]. The next day, 10 μL of a 1:1 mixture of EDC-NHS (0.4 M EDC and 0.1 M NHS prepared in distilled water) was dispersed over the surface of the working electrode and it was kept under humid conditions at room temperature for 40 min, allowing for the reaction to proceed. After each step, the electrode surface was rinsed thoroughly with copious amounts of water for removing the unbound material. After that, 10 μL of the anti-AFB1 solution in acetate buffer was dispersed over the electrode surface and then kept in a humid chamber for 1 h at 25 °C. The acetate buffer pH 5.6, comprised of 0.1 M acetic acid and 0.1 M sodium acetate. After the incubation, the electrode was rinsed again in water in order to remove unbound antibodies. Finally, the unreacted sites were blocked with 1 M ethanolamine (15 min incubation), and the electrode was stored at 4 °C for further use. The day of the impedance measurements, the AFB1 standard solutions or pistachio samples were incubated on the electrode’s surface for 1 h at room temperature and then the electrodes were rinsed once again with water. Figure 1a illustrates the successive steps of the immunosensor fabrication.

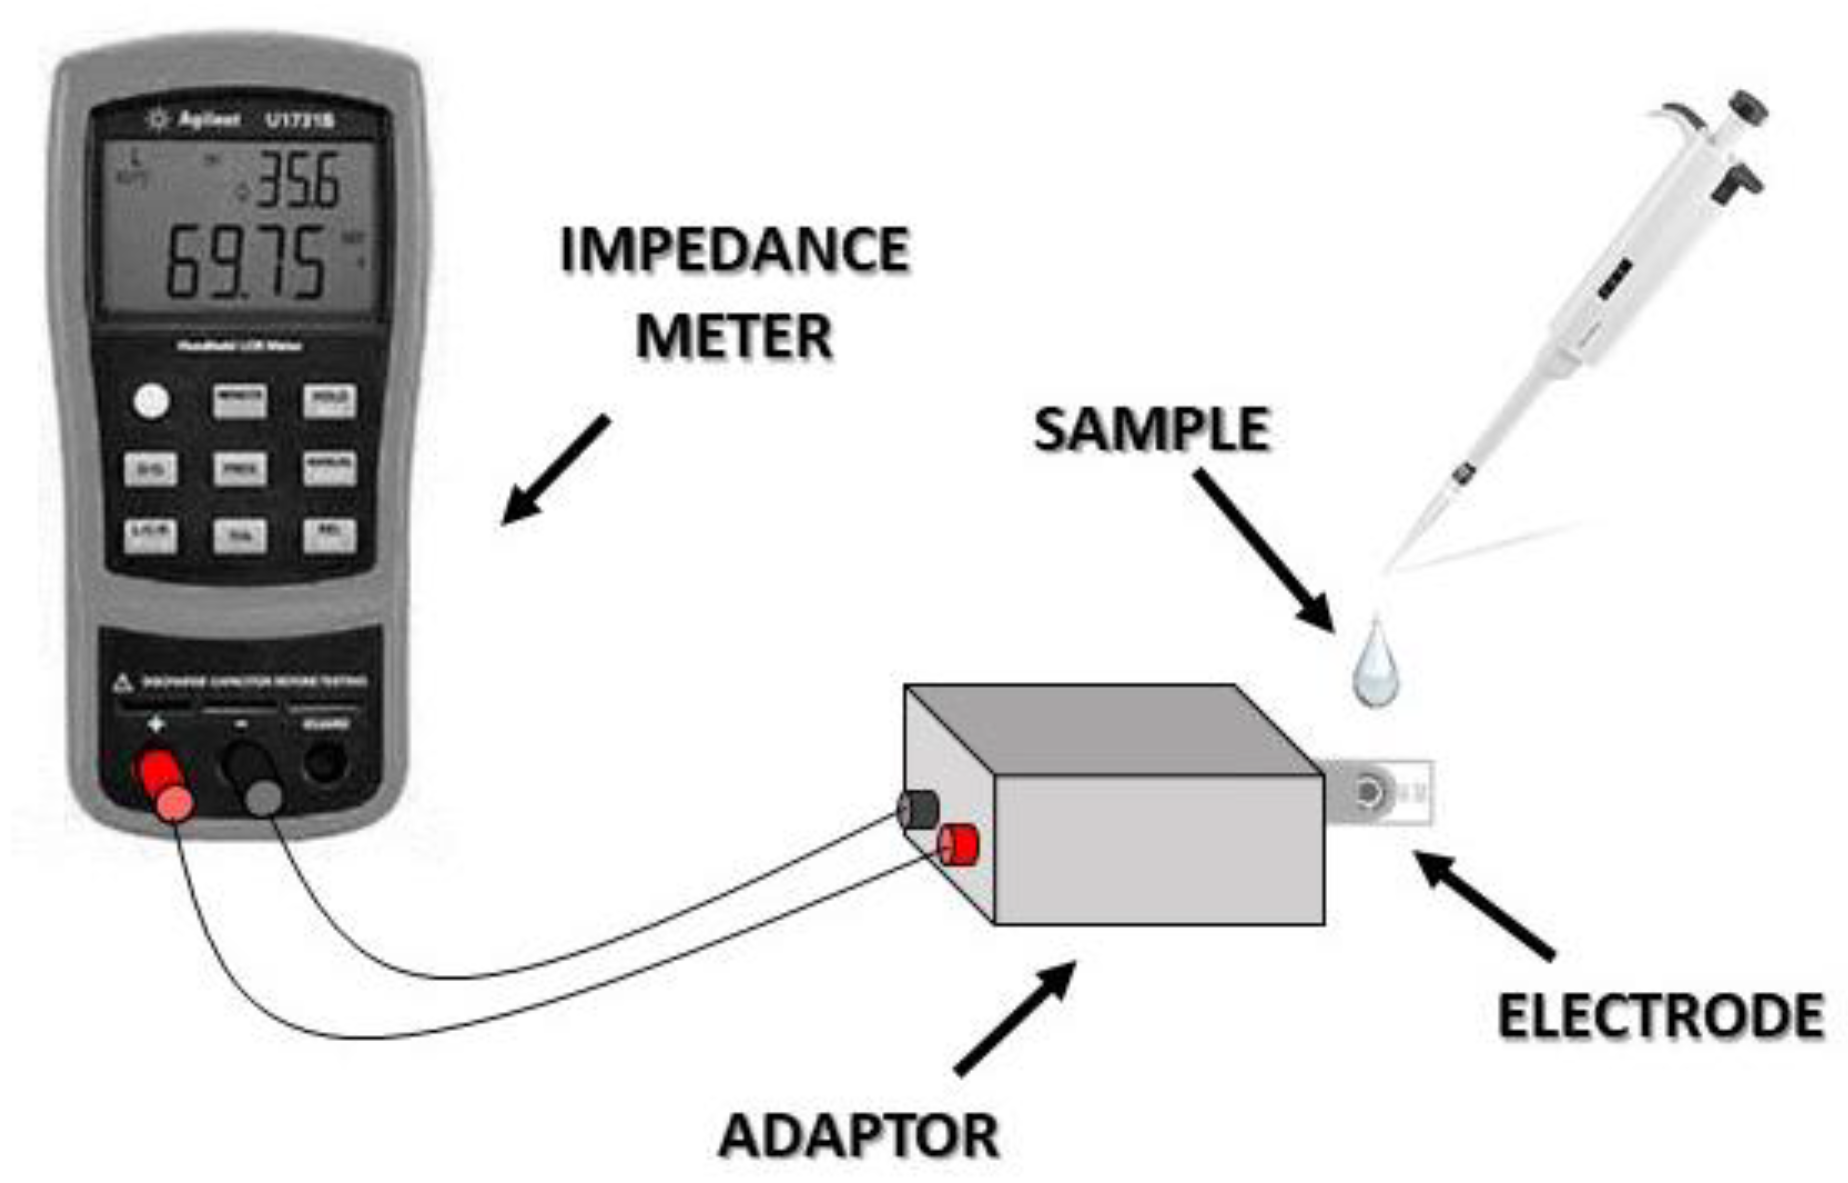
2.3.2. Biosensor Measurement

For each experimental procedure, the electrode containing the sample to be tested was placed to the DRP-DSC79314 screen printed electrode adaptor (DropSens, Oviedo Asturias, Spain) that is able to connect to the impedance meter. Subsequently, 40 μL of acetate buffer pH 5.6 were added onto the electrode’s surface before starting the impedance measurements recording. Because of the compatibility of the device, the counter electrode of the three screen-printed electrode assembly was not connected. Only the working and reference electrode responses were taken into account. The electrochemical impedance measurements were carried out while using a handheld LCR meter U1733C (Figure 2) from Keysight Technologies (Santa Rosa, CA, USA); according to the instrument’s capability and the measurements were performed at three different frequencies (1 KHz, 10 KHz, and 100 KHz) for the direct extraction of impedance magnitude of the sample tested. The best logging interval of the instrument is one measurement per sec; each measurement lasted 3 min, thus the total values obtained for each run were 180 with a measurement frequency of 1 Hz. The recorded results were presented as the mean of the absolute (ABS) value of the impedance (|Z|(Ω)) values obtained during the 180-sec measurement due to the simplicity of the device. The determination of the limit of detection (LOD) was calculated based on the standard deviation of the response of the curve and the slope of the calibration curve. In particular, the equation used was: LOD = 3.3 (standard deviation/slope of the calibration curve).

2.4. Quantitative Determination of Aflatoxin B1 Using HPLC

Quantitative determination of aflatoxin B1 took place by a reversed-phase HPLC system that was equipped with a JASCO PU 980 pump and injection system (JASCO, Easton, MD, USA) with a 100 μL injection loop, an ODS Hypersyl column (4.6 × 250 mm, 5 μm particle size, Thermo Scientific, Waltham, MA, USA), a photochemical reactor (LCTech) for post-column derivatization and a JASCO FP-920 fluorescence detector supported by Clarity Lite software. An isocratic mixture of water: methanol: acetonitrile (6:2:2) at a flow rate of 1 mL/min was used as a mobile phase. The solvents of the mobile phase were filtered through 0.2 mm membrane filters and degassed while using an in-line multi-channel vacuum degassing module (VWR, Model 2004) prior to the HPLC pump. Aflatoxin B1 was detected and quantified by fluorescence detection at an excitation wavelength of 360 nm and emission wavelength of 435 nm. The AFB1 quantity was determined by the respective calibration curve that was prepared using several calibration solutions (20–150 μg/kg) and it was checked for linearity (R2 > 0.99). The recovery value of the method was derived from spiked finely ground pistachio kernels contained 2, 4 and 8 μg/kg aflatoxin B1. Each sample was analyzed in triplicate.

2.5. Data Analysis and Experimental Design

A unique electrode was used for the measurement of each sample. All of the experiments were designed completely randomly and each experiment was carried out three times. The extracted results were illustrated with the mean ± SD values. For statistical significance, a multiple Student’s T-test was used for the differences between means. The adjusted p-values < 0.05 (two-sided) were considered to be statistically significant.

3. Results and Discussion

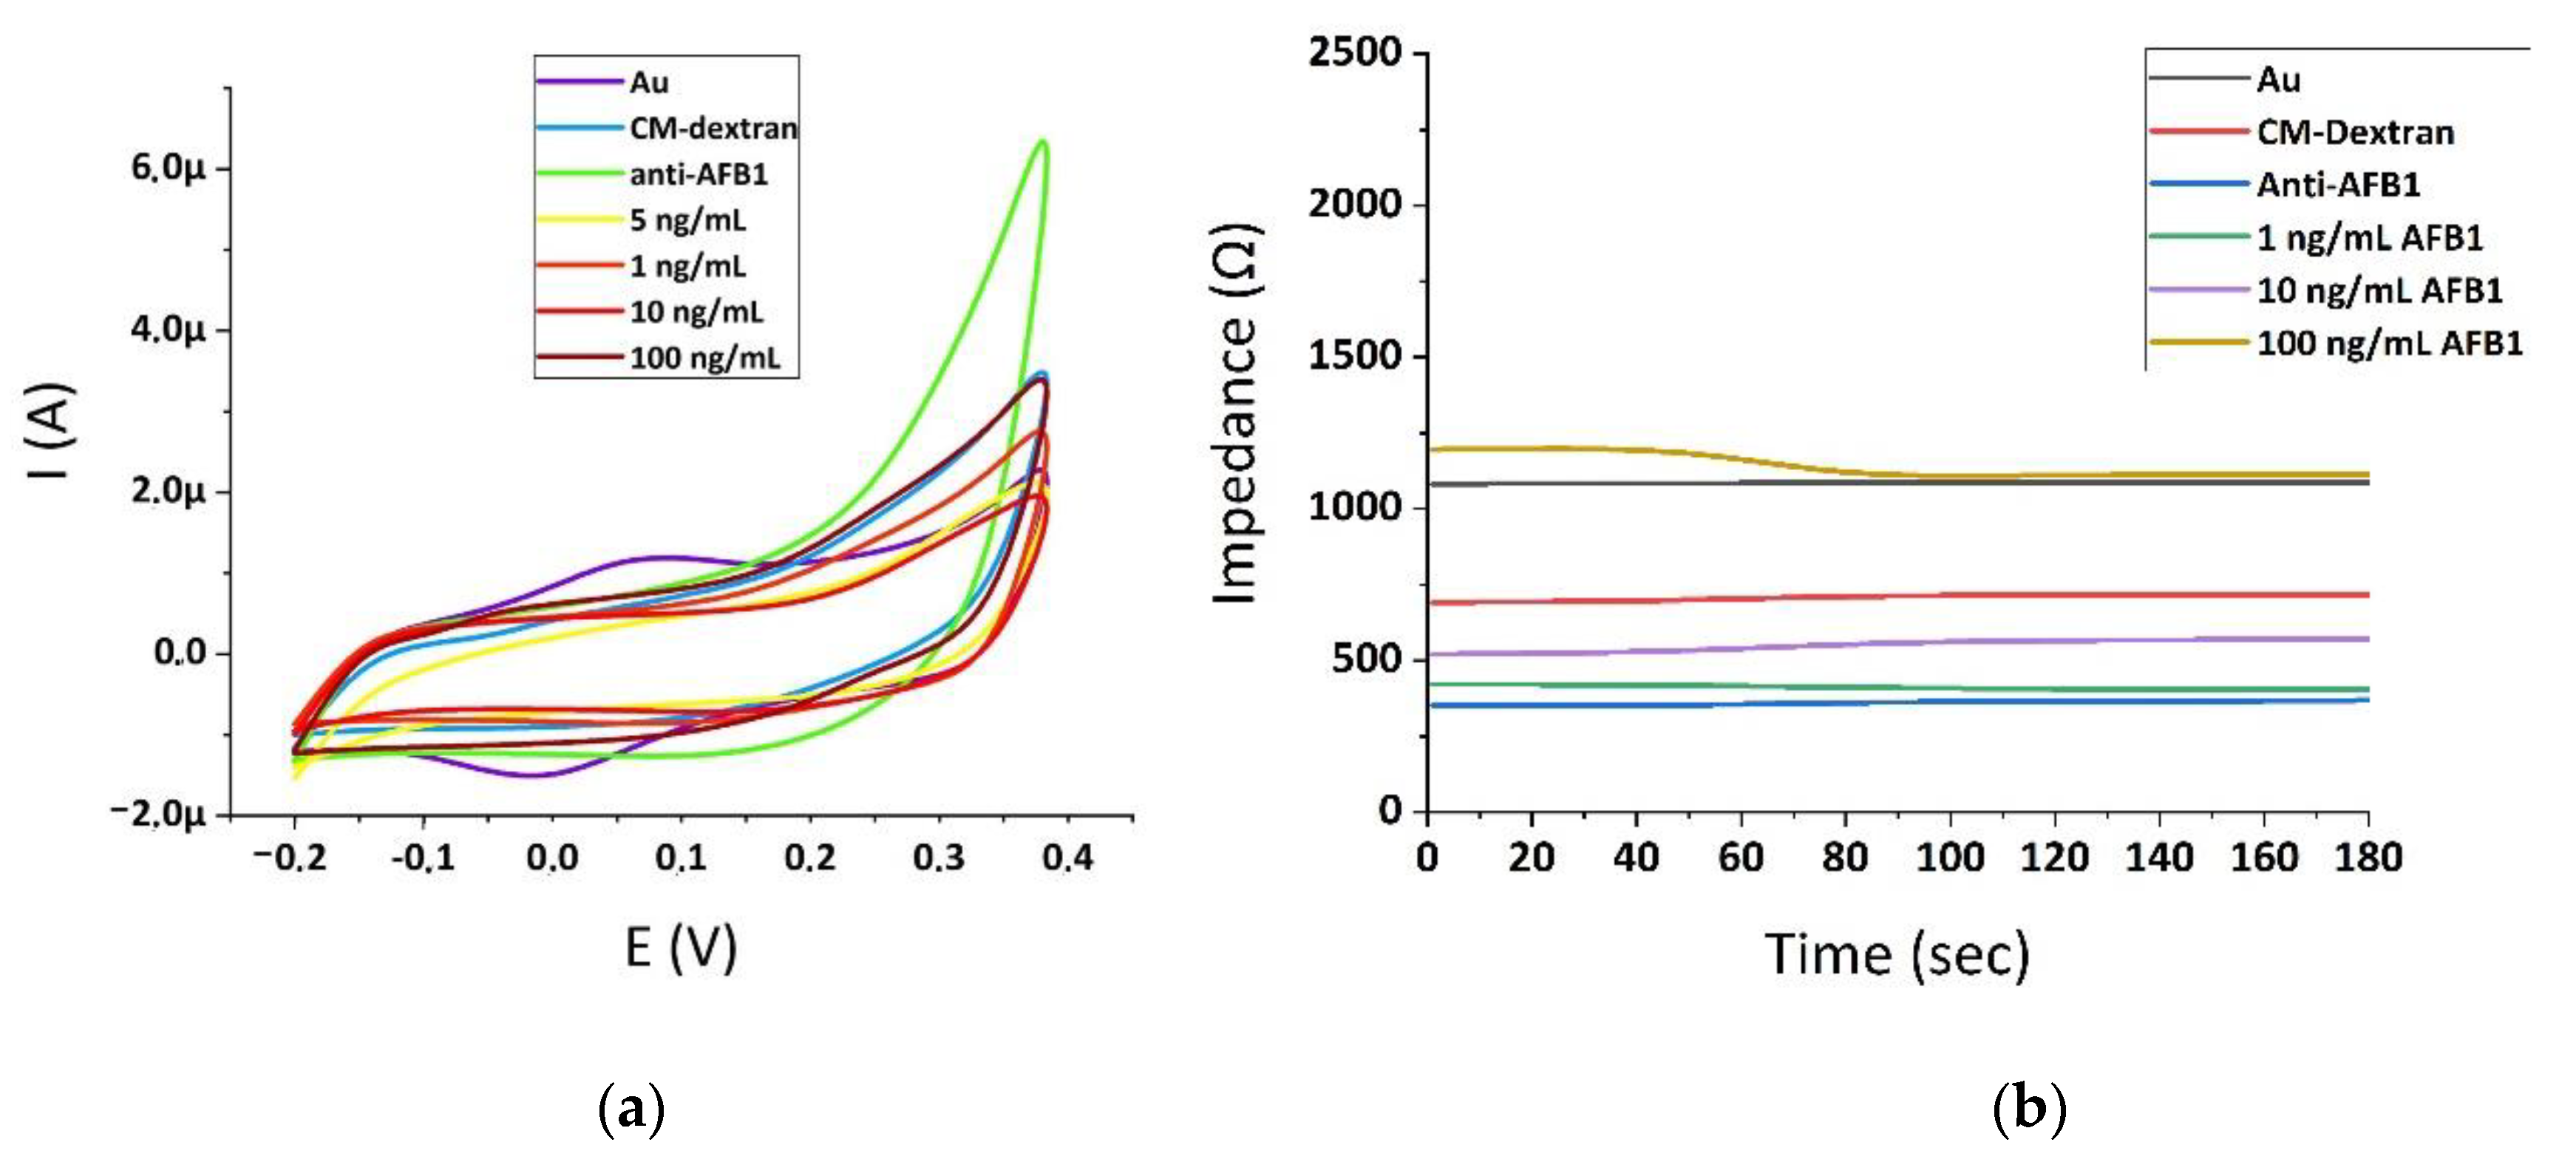
3.1. Optimization of the Biosensors’ Performance Characteristics

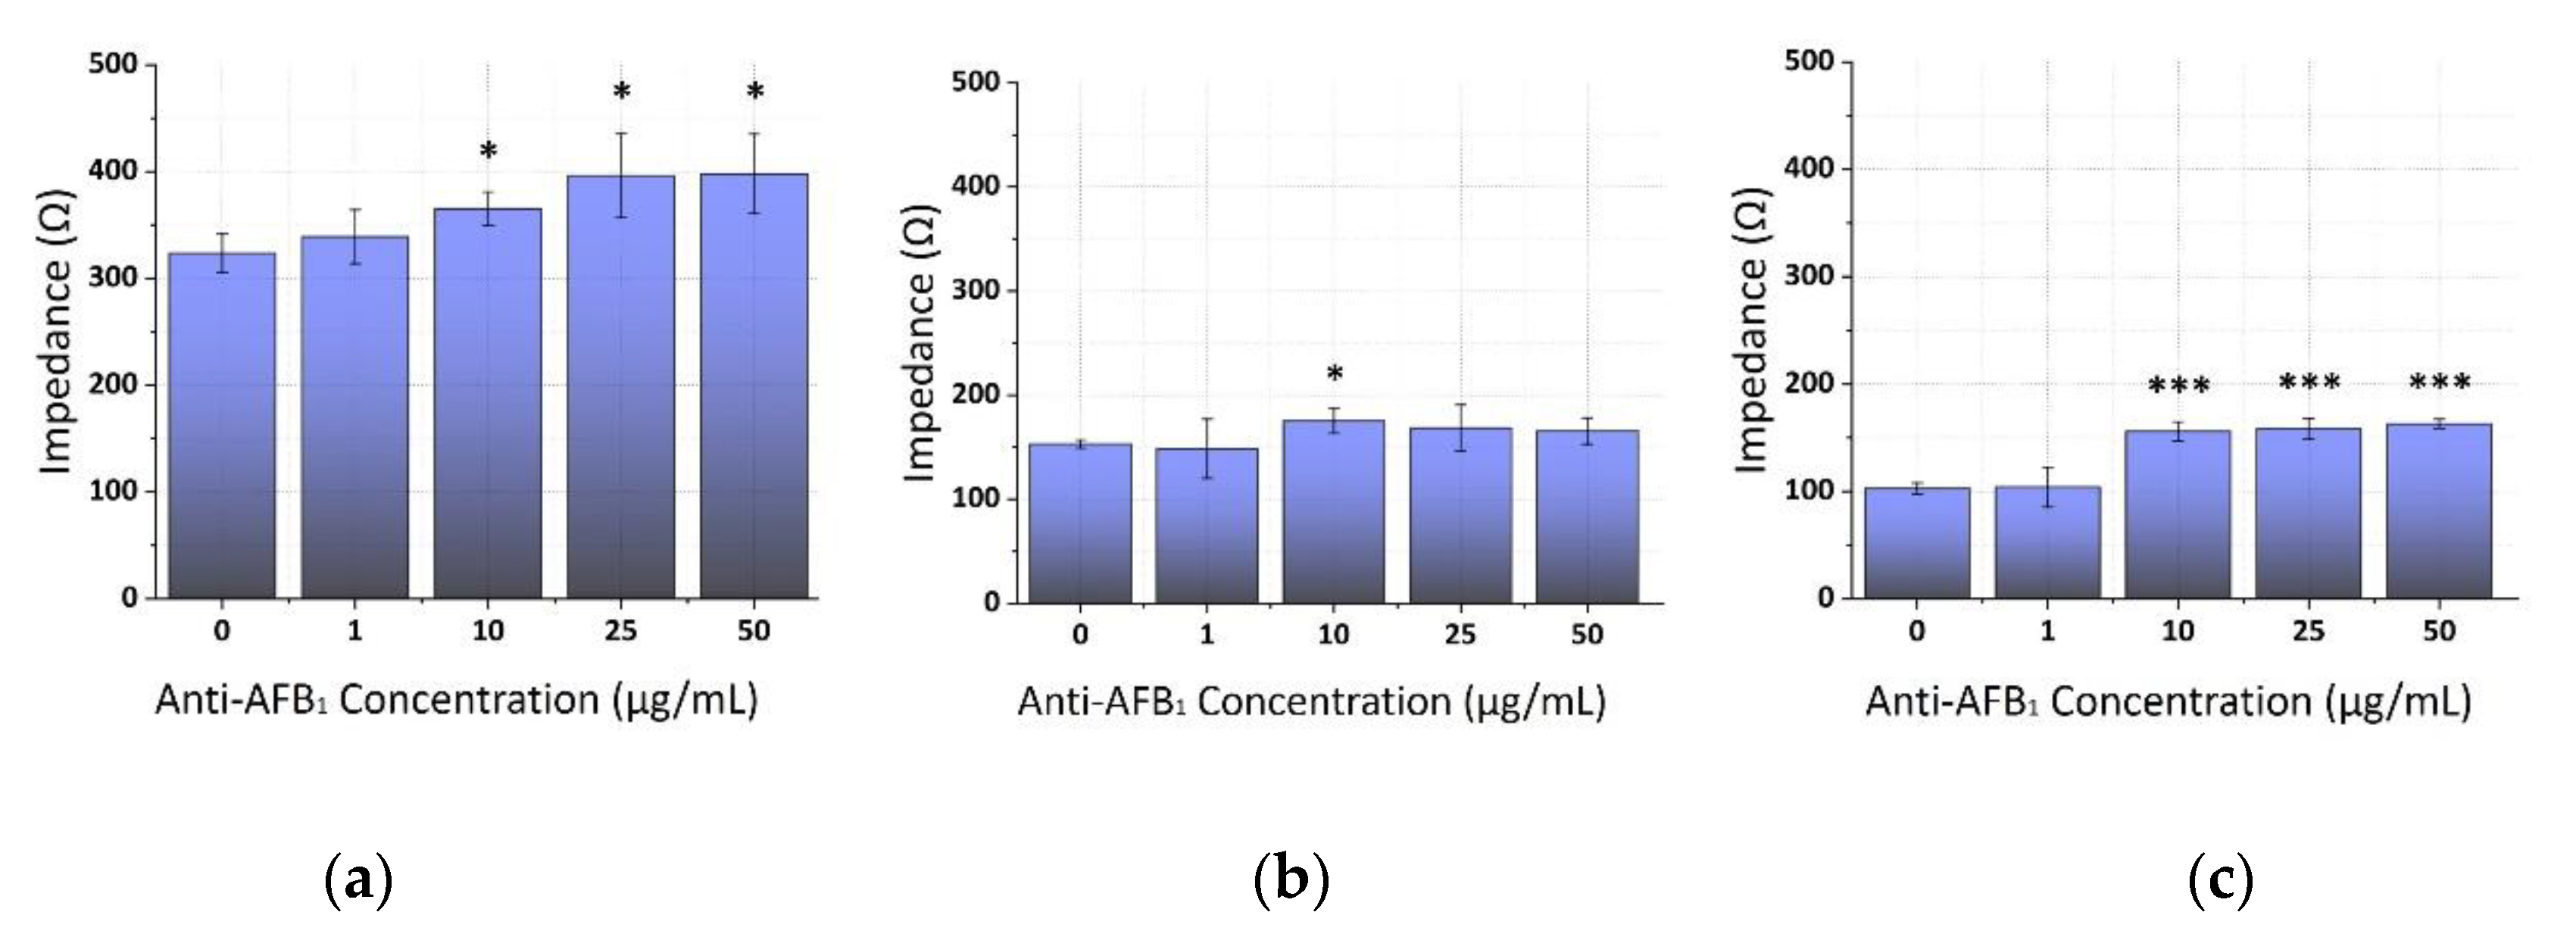
3.1.1. Optimization of the Anti-AFB1 Concentration

The 5 ng/mL AFB1 concentration was selected for the optimization antibody studies, as it is observed within the linear range of many direct impedance-based biosensors’ performances [54,55,56]. Upon exposure to 5 ng/mL of aflatoxin B1 (AFB1), the impedance immunosensor demonstrated a strong response with the increment of the monoclonal antibody (anti-AFB1) concentrations expressed by a significant increase in the mean impedance values. This response reached a plateau at anti-AFB1 concentrations that were higher than 10 μg/mL at all frequencies applied (1, 10, and 100 KHz), as illustrated in Figure 3. Additionally, the response of the control was entirely distinct from the response that was recorded upon the addition of the AFB1 solution to the immunosensor.

3.1.2. Studies on the Binding of the Analyte

Initially, the control experiments were performed by the use of cyclic voltammetry in order to monitor the various stages of the immunosensor building onto the gold electrode’s surface. The voltammograms were recorded after all the steps of electrode modification and also after the addition of several concentrations of AFB1 took place. Figure 4a shows the cyclic voltammograms in acetate buffer (pH 5.6) of a clean gold electrode (Au), after modification with the carbomehtyl-dextran (CM-Dextran), after functionalization with anti-aflatoxin B1 antibody (anti-AFB1), and finally, after incubation with Aflatoxin B1 (1, 5, 10, and 100 ng/mL). The cyclic voltammetry experiments were conducted between −0.2 and +0.4 V, with a 100 mV/s scan rate. The behavior of the cyclic voltammograms presented is significantly affected by the addition of each substance in every step of the electrode’s functionalization. The modification of the electrode with anti-AFB1 leads to an increase of the anodic peak in comparison with the voltammograms of the plain Au electrode and after CM-Dextran functionalization. However, when the immunochemical reaction with the AFB1 molecules took place, we observed a decrease in the response. As AFB1 concentrations increased the responses recorded significantly raised. These patterns were in accordance with the results of the impedance analyses, as can be seen in Figure 4b.
Control experiments were also conducted in order to study the effects of the analytes and the matrix to the sensor’s performance characteristics. Figure 5 illustrates the results of the absolute mean impedance magnitude of the respective control experiments in standard buffered solutions and pistachio extracts with and without the addition of 5 ng/mL AFB1 for the three frequencies tested (1, 10, and 100 KHz). From these results, it is obvious that components of the pistachio extracts increased the observed impedance magnitude in a non-specific way, which was possibly due to their adsorption on the anionic dextran polymer-based coating. Naturally, this hypothesis merits further investigation in the future. In addition, Figure 5d depicts the biosensor’s results from a 1:1 dilution, where we could obtain better sensitivity. Because the aim of this work was to develop a biosensor capable of detecting low AFB1 concentrations in commercial samples we decided not to try higher dilution factors.

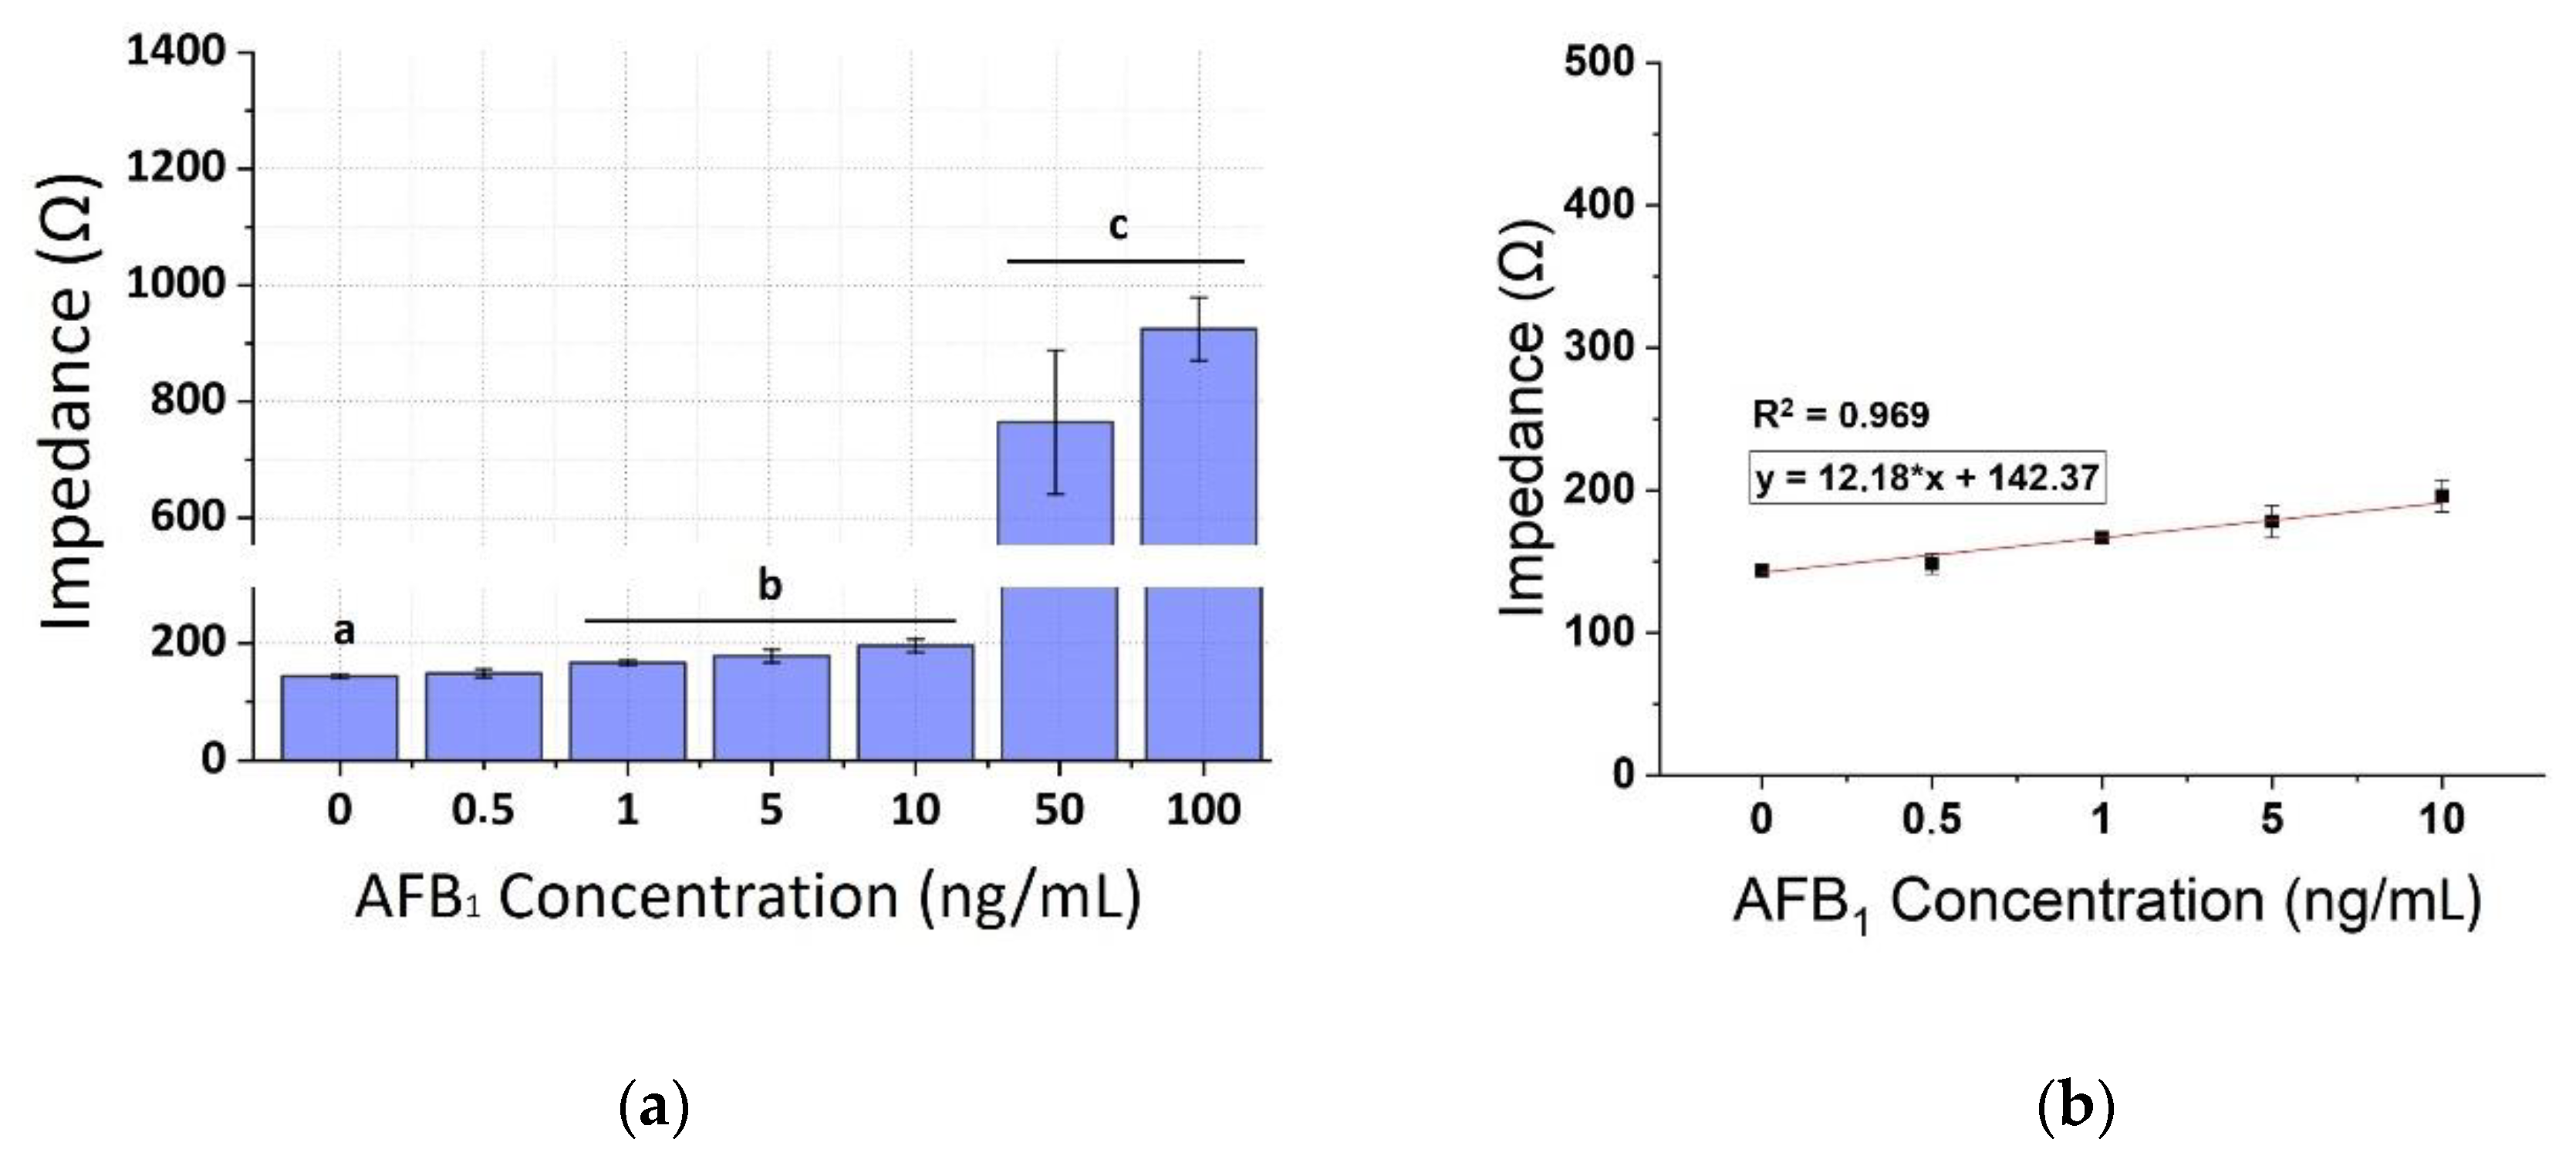
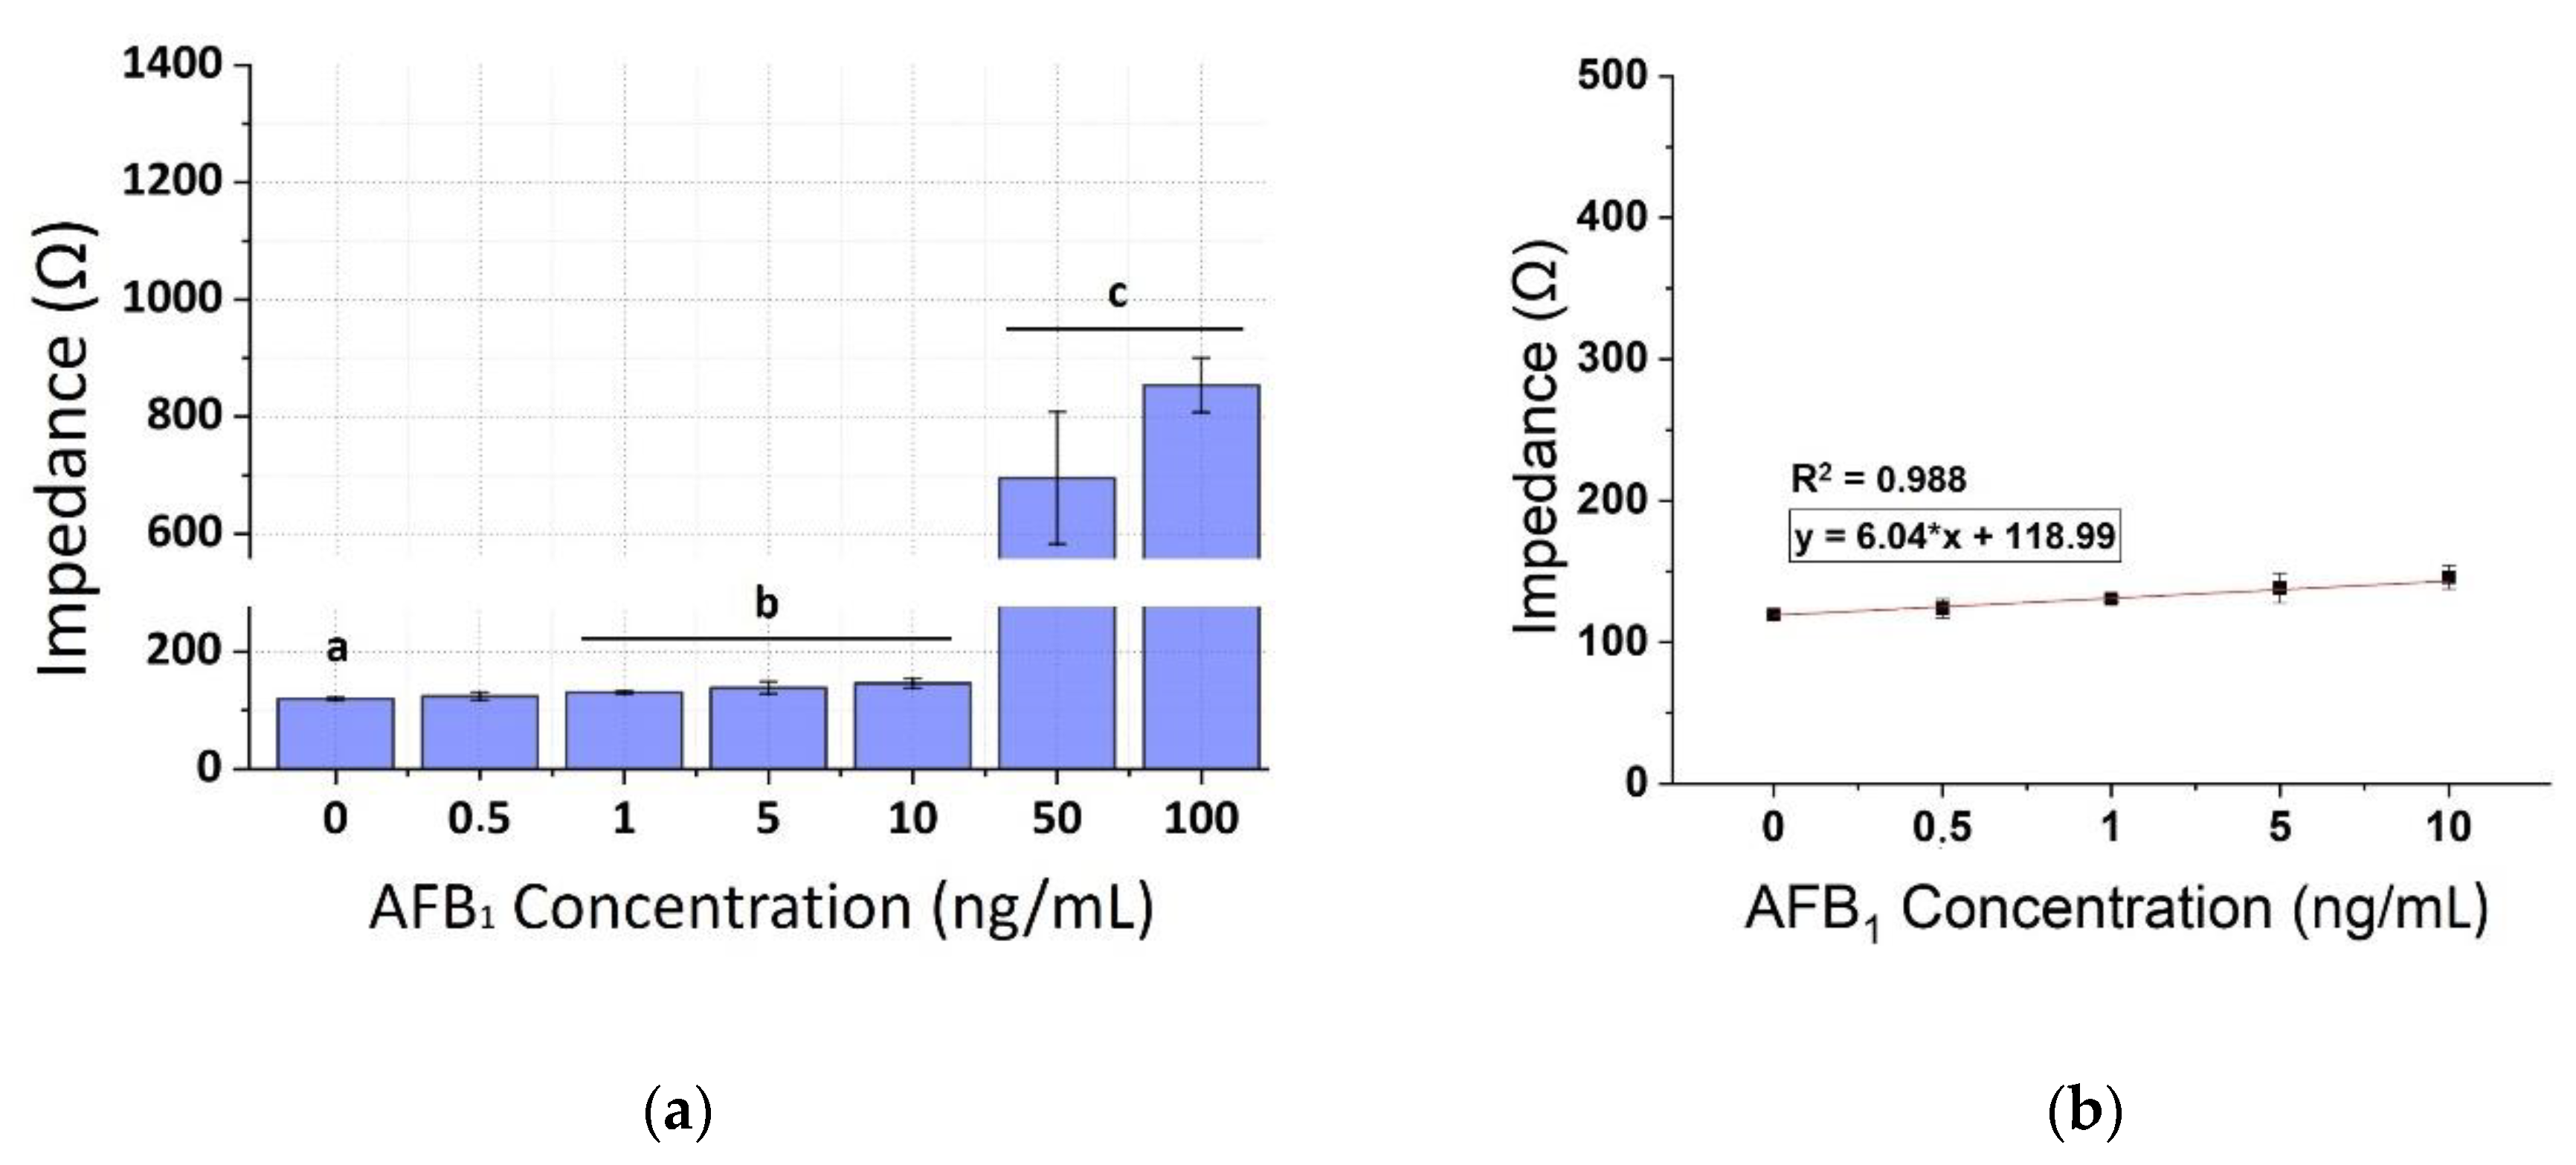
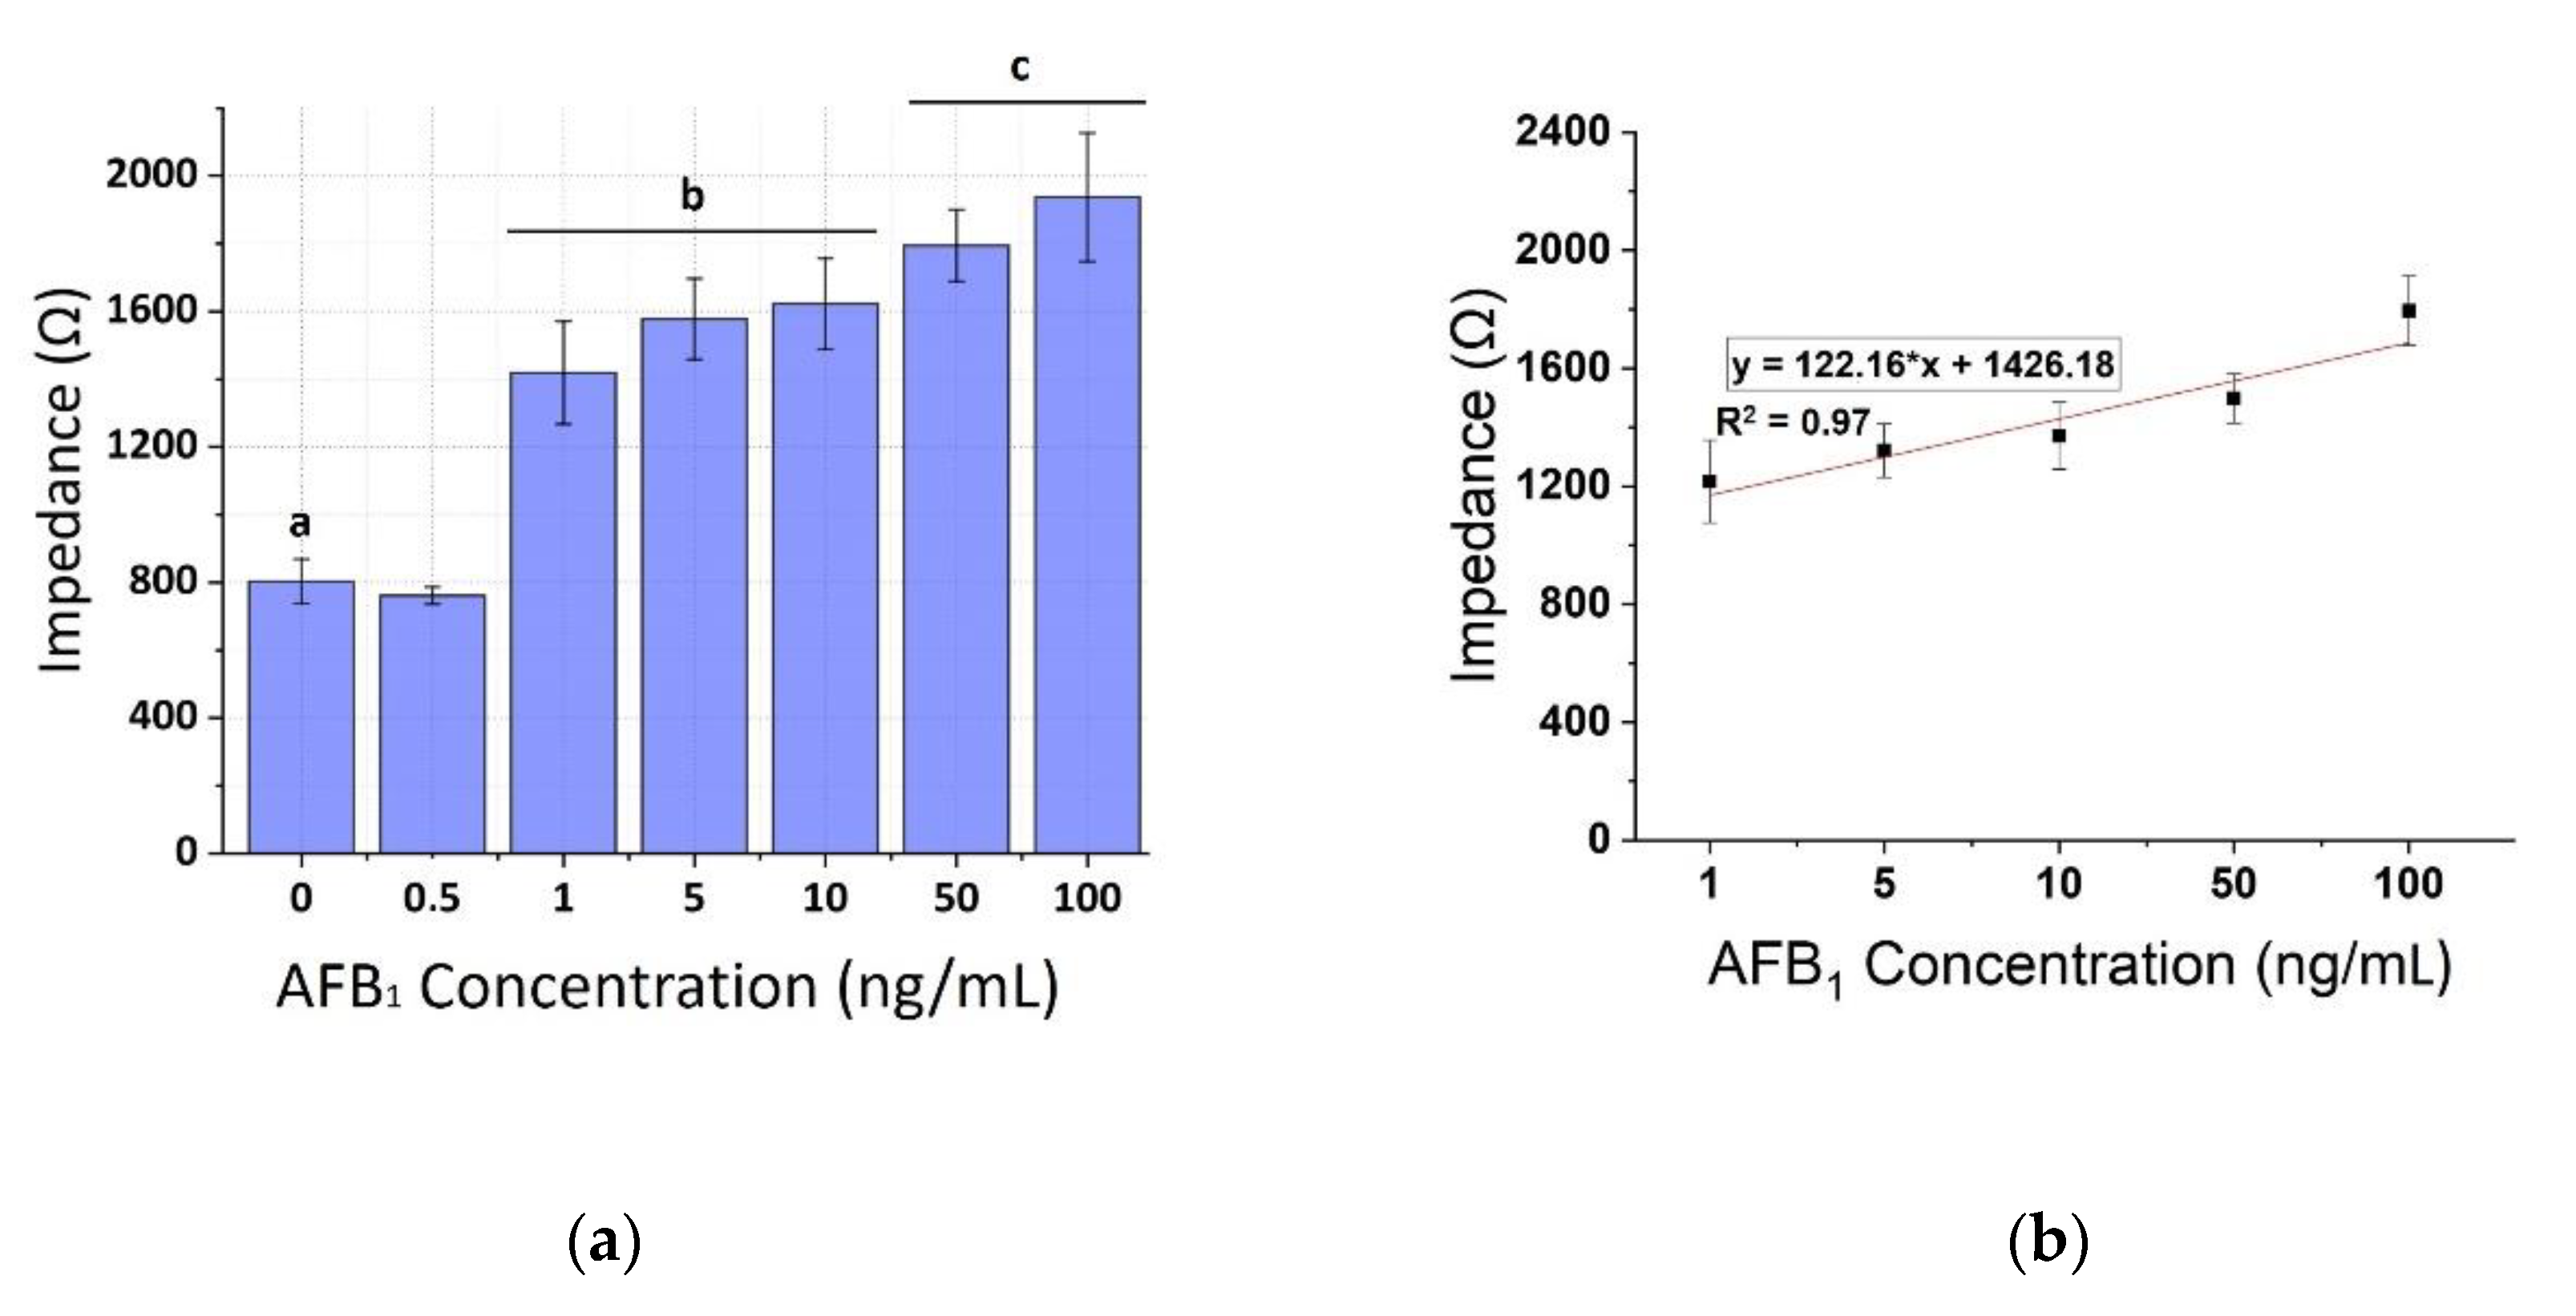
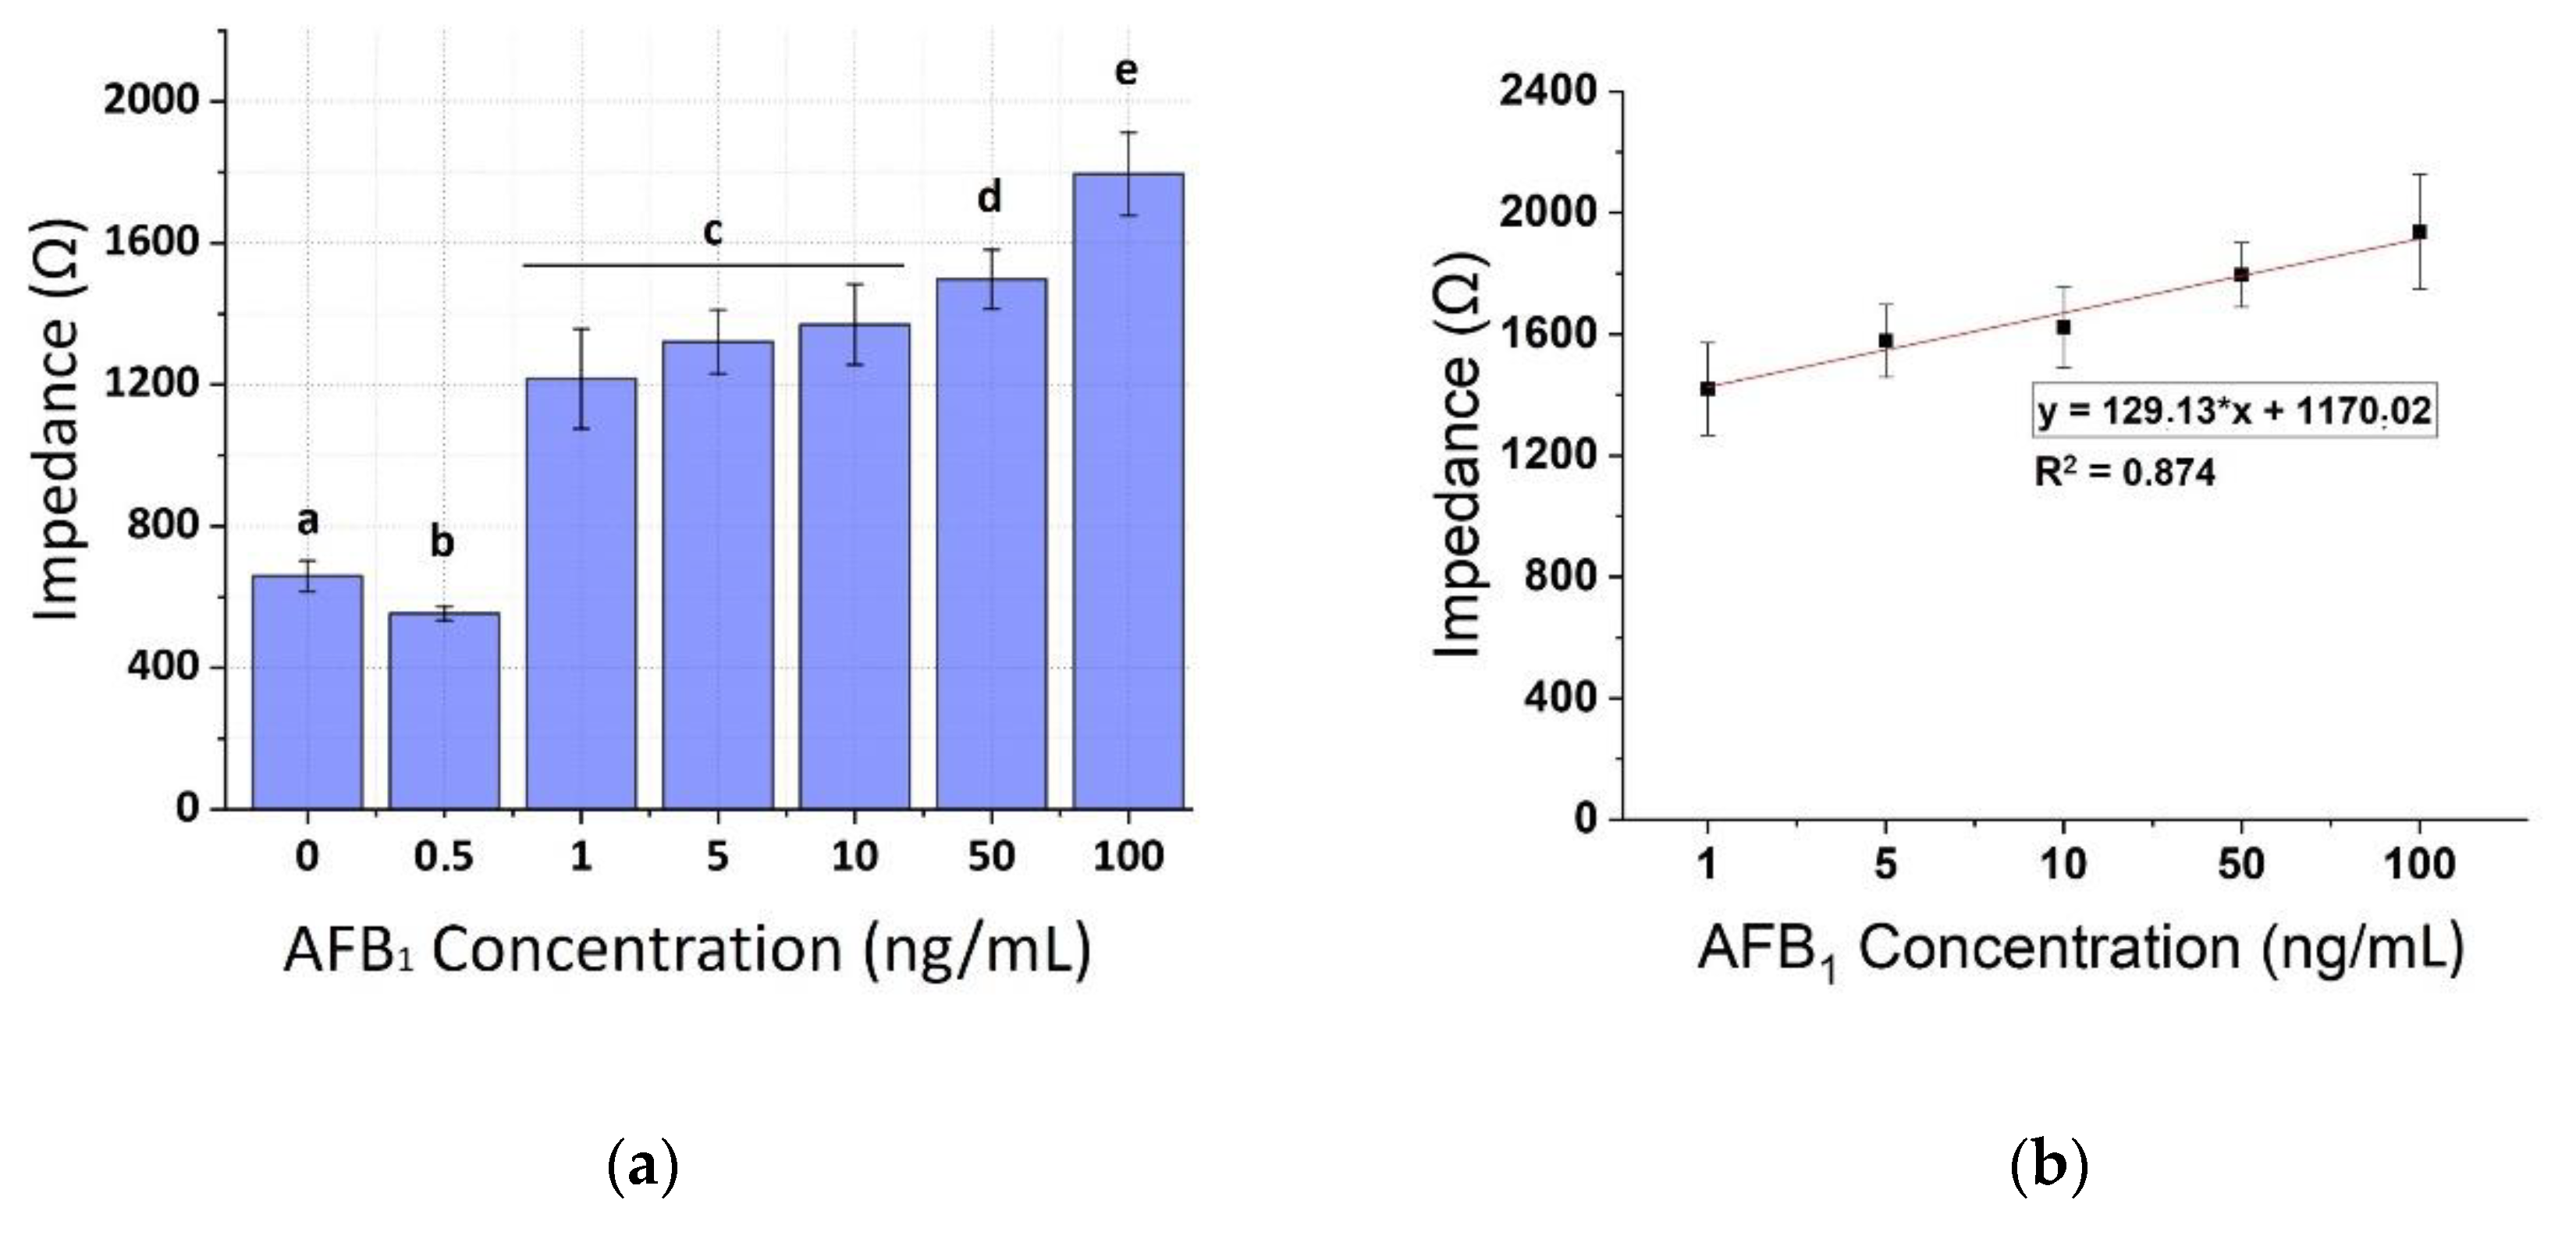
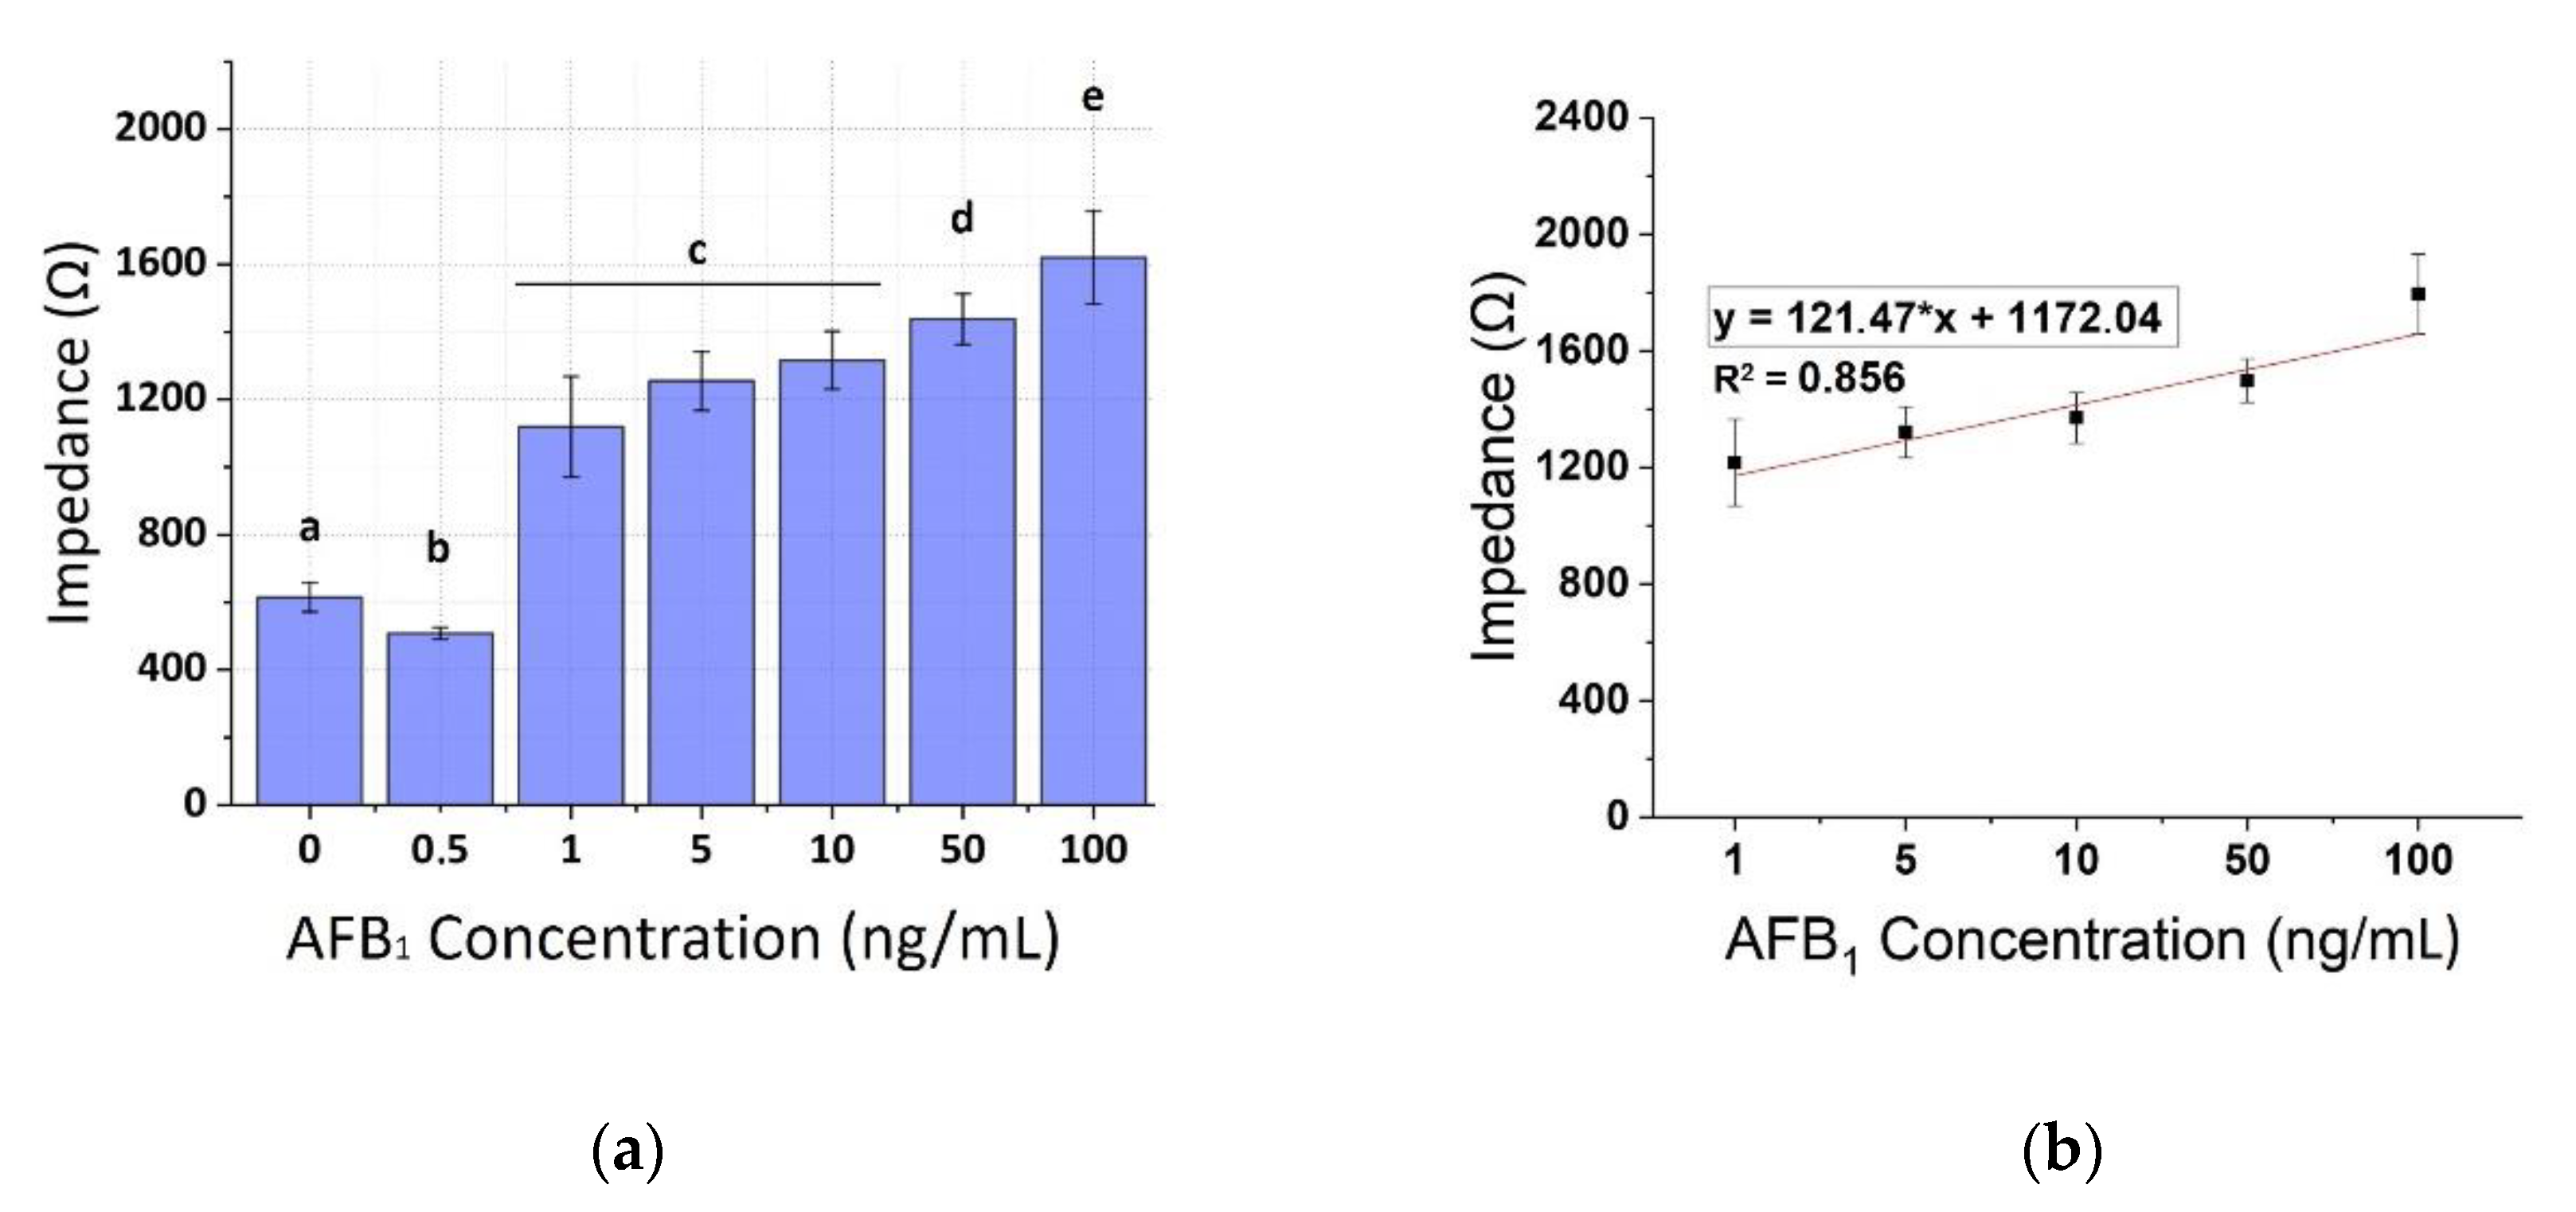
3.2. Biosensor Response Study on AFB1 Standard Solutions

The calibration curves of AFB1 standard solutions have been plotted for concentrations ranging from 0.5–100 ng/mL for the three frequencies applied (1, 10, and 100 KHz), as shown in Figure 6, Figure 7 and Figure 8, respectively. A concentration-dependent response was observed during the assay of increasing concentrations of the AFB1 with the anti-AFB1 based immunosensor with 10 μg/mL human chimeric anti-AFB1 antibodies (Figure 6, Figure 7 and Figure 8), with a linear pattern in the range 0.5–10 ng/mL observed in all frequencies tested (R2 ranging between 0.88–0.93). The measurements at each AFB1 concentration were distinct and significantly different from the control solutions (zero AFB1 concentration). The biosensor was also able to detect the higher AFB1 concentration (50 and 100 ng/mL). As the frequency increased, a slight decrease in the mean impedance values was observed. The results were quite reproducible, with an average variation of 4.14% over almost all assayed concentrations (at 50 ng/mL the average standard deviation percentage was 16.26%). The immunosensor was able to successfully detect AFB1 concentrations down to 0.5 ng/mL. Table 1 presents, in detail, the parameters used for the extraction of the linear fit curves.

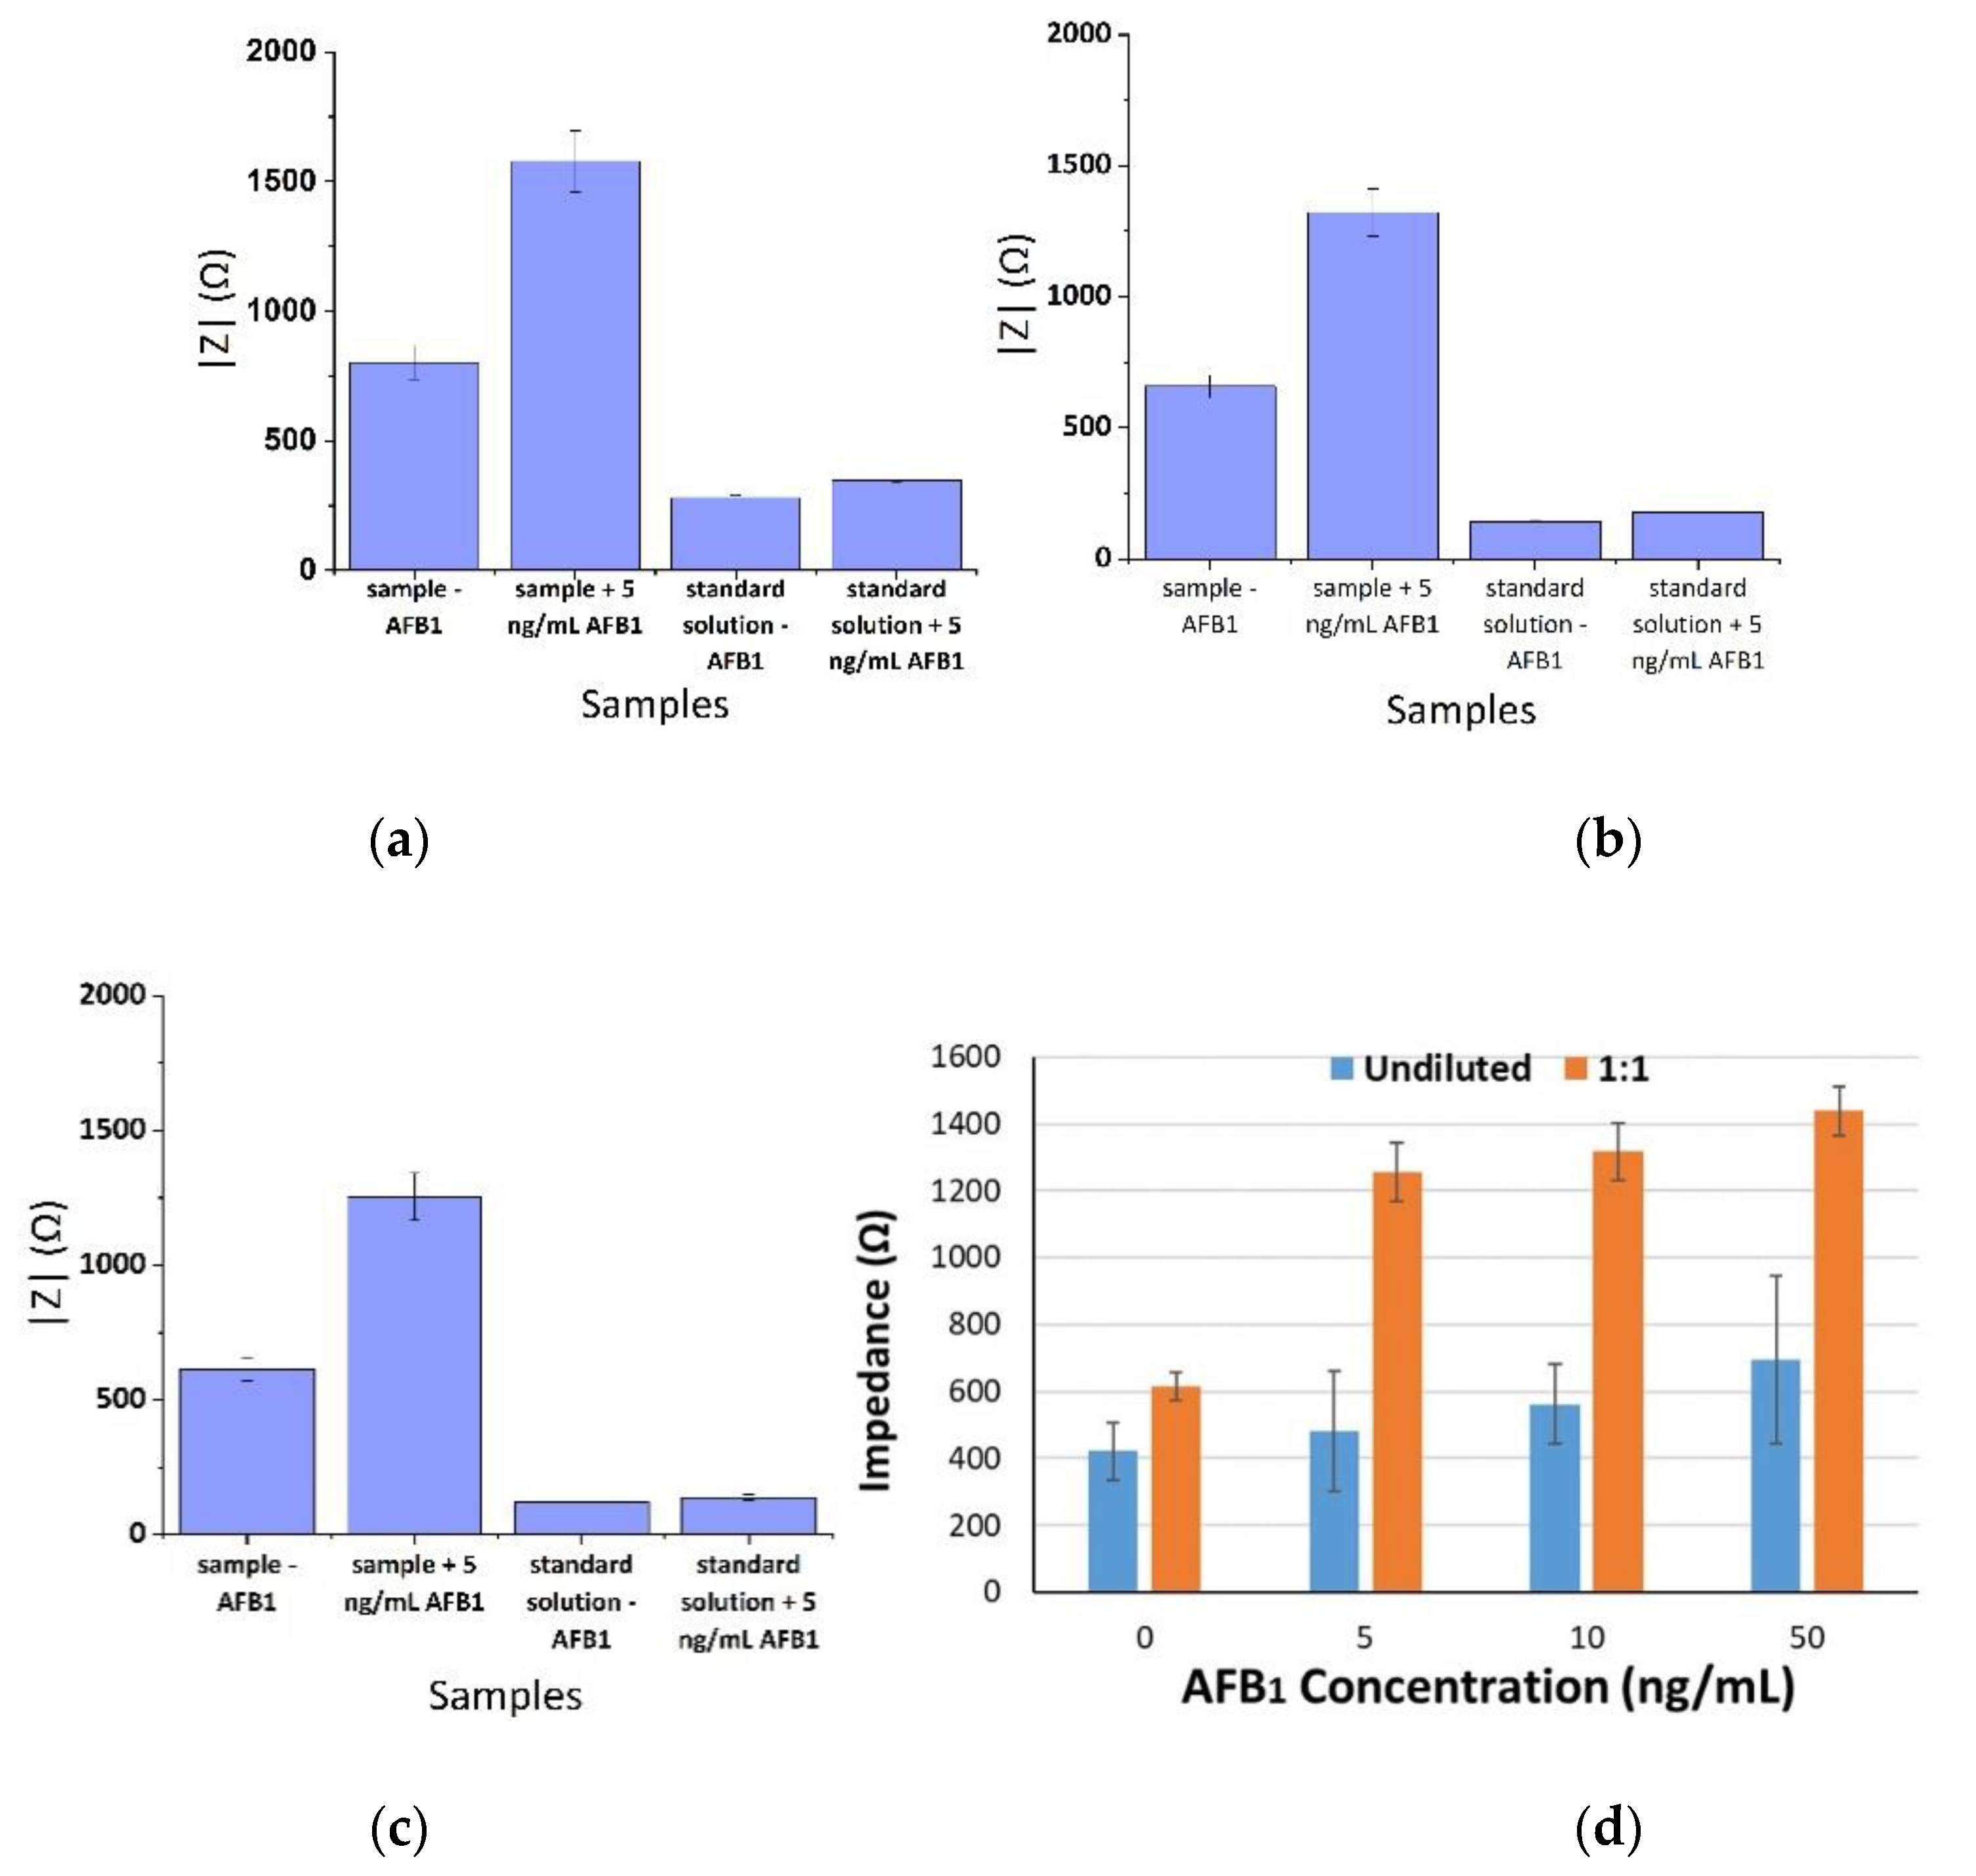
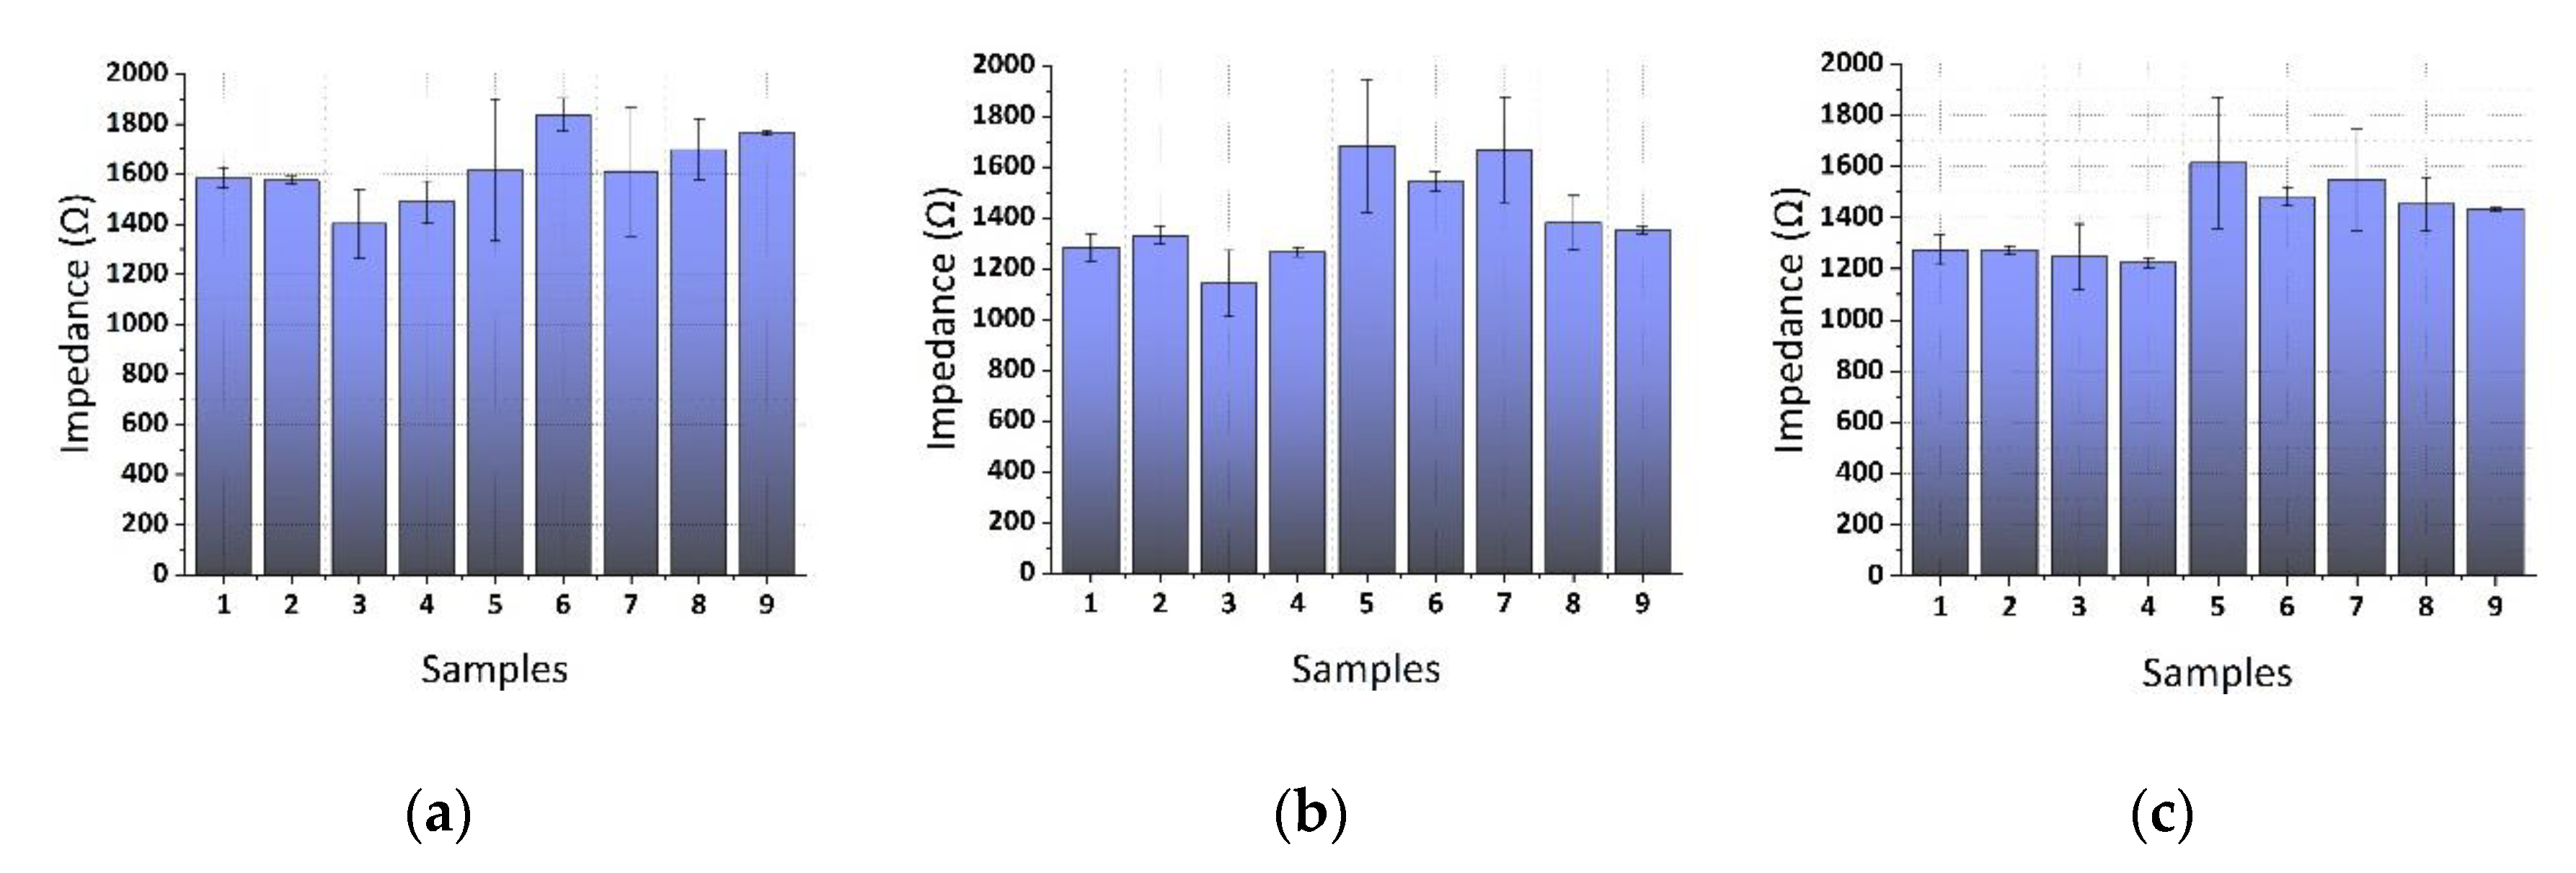
3.3. Aflatoxin B1 Detection after Spiking of Pistachio Samples

The calibration curves of AFB1 were plotted against the same concentrations on spiked pistachio samples for the three frequencies (1, 10, and 100 KHz) as shown in Figure 9, Figure 10 and Figure 11, respectively. A concentration-dependent response was once again observed during the increase of concentrations of the AFB1 with a linear range between 1–100 ng/mL in all frequencies tested (R2 ranging between 0.88–0.96). Measurements at each AFB1 concentration higher than 0.5 ng/mL were distinct and significantly different from the control solutions (zero AFB1 concentration). With the frequency increase, a slight decrease in the mean impedance values was observed again. The results were quite reproducible, with an average variation of 7.28% over all assayed concentrations and the sensor was able to successfully detect AFB1 concentrations down to 1 ng/mL. Table 2 presents, in detail, the parameters used for the extraction of the linear fit curves. In comparison with the curves obtained by the normalized values of the mean impedance magnitude for concentrations of AFB1 standard solutions (Figure 6, Figure 7 and Figure 8) the minimum concentration of linear range has increased to 1 ng/mL AFB1, indicating the interference of the matrix effect from the pistachio extracts.

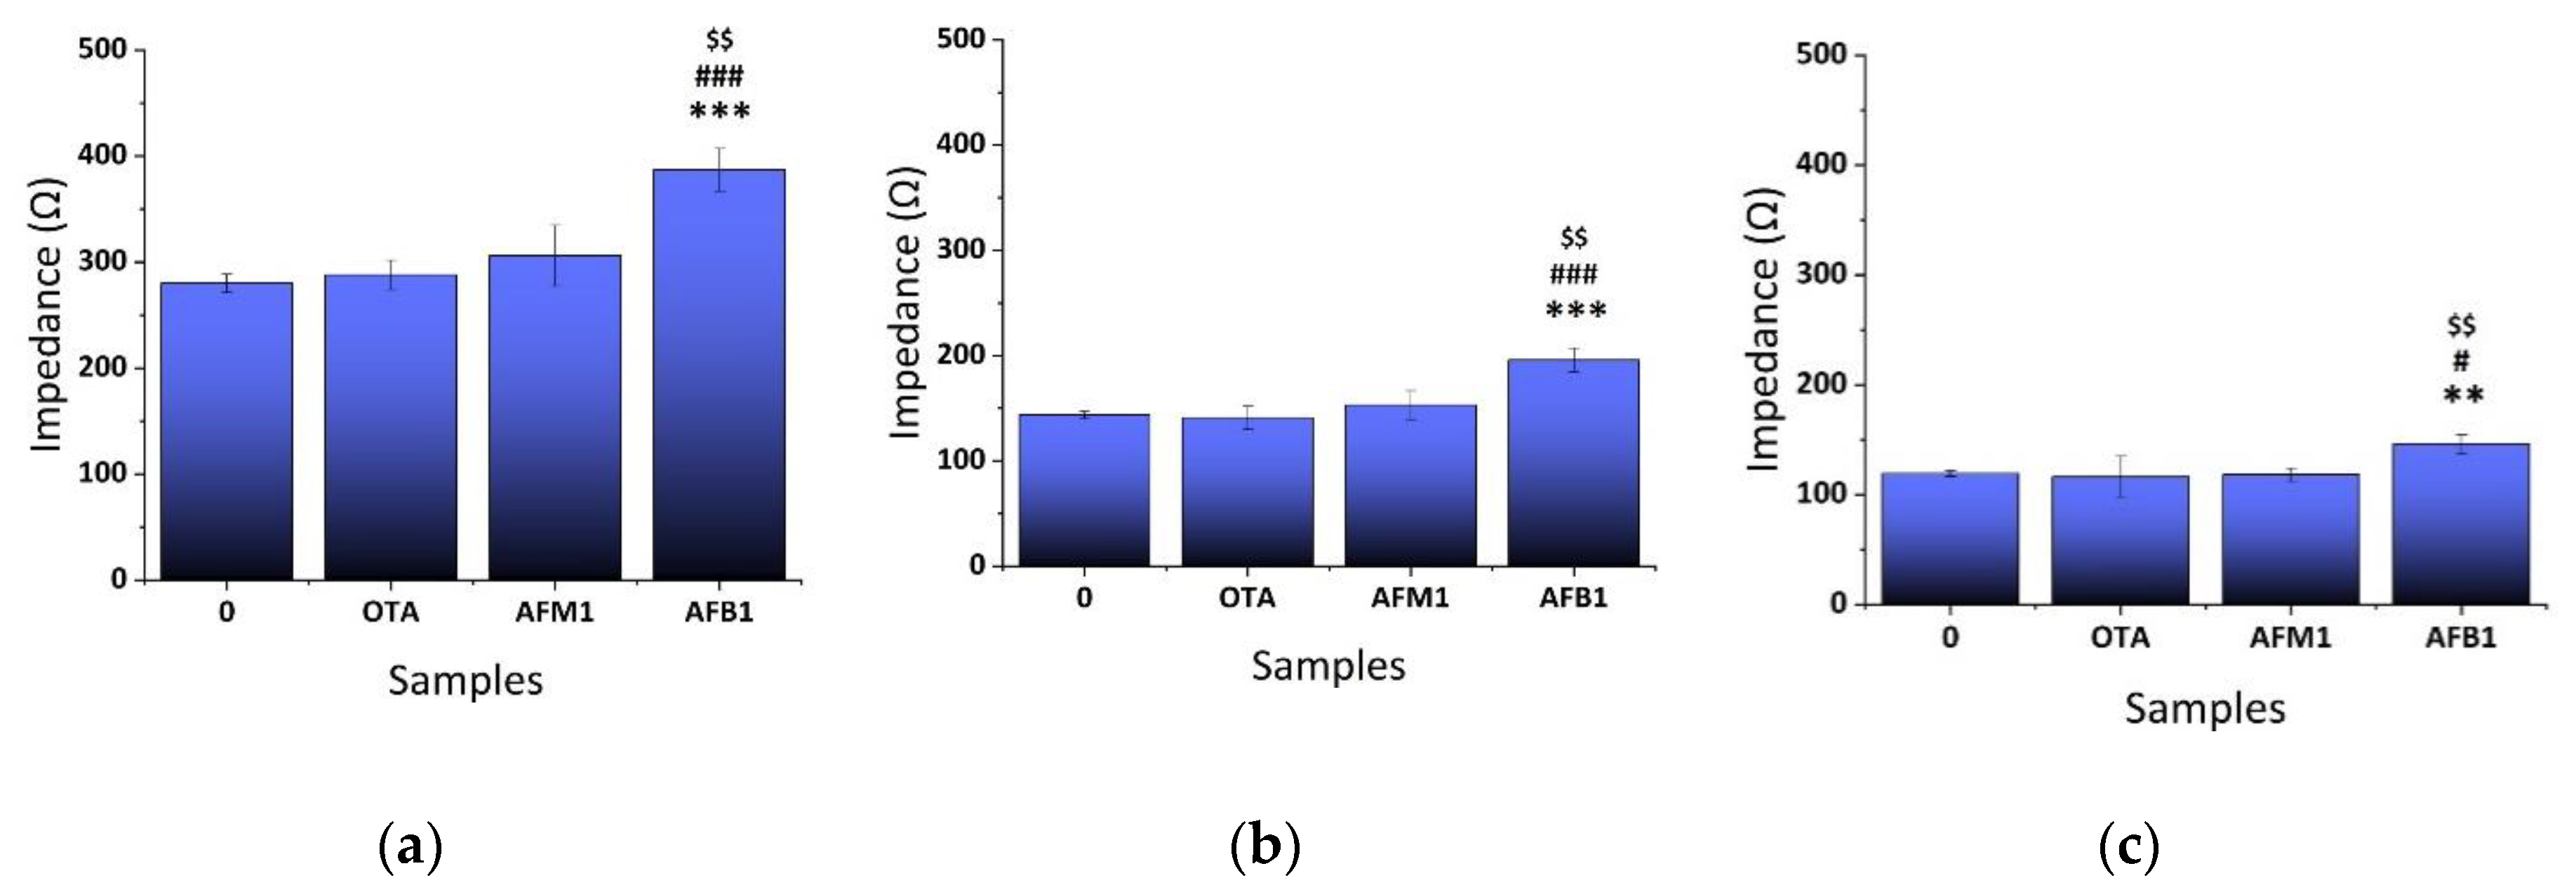
3.4. Cross Reactivity Study

Cross reactivity studies were performed in order to further evaluate the immunosensor’s performance and determine the interference potential with other mycotoxins. The selectivity of the developed sensor was evaluated by application of Ochratoxin A (OTA) (10 ng/mL), Aflatoxin M1 (AFM1) (10 ng/mL), and Aflatoxin B1 (AFB1) (10 ng/mL) standard solutions. OTA and AFM1 caused insignificant changes in the impedance magnitude in comparison with the control, as presented in Figure 12. Moreover, 10 ng/mL of AFB1 caused significant alterations in the mean impedance not only when compared to the measurements obtained from the control solution, but also against AFM1 and OTA.

3.5. Biosensor Performance Validation by Comparison with HPLC Analysis of Contaminated Pistachio Samples

Pistachio samples that were contaminated with unknown AFB1 concentrations were tested with the impedance biosensor and the results were compared with HPLC data (considered as standard). The results that are presented in Figure 13 represent the measurements taken from nine (9) different pistachio samples of unknown AFB1 concentrations at the three frequencies tested, as previously. After data analysis, we observed that the samples 5 and 7 presented a high variability at all frequencies with mean standard deviations ranging between 12.3–17.59%.
Following the HPLC sample analysis results, four pistachio samples contained rather high AFB1 concentrations. Specifically, samples 3, 4, 5, and, 7 were contaminated with more than 345 ng/mL AFB1. On the other hand, as can be seen in Figure 10, samples 3 and 4 gave the lowest mean impedance values at all of the frequencies tested, whereas samples 5 and 7 gave quite variable measurements, as already mentioned above. These findings indicate that AFB1 concentrations higher than 345 ng/mL are not within the immunosensor’s upper limits of detection.
Table 3 represents the comparative results between the electrochemical immunosensor and HPLC with relative error (SE) and Relative Standard Deviation (RSD%). The average relative error was found to be within acceptable levels up to ±12% for all samples, except for sample 6 (25.45%) in the HPLC method, possibly due to false sample pretreatment. Three replicates of the experiments were analyzed for all samples in order to evaluate the repeatability and accuracy of the immunosensor.
The correlation analysis of the data that were obtained by the three frequencies tested with the electrochemical immunosensor in comparison with HPLC results was 0.49, 0.48, and 0.47, respectively. The results indicated that the AFB1 concentrations of samples 3, 4, 5, and 7 could not be detected since were rather high, thus, not within the range of limit of detection. The repetition of the correlation analysis without taking into account the abovementioned samples, gave a totally different pattern. In particular, the rest of the samples presented a correlation coefficient that was higher than 0.99, indicating a strong relationship between the two methods.
The linearity that was observed in the range of 0.5–10 ng/mL AFB1 in standard solutions and spiked pistachio samples by the biosensor, reported in the current study gave quite satisfying results in comparison with those reported in literature for other impedance based electrochemical immunosensors (Table 4). These detection schemes do not demand sophisticated electrode functionalization. Furthermore, other types of electrochemical immunosensors, using far more complicated structures (e.g., graphene oxide, gold nanoparticles) or signal amplification strategies than our proposed sensor, can provide a linearity range between 0.00001–31 ng/mL [47,49,54]. This range is significantly lower than the one achieved by the immunosensor presented in the present study. As time is a very essential parameter in modern aflatoxin detection and prevention systems, the limit of detection achieved by the immunosensor formed in the current work, in addition to the avoidance of a great number of cleaning steps, leads to the perception that the formed immunosensor may be a very useful tool in integrated management systems for aflatoxin control in pistachio nuts cultivation. Finally, based on the results of the present study, it is apparent that just one current frequency (any of the three tested) can be used for the routine detection of AFB1.
The proposed anti-AFB1 immunosensor demonstrated quite good sensitivity with a relatively low detection limit, close to the legal maximum limits set for this product. Thus, it can be appropriate for use in routine screening of contaminated pistachio samples as a low-cost and rapid alternative to laborious and high-priced analytical methodologies. The extraction method used was rather simple without requiring extensive sample clean-up or pre-treatment as in the sample preparation for HPLC analysis. This work indicated that the matrix effect allowed for the detection of the AFB1 in a concentration higher than 1 ng/mL. The immunosensor exhibited linearity that is comparable to conventional methods, such as ELISA, and its detection limit is appropriate for on-site monitoring. While the limit of detection for most of the ELISA Kits commercialized, is set at 2 or at 4 μg/kg [59], several novel immunosensors, achieve limit of detection around 1.1 μg/kg and limit of quantification around 2.5 μg/kg [60]. In addition, due to the simplicity of the methodology, the proposed immunosensor can be applied in order to detect several other environmental pollutants. Furthermore, we suppose that the proposed method cannot be utilized at high AFB1 concentrations, as demonstrated by the contradictory results that were obtained with the biosensor for samples 4 (348.76 ng/mL) and 5 (345.00 ng/mL) although both of them contained almost identical concentration of AFB1, as confirmed by the HPLC analysis. Therefore, there is a lot of room for improvement of the detection limits as well as the linearity range. For the time being, only AFB1 concentrations that range between 1–100 ng/mL can be detected.
Moreover, the system still requires extensive study, as it concerns the biomaterial immobilization impedance circuitry for real-time point-of-care applications. Several devices, such as LCR-meters and impedance analyzers, have been utilized in conjunction with impedimetric immunosensors for simultaneous and label-free detection. Although they provide plenty of benefits, including low cost and high sensitivity, their measuring process is time-consuming, difficult for standalone measurements, and cannot be used for a wide frequency range [61]. Modern trends lead to demand for on-site simultaneous semi-quantification of several different mycotoxins in foodstuff [62]. In order to achieve a much lower detection limit, future research plans of the authors include the optimization of the immunosensor’s analytical conditions, such as pH, temperature, incubation time, and use of different blocking agents and selectivity with other mycotoxins. Manufacturing aspects could be also optimized, such as the CM-dextran concentration and the layer thickness [63]. The current electrochemical immunosensor comes to amplify the broad range of research that has been conducted in the field of electrochemical immunosensors’ application for mycotoxin determination and control [48,64].

4. Conclusions

The present work reports the development of a sensitive impedimetric electrochemical immunosensor for the determination of aflatoxin B1. This impedance-based immunosensor technique is relatively simple, time saving, and it does not require expensive equipment and extensive sample preparation. The AFB1 antibody was immobilized on a screen-printed electrode’s surface by activating the carboxylic acid groups at the surface with the use of coupling agents after modification with carbo-methyldextran. Based on the European Commission reports regarding the control of the aflatoxin contamination in pistachios, the national action limit for AFB1 is 12 ppb. The proposed impedance-based sensor set-up was able to detect AFB1 concentrations 0.5 ppb and 1 ppb for standard solutions and spiked pistachio samples, respectively. Furthermore, the successful assessment of AFB1 concentrations in pistachio unknown samples was accomplished and the sensor had good selectivity against Ochratoxin A and Aflatoxin M1. Further improvement work on the impedimetric immunosensor will not only determine its application for AFB1 detection, but it will also be helpful in understanding the mechanism and electrochemical interfacial modelling of biomolecular recognition for electrochemical immunosensor. Such future research will target to the improvement of the sensitivity, as well as the achievement of a much lower detection limit, in order to apply the sensor in food safety and quality monitoring where the presence of mycotoxins is concerned.

Author Contributions

Conceptualization, M.D.K., G.P. and S.M.; methodology, M.D.K., S.M., M.G. and G.P.; software, G.P.; validation, M.G.; data curation, G.P., M.G.; writing—original draft preparation, M.D.K., S.M., M.G. and G.P.; writing—review and editing, D.I.T., S.K.; supervision, D.I.T., S.K. All authors have read and agreed to the published version of the manuscript

Funding

This research received no external funding.

Acknowledgments

The authors would like to express their great appreciation to Alexander S. Onassis Public Benefit Foundation for granting a Ph.D. Scholarship to Michail D. Kaminiaris. The current research was conducted during his Ph.D. thesis.

Conflicts of Interest

The authors declare no conflict of interest.

References

  1. Elloumi, O.; Ghrab, M.; Kessentini, H.; Ben Mimoun, M. Chilling accumulation effects on performance of pistachio trees cv. Mateur in dry and warm area climate. Sci. Hortic. 2013, 159, 80–87. [Google Scholar] [CrossRef]
  2. Cotty, P.J.; Jaime-Garcia, R. Influences of climate on aflatoxin producing fungi and aflatoxin contamination. Int. J. Food Microbiol. 2007, 119, 109–115. [Google Scholar] [CrossRef]
  3. Adegoke, G.O. Understanding Food Microbiology, 2nd ed.; Alleluia Ventures: Ibadan, Nigeria, 2004. [Google Scholar]
  4. IARC. Some traditional herbal medicines, some mycotoxins, naphthalene and styrene. IARC Monogr. Eval. Carcinog. Risks Hum. 2002, 82, 1–556. [Google Scholar]
  5. Klich, M.A. Aspergillus flavus: The major producer of aflatoxin. Mol. Plant Pathol. 2007, 8, 713–722. [Google Scholar] [CrossRef]
  6. Probst, C.; Bandyopadhyay, R.; Price, L.E.; Cotty, P.J. Identification of Atoxigenic Aspergillus flavus Isolates to Reduce Aflatoxin Contamination of Maize in Kenya. Plant Dis. 2010, 95, 212–218. [Google Scholar] [CrossRef] [Green Version]
  7. Bui-Klimke, T.R.; Guclu, H.; Kensler, T.W.; Yuan, J.-M.; Wu, F. Aflatoxin regulations and global pistachio trade: Insights from social network analysis. PLoS ONE 2014, 9, e92149. [Google Scholar] [CrossRef] [Green Version]
  8. Pigłowski, M. Comparative analysis of notifications regarding mycotoxins in the Rapid Alert System for Food and Feed (RASFF). Qual. Assur. Saf. Crop. Foods 2019, 11, 725–735. [Google Scholar] [CrossRef]
  9. Naieni, K.H.; Ghods, B.; Ghorbani, R.; Bagheri, B.; Abdolshahi, A. Aflatoxin Contamination of Pistachio and Aflatoxicose: Knowledge, Attitude, and Practices of People in Damghan City, Iran. J. Nuts 2020, 11, 91–99. [Google Scholar] [CrossRef]
  10. Serdar, S.A.; El Tawila, M.M.; Madkour, M.H.; Alrasheedi, A.A. Determination of aflatoxins (AFs) in different food samples: A case study from Jeddah, Saudi Arabia. JKAU Met. Env. Arid Land Agric. Sci. 2020, 29, 23–34. [Google Scholar] [CrossRef]
  11. Aklaku, E.K.; Sowley, E.N.K.; Ofosu, M. Incidence of fungi and aflatoxin contamination of maize in Tolon-kumbungu district of Ghana. Afr. Crop Sci. J. 2020, 28, 195–202. [Google Scholar] [CrossRef]
  12. El Tawila, M.; Sadeq, S.; Awad, A.A.; Serdar, J.; Madkour, M.H.F.; Deabes, Μ.Μ. Aflatoxins Contamination of Human Food Commodities Collected from Jeddah Markets, Saudi Arabia. Οpen Access Maced. J. Med. Sci. 2020, 8, 117–126. [Google Scholar] [CrossRef]
  13. Taghizadeh, S.F.; Rezaee, R.; Badibostan, H.; Karimi, G. Aflatoxin B1 in walnuts: A probabilistic cancer risk assessment for Iranians. Toxicol. Environ. Chem. 2020. [Google Scholar] [CrossRef]
  14. Cunha, S.C.; Sá, S.V.M.; Fernandes, J.O. Multiple mycotoxin analysis in nut products: Occurrence and risk characterization. Food Chem. Toxicol. 2018, 114, 260–269. [Google Scholar] [CrossRef]
  15. European Commission. Final Report of an Audit Carried Out in the United States From 05 September 2017 to 12 September 2017 in Order to Assess the Control System in Place to Control Aflatoxin Contamination in Pistachios Intended for Export to the European Union; Directorate-General For Health And Food Safety: Brussels, Belgium, 2018; Volume DG(SANTE) 2017–6080. [Google Scholar]
  16. Georgiadou, M.; Dimou, A.; Yanniotis, S. Aflatoxin contamination in pistachio nuts: A farm to storage study. Food Control 2012, 26, 580–586. [Google Scholar] [CrossRef]
  17. Cheraghali, A.M.; Yazdanpanah, H.; Doraki, N.; Abouhossain, G.; Hassibi, M.; Ali-abadi, S.; Aliakbarpoor, M.; Amirahmadi, M.; Askarian, A.; Fallah, N.; et al. Incidence of aflatoxins in Iran pistachio nuts. Food Chem. Toxicol. 2007, 45, 812–816. [Google Scholar] [CrossRef]
  18. Kabirian, H.R.; Afshari, H.; Mohammadi Moghadam, M.; Hokmabadi, H. Evaluation of Pistachio Contamination to Aspergillus flavus in Semnan Province. J. Nuts 2011, 2, 1–6. [Google Scholar] [CrossRef]
  19. Doster, M.A.; Michailides, T.J. Aspergillus molds and aflatoxins in pistachio nuts in California. Phytopathology 1994, 84, 19942307662. [Google Scholar] [CrossRef]
  20. Vosough, M.; Bayat, M.; Salemi, A. Matrix-free analysis of aflatoxins in pistachio nuts using parallel factor modeling of liquid chromatography diode-array detection data. Anal. Chim. Acta 2010, 663, 11–18. [Google Scholar] [CrossRef]
  21. Caputo, D.; De Cesare, G.; Fanelli, C.; Nascetti, A.; Ricelli, A.; Scipinotti, R. Innovative Detection System of Ochratoxin A by Thin Film Photodiodes. Sensors 2007, 7, 1317–1322. [Google Scholar] [CrossRef] [Green Version]
  22. Sapsford, K.E.; Taitt, C.R.; Fertig, S.; Moore, M.H.; Lassman, M.E.; Maragos, C.M.; Shriver-Lake, L.C. Indirect competitive immunoassay for detection of aflatoxin B1 in corn and nut products using the array biosensor. Biosens. Bioelectron. 2006, 21, 2298–2305. [Google Scholar] [CrossRef]
  23. Piermarini, S.; Micheli, L.; Ammida, N.H.S.; Palleschi, G.; Moscone, D. Electrochemical immunosensor array using a 96-well screen-printed microplate for aflatoxin B1 detection. Biosens. Bioelectron. 2007, 22, 1434–1440. [Google Scholar] [CrossRef] [Green Version]
  24. Urusov, A.E.; Zherdev, A.V.; Petrakova, A.V.; Sadykhov, E.G.; Koroleva, O.V.; Dzantiev, B.B. Rapid multiple immunoenzyme assay of mycotoxins. Toxins 2015, 7, 238–254. [Google Scholar] [CrossRef]
  25. Valasi, L.; Georgiadou, M.; Tarantilis, P.A.; Yanniotis, S.; Pappas, C.S. Rapid screening on aflatoxins’ presence in Pistacia vera nuts using diffuse reflectance infrared Fourier transform spectroscopy and chemometrics. J. Food Sci. Technol. 2020. [Google Scholar] [CrossRef]
  26. Mavrikou, S.; Flampouri, E.; Iconomou, D.; Kintzios, S. Development of a cellular biosensor for the detection of aflatoxin B1, based on the interaction of membrane engineered Vero cells with anti-AFB1 antibodies on the surface of gold nanoparticle screen printed electrodes. Food Control 2017, 73, 64–70. [Google Scholar] [CrossRef]
  27. Song, S.; Liu, N.; Zhao, Z.; Njumbe Ediage, E.; Wu, S.; Sun, C.; De Saeger, S.; Wu, A. Multiplex Lateral Flow Immunoassay for Mycotoxin Determination. Anal. Chem. 2014, 86, 4995–5001. [Google Scholar] [CrossRef]
  28. Moon, J.; Byun, J.; Kim, H.; Lim, E.-K.; Jeong, J.; Jung, J.; Kang, T. On-site detection of Aflatoxin B1 in grains by a palm-sized surface plasmon resonance sensor. Sensors 2018, 18, 598. [Google Scholar] [CrossRef] [Green Version]
  29. Jia, Y.; Zhou, G.; Liu, P.; Li, Z.; Yu, B. Recent development of Aptamer Sensors for the quantification of Aflatoxin B1. Appl. Sci. 2019, 9, 2364. [Google Scholar] [CrossRef] [Green Version]
  30. Wang, C.; Zhao, Q. A reagentless electrochemical sensor for aflatoxin B1 with sensitive signal-on responses using aptamer with methylene blue label at specific internal thymine. Biosens. Bioelectron. 2020, 167, 112478. [Google Scholar] [CrossRef]
  31. Sabet, F.; Khabbaz, H.; Hosseini, M.; Dadmehr, M.; Reza Ganjali, M. FRET-based aptamer biosensor for selective and sensitive detection of Aflatoxin B1 in peanut and rice. Food Chem. 2017, 220, 527–532. [Google Scholar] [CrossRef]
  32. Chauhan, R.; Solanki, P.R.; Singh, J.; Mukherjee, I.; Basu, T.; Malhotra, B.D. A novel electrochemical piezoelectric label free immunosensor for Aflatoxin B1 detection in groundnut. Food Control 2015, 52, 60–70. [Google Scholar] [CrossRef]
  33. Bhardwaj, H.; Sumana, G.; Marquette, C.A. A label-free ultrasensitive microfluidic surface Plasmon resonance biosensor for Aflatoxin B1 detection using nanoparticles integrated gold chip. Food Chem. 2020, 307, 125530. [Google Scholar] [CrossRef] [PubMed]
  34. Wang, X.; Niessner, R.; Tang, D.; Knopp, D. Nanoparticle-based immunosensors and immunoassays for aflatoxins. Anal. Chim. Acta 2016, 17, 10–23. [Google Scholar] [CrossRef] [PubMed]
  35. Sergeyeva, T.; Yarynka, D.; Piletska, E.; Linnik, R.; Zaporozhets, O.; Brovko, O.; Piletsky, S.; El’skaya, A. Development of a smartphone-based biomimetic sensor for aflatoxin B1 detection using molecularly imprinted polymer membranes. Talanta 2019, 201, 204–210. [Google Scholar] [CrossRef] [PubMed]
  36. Bučko, M.; Mislovičová, M.; Nahálka, J.; Vikartovská, A.; Šefčovičová, J.; Katrlik, J.; Tkáč, J.; Gemeiner, P.; Lacík, I.; Štefuca, V.; et al. Immobilization in biotechnology and biorecognition: From macro-to nanoscale systems. Chem. Pap. 2012, 66, 983–998. [Google Scholar] [CrossRef]
  37. Vashist, S.K.; Dixit, C.K.; MacCraith, B.D.; O’Kennedy, R. Effect of antibody immobilization strategies on the analytical performance of a surface plasmon resonance-based immunoassay. Analyst 2011, 136, 4431–4436. [Google Scholar] [CrossRef]
  38. Verma, M.L.; Kumar, S.; Das, A.; Randhawa, J.S.; Chamundeeswari, M. Chitin and chitosan-based support materials for enzyme immobilization and biotechnological applications. Env. Chem. Lett. 2020, 18, 315–323. [Google Scholar] [CrossRef]
  39. Wang, P.; Sheng, F.; Tang, S.W.; Ud-Din, Z.; Chen, L.; Nawaz, A.; Hu, C.; Xiong, H. Synthesis and Characterization of Corn Starch Crosslinked with Oxidized Sucrose. Starch-Stärke 2019, 71, 1800152. [Google Scholar] [CrossRef]
  40. Saftics, A.; Türk, B.; Sulyok, A.; Nagy, N.; Agócs, E.; Kalas, B.; Petrik, P.; Fried, M.; Nguyen Quoc, K.; Kamarás, K.; et al. Dextran-based Hydrogel Layers for Biosensors. In Nanobiomaterial Engineering; Springer: Singapore, 2020; pp. 139–164. [Google Scholar]
  41. Ning, S.; Huang, Q.; Sun, X.; Li, C.; Zhang, Y.; Li, J.; Liu, Y.N. Carboxymethyl dextran-coated liposomes: Toward a robust drug delivery platform. Soft Matter. 2011, 7, 9394–9401. [Google Scholar] [CrossRef]
  42. Yu, Q.; Wang, Q.; Li, B.; Lin, Q.; Duan, Y. Technological Development of Antibody Immobilization for Optical Immunoassays: Progress and Prospects. Crit. Rev. Anal. Chem. 2015, 45, 62–75. [Google Scholar] [CrossRef]
  43. Adányi, N.; Levkovets, I.A.; Rodriguez-Gil, S.; Ronald, A.; Váradi, M.; Szendro, I. Development of immunosensor based on OWLS technique for determining Aflatoxin B1 and Ochratoxin A. Biosens. Bioelectron. 2007, 22, 797–802. [Google Scholar] [CrossRef]
  44. Jin, X.; Jin, X.; Liu, X.; Chen, L.; Jiang, J.; Shen, G.; Yu, R. Biocatalyzed deposition amplification for detection of aflatoxin B1 based on quartz crystal microbalance. Anal. Chim. Acta 2009, 645, 92–97. [Google Scholar] [CrossRef]
  45. Tan, Y.; Chu, X.; Shen, G.L.; Yu, R.Q. A signal-amplified electrochemical immunosensor for aflatoxin B1 determination in rice. Anal. Biochem. 2009, 387, 82–86. [Google Scholar] [CrossRef]
  46. Xu, X.; Liu, X.; Li, Y.; Ying, Y. A simple and rapid optical biosensor for detection of aflatoxin B1 based on competitive dispersion of gold nanorods. Biosens. Bioelectron. 2013, 47, 361–367. [Google Scholar] [CrossRef]
  47. Zhang, X.; Li, C.R.; Wang, W.C.; Xue, J.; Huang, Y.L.; Yang, X.X.; Qiu, J.F. A novel electrochemical immunosensor for highly sensitive detection of aflatoxin B1 in corn using single-walled carbon nanotubes/chitosan. Food Chem. 2016, 192, 197–202. [Google Scholar] [CrossRef]
  48. Gurban, A.-M.; Epure, P.; Oancea, F.; Doni, M. Achievements and Prospects in Electrochemical-Based Biosensing Platforms for Aflatoxin M1 Detection in Milk and Dairy Products. Sensors 2017, 17, 2951. [Google Scholar] [CrossRef] [Green Version]
  49. Narayanan, J.; Sharma, M.K.; Ponmariappan, S.; Shaik, M.; Upadhyay, S. Electrochemical immunosensor for botulinum neurotoxin type-E using covalently ordered graphene nanosheets modified electrodes and gold nanoparticles-enzyme conjugate. Biosens. Bioelectron. 2015, 69, 249–256. [Google Scholar] [CrossRef]
  50. Kim, B.K.; Li, J.; Im, J.-E.; Ahn, K.-S.; Park, T.S.; Cho, S.I.; Kim, Y.-R.; Lee, W.-Y. Impedometric estrogen biosensor based on estrogen receptor alpha-immobilized gold electrode. J. Electroanal. Chem. 2012, 671, 106–111. [Google Scholar] [CrossRef]
  51. Canbaz, M.Ç.; Sezgintürk, M.K. Fabrication of a highly sensitive disposable immunosensor based on indium tin oxide substrates for cancer biomarker detection. Anal. Biochem. 2014, 446, 9–18. [Google Scholar] [CrossRef]
  52. Pan, M.; Li, S.; Wang, J.; Sheng, W.; Wang, S. Development and Validation of a Reproducible and Label-Free Surface Plasmon Resonance Immunosensor for Enrofloxacin Detection in Animal-Derived Foods. Sensors 2017, 17, 1984. [Google Scholar] [CrossRef] [Green Version]
  53. Bhardwaj, H.; Singh, C.; Kumar Pandey, M.; Sumana, G. Star shaped zinc sulphide quantum dots self-assembled monolayers: Preparation and applications in food toxin detection. Sens. Actuators B Chem. 2016, 231, 624–633. [Google Scholar] [CrossRef]
  54. Evtugyn, G.; Porfireva, A.; Stepanova, V.; Sitdikov, R.; Stoikov, I.; Nikolelis, D.; Hianik, T. Electrochemical aptasensor based on polycarboxylic macrocycle modified with neutral red for aflatoxin B1 detection. Electroanalysis 2014, 26, 2100. [Google Scholar] [CrossRef]
  55. Badea, M.; Floroian, L.; Restani, P.; Moga, M. Simple Surface Functionalization Strategy for Immunosensing Detection of Aflatoxin B1. Int. J. Electrochem. Sci. 2016, 11, 6719–6734. [Google Scholar] [CrossRef]
  56. Srivastava, S.; Ali, M.D.; Umrao, S.; Parashar, U.K.; Srivastava, A.; Sumana, G.; Malhotra, B.D.; Pandey, S.S.; Hayase, S. Graphene oxide-based biosensor for food toxin detection. Appl. Biochem. Biotechnol. 2014, 174, 960. [Google Scholar] [CrossRef]
  57. Wang, D.; Hu, W.; Xiong, Y.; Xu, Y.; Li, C. Multifunctionalized reduced graphene oxide-doped polypyrrole/pyrrolepropylic acid nanocomposite impedimetric immunosensor to ultra-sensitively detect small molecular aflatoxin B1. Biosens. Bioelectron. 2015, 63, 185. [Google Scholar] [CrossRef]
  58. Owino, J.H.O.; Ignaszak, A.; Al-Ahmed, A.; Baker, P.; Alemu, H. Modelling of the impedimetric responses of an aflatoxin B1 immunosensor prepared on an electrosynthetic polyaniline platform. Anal. Bioanal. Chem. 2007, 388, 1069–1074. [Google Scholar] [CrossRef]
  59. Sun, D.D.; Gu, X.; Li, J.G.; Yao, T.; Dong, Y.C. Quality evaluation of five commercial enzyme linked immunosorbent assay kits for detecting aflatoxin b1 in feedstuffs. Asian-Australas. J. Anim. Sci. 2015, 28, 691–696. [Google Scholar] [CrossRef] [Green Version]
  60. Pereira, C.S.; Cunha, S.C.; Fernandes, J.O. Validation of an Enzyme-Linked Immunosorbent Assay (ELISA) Test Kit for Determination of Aflatoxin B1 in Corn Feed and Comparison with Liquid-Chromatography Tandem Mass Spectrometry (LC-MS/MS) Method. Food Anal. Methods 2020, 13, 1806–1816. [Google Scholar] [CrossRef]
  61. Prodromidis, M. Impedimetric Biosensors and Immunosensors. Pak. J. Anal. Env. Chem. 2007, 8, 69–71. [Google Scholar]
  62. Xu, Y.; Gong, Y.Y.; Routledge, M.N. Aflatoxin exposure assessed by aflatoxin albumin adduct biomarker in populations from six African countries. World Mycotoxin J. 2018, 11, 411–419. [Google Scholar] [CrossRef] [Green Version]
  63. Shynkarenko, O.V.; Kravchenko, S.A. Surface Plasmon Resonance Sensors: Methods of Surface Functionalization and Sensitivity Enhancement. Theor. Exp. Chem. 2015, 51, 273–292. [Google Scholar] [CrossRef]
  64. Evtugyn, G.; Hianik, T. Electrochemical Immuno-and Aptasensors for Mycotoxin Determination. Chemosensors 2019, 7, 10. [Google Scholar] [CrossRef] [Green Version]
Figure 1. Schematic representation of the successive steps of anti-AFB1 immobilization procedure (a). Ten cyclic cleaning voltammogram of the Au screen-printed electrode (SPE) electrode (b).
Chemosensors 08 00121 g001
Figure 2. Impedance-based biosensor assembly.
Chemosensors 08 00121 g002
Figure 3. Extracted results from the mean impedance magnitude values for different concentrations of immobilized anti-AFB1 tested with 5 ng/mL AFB1 at three frequencies ± STD: (a) 1 KHz, (b) 10 KHz and (c) 100 KHz. Two-tailed t-test, p * < 0.05, p *** < 0.001 significantly different from the control.
Chemosensors 08 00121 g003
Figure 4. Cyclic voltammograms in acetate buffer (pH 5.6) recorded at a scan rate of 0.1 V/s after each step of the Au electrode’s modification (a). Impedance time series in acetate buffer (pH 5.6) after each step of the Au electrode’s modification (b).
Chemosensors 08 00121 g004
Figure 5. Extracted results from the mean impedance magnitude values for standard buffered solutions and pistachio extracts with and without the addition of AFB1 at three frequencies ± STD: (a) 1 KHz, (b) 10 KHz and (c) 100 KHz. Biosensor’s results from undiluted samples and 1:1 dilution (d).
Chemosensors 08 00121 g005
Figure 6. (a) Extracted results from the mean impedance magnitude values for different concentrations of AFB1 standard solutions tested at three frequencies 1 KHz ± STD, Different letters (a, b, c, d, e) indicate statistically significant different values (p < 0.05), (b) Linear fit curve of the values of the mean impedance magnitude for concentrations of AFB1 standard (0–10 ng/mL) tested at 1 KHz.
Chemosensors 08 00121 g006
Figure 7. (a) Extracted results from the mean impedance magnitude values for different concentrations of AFB1 standard solutions tested at 10 KHz ± STD. Different letters (a, b, c) indicate statistically significant different values (p < 0.05). (b) Linear fit curve of the values of the mean impedance magnitude for concentrations of AFB1 standard (0–10 ng/mL) tested at 10 KHz.
Chemosensors 08 00121 g007
Figure 8. (a) Extracted results from the mean impedance magnitude values for different concentrations of AFB1 standard solutions tested at 100 KHz ± STD. Different letters (a, b, c) indicate statistically significant different values (p < 0.05). (b) Linear fit curve of the values of the mean impedance magnitude for concentrations of AFB1 standard (0–10 ng/mL) tested at 100 KHz.
Chemosensors 08 00121 g008
Figure 9. (a) Extracted results from the mean impedance magnitude values for different concentrations of AFB1 spiked pistachio samples at 1 KHz ± STD. Different letters (a, b, c) indicate statistically significant different values (p < 0.05). (b) Linear fit curve of the normalized values of the mean impedance magnitude for concentrations of AFB1 spiked pistachio samples (1–100 ng/mL) tested at 1 KHz.
Chemosensors 08 00121 g009
Figure 10. (a) Extracted results from the mean impedance magnitude values for different concentrations of AFB1 spiked pistachio samples at 10 KHz ± STD. Different letters (a, b, c, d, e) indicate statistically significant different values (p < 0.05). (b) Linear fit curve of the normalized values of the mean impedance magnitude for concentrations of AFB1 spiked pistachio samples (1–100 ng/mL) tested at 10 KHz.
Chemosensors 08 00121 g010
Figure 11. (a) Extracted results from the mean impedance magnitude values for different concentrations of AFB1 spiked pistachio samples at 100 KHz ± STD. Different letters (a, b, c, d, e) indicate statistically significant different values (p < 0.05). (b) Linear fit curve of the normalized values of the mean impedance magnitude for concentrations of AFB1 spiked pistachio samples (1–100 ng/mL) tested at 100 KHz.
Chemosensors 08 00121 g011
Figure 12. Extracted results from the mean impedance magnitude values for 0, and 10 ng/mL of Ochratoxin A (OTA), Aflatoxin M1 (AFM1) and Aflatoxin B1 (AFB1) standard solutions tested at (a) 1 KHz, (b) 10 KHz, and (c): 100 KHz. Two-tailed t-test, p ** < 0.01; p *** < 0.001 significantly different from the control, p # < 0.05; p ### < 0.001 significantly different from OTA, p $$ < 0.01 significantly different from AFM1.
Chemosensors 08 00121 g012
Figure 13. Extracted results from the mean impedance magnitude values for pistachio samples of unknown AFB1 concentrations tested at (a) 1 KHz, (b) 10 KHz, and (c) 100 KHz.
Chemosensors 08 00121 g013
Table 1. Fitting parameters from the linear fit curve of the normalized values of the mean impedance magnitude for concentrations of AFB1 spiked pistachio samples (1–100 ng/mL) tested at three different frequencies (1 KHz, 10 KHz, 100 KHz).
Fitting ParametersFrequency
1 KHz10 KHz100 KHz
Equationy = a*x + b
Intercept278.7762 ± 5.11754142.37224 ± 2.0011118.99124 ± 0.64571
Slope22.75792 ± 2.0072412.18314 ± 1.239776.03978 ± 0.38331
Residual Sum of Squares1.335781.069430.21553
Pearson’s r0.988530.984820.99401
R-Square (COD)0.977190.969870.98806
Adj. R-Square0.969590.959830.98408
Table 2. Fitting parameters from the linear fit curve of the normalized values of the mean impedance magnitude for concentrations of AFB1 spiked pistachio samples (1–100 ng/mL) tested at three different frequencies (1 KHz, 10 KHz, 100 KHz).
Fitting ParametersFrequency
1 KHz10 KHz100 KHz
Equationy = a*x + b
Intercept1426.17661 ± 28.671991170.02373 ± 70.339881172.04268 ± 68.85931
Slope122.15645 ± 12.3458129.12579 ± 28.25998121.46873 ± 28.72731
Residual Sum of Squares0.202431.792721.71928
Pearson’s r0.985020.935070.92537
R-Square (COD)0.970270.874360.85631
Adj. R-Square0.960360.832480.80842
Table 3. Aflatoxin B1 concentrations and Percentage of Relative Standard Deviations (RSD%) in pistachio samples as measured by the immunosensor and HPLC (n = 3, mean ± SD).
Detection Method
Aflatoxin B1 (ng/mL) ± SE
SampleElectrochemical ImmunosensorHPLCRSD%
1 KHzRSD%10 KHzRSD%100 KHzRSD%
15.02 ± 0.022.424.85 ± 0.044.135.08 ± 0.054.634.95 ± 0.12.02
24.99 ± 0.010.925.04 ± 0.022.475.07 ± 0.011.204.56 ± 0.12.19
30.99 ± 0.100.380.94 ± 0.111.220.97 ± 0.130.32413.68 ± 35.58.57
41.05 ± 0.067.181.04 ± 0.0147.811.09 ± 0.0157.26348.76 ± 16.44.69
599.5 ± 0.185.5793.71 ± 0.161.4199.55 ± 0.161.50345.00 ± 5.11.47
651.2 ± 0.0317.5951.47 ± 0.0315.5251.54 ± 0.0215.7450.68 ± 12.925.41
799.3 ± 0.1616.0192.89 ± 0.1212.3195.58 ± 0.1312.84705.92 ± 50.77.18
835.48 ± 0.079.7534.52 ± 0.0811.3937.88 ± 0.0710.2238.69 ± 5.012.80
932.76 ± 0.013.4830.05 ± 0.012.5433.21 ± 0.012.4130.50 ± 0.20.51
Table 4. Comparison of the analytical characteristics of the proposed impedance-based immunosensor with other electrochemical impedance immunosensors for aflatoxins.
Type of DetectionTransducers/ElectrodesDetection SchemeLimit of DetectionLinearity RangeReference
Direct EISGlassy carbon/polyNeutral Red/Polycarboxylated thiacalix [4] arene AAFB1 aptamer immobilized covalently on the electrode0.015 ng/mL0.03–31 ng/mL[54]
Direct Faradaic EISGraphene Oxide/Gold electrodesAnti-AFB1 Ab immobilized covalently on the electrode0.23 ng/mL0.5–5 ng/mL[56]
Direct Non faradaic EISNanocomposite of reduced graphene oxide with polypyrrole and pyrrolepropylic acidAnti-AFB1 Ab immobilized covalently on the sensor0.00001 ng/mL0.00001–0.01 ng/mL[57]
Direct Non-faradaic EISPlatinum electrodes modified with polyaniline and polystyrene sulphonic acidAnti-AFB1 Ab electrostatically attached on the electrodes100 ng/mLNot mentioned[58]
Direct Faradaic EISGold electrodes modified with bovine serum albuminAnti-AFB1 Ab immobilized covalently on the sensor0.5 ng/mL1–20 ng/mL[55]
Direct EISGold electrodes modified with carbomethyl-dextranAnti-AFB1 Ab immobilized covalently on Au electrodes0.5 ng/mL (standard solutions)0.5–10 ng/mL (standard solutions)Current study
Publisher’s Note: MDPI stays neutral with regard to jurisdictional claims in published maps and institutional affiliations.

