Article

Facile Detection and Quantification of Acetamiprid Using a Portable Raman Spectrometer Combined with Self-Assembled Gold Nanoparticle Array

School of Food and Biological Engineering, Shaanxi University of Science & Technology, Xi’an 710021, China
*
Author to whom correspondence should be addressed.
Chemosensors 2021, 9(11), 327; https://doi.org/10.3390/chemosensors9110327
Submission received: 22 October 2021 / Revised: 18 November 2021 / Accepted: 19 November 2021 / Published: 22 November 2021
(This article belongs to the Section Optical Chemical Sensors)

Abstract

:
Rapid and facile determination of pesticides is critically important in food and environmental monitoring. This study developed a self-assembled gold nanoparticle array based SERS method for highly specific and sensitive detection of acetamiprid, a neonicotinoid pesticide that used to be difficult in SERS analysis due to its low affinity with SERS substrates. SERS detection and quantification of acetamiprid was conducted with self-assembled gold nanoparticle arrays at the interface of chloroform and water as the enhancing substrate. Since targets dissolved in chloroform (organic phase) also have access to the hot-spots of Au NP array, the developed method exhibited good sensitivity and specificity for acetamiprid determination. Under the optimal conditions, SERS intensities at Raman shifts of 631 cm−1 and 1109 cm−1 displayed a good linear relationship with the logarithm concentration of acetamiprid in the range of 5.0 × 10⁻⁷ to 1.0 × 10⁻⁴ mol/L (0.11335 ppm to 22.67 ppm), with correlation coefficients of 0.97972 and 0.97552, respectively. The calculated LOD and LOQ of this method were 1.19 × 10⁻⁷ mol/L (0.265 ppb) and 2.63 × 10⁻⁷ mol/L (0.586 ppb), respectively, using SERS signal at 631 cm−1, and 2.95 × 10⁻⁷ mol/L (0.657 ppb) and 3.86 × 10⁻⁷ mol/L (0.860 ppb) using SERS signal at 1109 cm−1, respectively. Furthermore, the developed SERS method was successfully applied in determining acetamiprid on the surface of apple and spinach. This method offers an exciting opportunity for rapid detection of acetamiprid and other organic pesticides considering its advantages of simple preparation process, good specificity and sensitivity, and short detection time (within 1 h).

1. Introduction

Pesticides have made great contributions to modern agriculture, especially in fruit and vegetable production, since they can protect crops against pests and insects. So far, a great number of pesticides belonging to classes of organophosphates, organo-chlorines, and neonicotinoids have been developed and used [1,2,3]. Among them, acetamiprid, a new type of neonicotinoid pesticide, has been widely used for the prevention and control of insects [4]. However, acetamiprid can cause endocrine disruption in humans with short-term exposure and can cause cancer, birth defects, and even reduce reproductive function in humans with long-term exposure [5,6]. The excessive application of acetamiprid has resulted in its accumulation in soil, leading to negative impact on the safety of fruit and vegetables [7,8]. Since acetamiprid residues in fruit and vegetables pose a safety threat to humans [9], it is essential to detect acetamiprid in fruit and vegetables to ensure food safety and to maintain public health.
At present, acetamiprid is mainly detected using routine detection methods such as gas chromatography (GC) [10], high-performance liquid chromatography (HPLC) [11], and liquid/gas chromatography tandem mass spectrometry (LC-MS/GC-MS) [12]. These methods possess good specificity and accuracy, however, these methods depend on complex sample preparation procedures, expensive instruments, and professional personnel [13]. Their applications in the rapid detection of acetamiprid have been hindered by these shortcomings. Therefore, it is critically important to develop an easy and rapid method for the detection of acetamiprid.
Surface-enhanced Raman scattering (SERS) is a combination of Raman scattering and nanotechnology. It has advantages of simple sample preparation, rapid response, high sensitivity, and simultaneous characterization capacity [14]. Therefore, it has been considered as a promising technique for food quality and safety analysis. In addition, recently published studies have highlighted the potential of SERS on quantitative analysis, which used to be a challenge for conventional SERS analysis due to the instability of SERS signals [15,16,17]. However, the reported SERS methods for acetamiprid detection relied on recognizing elements to capture acetamiprid due to the low affinity between SERS substrates such as gold nanoparticles (Au NPs) and acetamiprid [9,18,19]. Recently reported SERS analysis based on self-assembled Au NP arrays at the interface of the water–organic (W/O) phase provides a new solution in breaking the affinity limitation between acetamiprid and SERS substrates since targets dissolved in the organic phase also have access to the hot-spots of Au NP array and their Raman signals can be further enhanced by ~10-fold compared with conventional SERS [20,21].
Herein, we proposed a facile and rapid SERS method for the detection and quantification of acetamiprid using a self-assembled Au NP array at the interface of water and chloroform as the enhancing substrate. The Au NP colloid was synthesized by our lab using a citrate reduction method. The self-assembled Au NP array was prepared by adding an equal volume of homemade Au NP colloid and chloroform into a hydrophilic glass vial and shaking vigorously. For the detection of acetamiprid, acetamiprid dissolved with chloroform was first mixed with an equal volume of Au NP colloid to form a self-assembled Au NP array. SERS spectra of the samples were then collected with a portable Raman spectrometer by irradiating the self-assembled Au NP array with 785 nm laser under optimized conditions. The advantages of the self-assembled Au NP array at the interface of the W/O phase are easy preparation, self-healing, and good SERS enhancement for oil-soluble analytes. The developed SERS detection platform based on the self-assembled Au NP array at the interface of the W/O phase exhibited great potential in breaking the binding affinity limitation between targets and SERS substrates as well as quantitative SERS detection of hydrophobic analytes.

2. Experimental Section

2.1. Reagents and Instruments

Chloroauric acid tetrahydrate (HAuCl4·4H2O, 47.8%) was supplied by Sinopharm Chemical Reagent Co., Ltd. (Shanghai, China). Sodium citrate tribasic dehydrate (99.0%), chloroform (CHCl3), n-hexane, cyclohexane, acetamiprid, cyclohexane sulfuric acid (H2SO4, 98%), and hydrogen peroxide (H2O2, 30%) were purchased from Aladdin Biochemical Technology Co. Ltd. (Shanghai, China). All reagents were of analytical grade and used as received. Fruits and vegetables were purchased from a local supermarket. Au NPs were characterized by Evolution 201 UV-Vis spectrometer (Thermo scientific, Madison, GA, USA) and a Talos F200X transmission electron microscopy (TEM) (Thermo Scientific, Hillsboro, OR, USA). SERS spectra were measured using a portable Raman spectrometer (i-Raman Plus BWS465-785H spectrometer, B&W Tek, Newark, DE, USA).

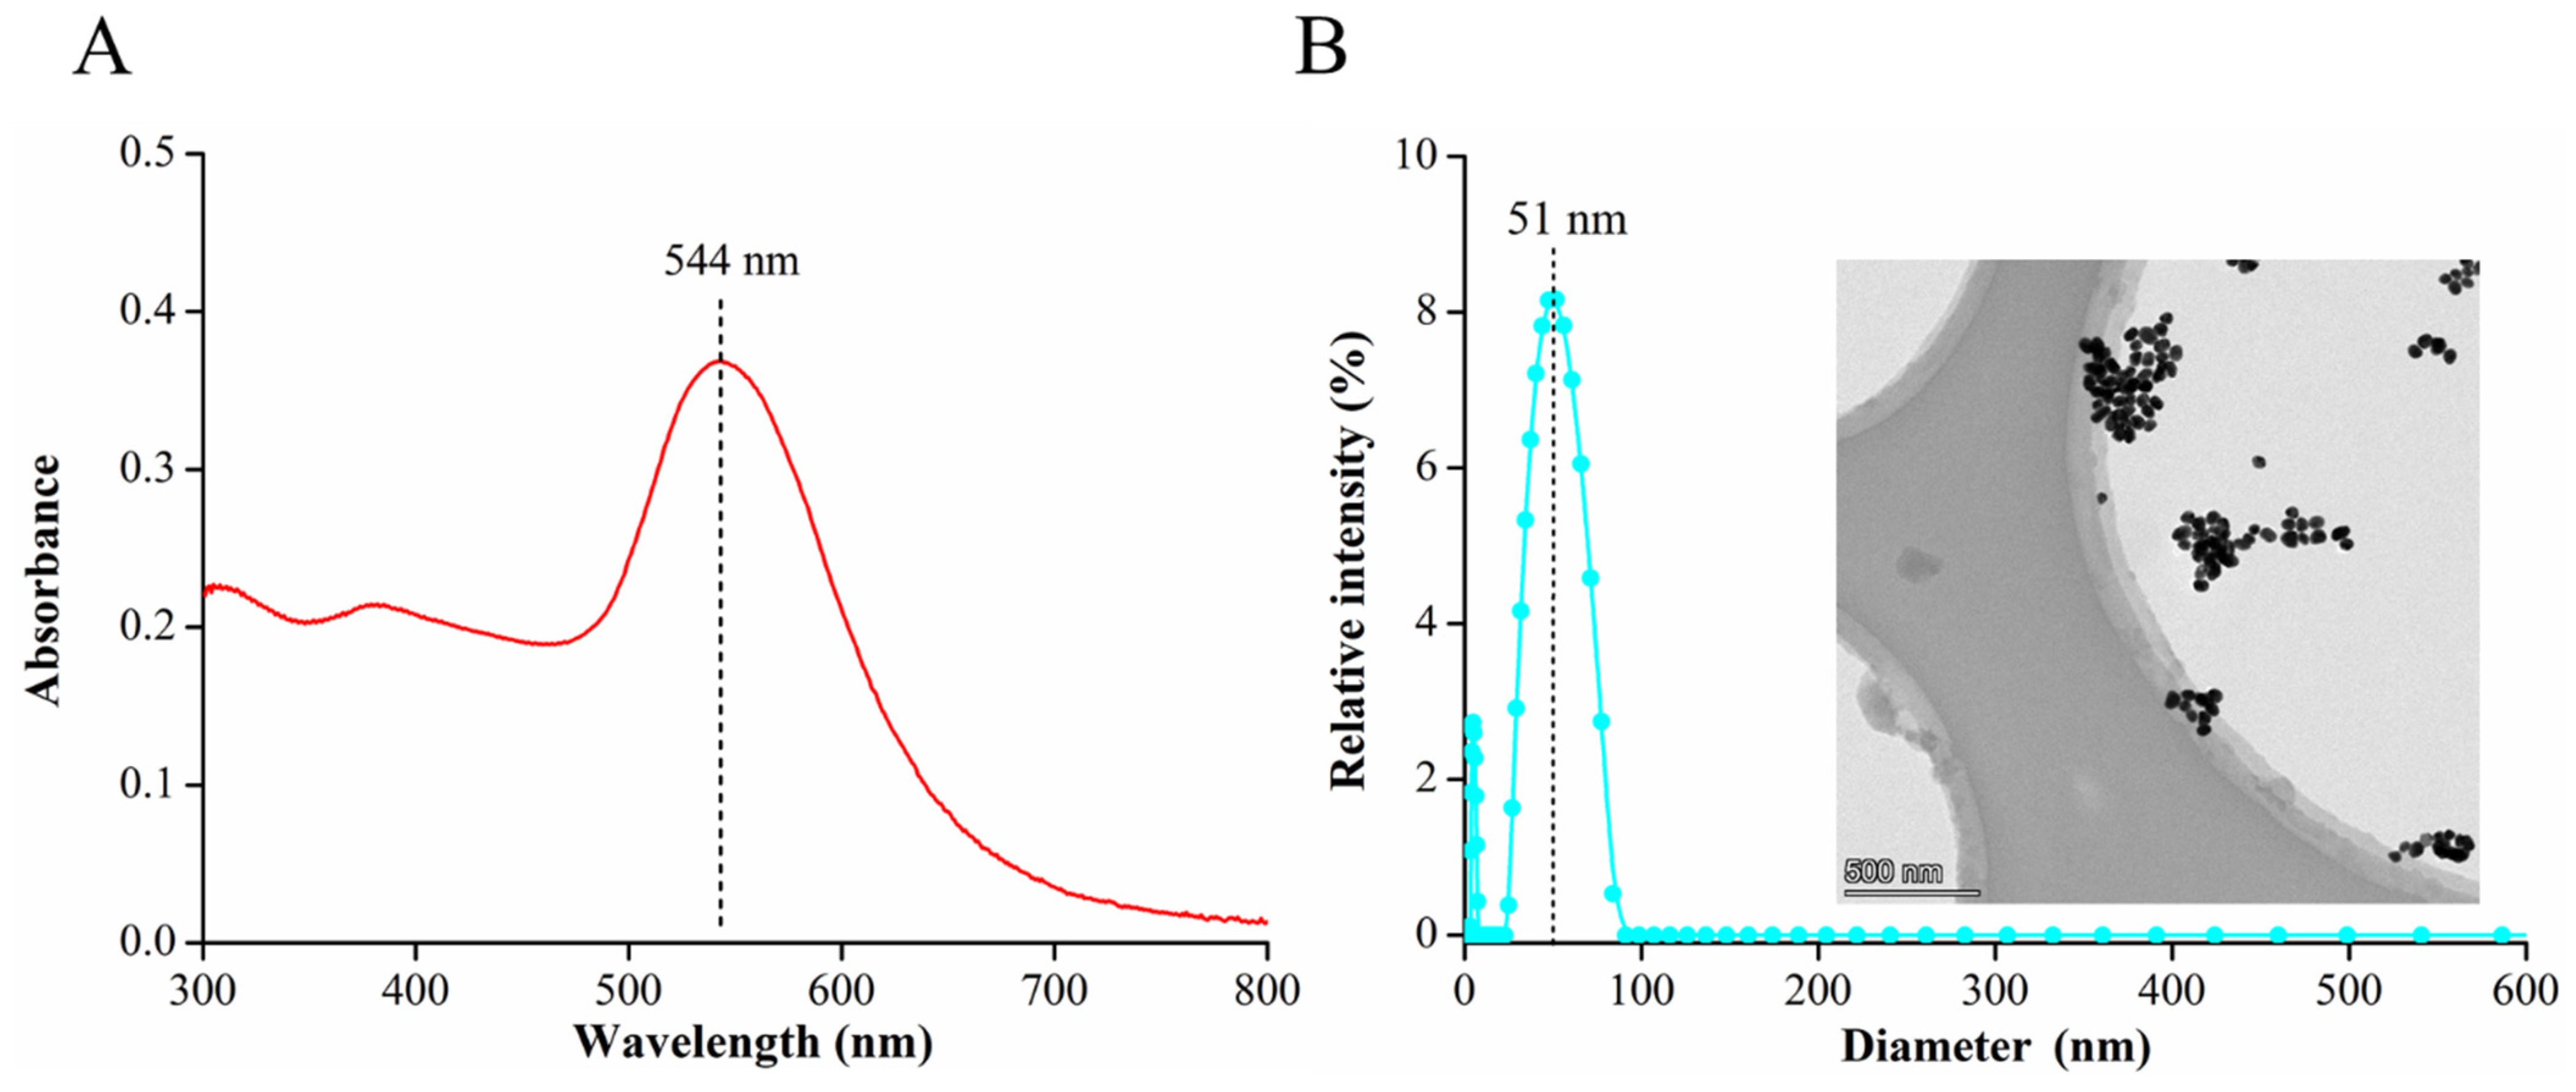
2.2. Synthesis of Au NP Colloid

Au NPs were prepared according to a previously reported method [16]. Briefly, 300 μL of HAuCl4·4H2O (1%, w/v) and 30 mL of distilled water were added into a 100 mL clean conical flask. The mixture solution was stirred at the speed of 250 rpm using a magnetic stirrer and rapidly heated to boil. As soon as the solution was boiling, 180 μL of sodium citrate tribasic dihydrate solution (1%, w/v) was added into the mixture. The conical flask was removed from heat after about 5 min, once NP maturation was completed as the color turned a cloudy claret. The synthesized Au NP colloid was cooled at room temperature and stored at 4 °C for further use. UV-Vis absorption spectrum of the synthesized Au NPs was collected using a 1:2 dilution (stock: H2O). Representative TEM images of the synthesized Au NPs were collected with 10 μL of 1:5 (stock: H2O) dilution on a carbon-coated copper grid.

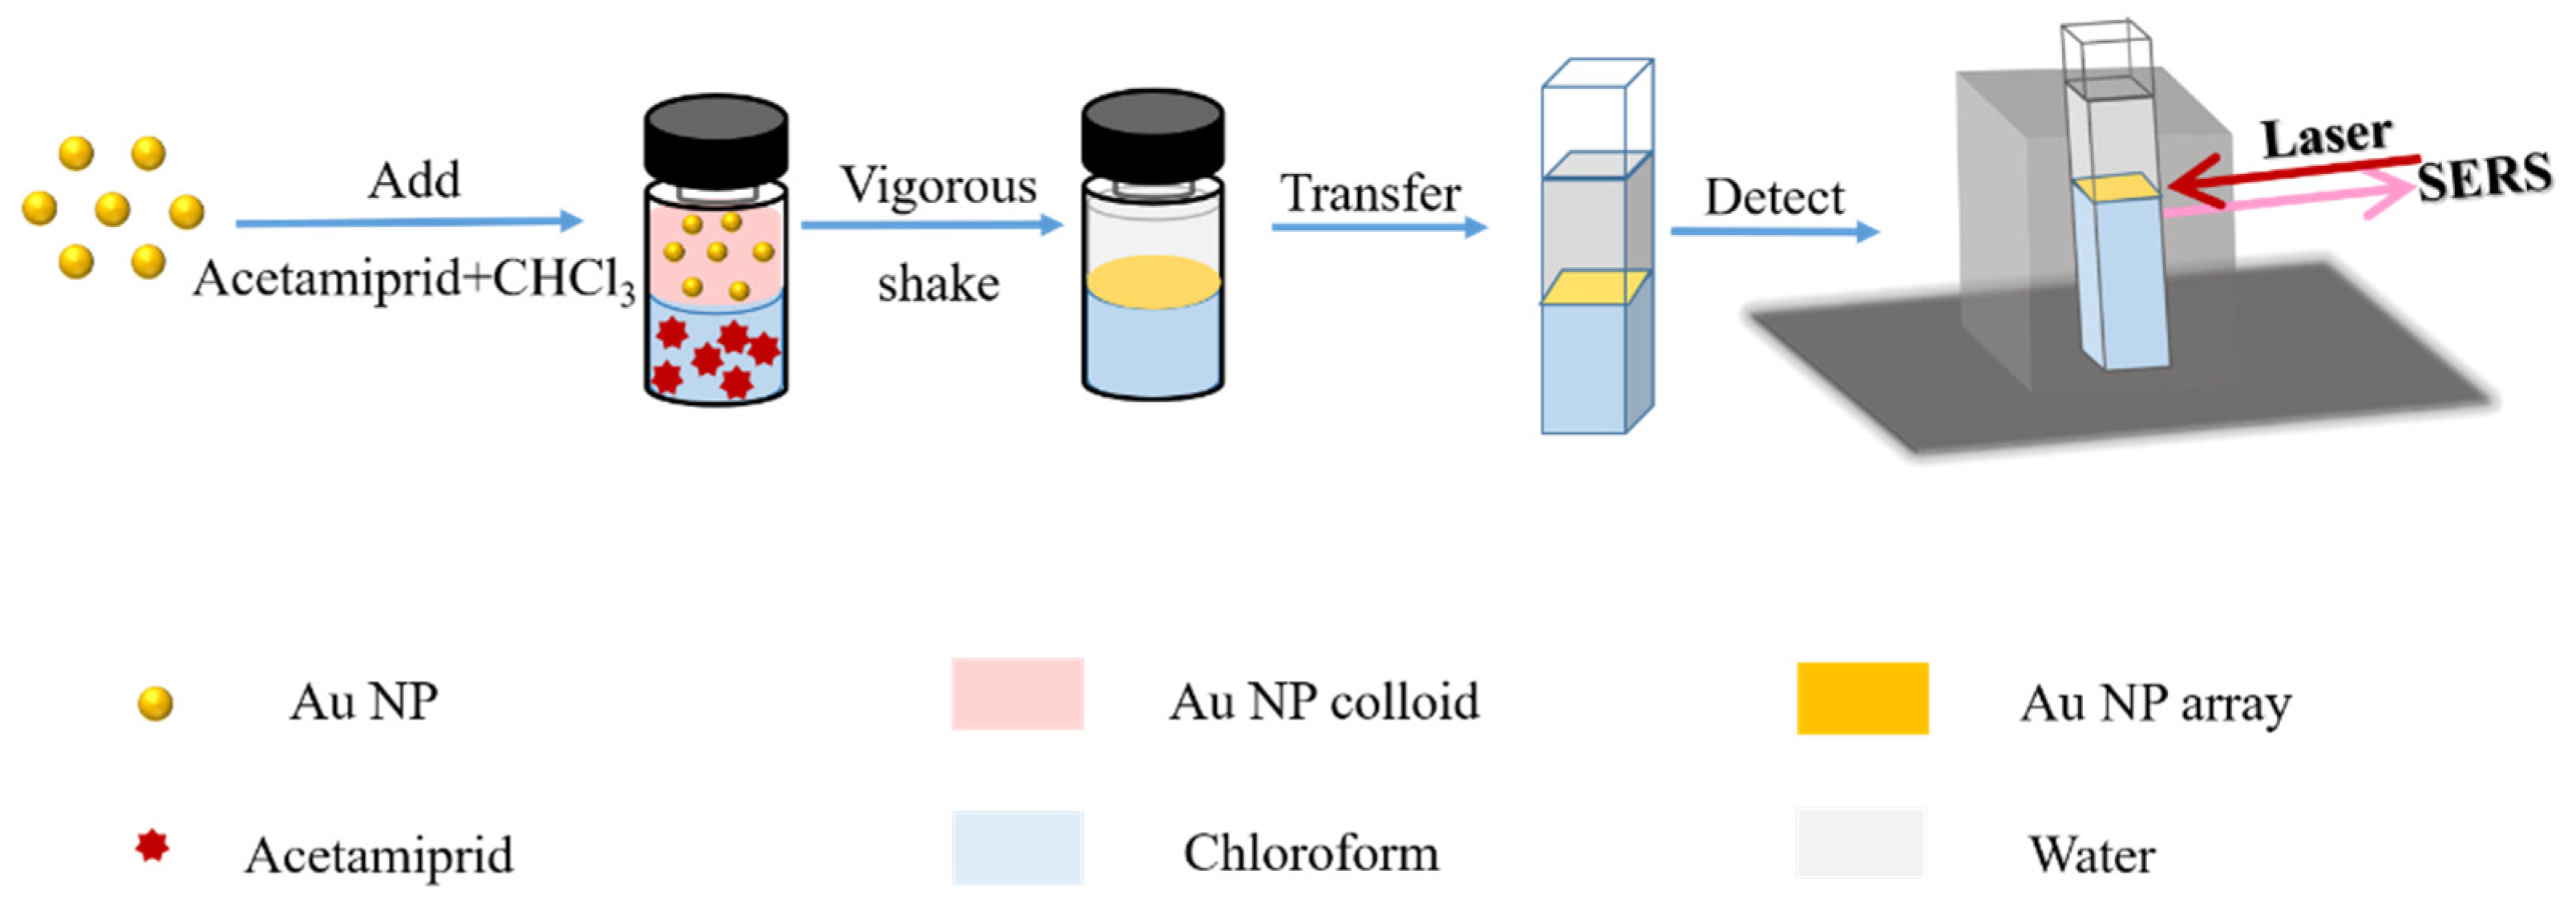
2.3. Preparation of Self-Assembled Au NP Array at the Interface of Water and Chloroform

An interfacial self-assembled Au NP array was prepared following a reported method with minor modification [14]. Briefly, 1.5 mL chloroform and 1.5 mL homemade Au NP colloid were added into a hydrophilic glass vial unless otherwise stated. The mixture was vigorously shaken to induce self-assembly of Au NPs at the water–chloroform interface. After 30 to 60 s of sharp shaking, the Au NP array was formed at the interface between the aqueous phase and organic phase and the color of the Au NP colloid changed from cloudy claret to colorless.

2.4. SERS Detection of Acetamiprid

In this study, 0.0222 g acetamiprid was dissolved in 10 mL chloroform to prepare a stock solution of acetamiprid with a concentration of 1.0 × 10² mol/L. The stock solution was diluted with chloroform to the required concentrations unless otherwise stated. For SERS detection, 1.5 mL Au NP colloid was mixed with 1.5 mL of acetamiprid chloroform solution and shaken vigorously. The interfacial self-assembled Au NP array was formed in 1 min after shaking. Then, the mixture including the generated Au NP array was gently transferred into a quartz cuvette. After, SERS spectra were collected by a portable Raman system with a 785 nm laser at a power of 320 mW and an integration time of 6 s. SERS analysis was conducted in triplicate.

2.5. Real Sample Detection

To verify the feasibility of the developed SERS method in real sample analysis, apple and spinach were used as representatives. Apple and spinach were bought from a local supermarket. A surface swab method was used to recover pesticides from the surfaces of apple and spinach [22]. Swab sticks were bought from a drugstore. First, the surface of apple or spinach was wiped by a swab pre-soaked with chloroform, then the swab stick was immersed in 2 mL chloroform and ultrasonically extracted for 15 min to release the pesticides. Next, 1.5 mL of the obtained chloroform containing pesticide was mixed with an equal volume of Au NP colloid to induce a self-assembled Au NP array. After the formation of the Au NP array, the mixture was transferred into a silicon cuvette to collect its SERS spectra.

3. Results and Discussion

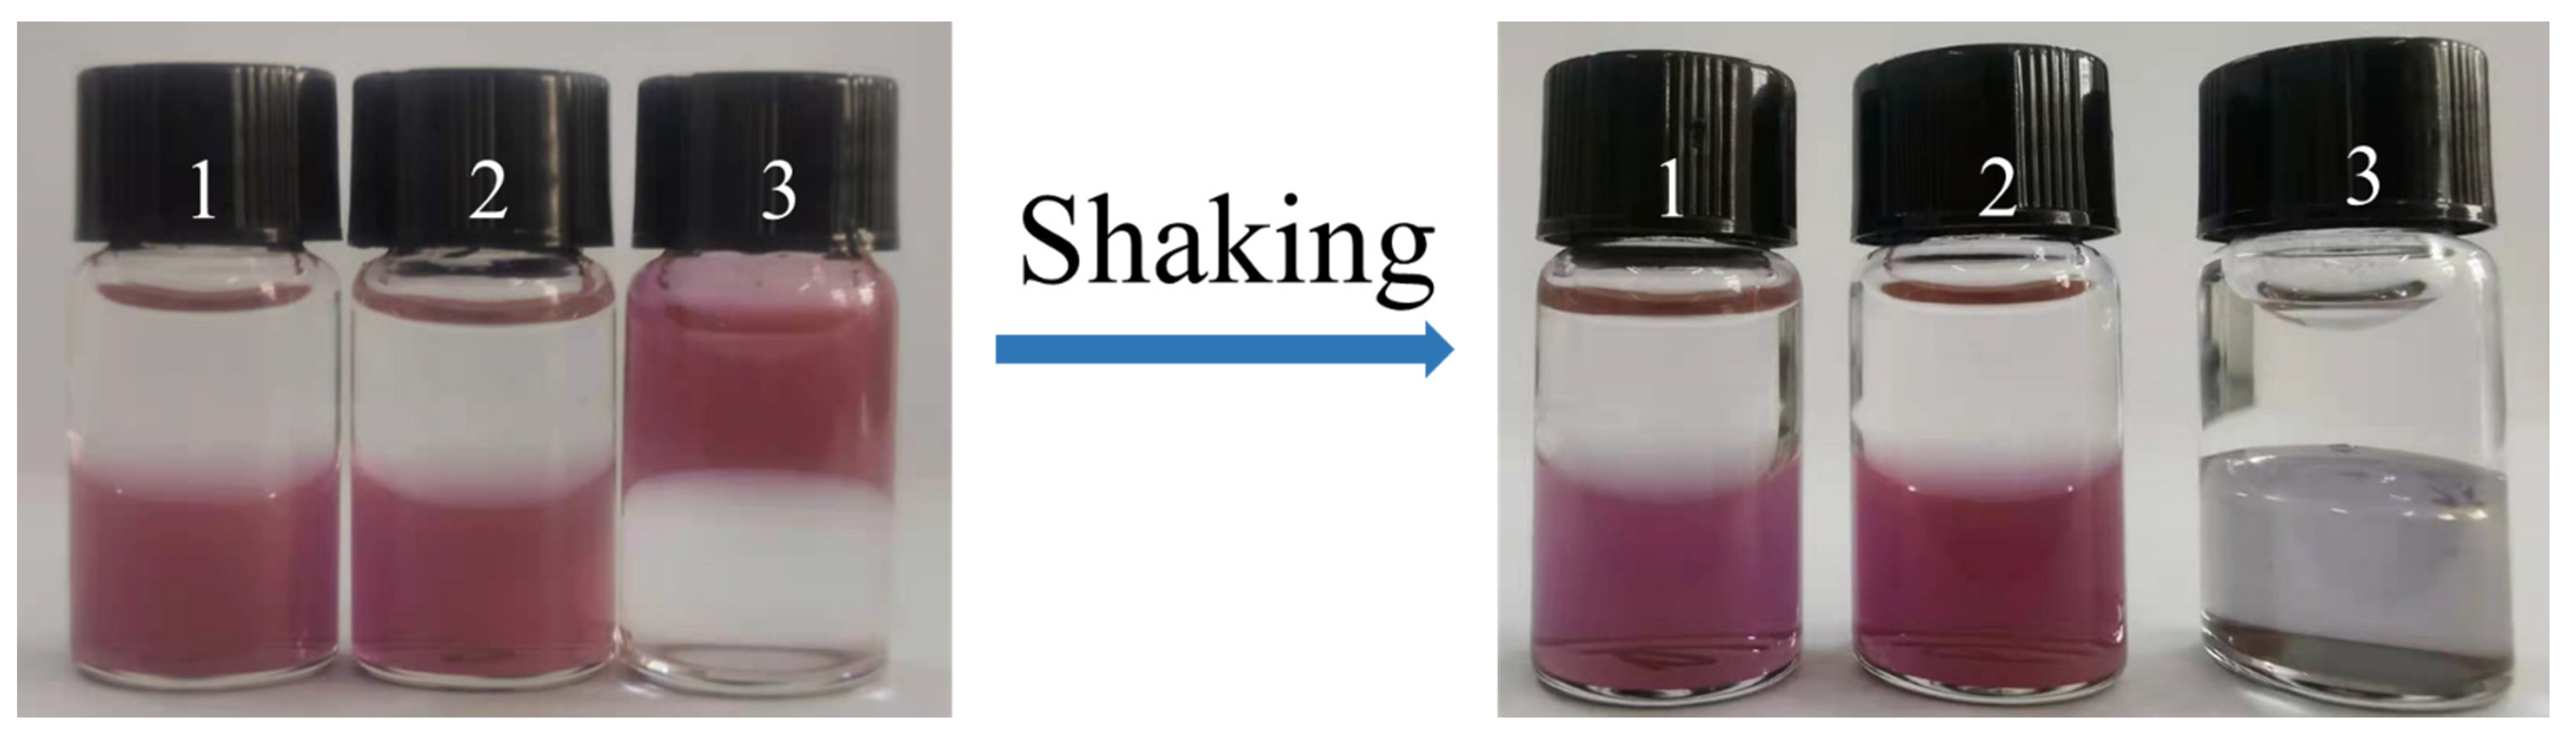
3.1. Preparation of Self-Assembled Au NP Array at the Interface of Water and Chloroform

In this study, Au NPs were synthesized by a citrate reduction method and characterized with UV-Vis spectroscopy, particle size analyzer, and TEM. UV-Vis spectroscopy was used to examine the optical properties of the Au NP colloid. It has been reported that Au NPs exhibited good optical property depending on their localized surface plasmon resonance (LSPR) bands [23]. Figure 1A shows a representative UV-Vis spectrum of the synthesized Au NPs. The UV-Vis spectrum of the synthesized Au NP colloid presented a maximum absorbance at 544 nm, which indicated the successful synthesis of Au NPs [24]. As can be seen from Figure 1B, the main diameter of the synthesized Au NPs was 51 nm. Morphology of the synthesized Au NPs was characterized by TEM. The TEM image in Figure 1B (insert panel) shows that the morphology of the homemade Au NPs was homogeneous and oval in shape.
Scheme 1 presents the procedure of detecting acetamiprid by SERS combined with a self-assembled Au NP array at the interface of chloroform and water. The Au NP array was spontaneously formed at the incompatible water/chloroform interface after vigorously shaking the mixture of an equal volume of the homemade Au NP colloid and chloroform in hydrophilic glass bottle. The whole process was completed within 30 to 60 s, and a golden metallic film at the interface of the chloroform and water phases was clearly observed. Since the Au NPs were trapped in the water/chloroform interface, the Au NP colloid residual turned colorless. The Au NP colloid residual was also assessed by UV-Vis spectroscopy and the UV-Vis spectrum of the Au NP colloid residual was almost the same as that of the double distilled water (control) (Figure S1).
Performances of different organic solvents on the induction of self-assembled Au NP arrays were investigated. The results (Figure 2) indicated that chloroform was better than n-hexane and cyclohexane. This is probably because the polarity of chloroform is much closer to water when compared with n-hexane and cyclohexane, and the closer the polarity of organic solvent is to water, the easier the formation of the self-assembled Au NP array [25,26]. It has been reported that the formation of self-assembled Au NP arrays are decided by three forces: the interfacial surface tension, coulombic repulsion, and van der Waals attraction [27,28]. Thus, chloroform was used as the organic solvent to induce the self-assembly of the Au NP array in the following experiments.

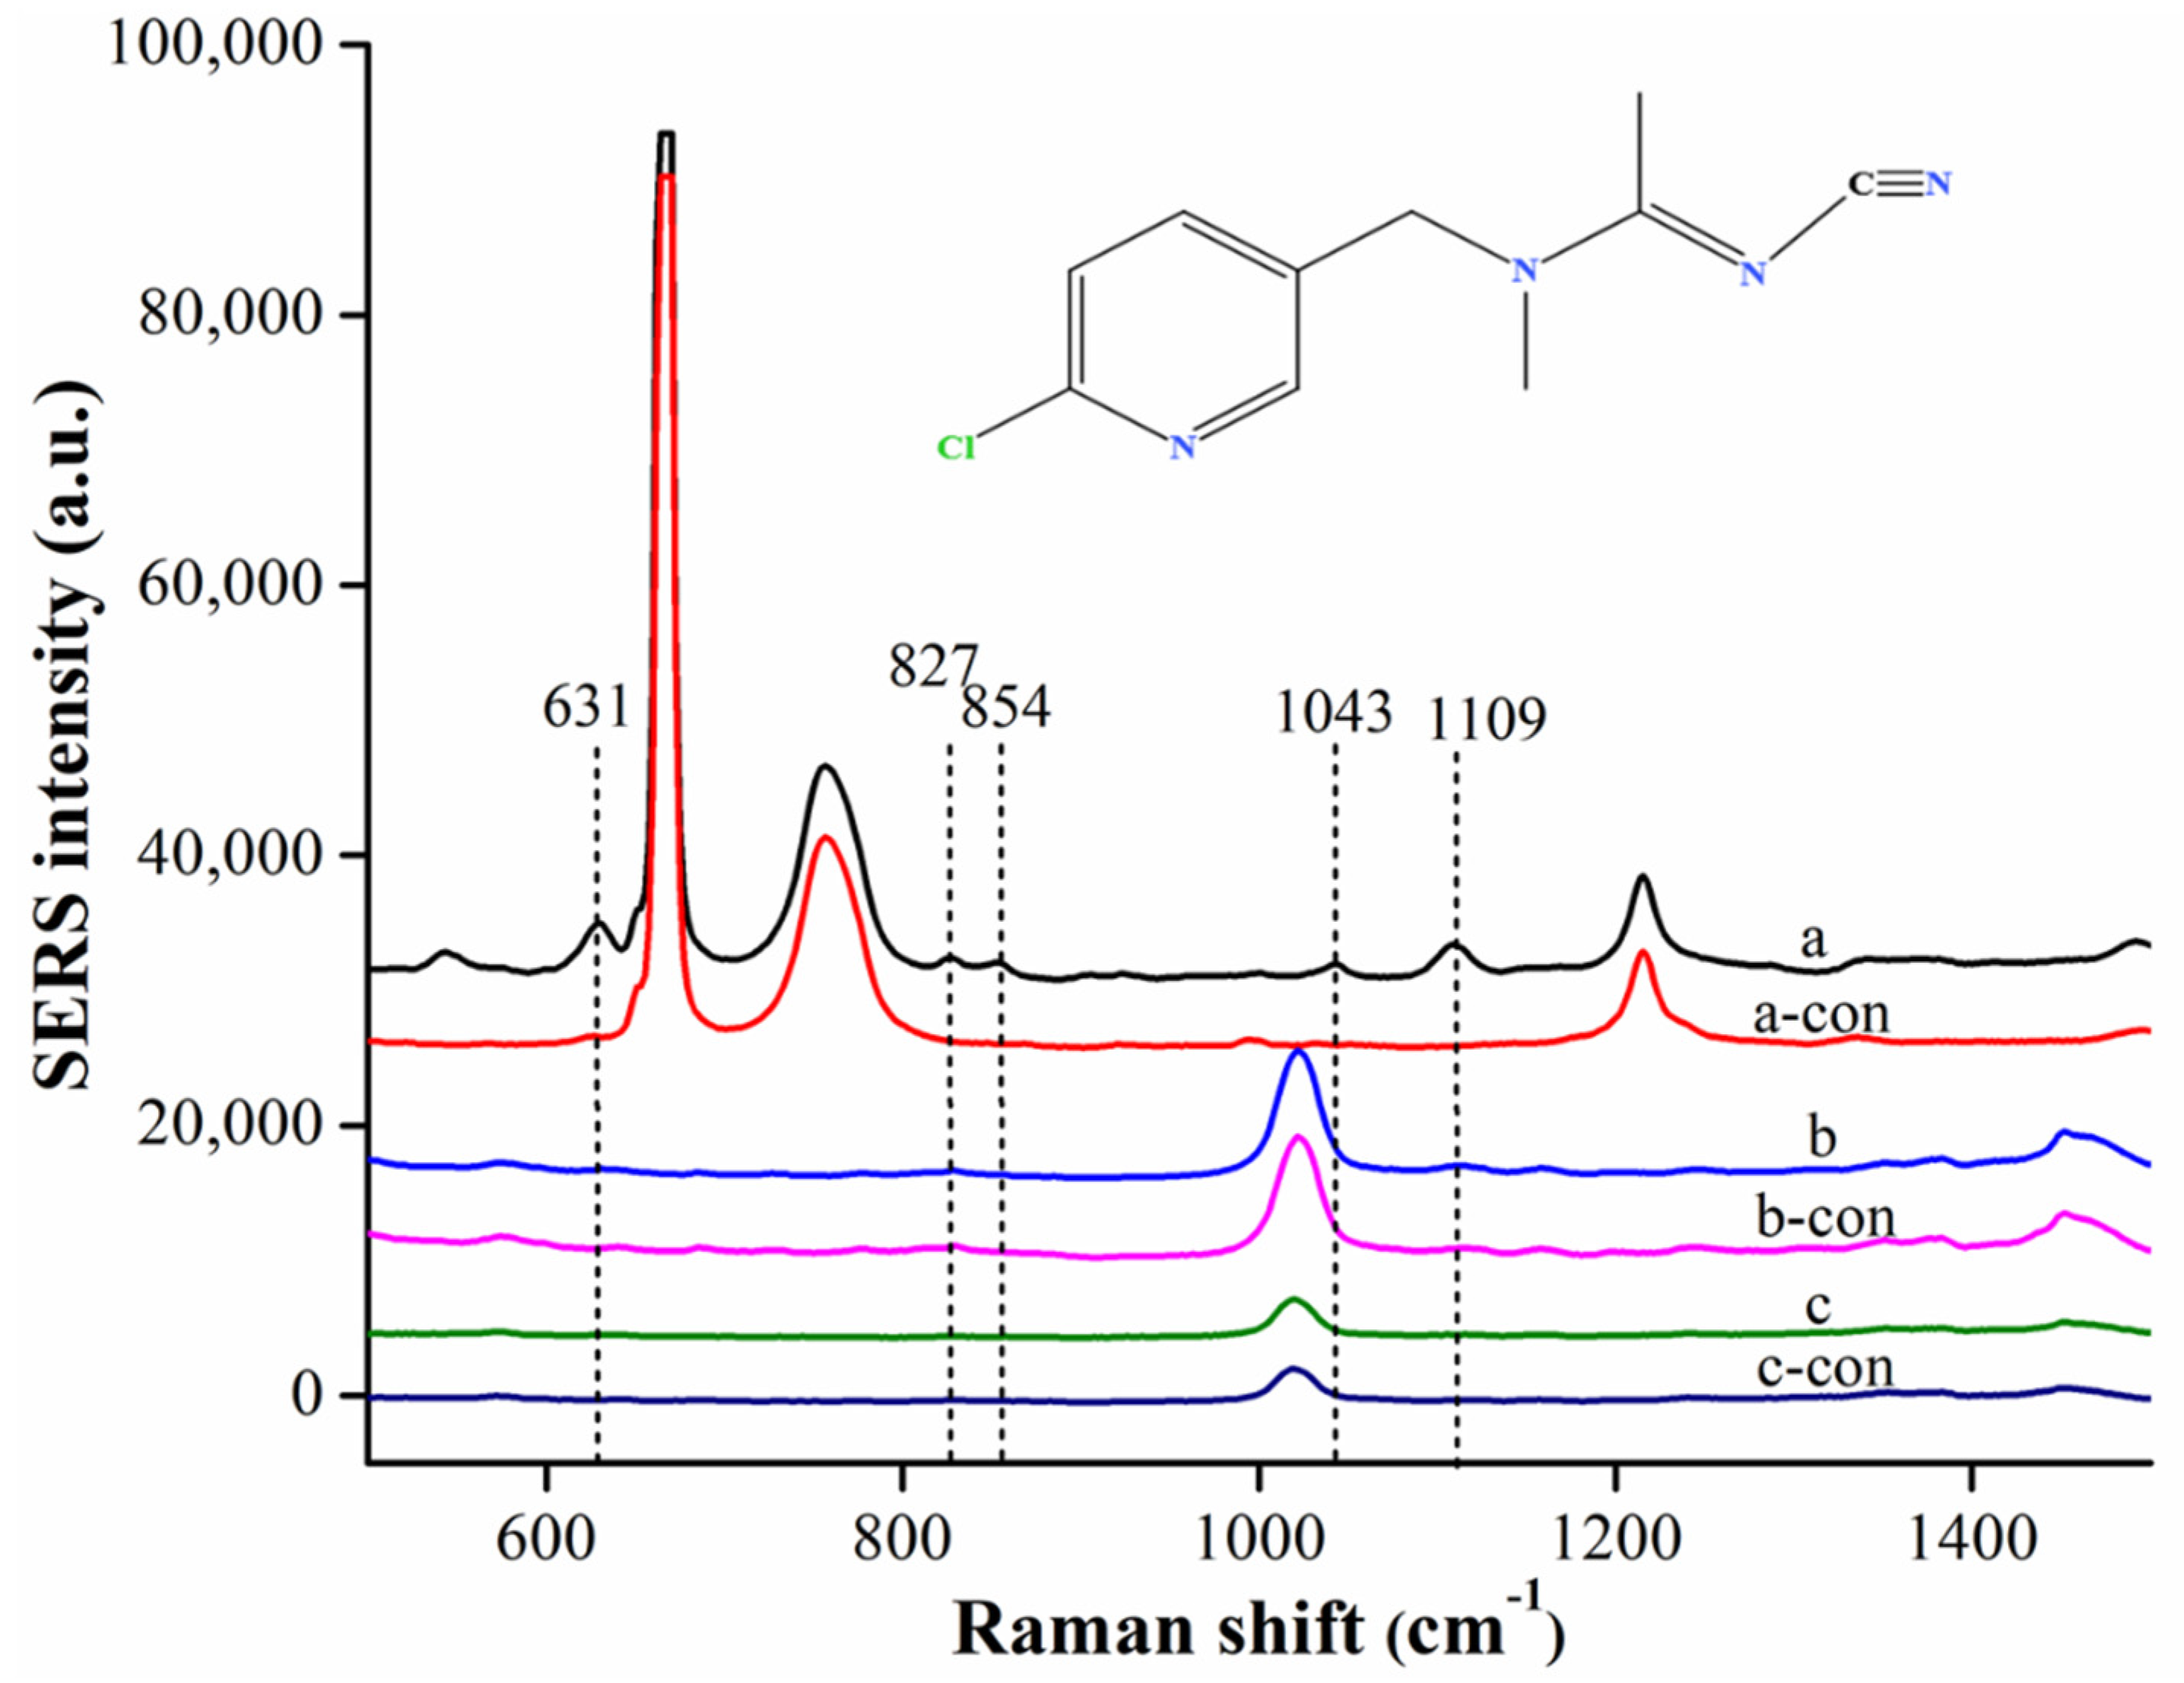
3.2. Comparison of Self-Assembled Au NP Array Based, Liquid Based, and Dried Liquid Droplet Based SERS Detection of Acetamiprid

In this study, SERS detection of acetamiprid using the self-assembled Au NP array as an enhancing substrate was conducted by the above described procedure. Liquid based SERS detection of acetamiprid was conducted by dissolving and diluting acetamiprid with methanol instead of chloroform and a 1.5 mL well-prepared sample with 1.5 mL Au NPs colloid, then the mixture was placed into a 1 cm quartz cuvette before collecting the SERS spectra. SERS detection of acetamiprid in a dried liquid droplet was conducted by dropping a 10 μL well-prepared liquid sample of liquid based SERS detection onto a tin-foil covered glass slide, dried at room temperature, and then the SERS spectra were collected from the dried liquid droplet. SERS spectra of acetamiprid at the concentration of 1.0 × 10⁵ mol/L collected from the self-assembled Au NP array based, liquid based, and dried liquid droplet based SERS analysis are given in Figure 3. As can be seen in Figure 3, characteristic peaks of acetamiprid at Raman shifts 631 cm1, 827 cm1, 854 cm1, 1043 cm1, and 1109 cm1 were clearly observed in the self-assembled Au NP array based on SERS detection. However, no characteristic peak of acetamiprid was observed in the liquid based and dried liquid droplet based SERS analysis. Therefore, the performance of the self-assembled Au NP array based on SERS on the detection of acetamiprid was superior to those of the other two modes of SERS analysis. In addition, a comparison of the SERS spectrum of acetamiprid at the concentration of 1.0 × 10⁵ mol/L and the Raman spectrum of acetamiprid powder is shown in Figure S2. As can be seen from Figure S2, the locations of the characteristic peaks of acetamiprid were different in the SERS spectrum of acetamiprid at the concentration of 1.0 × 10⁵ mol/L and the Raman spectrum of the acetamiprid powder [29]. This phenomenon was in agreement with a previous report and is probably due to the interaction of acetamiprid with the Au NP array. The peak at 631 cm1 was attributed to the ring structure and the peak at 1109 cm1 was associated with the C–C stretches in the molecule [2]. The peak at the Raman shift 854 cm1 was probably related to the CNC stretching. The peak at 827 cm1 is possibly derived from the ring vibration from para-disubstituted benzene and the peak at 1043 cm1 might be related to ring vibration from ortho-disubstituted benzene. Stability of the self-assembled Au NP array was assessed by comparing the SERS spectra of acetamiprid collected with the freshly prepared Au NP array and Au NP arrays stored at room temperature for three days and seven days (Figure S3). As can be seen from Figure S3, intensities of the characteristic SERS signals of acetamiprid at the Raman shifts of 631 cm1 and 1109 cm1 showed no significant difference between the spectra collected from freshly prepared Au NP array and Au NP array stored for three days. After being stored for seven days, the intensities still reached 89% of that from the fresh prepared Au NP array. These results indicated that the self-assembled Au NP array prepared in this study had good stability.

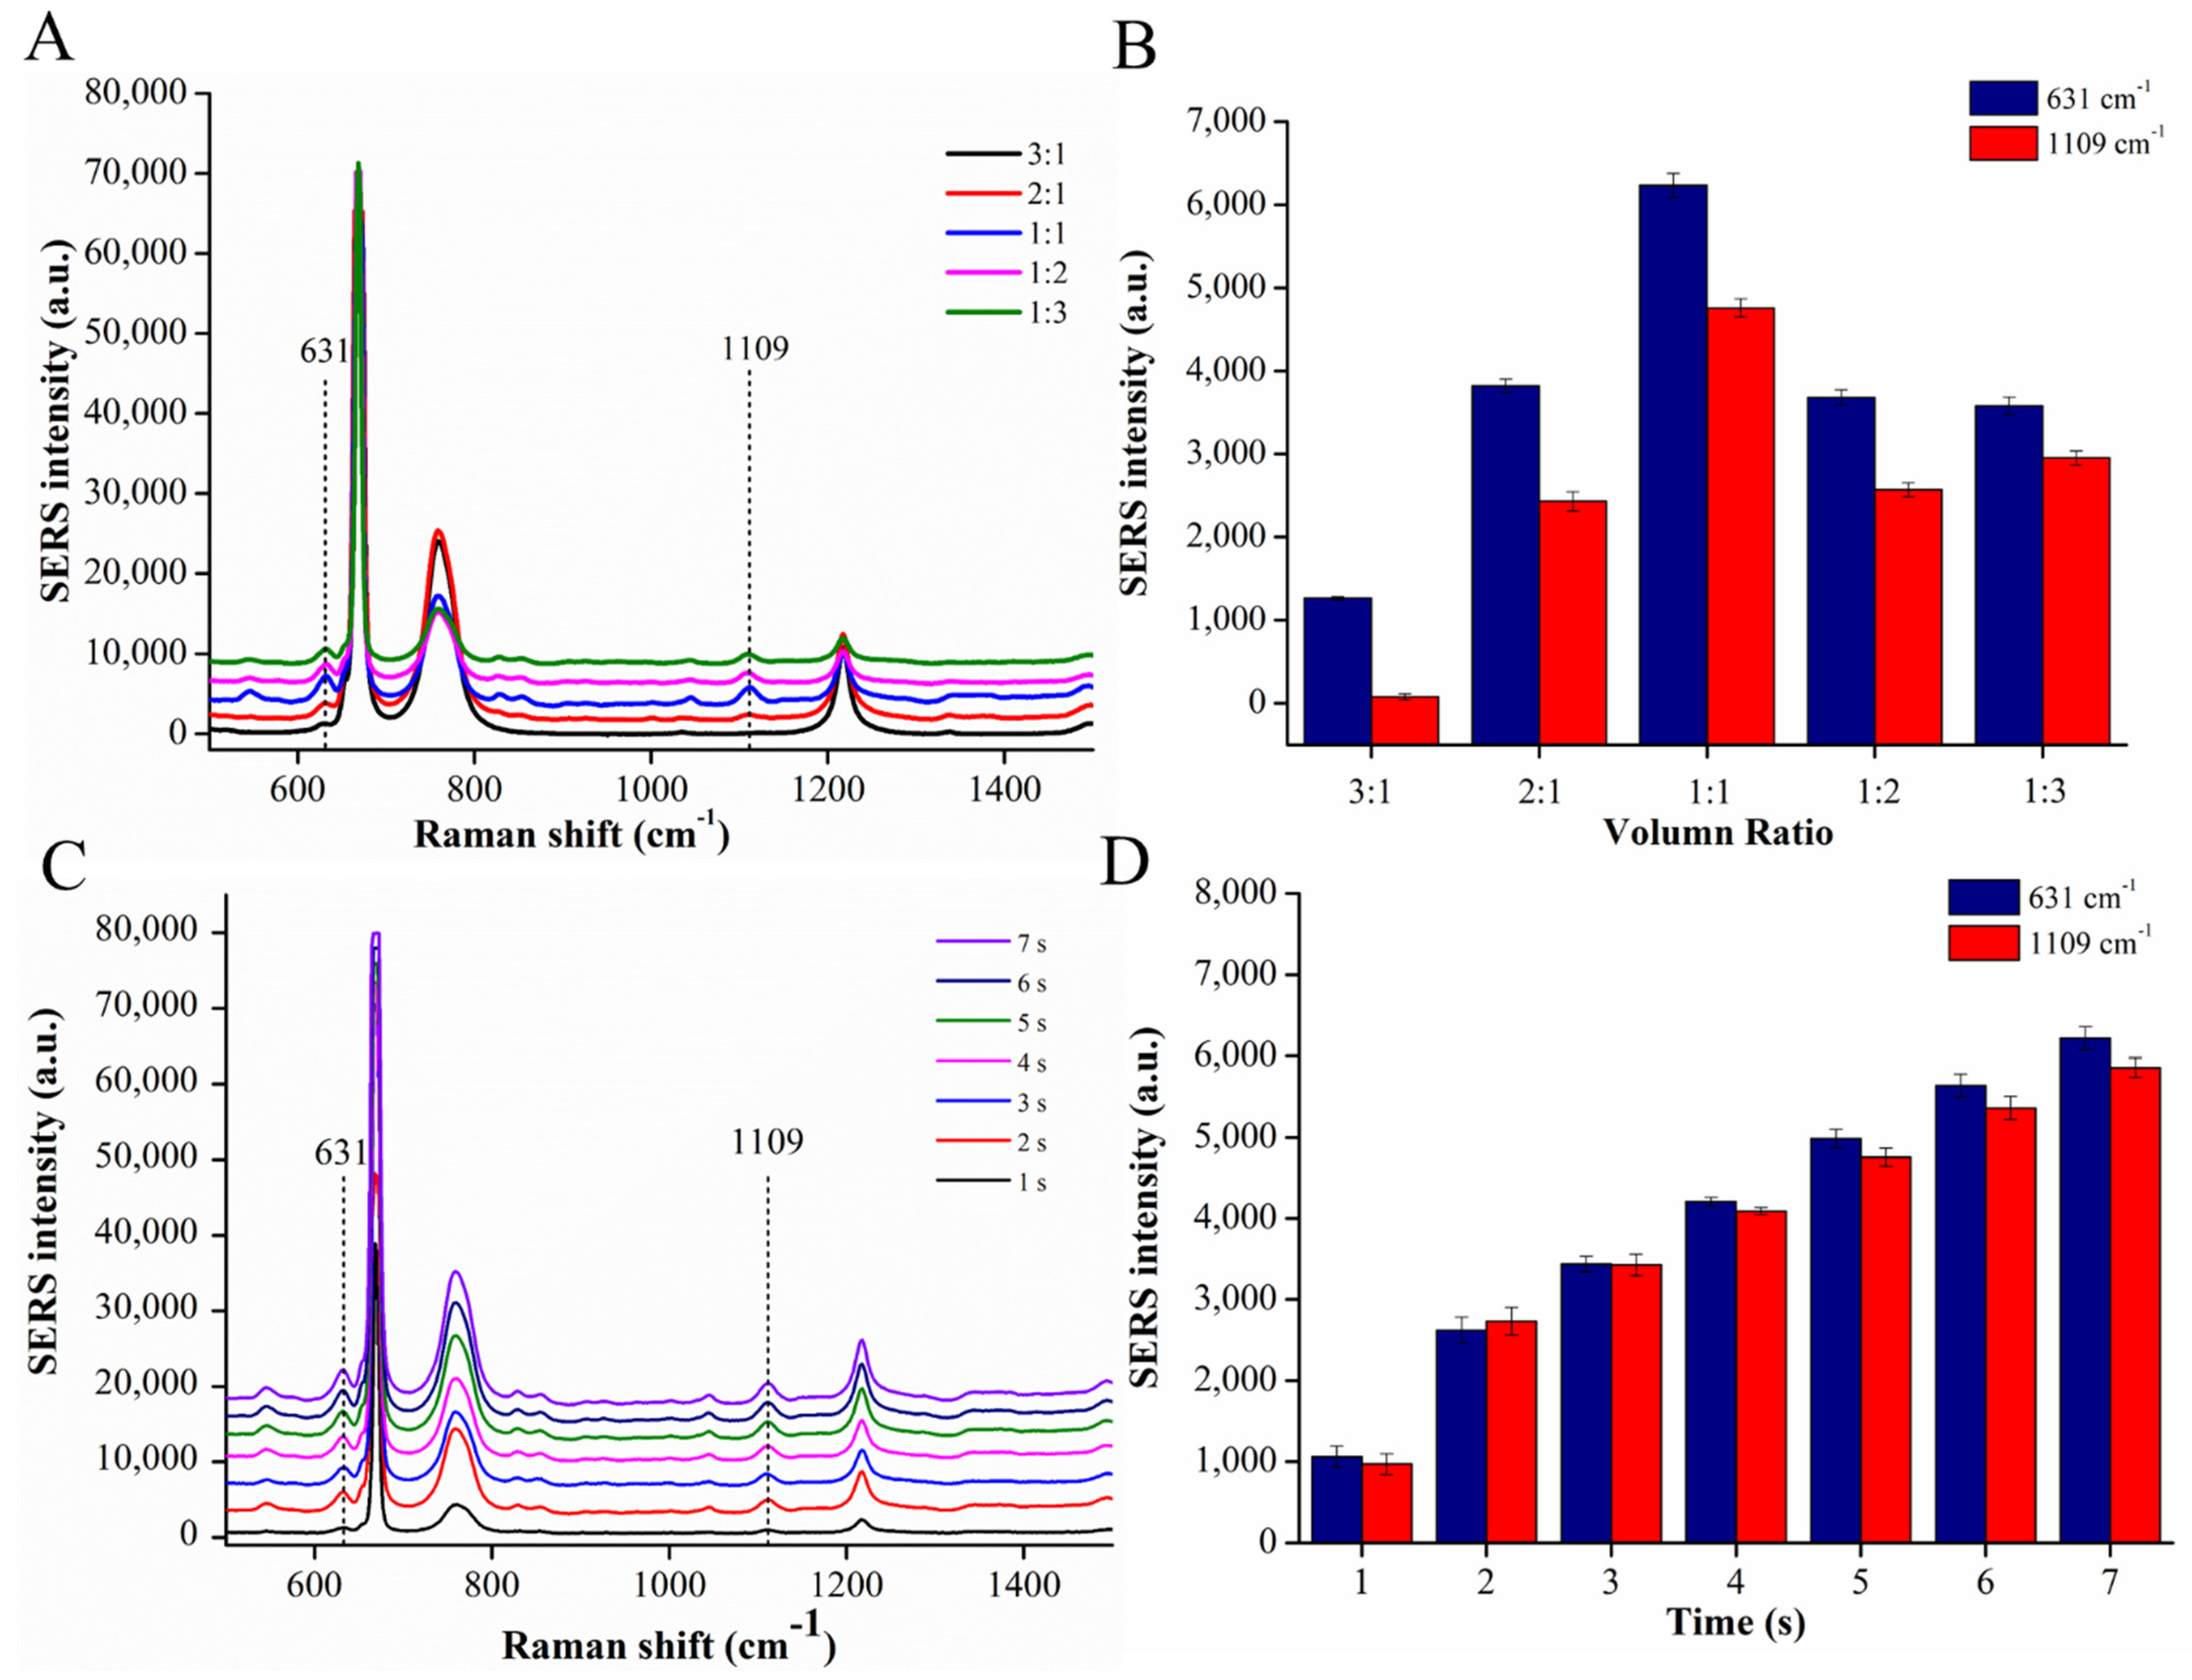
3.3. Optimization of the Experimental Parameters

To improve the sensitivity of the self-assembled Au NP array based SERS for acetamiprid detection, experimental parameters such as the volume ratio of Au NPs and sample solution and integration time were optimized. Effects of concerned parameters were evaluated by the intensity of the characteristic SERS peaks of acetamiprid at 631 cm1 and 1109 cm1. Volume ratios of chloroform and Au NP colloid were optimized from 3:1 to 1:3 by keeping a constant total volume. Figure 4A illustrated the SERS spectra of acetamiprid collected with self-assembled Au NP arrays prepared at different volume ratios of chloroform and Au NP colloid. As shown in Figure 4A, the intensity of the SERS signal at 631 cm1 and 1109 cm1 first increased and then decreased when the ratio of chloroform and Au NP colloid changed from 3:1 to 1:3, and the highest intensity was observed at the volume ratio of 1:1. When the volume ratio of chloroform and Au NPs was in the range of 3:1 to 1:1, intensities of characteristic peaks of acetamiprid at 631 cm1 and 1109 cm1 increased with the increase in Au NP dosage. This is probably because more hot-spots were generated with the increase in Au NP colloid dosage. While some folds that stretched into the water phase were clearly observed in the Au NP arrays when the ratio of chloroform and Au NP colloid was in the range of 1:1 to 1:3, in this range, the intensity of SERS signals decreased with the increase in Au NP dosage. This phenomenon was in agreement with a previously reported study [20]. We speculated that the formation of folded area in the Au NP array would lead to the reduction in hot-spots that were available for acetamiprid in chloroform. Therefore, an equal volume of Au NP colloid and chloroform was used to induce the formation of high-quality interfacial Au NP arrays for acetamiprid detection in subsequent experiments.
Integration time is also a vital factor affecting the intensity of Raman signal, normally the intensity of the Raman signal increases with the increase in integration time. However, if the integration time was too long, the SERS intensity might exceed the maximum range of the instrument. Therefore, optimization of the integration time was evaluated by the intensity of characteristic peaks as well as the integrity of the Raman spectrum. As shown in Figure 4C, intensities of the characteristic SERS peaks of acetamiprid at 631 cm1 and 1109 cm1 increased with the increase in integration time. When an integration time of 7 s was applied, the SERS spectra of acetamiprid exhibited an overall upward shift, and the absolute intensities of the characteristic peaks at the Raman shifts of 631 cm−1 and 1109 cm1 were almost the same with those collected with an integration time of 6 s. Thus, an integration time of 6s was used as the optimal integration time in the following experiments. The intensity of the Raman peak is crucial to quantitative analysis. This method was expected to be more sensitive and accurate with an integration time of 6 s applied.

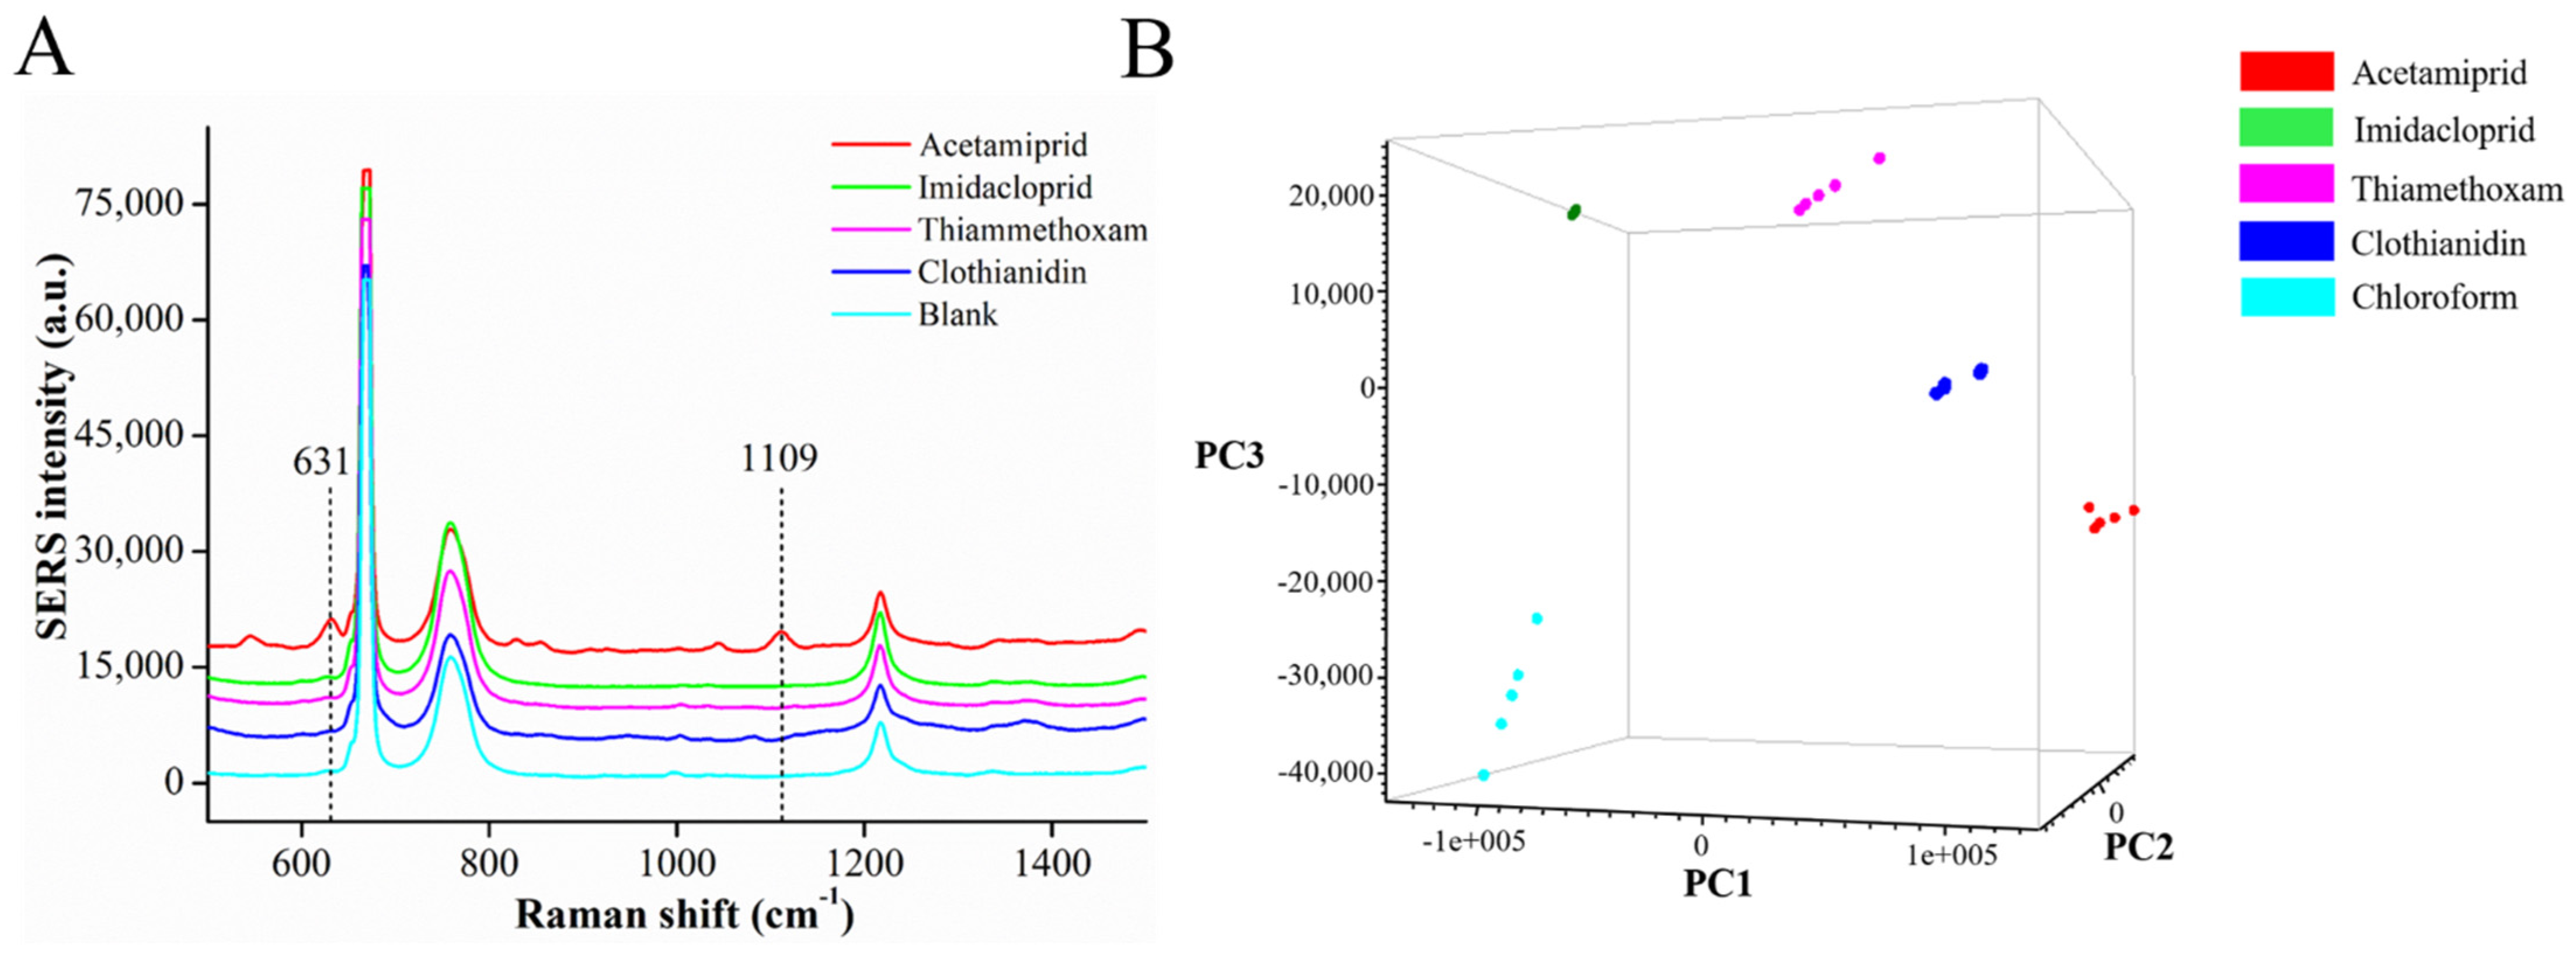
3.4. Specificity of the Developed Self-Assembled Au NP Array Based SERS Method

Acetamiprid, clothianidin, imidacloprid, and thiamethoxam all belong to neonicotinoid pesticides and were selected to assess the specificity of the developed SERS method. SERS spectra of these pesticides collected with the self-assembled Au NP arrays and their corresponding principal component analysis (PCA) results are given in Figure 5. The results indicated that SERS spectra of different neonicotinoid pesticides were significantly different and the developed SERS method also could be applied to the detection of other organic pesticides. In the PCA plot (Figure 5B), the first three components explained 99.53% of the difference, and PC1, PC2, and PC3 accounted for 85.25%, 10.63%, and 3.64%, respectively. The loading plots for the first three components in PCA analysis are given in Figure S4.

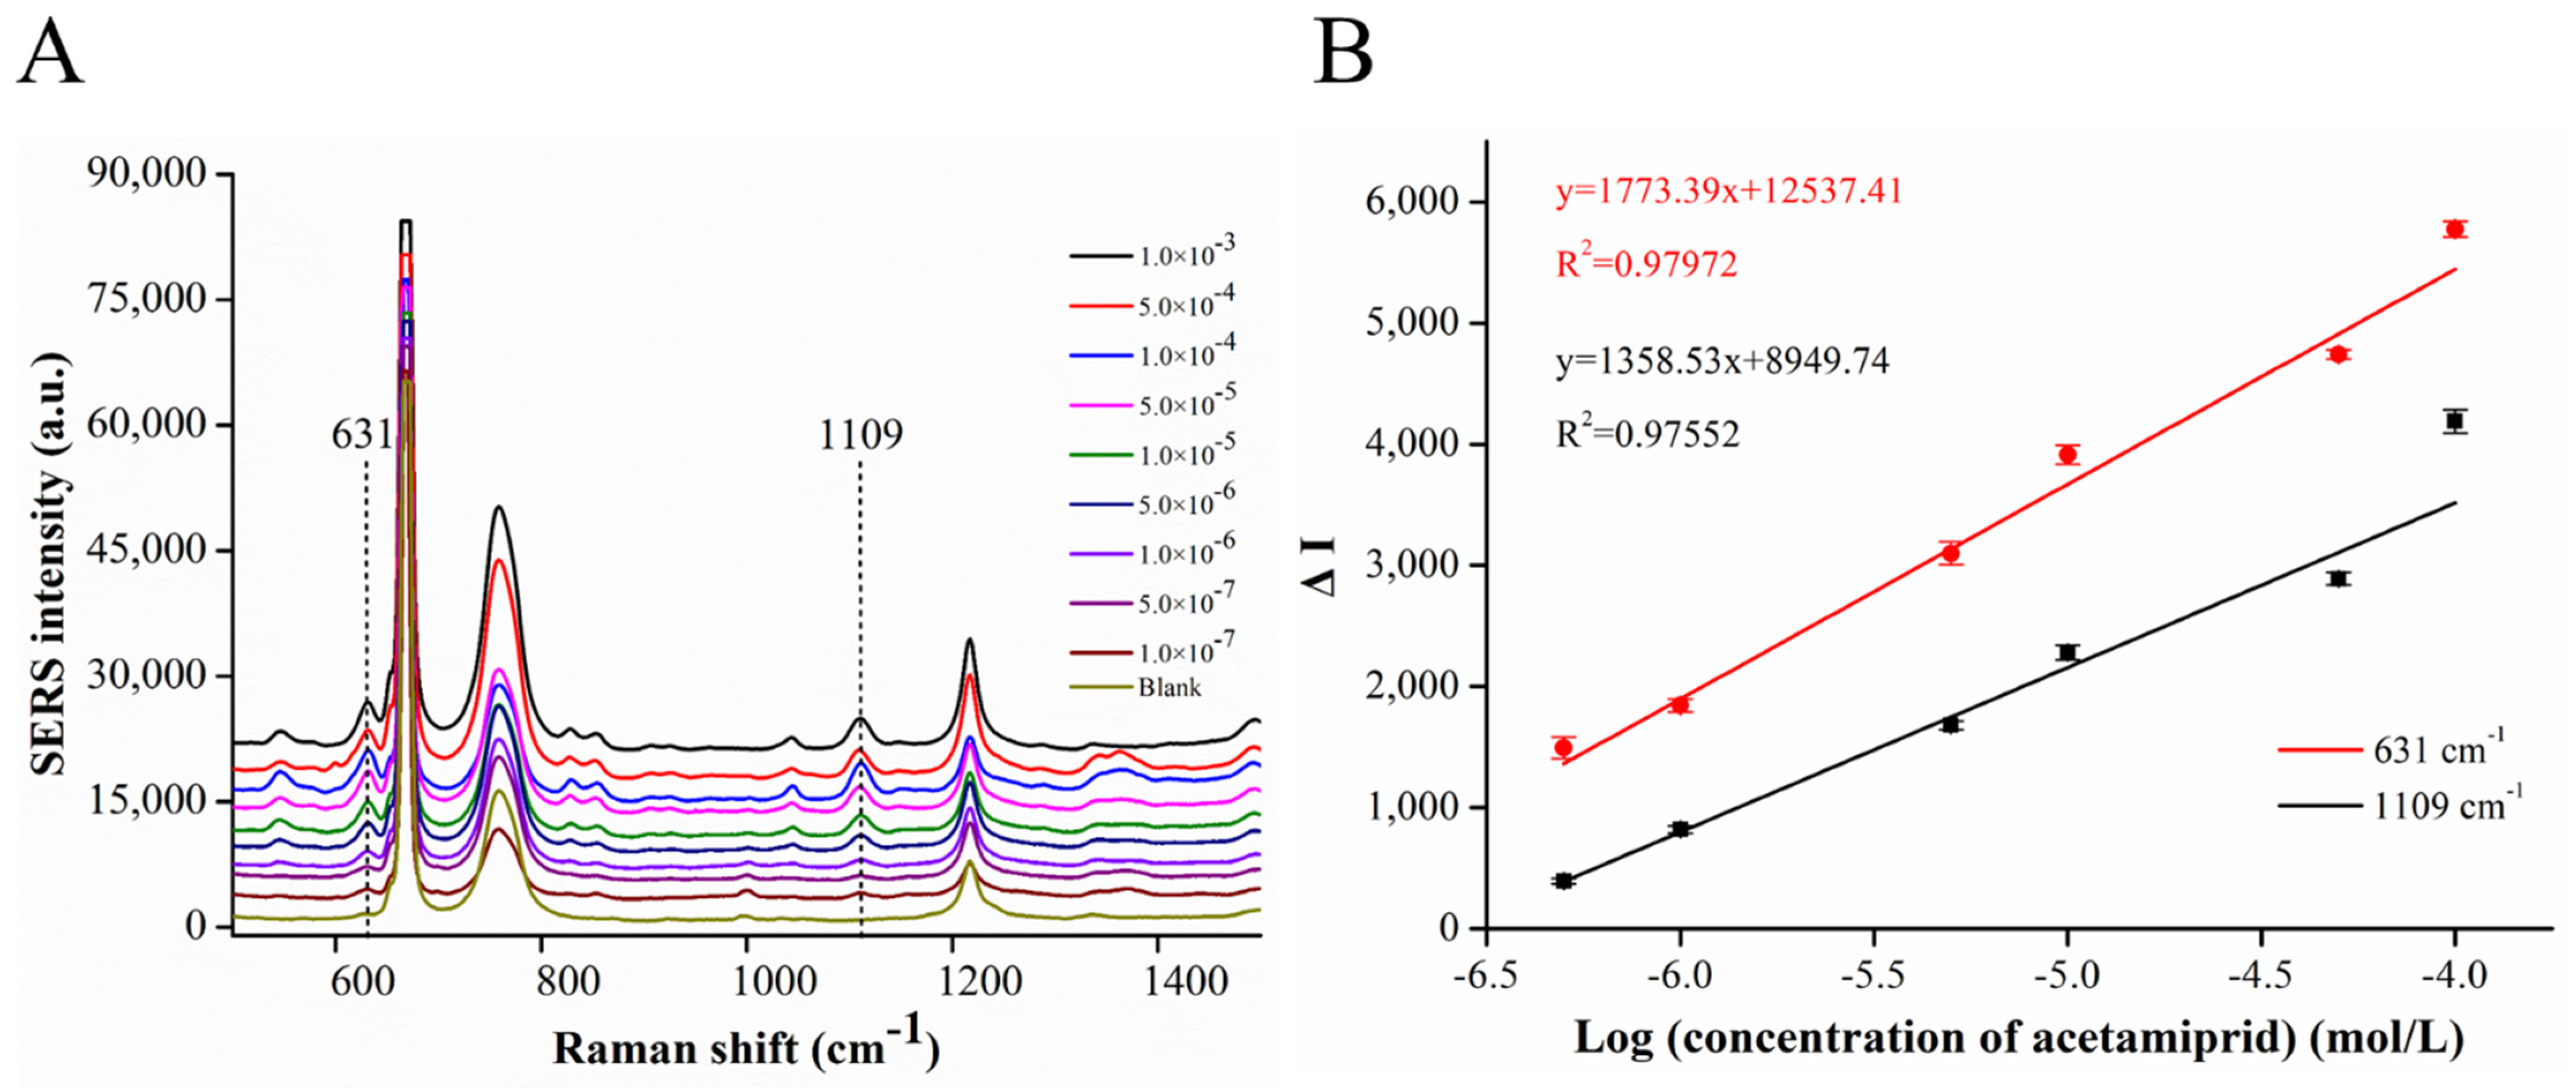
3.5. Detection of Acetamiprid by Self-Assembled Au NP Array Based SERS

The sensitivity and dynamic range of the developed SERS method based on the self-assembled Au NP array for acetamiprid detection were determined under the optimal experimental conditions. The logarithm concentrations of acetamiprid and their corresponding intensities of the characteristic SERS peaks of acetamiprid at 631 cm1 (ring deformation) and 1109 cm1 (C-C stretch) were used to build standard curves, which could be used for the quantification of acetamiprid. SERS spectra of acetamiprid solutions with different concentrations were collected under the optimized conditions, and are shown in Figure 6A. Each sample was analyzed in triplicate and averaged. As can be seen from Figure 6A, the two typical peaks of acetamiprid at Raman shifts of 631 cm1 and 1109 cm1 increased with the increase in acetamiprid concentration. However, acetamiprid solution with a concentration above 5.0 × 10⁴ mol/L showed weaker SERS signals than those of the adjacent lower concentration solution. We speculated that when the concentration of acetamiprid was above 5.0 × 10⁴ mol/L, a non-negligible part of acetamiprid would enter into the Au NP colloid and lead to the agglomeration of Au NPs during vortex before the formation of the self-assembled Au NP array. The prior agglomeration of Au NPs led to the formation of an inhomogeneous self-assembled Au NP array that exhibited a weak SERS enhancement property and resulted in the decrease in SERS signals at the concentration above 5.0 × 10⁴ mol/L. As shown in Figure 6B, the SERS intensities at Raman shifts of 631 cm1 and 1109 cm1 displayed a good linear relationship with the logarithm concentration of acetamiprid in the range of 5.0 × 10⁷ to 1.0 × 10⁴ mol/L, with correlation coefficients of 0.97972 and 0.97552, respectively. The limits of detection (LOD) and quantification (LOQ) were calculated according to the following equations: LOD = 3 SD/k and LOQ = 10 SD/k, SD is the standard deviation of the SERS intensities at 631 cm1 and 1109 cm1 for blank samples, and k is the slope of the standard curve. Thus, the calculated LOD and LOQ of this method were 1.19 × 10⁻⁷ mol/L and 2.63 × 10⁷ mol/L using the SERS signal at 631 cm1, and 2.95 × 10⁷ mol/L and 3.86 × 10⁷ mol/L using the SERS signal at 1109 cm1.
The linear range, LOD, LOQ, and R2 of the developed SERS method and previously reported methods were compared and are listed in Table 1. In comparison with other methods for the detection of acetamiprid, the developed self-assembled Au NP array based SERS method exhibited a wider linear range and lower LOD. In addition, LODs of the developed SERS method were below the maximum residue limitations for spinach (5 mg/kg) and apple (0.8 mg/kg) in the Chinese standard. In addition, the developed SERS method is easy to conduct and can be finished within 1 h. Therefore, the developed SERS method has the potential to be applied as a rapid detection method for acetamiprid and the determination of other organic pesticides.

3.6. Application of the Developed SERS Method in Quantitative Detection of Acetamiprid in Spinach and Apple

The feasibility of the developed Au NP array based SERS method for detecting acetamiprid in real samples was evaluated using spinach and apple as representatives. Samples were first artificially contaminated with acetamiprid at concentrations of 1.0 × 10⁻⁶ mol/L and 1.0 × 10⁻⁵ mol/L. Then, the un-contaminated sample (control) and artificially contaminated samples were detected using the developed SERS method. The corresponding SERS spectra were given in Figure S5. The results were summarized in Table 2. As can be seen from Table 2, recoveries for the detection of acetamiprid on the surface of spinach and apple using the developed SERS method were in the range of 73.69–98.07% with RSDs ranging from 1.25% to 6.85%. The results proved that the developed SERS method had good accuracy and consistency.

4. Conclusions

In this study, an easy, rapid, and quantitative SERS method for acetamiprid detection was developed using self-assembled Au NP array as enhancing substrate. The Au NP array was prepared through mixing an equal volume of chloroform and Au NP colloid in a hydrophilic glass vial. Under the optimized experimental conditions, SERS intensities at Raman shifts of 631 cm−1 and 1109 cm−1 displayed a good linear relationship with the logarithm concentration of acetamiprid in the range of 5.0 × 10⁻⁷ to 1.0 × 10⁻⁴ mol/L, with correlation coefficients of 0.97972 and 0.97552, respectively. The LODs for acetamiprid were as low as 1.19 × 10⁻⁷ mol/L and 2.95 × 10⁻⁷ mol/L at 631 cm−1 and 1109 cm−1, respectively. Furthermore, the method has the advantages of simple preparation process, good specificity, and short detection time (within 1 h). Furthermore, the developed SERS method was successfully applied in acetamiprid detection on the surfaces of apple and spinach. Therefore, this study developed a facile and rapid SERS method for acetamiprid detection and quantification, which had the potential to be applied for the rapid determination of acetamiprid and other organic pesticides in fruit and vegetables.

Supplementary Materials

The following are available online at https://www.mdpi.com/article/10.3390/chemosensors9110327/s1, Figure S1: UV-vis spectrum of Au NPs colloid (positive control), residual of Au NPs colloid after the formation of Au NPs array and water (negative control), Figure S2: SERS spectrum of acetamiprid at 1.0 × 10⁻⁵ mol/L, SERS spectrum of chloroform and Raman spectrum of acetamiprid powder, Figure S3: (A) SERS spectra of acetamiprid collected with fresh prepared Au NPs array and Au NPs array stored at room temperature for 3 days and 7 days. (B) Comparison of the intensities of characteristic SERS signals of acetamiprid at Raman shift of 631 cm−1 and 1109 cm−1, Figure S4 The loading plots for the first 3 components which were used in PCA, Figure S5: SERS spectra of acetamiprid determination in apple and spinach spiked with acetamiprid at the concentration of 1.0 × 10⁻⁵ mol/L and 1.0 × 10⁻⁶ mol/L.

Author Contributions

Conceptualization, G.L. and P.W.; Methodology, Y.S.; Validation, X.L. and L.W.; Writing—original draft preparation, Y.S.; Writing—review and editing, G.L. and P.W.; Supervision, M.L. All authors have read and agreed to the published version of the manuscript.

Funding

This work was supported by the National Natural Science Foundation of China (No. 32102063), the Science Foundation of Science & Technology Department of Shaanxi Province (No. 2020JQ-716), and the PhD start-up Capital of Shaanxi University of Science & Technology (No. 2017BJ-51).

Institutional Review Board Statement

Not applicable.

Informed Consent Statement

Not applicable.

Data Availability Statement

The data presented in this study are available in article or Supplementary Materials.

Conflicts of Interest

The authors declare no conflict of interest.

References

  1. Weerathunge, P.; Ramanathan, R.; Shukla, R.; Sharma, T.K.; Bansal, V. Aptamer-controlled reversible inhibition of gold nanozyme activity for pesticide sensing. Anal. Chem. 2014, 86, 11937–11941. [Google Scholar] [CrossRef] [PubMed]
  2. Wijaya, W.; Pang, S.; Labuza, T.P.; He, L. Rapid Detection of Acetamiprid in Foods using Surface-Enhanced Raman Spectroscopy (SERS). J. Food Sci. 2014, 79, 1–5. [Google Scholar] [CrossRef] [PubMed]
  3. Kubackova, J.; Fabriciova, G.; Miskovsky, P.; Jancura, D.; Sanchez-Cortes, S. Sensitive surface-enhanced Raman spectroscopy (SERS) detection of organochlorine pesticides by alkyl dithiol-functionalized metal nanoparticles-induced plasmonic hot spots. Anal. Chem. 2015, 87, 663–669. [Google Scholar] [CrossRef] [PubMed]
  4. Renaud, M.; Akeju, T.; Natal-da-Luz, T.; Leston, S.; Rosa, J.; Ramos, F.; Sousa, J.P.; Azevedo-Pereira, H.M.V.S. Effects of the neonicotinoids acetamiprid and thiacloprid in their commercial formulations on soil fauna. Chemosphere 2018, 194, 85–93. [Google Scholar] [CrossRef] [PubMed]
  5. Cooper, R.L.; Laws, Ã.S.C.; Das, P.C.; Narotsky, M.G.; Goldman, J.M.; Tyrey, E.L.; Stoker, T.E. Atrazine and Reproductive Function: Mode and Mechanism of Action Studies. Birth Defects Res. Part B Dev. Reprod. Toxicol. 2007, 112, 98–112. [Google Scholar] [CrossRef]
  6. Tchounwou, P.B.; Wilson, B.A.; Ishaque, A.B.; Schneider, J. Atrazine potentiation of arsenic trioxide-induced cytotoxicity and gene expression in human liver carcinoma cells (HepG 2). In Molecular Mechanisms of Metal Toxicity and Carcinogenesis; Springer: Boston, MA, USA, 2001; pp. 49–59. [Google Scholar]
  7. Sanyal, D.; Chakma, D.; Alam, S. Persistence of a neonicotinoid insecticide, acetamiprid on chili (Capsicum annum L.). Bull. Environ. Contam. Toxicol. 2008, 81, 365–368. [Google Scholar] [CrossRef]
  8. Pramanik, S.K.; Bhattacharyya, J.; Dutta, S.; Dey, P.K.; Bhattacharyya, A. Persistence of acetamiprid in/on mustard (Brassica juncea L.). Bull. Environ. Contam. Toxicol. 2006, 76, 356–360. [Google Scholar] [CrossRef]
  9. Li, H.; Hu, W.; Hassan, M.M.; Zhang, Z.; Chen, Q. A facile and sensitive SERS-based biosensor for colormetric detection of acetamiprid in green tea based on unmodified gold nanoparticles. J. Food Meas. Charact. 2019, 13, 259–268. [Google Scholar] [CrossRef]
  10. Kwon, H.; Anastassiades, M.; Dörk, D.; Hong, S.M.; Moon, B.C. Compensation for matrix effects in GC analysis of pesticides by using cucumber extract. Anal. Bioanal. Chem. 2018, 410, 5481–5489. [Google Scholar] [CrossRef]
  11. Hussain, M.; Aftab, K.; Iqbal, M.; Ali, S.; Rizwan, M.; Alkahtani, S.; Abdel-Daim, M.M. Determination of Pesticide Residue in Brinjal Sample Using HPTLC and Developing a Cost-Effective Method Alternative to HPLC. J. Chem. 2020, 2020. [Google Scholar] [CrossRef]
  12. Lee, H.S.; Kim, S.W.; Abd El-Aty, A.M.; Chung, H.S.; Kabir, M.H.; Rahman, M.M.; Jeong, J.H.; Chang, B.J.; Shin, H.C.; Shim, J.H. Liquid chromatography–tandem mass spectrometry quantification of acetamiprid and thiacloprid residues in butterbur grown under regulated conditions. J. Chromatogr. B Anal. Technol. Biomed. Life Sci. 2017, 1055–1056, 172–177. [Google Scholar] [CrossRef]
  13. Han, C.Q.; Yao, Y.; Wang, W.; Tao, L.Q.; Zhang, W.X.; Ingram, W.M.; Tian, K.-z.; Liu, Y.; Lu, A.-x.; Wu, Y.; et al. Highly sensitive Silver Nanorod Arrays for Rapid Surface Enhanced Raman Scattering Detection of Acetamiprid Pesticides. Chinese J. Chem. Phys. 2018, 31, 152–158. [Google Scholar] [CrossRef]
  14. Zheng, J.; Pang, S.; Labuza, T.P.; He, L. Evaluation of surface-enhanced Raman scattering detection using a handheld and a bench-top Raman spectrometer: A comparative study. Talanta 2014, 129, 79–85. [Google Scholar] [CrossRef] [PubMed]
  15. Litti, L.; Trivini, S.; Ferraro, D.; Reguera, J. 3D Printed Microfluidic Device for Magnetic Trapping and SERS Quantitative Evaluation of Environmental and Biomedical Analytes. ACS Appl. Mater. Interfaces 2021, 13, 34752–34761. [Google Scholar] [CrossRef]
  16. Zhang, K.; Wang, Y.; Wu, M.; Liu, Y.; Shi, D.; Liu, B. On-demand quantitative SERS bioassays facilitated by surface-tethered ratiometric probes. Chem. Sci. 2018, 9, 8089–8093. [Google Scholar] [CrossRef] [PubMed] [Green Version]
  17. Zheng, J.; Pang, S.; Labuza, T.P.; He, L. Semi-quantification of surface-enhanced Raman scattering using a handheld Raman spectrometer: A feasibility study. Analyst 2013, 138, 7075–7078. [Google Scholar] [CrossRef]
  18. Cao, X.; Hong, S.; Jiang, Z.; She, Y.; Wang, S.; Zhang, C.; Li, H.; Jin, F.; Jin, M.; Wang, J. SERS-active metal-organic frameworks with embedded gold nanoparticles. Analyst 2017, 142, 2640–2647. [Google Scholar] [CrossRef]
  19. Sun, Y.; Li, Z.; Huang, X.; Zhang, D.; Zou, X.; Shi, J.; Zhai, X.; Jiang, C.; Wei, X.; Liu, T. A nitrile-mediated aptasensor for optical anti-interference detection of acetamiprid in apple juice by surface-enhanced Raman scattering. Biosens. Bioelectron. 2019, 145, 111672. [Google Scholar] [CrossRef]
  20. Su, M.; Wang, C.; Wang, T.; Jiang, Y.; Xu, Y.; Liu, H.; Liu, H.; Liu, H. Breaking the Affinity Limit with Dual-Phase-Accessible Hotspot for Ultrahigh Raman Scattering of Nonadsorptive Molecules. Anal. Chem. 2020, 92, 6941–6948. [Google Scholar] [CrossRef]
  21. Yu, F.; Su, M.; Tian, L.; Wang, H.; Liu, H. Organic Solvent as Internal Standards for Quantitative and High-Throughput Liquid Interfacial SERS Analysis in Complex Media. Anal. Chem. 2018, 90, 5232–5238. [Google Scholar] [CrossRef]
  22. He, L.; Chen, T.; Labuza, T.P. Recovery and quantitative detection of thiabendazole on apples using a surface swab capture method followed by surface-enhanced Raman spectroscopy. Food Chem. 2014, 148, 42–46. [Google Scholar] [CrossRef]
  23. Wang, P.; Sun, Y.; Li, X.; Shan, J.; Xu, Y.; Li, G. One-step chemical reaction triggered surface enhanced Raman scattering signal conversion strategy for highly sensitive detection of nitrite. Vib. Spectrosc. 2021, 113, 103221. [Google Scholar] [CrossRef]
  24. Khlebtsov, N.G. Determination of size and concentration of gold nanoparticles from extinction spectra. Anal. Chem. 2008, 80, 6620–6625. [Google Scholar] [CrossRef] [PubMed]
  25. Xu, Y.; Konrad, M.P.; Lee, W.W.Y.; Ye, Z.; Bell, S.E.J. A Method for Promoting Assembly of Metallic and Nonmetallic Nanoparticles into Interfacial Monolayer Films. Nano Lett. 2016, 16, 5255–5260. [Google Scholar] [CrossRef] [PubMed] [Green Version]
  26. Liang, Y.; Hilal, N.; Langston, P.; Starov, V. Interaction forces between colloidal particles in liquid: Theory and experiment. Adv. Colloid Interface Sci. 2007, 134–135, 151–166. [Google Scholar] [CrossRef] [PubMed]
  27. Liu, J.W.; Zhang, S.Y.; Qi, H.; Wen, W.C.; Yu, S.H. A general strategy for self-assembly of nanosized building blocks on liquid/liquid interfaces. Small 2012, 8, 2412–2420. [Google Scholar] [CrossRef] [PubMed]
  28. Wang, K.; Sun, D.W.; Pu, H.; Wei, Q. Two-dimensional Au@Ag nanodot array for sensing dual-fungicides in fruit juices with surface-enhanced Raman spectroscopy technique. Food Chem. 2020, 310, 125923. [Google Scholar] [CrossRef]
  29. Wei, W.; Huang, Q. Preparation of cellophane-based substrate and its SERS performance on the detection of CV and acetamiprid. Spectrochim. Acta-Part A Mol. Biomol. Spectrosc. 2018, 193, 8–13. [Google Scholar] [CrossRef]
  30. Di Muccio, A.; Fidente, P.; Barbini, D.A.; Dommarco, R.; Seccia, S.; Morrica, P. Application of solid-phase extraction and liquid chromatography-mass spectrometry to the determination of neonicotinoid pesticide residues in fruit and vegetables. J. Chromatogr. A 2006, 1108, 1–6. [Google Scholar] [CrossRef]
  31. Jin, D.; Xu, Q.; Yu, L.; Mao, A.; Hu, X. A novel sensor for the detection of acetamiprid in vegetables based on its photocatalytic degradation compound. Food Chem. 2016, 194, 959–965. [Google Scholar] [CrossRef]
Figure 1. (A) UV-Vis absorption spectrum of the synthesized Au NP colloid. (B) Size distribution (main panel) and transmission electron microscope image of the synthesized Au NPs (insert panel).
Chemosensors 09 00327 g001
Scheme 1. The procedure of acetamiprid detection using SERS combined with a self-assembled Au NP array at the interface of water and chloroform.
Chemosensors 09 00327 sch001
Figure 2. Images of the mixture of thee Au NP colloid and different organic solvents before and after shaking (1: n-hexane, 2: cyclohexane, 3: chloroform).
Chemosensors 09 00327 g002
Figure 3. SERS spectra of acetamiprid at the concentration of 1.0 × 10⁵ mol/L and corresponding controls collected by (a) self-assembled Au NP array based, (b) liquid based, and (c) dried liquid droplet based SERS analysis.
Chemosensors 09 00327 g003
Figure 4. (A) SERS spectra of acetamiprid collected with the Au NP array generated by chloroform and Au NPs at volume ratios from 3:1 to 1:3; (B) SERS intensity of 631 cm−1 and 1109 cm−1 at different volume ratios; (C) SERS spectra of acetamiprid collected with an integration time of 1 s to 7 s; (D) SERS intensity of 631 cm−1 and 1109 cm−1 at different integration times.
Chemosensors 09 00327 g004
Figure 5. (A) SERS spectra of acetamiprid and other neonicotinoid pesticides with a similar structure (imidacloprid, thiamethoxam and clothianidin) at a concentration of 1. 0 × 10−5 mol/L; (B) PCA plot of SERS spectra of acetamiprid, imidacloprid, thiamethoxam clothianidin, and blank.
Chemosensors 09 00327 g005
Figure 6. (A) SERS spectra of acetamiprid with concentrations from 0 to 1.0 × 10⁻³ mol/L collected with the self-assembled Au NP array as the enhancing substrate; (B) Standard curves of the developed SERS method for acetamiprid quantification (5.0 × 10⁻⁷ mol/L to 1.0 × 10⁻⁴ mol/L) based on the intensities of the Raman shifts at 631 cm−1 and 1109 cm−1.
Chemosensors 09 00327 g006
Table 1. Comparison of different methods for acetamiprid detection.
Analytical MethodLiner RangeLODLOQR2References
LC-MS/MS1.802 × 10−8 to 1.802 × 10⁻⁶ mol/kg2.7 × 10−9 mol/kg8.98 × 10−9 mol/kg0.9998[12]
SPE/LC–MS2.2 × 10−7 to 2.2 × 10⁻⁶ mol/L9.0 × 10−8 mol/L--[30]
Colorimetry1 × 10−7 to 1 × 10⁻⁵ mol/L1.0 × 10−7 mol/L--[1]
Electrochemistry1.0 × 10−8 to 2.0 × 10⁻⁶ mol/L2.0 × 10−10 mol/L-0.998[31]
SERS4.5 × 10−6 to 4.5 × 10⁻⁴ mol/L4.5 × 10−6 mol/L--[29]
SERS5.0 × 10−7 to 1.0 × 10⁻⁴ mol/L1.19 × 10−7 mol/L2.63 × 10−7 mol/L0.97972This work
-: Not mentioned.
Table 2. Determination of acetamiprid in spiked spinach and apple using the developed SERS method.
SamplesSpiked
Concentration (mol/L)
Detected
Concentration (mol/L)
Recovery (%)
631 cm−11109 cm−1631 cm−11109 cm−1
Spinach-----
1.0 × 10−68.259 × 10−77.369 × 10−782.5973.69
1.0 × 10−58.759 × 10−69.755 × 10−687.5997.55
Apple-----
1.0 × 10−68.617 × 10−79.807 × 10−786.1798.07
1.0 × 10−59.701 × 10−69.706 × 10−697.0197.06
-: not detectable.
Publisher’s Note: MDPI stays neutral with regard to jurisdictional claims in published maps and institutional affiliations.

