Article

Reconfigurable Modular Platform for Prolonged Sensing of Toxic Gases in Particle Polluted Environments

1
Wireless Fluidics Inc., 2500 University Dr. N.W., Calgary, AB T2N 1N4, Canada
2
Center for Bioengineering Research and Education, BioMEMS and Bioinspired Microfluidic Laboratory, Department of Mechanical and Manufacturing Engineering, University of Calgary, Calgary, AB T2N 1N4, Canada
3
College of Engineering and Applied Sciences, American University of Kuwait, AUK, Salmiya P.O. Box 3323, Kuwait
4
Department of Chemical Engineering, School of Engineering Technology and Industrial Trades, College of the North Atlantic—Qatar, Arab League St., Doha 24449, Qatar
*
Author to whom correspondence should be addressed.
Chemosensors 2021, 9(11), 328; https://doi.org/10.3390/chemosensors9110328
Submission received: 5 October 2021 / Revised: 12 November 2021 / Accepted: 20 November 2021 / Published: 22 November 2021
(This article belongs to the Section Applied Chemical Sensors)

Abstract

:
The prolonged sensing of toxic gases in polluted particles and harsh environments is a challenging task that is also in high demand. In this work, the proof of principle of a sensitive, low-cost, and low-maintenance reconfigurable platform for filter-free and continuous ammonia (NH3) sensing in polluted environments is simulated. The platform can be modified for the detection of various toxic gases and includes three main modules: a microfluidic system for in-line continuous dust filtering; a toxic gas adsorption module; and a low-frequency microwave split-ring resonator (SRR). An inertia-based spiral microfluidic system has been designed and optimized through simulation for the in-line filtration of small particles from the intake air. Zeolite Y is selected as the adsorbent in the adsorption module. The adsorption module is a non-metallic thin tube that is filled with zeolite Y powder and precisely fixed at the drilled through-hole into the 3D microwave system. For the sensing module, a low-frequency three-dimensional (3D) split-ring resonator is proposed and optimally designed. A microwave resonator continuously monitors the permittivity of zeolite Y and can detect small permittivity alterations upon the presence of ammonia in the intake air. The microwave resonator is optimized at a frequency range of 2.5–3 GHz toward the detection of ammonia under different ammonia concentrations from 400 to 2800 ppm. The microwave simulation results show a clear contrast of around 4 MHz that shifts at 2.7 GHz for 400 ppm ammonia concentration. The results show the proof of principle of the proposed microfluidic-microwave platform for toxic gas detection.

1. Introduction

Gas detection has wide applications in environmental monitoring, security, industrial quality control, etc. Ammonia (NH3) is a major industrial chemical product in the world while classified as dangerous for the environment [1,2,3,4]. Exposure to high concentrations of ammonia could be lethal, while in low concentrations, it can cause coughing, nose, and throat irritation in the short term. Before designing a toxic gas sensor, several key aspects should be considered such as sensitivity, the minimum concentration of target gases they can detect, response speed, reversibility, energy consumption, and fabrication costs [3,5,6,7]. The ammonia concentration varies from one industry to another. The level of atmospheric ammonia at industrial parks can go as high as 150 ppb [8]. Per the US CDC (Centers for Disease Control and Prevention) guidelines, the recommended exposure limit (REL) specified by the National Institute for Occupational Safety and Health (NIOSH) is 25 ppm for an eight-hour total weight average (TWA). NIOSH specifies the immediately dangerous to life or health concentration (IDLH) at 500 ppm [9].
Continuous gas detection in the industrial environment has many technological challenges where the sensor is exposed to harsh conditions including solar radiation, temperature variations, humidity, and aerosols that may reduce sensor accuracy [5,10,11,12]. The presence of particle pollution (aerosol) has a high impact on the sensor performance deterioration especially for prolonged sensing operation, even in locations deemed to be convenient. The accumulation of particles and dust on the sensing module of different detectors such as optical detectors decreases its sensitivity and eventually results in sensor failure. Dust concentration and the exposure time are equally critical when dealing with prolonged sensing in particle polluted environment, and the challenges are more pronounced in an arid climate, which is categorized as a harsh environment with high dust concentration. As an example, the daily average of PM10 concentration (particulate matter that is 10 micrograms per cubic meter or less in diameter) in Kuwait during 2015 showed a high level of 2800 µg/m3 [11,12,13]. Even though the size of the dust aerosol particles varies from place to place, a detailed study by Al-Attar et al. showed that the particle pollution in Kuwait transported from the Arabian desert has a mean range of 3 to 6 µm [14]. Very few studies have explored technological solutions to minimize the undesirable effects of aerosol on gas sensors in the past few decades [10,15]. This paper addresses this gap by presenting a reconfigurable and modular platform for toxic gas detection that encompasses a microfluidic-filtration module.
Particulate filters are widely used to overcome particle pollution and to protect the sensor. However, higher energy is needed to draw air through the filter and the need for regular replacement of the filter. In addition, these filters could decrease the vapor concentration in the sampled air due to the adsorption of organic gas into the filter, resulting in low sensitivity and a long response time [10]. An alternative approach is to use a fluidic particle separator along the flow path. Such a separator is free from maintenance and could be designed as an add-on module. Passive inertia-based microfluidic particle separators are the focal point of many research groups for applications in biomedical and life science due to their low manufacturing cost, simplicity, ease of integration, and reliability [16,17].
With current advancements in microfabrication technologies, applications of microfluidics and microelectromechanical systems (MEMS) are rapidly expanding and gaining importance in sensing and biosensing applications. Microfluidic devices have a great potential for the detection of gas, liquid, and solid species and impurities [5]. The integration of microfluidic devices with other sensing technologies enables reliable and autonomous sensing platforms with high sensitivity, selectivity, and reproducibility [18,19,20]. Microwave resonator sensors offer attractive and non-contact solutions for the real-time monitoring of many events and properties in pipes and tubes where the need for the bulky detection systems and external characterization tools is eliminated [21,22]. Their working principle is based on the interaction between resonator electric fields and material properties in the sensor near surroundings. Materials’ dielectric properties such as permittivity and conductivity affect the electric field and consequently alter the resonant frequency and amplitude of the resonator. These changes could be used as a signature to detect materials [18,22]. Recently, microwave planar resonators have shown promising results for sensing applications due to their simplified manufacturing process and ease of integration with other technologies [18,22]. Compared to 3D resonators, although planar microwave resonators offer many advantages for sensing applications, they still suffer from low selectivity and sensitivity. There have been challenges for fabrication processes for making three-dimensional (3D) split-ring resonators (SRRs). With the development of 3D metal-printing techniques, manufacturing rectangular waveguide corners with higher accuracy is easier than machining [23,24]. The coupling of microfluidics with microwave sensing creates new opportunities for real-time detection and the characterization of single particles or cells [18].
Selective porous nanomaterials can provide effective and reversible gas adsorption for selective sensing and protect the surface of the sensing site against harsh environment and contaminated particles [25,26]. The incorporation of these nanomaterials with microwave sensing enables the real-time detection of specific gases. For such an integration, microwave resonators should be isolated from the sensing materials via an interface such as thin quartz or a borosilicate glass layer to enhance the detection sensitivity while protecting the electrodes from a direct contact with the contaminated medium. Microwave sensors enable real-time calibration (within a few seconds) that considerably improves the accuracy and repeatability of sensing and therefore improves quantitative gas toxic content analysis [27,28].
Zarifi et al. [22] applied zeolite 13x combined with a planar microwave resonator sensor to investigate the real-time detection of CO2 and CH4. The sensing was performed by monitoring the zeolite 13x permittivity change due to the adsorption of the gases. Li et al. [4] have extensively investigated the effect of ammonia adsorption on the permittivity of zeolite Y in the millimeter-wave region of 60–90 GHz. Their experimental data have been used in the current work to simulate the performance of the proposed 3D split resonator. An extrapolation approach employed to find the corresponding permittivity values for the radio frequency (centimeter-wave wavelength) range.
In this work, we have proposed and successfully showed the proof of principle of a sensor for the continuous measurement of toxic gas in a harsh environment with particle pollution through a simulation approach. The presented platform has a microfluidic module for the filtration of intake gas, an adsorption module, and a low-frequency 3D microwave resonator for the detection of adsorbed toxic gas.

2. Materials and Methods

The schematic of the proposed sensing platform for toxic gas detection is shown in Figure 1. The system encompasses three main modules including: (1) inertia-based spiral microfluidics for continuous gas filtration; (2) an adsorption module that selectively adsorbs the specific gas of interest; and (3) a microwave-split-ring resonator sensor that monitors the adsorption module. The platform has a modular design; hence, each sub-system can be designed and optimized separately. The adsorption module consists of a non-metallic tube filled with proper adsorbent. For NH3 detection, zeolite Y powder is selected as an adsorbent with high reversibility of the adsorption process through heat. A microwave resonator performs non-contact sensing of the adsorbent, and the type of the adsorbent defines the type of toxic gas that the system can detect. Such a reconfigurable design brings a broad range of toxic gas detection applications through minor modifications of one or a few components. As an example, by changing the adsorbent nanomaterial, the same platform can be used for the sensing of various gases.
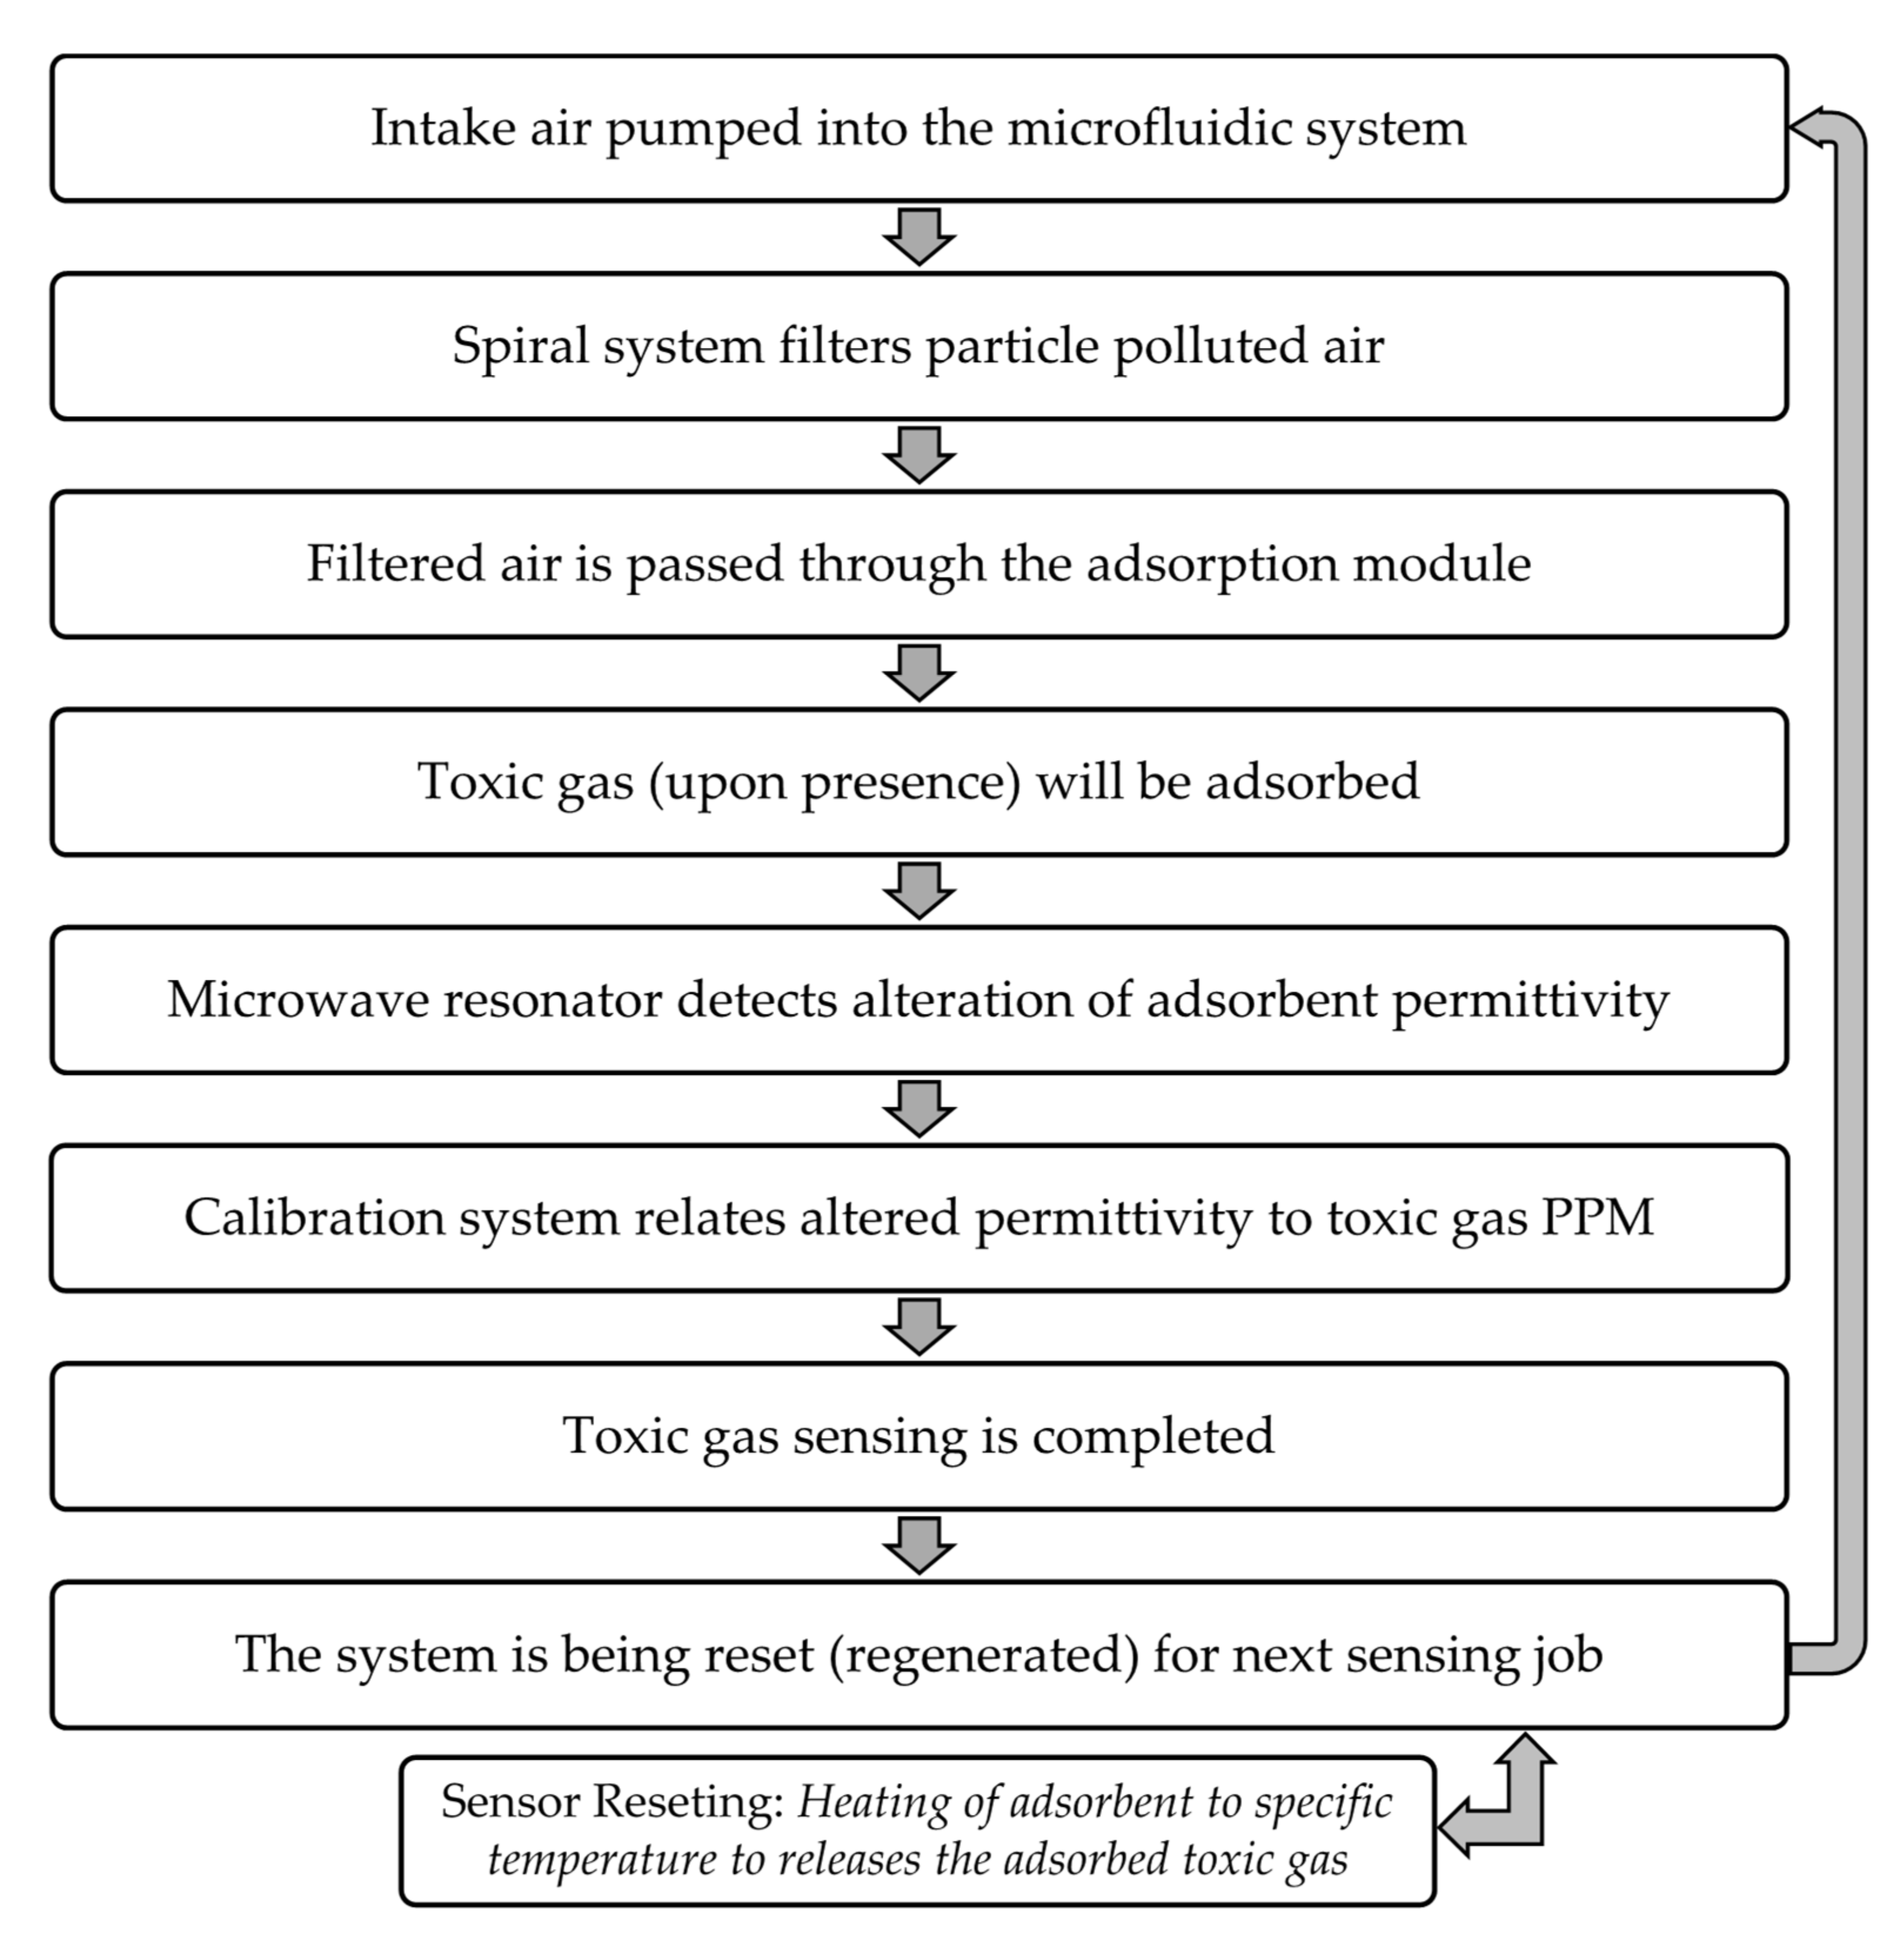
The operation workflow of the sensor starts with pumping the air into the spiral fluidic system to perform filtration. Then, the filtered air passes through the adsorption module where ammonia, upon presence, will be adsorbed by zeolite Y, which alters its permittivity. The change in the permittivity will be detected by a passive 3D microwave resonator. The flow chart in Figure 2 shows the steps during the sensing and regeneration of the sensor.

2.1. Spiral Microfluidics for In-Line Filtration

A passive spiral microfluidic system has been designed and optimized for the separation of small particles from the intake air through a simulation approach. Particle pollutions are generally in the form of suspended round particles with the average size of 6 µm [14]. The selection of method of separation (active or passive) and type of microfluidic system has a big impact on the separation performance. However, it should be noted that in particle polluted environments, during specific periods of the year, the number and size of aerosols increases drastically, and having complex geometry along the flow pass could result in channel blockage. The difference between the density of suspended aerosols and air is noticeable. Such a big difference makes the inertia-based spiral microfluidic separator a practical candidate for particle filtration. Based on these facts and considering the simplicity and manufacturability of the fluidic passage, a spiral microfluidic system seems to be an effective approach. However, the spiral microfluidic system needs to be properly designed and optimized for a specific particle range in order achieve high particle separation performance.
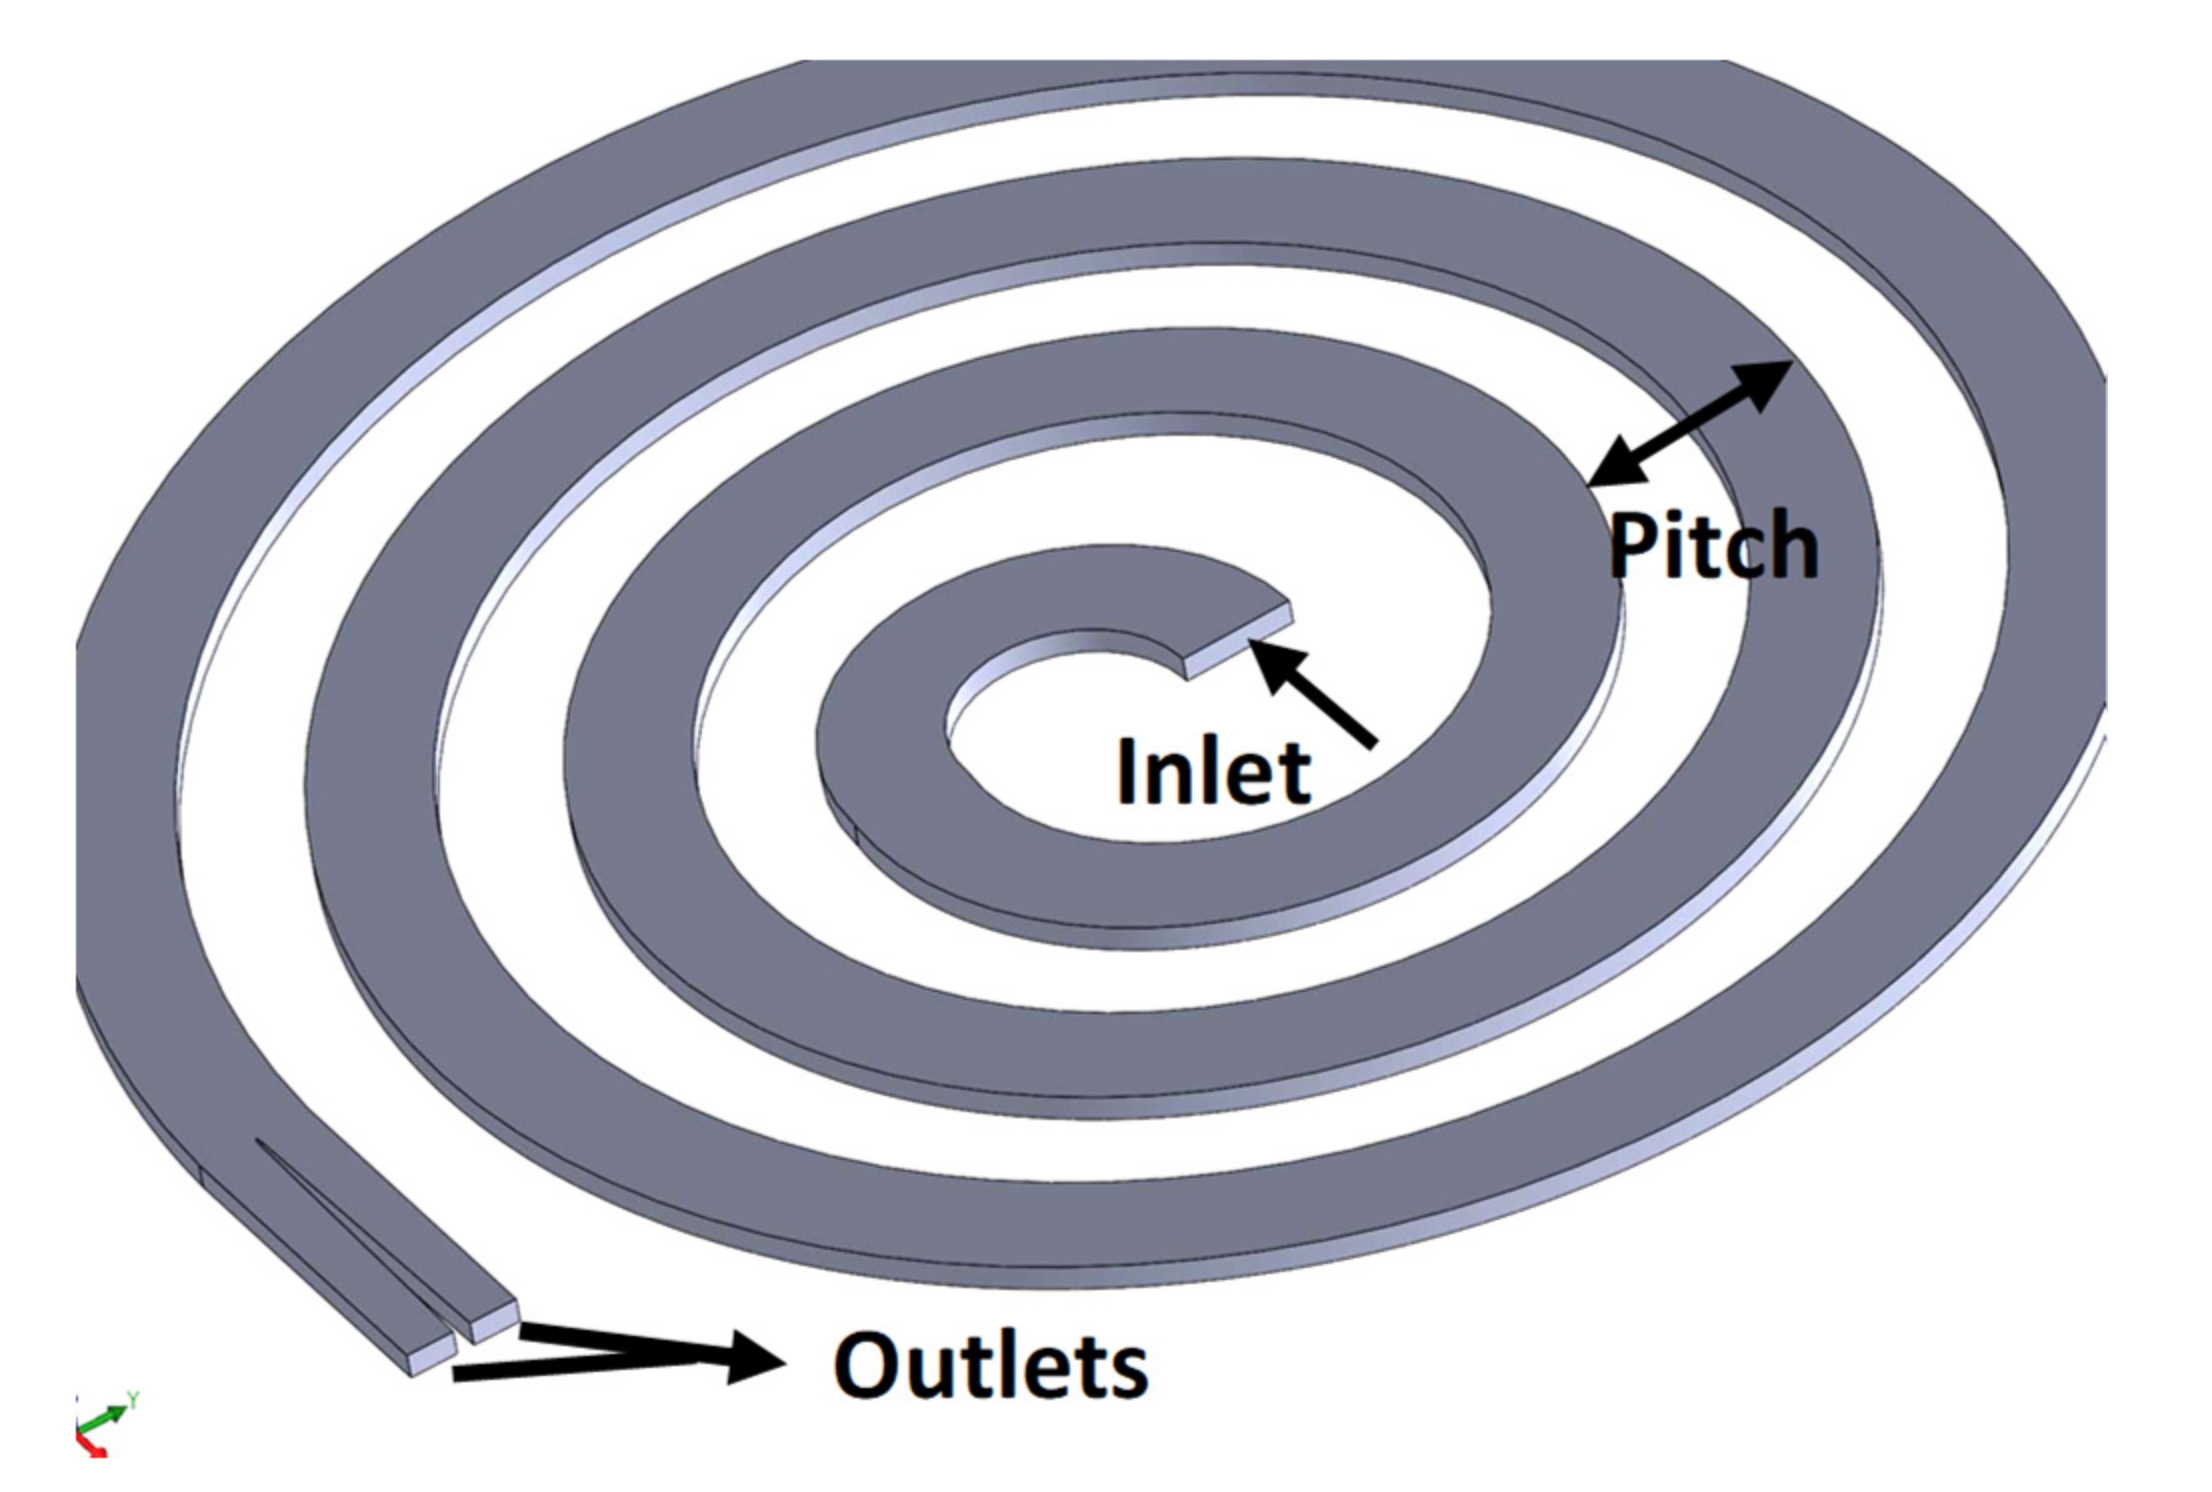
Time-dependent computational fluid dynamics (CFD) were used to model the flow into the microfluidic system. The full Navier–Stokes equations were solved with the commercially available software package, ANSYS Fluent (ANSYS, Canonsburg, PA, USA). For the modeling of suspended particle pollutions in the air, discrete phase modeling (DPM) of particles was used in a fully coupled condition to ensure that the interactions between the flow and particles were considered. DPM consists of spherical particles uniformly dispersed in the continuous phase [29]. For optimization of the spiral fluidics, multiple designs with various parameters have been modeled. The parameters that have been selected for optimization include the channel cross-section (channel width and channel height) and the spiral pitch, which defines the channel curvature. For the optimization process, the number of revolutions and the inlet/outlet flowrates were fixed. Even though the number of revolutions has an impact on the separation efficiency, it affects the total footprint of the chip, and therefore, it has been assumed to be constant based on the presumed chip dimensions. Figure 3 shows the schematic of the microfluidic system and the location of the inlet and outlet.
Various combinations of parameters created five different designs that are summarized in Table 1. The separation of particles in the fluidic system was simulated, and the performance of particle separation was compared. For finding the separation performance, the number of particles that are exiting from each outlet was counted. The ratio of the number of particles exiting from the lower outlet and all the particles injected from the inlet for the duration of 60 s is calculated as separation efficiency. As an example, when all the injected particles are escaping from the lower outlet, the performance is assumed to be 100%. Table 2 outlines typical atmospheric air properties that have been used in the simulation step [13,30].

2.2. Ammonia Adsorption

The selection of adsorbent depends on the toxic gas, the type of technology applied, the range of sensitivity, and the working condition specifications. Among various sensing adsorbents and platforms, zeolites and silica gels are well-known for their wide applications in sensor devices, since they are porous aluminosilicate materials that offer a high thermal and chemical stability, high surface area, and active sites [22].
To the best of authors’ knowledge, only a few research studies have been conducted to investigate the performance of microwave ammonia sensors. Among those few reported studies, the recent publication of Li et al. includes some valuable results on the permittivity change of zeolite Y in the presence of various ammonia concentrations [4]. They have empirically obtained the absolute permittivity of zeolite Y with different concentrations from 400 to 2800 ppm at a high-frequency range of 60 to 90 GHz. It should be noted that a high-frequency microwave resonator requires a high-end and expensive measuring instrument to perform characterization [5]. For our application, we have designed a microwave with resonance frequency around 3 GHz. Lowering the frequency significantly reduces the instrumentation cost. Due to the lack of published zeolite Y relative permittivity for adsorbed ammonia at 3 GHz, we have adapted published experimental data for our frequency range using a mathematical approach. The procedure including multiple curve fitting and extrapolation is explained in Appendix A.
The adsorption module in this study is a circular tube with the length of 15 cm and diameter of 1 mm that is filled with a zeolite Y powder. The NH3 adsorption is an irreversible phenomenon. If zeolite Y ceramic is heated with air to 200 °C, it will release the adsorbed ammonia and recover its permittivity. More details on how NH3 adsorption changes zeolite Y permittivity can found here [4].

2.3. D Microwave Sensing

2.3.1. Design of Microwave Resonator

Microwave sensing has become a very attractive method of detection as it offers the luxury of touchless sensing, which can be a huge added value to any transducer. Although planar microwave resonators offer many advantages for sensing applications, they still suffer from low selectivity and sensitivity. A three-dimensional microwave resonance sensor is proposed that operates between 2.5 and 3 GHz. The original design for the device was to work at the standard Industrial Scientific Medical (ISM) band of 2.45 GHz with a bandwidth of 100 MHz. This design does offer an acceptable sensing performance at this range; however, extending the bandwidth for the operation between 2.5 and 3 GHz will expand the range of the sensor to detect more different types of substances. A great advantage of this device when it comes to characterization in terms of the measurement capabilities is the reproducibility of the results, which makes it a great tool for ammonia detection when it is employed in combination with the microfluidics technology.
As the microfluidics structure proposed here would offer a longitudinal snapshot of the adsorbed gas for a short yet capturable time interval, a proper microwave sensing mechanism would give us the opportunity of detecting the identity and the properties of the gas in real time, which enables us to get notified as soon as a toxic gas enters the system.
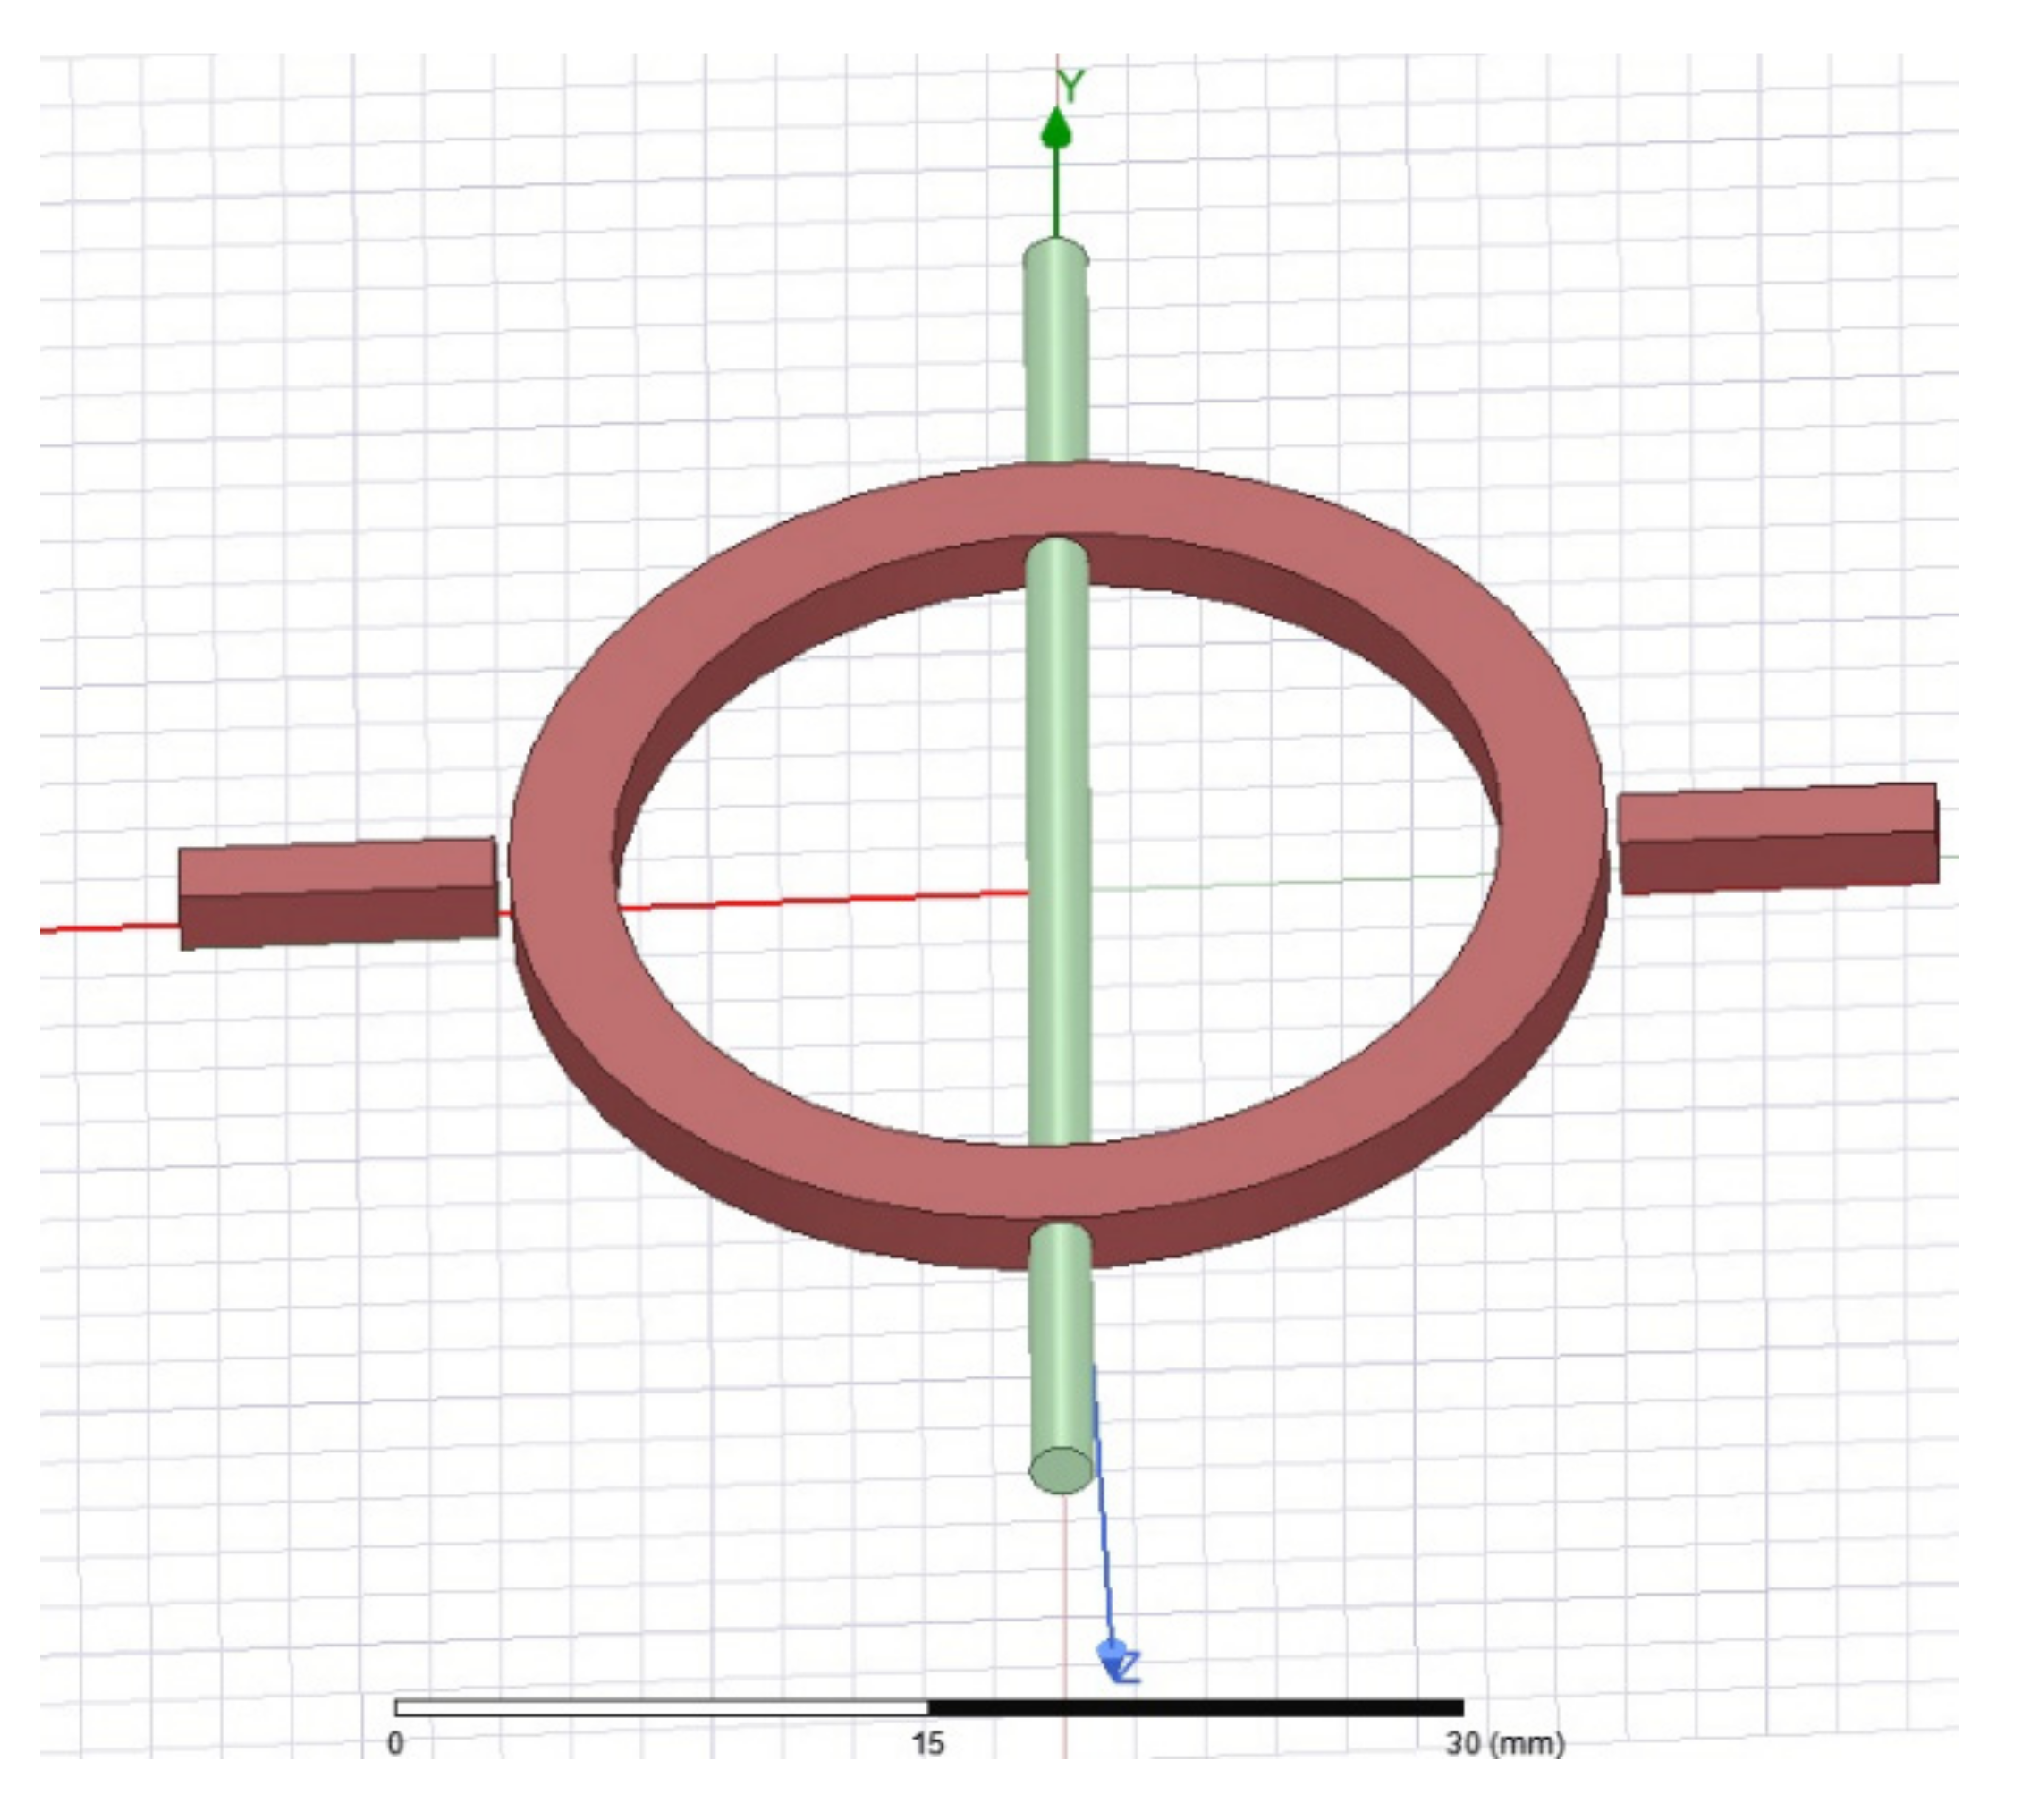
As it is shown in Figure 4, the resonator allows the microfluidics channel to pass through the metallic body of the sensor via the calibrated orifice drilled in the circular part of the body, and it is extended throughout the full diameter of the mentioned circle and passes through a second identical orifice and then leaves the senor structure. Having this full diameter of the microfluidics channels containing the adsorbent material gives a great opportunity to the microwave resonator to monitor the changes in the dielectric properties of the adsorbent. Those changes in the dielectric properties of the adsorbent are the results of the alteration of the exposure to the gases that are passing through the microwave fluidics channel. As the resonator is a two-port network in which the ports are placed at the two ends of the structure, reading the reflection coefficient and the transmission coefficient will be our indexes to benchmark the type of the detected gas. As the focus of the work is on the detection of the toxic gas withing the flow, ammonia was chosen to be the reference gas, and its contraction with the zeolite Y adsorbent at different concentrations is studied thoroughly within the project.

2.3.2. Simulation

The microwave resonator was simulated with the commercial high-frequency simulation software from ANSYS Electronic Suite, HFSS. The overall geometry of the design is depicted in Figure 4. Unlike most of the previously reported resonators in the literature, the proposed design is not a planar structure, and it is designed in a way that the microfluidics channels pass through a hole that is drilled in the body of the main circular copper element of the resonator. The resonator also includes two rectangular copper poles that are being connected to the probes of the vector network analyzer (VNA). The resonator has been optimized to show a contrast in resonance between 2.5 and 3 GHz in order to make the fabrication more practical, as the vector network analyzers operating within 0–3 GHz are more affordable and more convenient to find and operate.
The finite element simulation of this structure is focusing on studying the effect of the changes in the permittivity of the adsorbent on the reflection coefficient or return loss (S11) and the transmission coefficient (S12) of the setup. The initial simulation contained a parametric study to find the optimum geometry to offer the most responsive outcome. The second phase, which will be reported in the result section, was focusing on the expected readings of the S11 and S12 and correlating them to the concentration of the toxic gas that is present in the channel. As the reading is real time in this sensor, not only do we have to be mindful about the static characteristics of the device and make sure that we have taken the possible static errors into consideration, but also, we should take the dynamic characteristics into consideration as well. More particularly, the fidelity of the measurement is very crucial, as the speed of response in the correct estimation of the presence of the pollutants gives the time-sensitive feedback to the microfluidics system to filter them out in case the toxicity exceeds the pre-determined threshold.
Although the simulations conducted in this section are not time domain simulations and are all frequency domain, the fine precision in the detection of the concentration that is targeted in the simulation guarantees the real-time response of the sensor to the presence of the toxic gas and its level withing the substance. The adaptive mesh that is employed in this finite element simulation will guarantee the accuracy of the results, as the simulated domain will be discretized into small enough elements to make sure that the error in the solution of the boundary value problem is less than the given acceptable values. The detailed results of the simulation with the accurate illustration of the resonance frequencies are discussed in the results section in order to calibrate the vector network analyzer-based sensor.

3. Results and Discussions

3.1. Particle Separation in Microfluidics

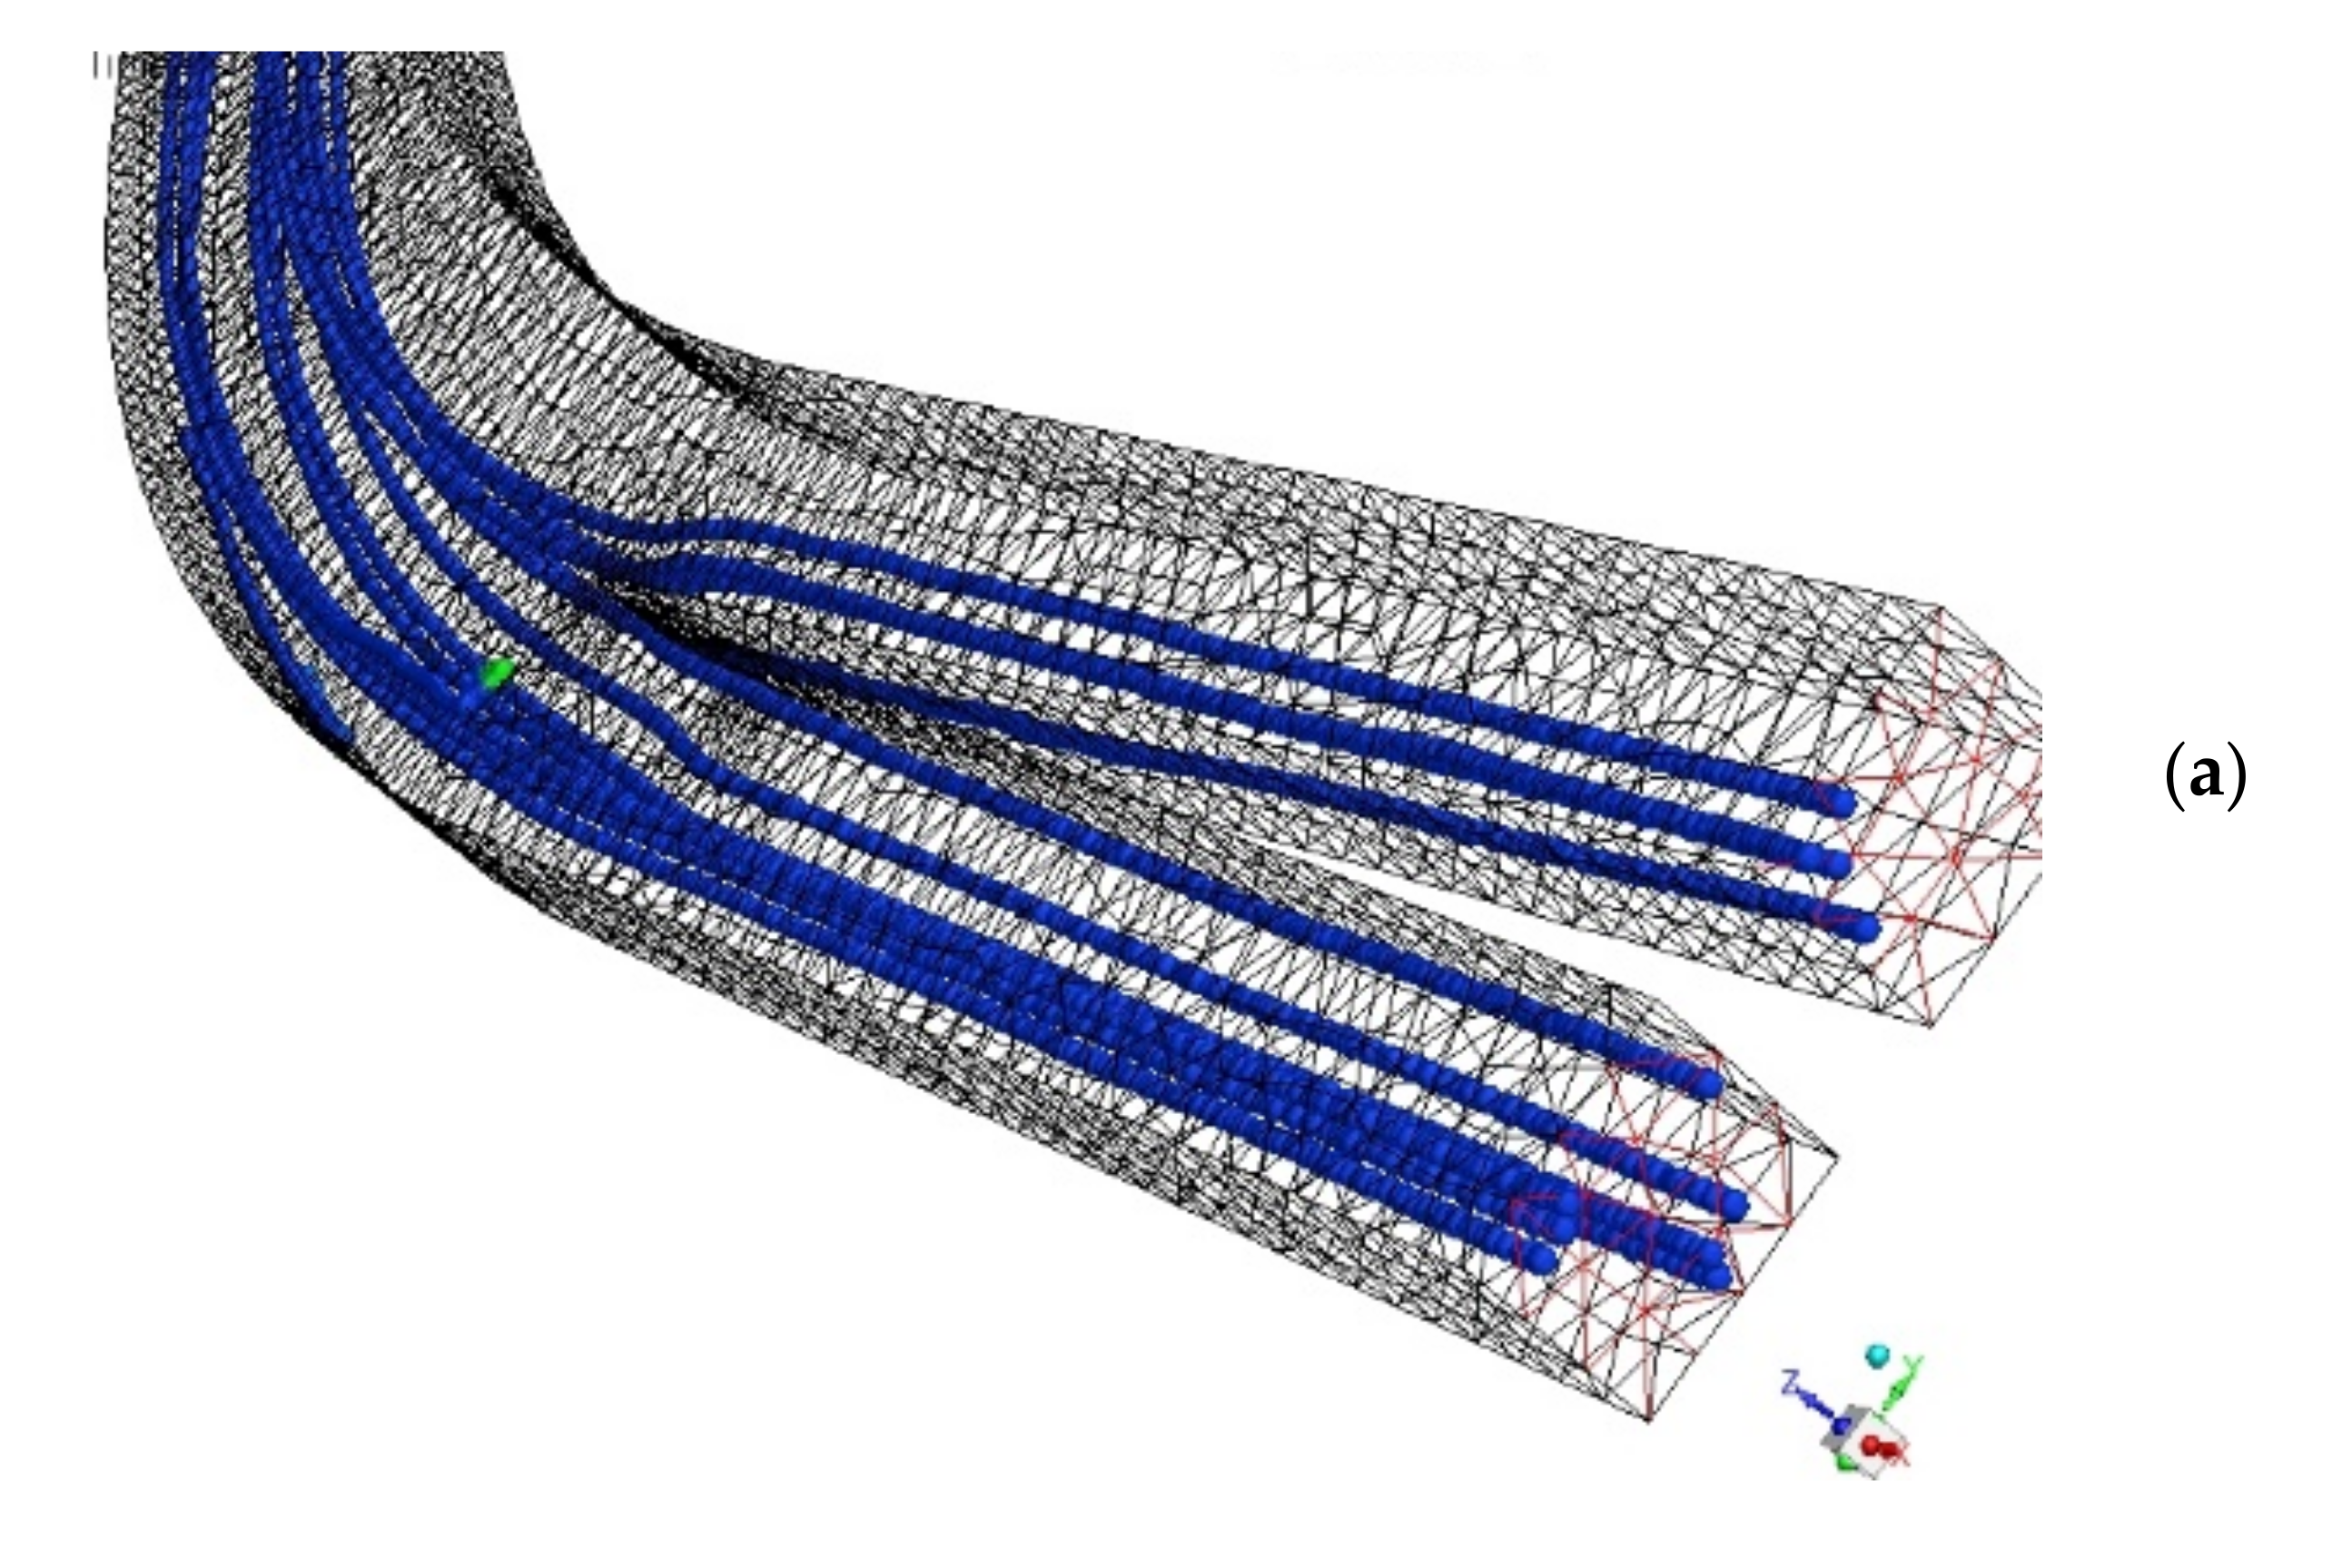
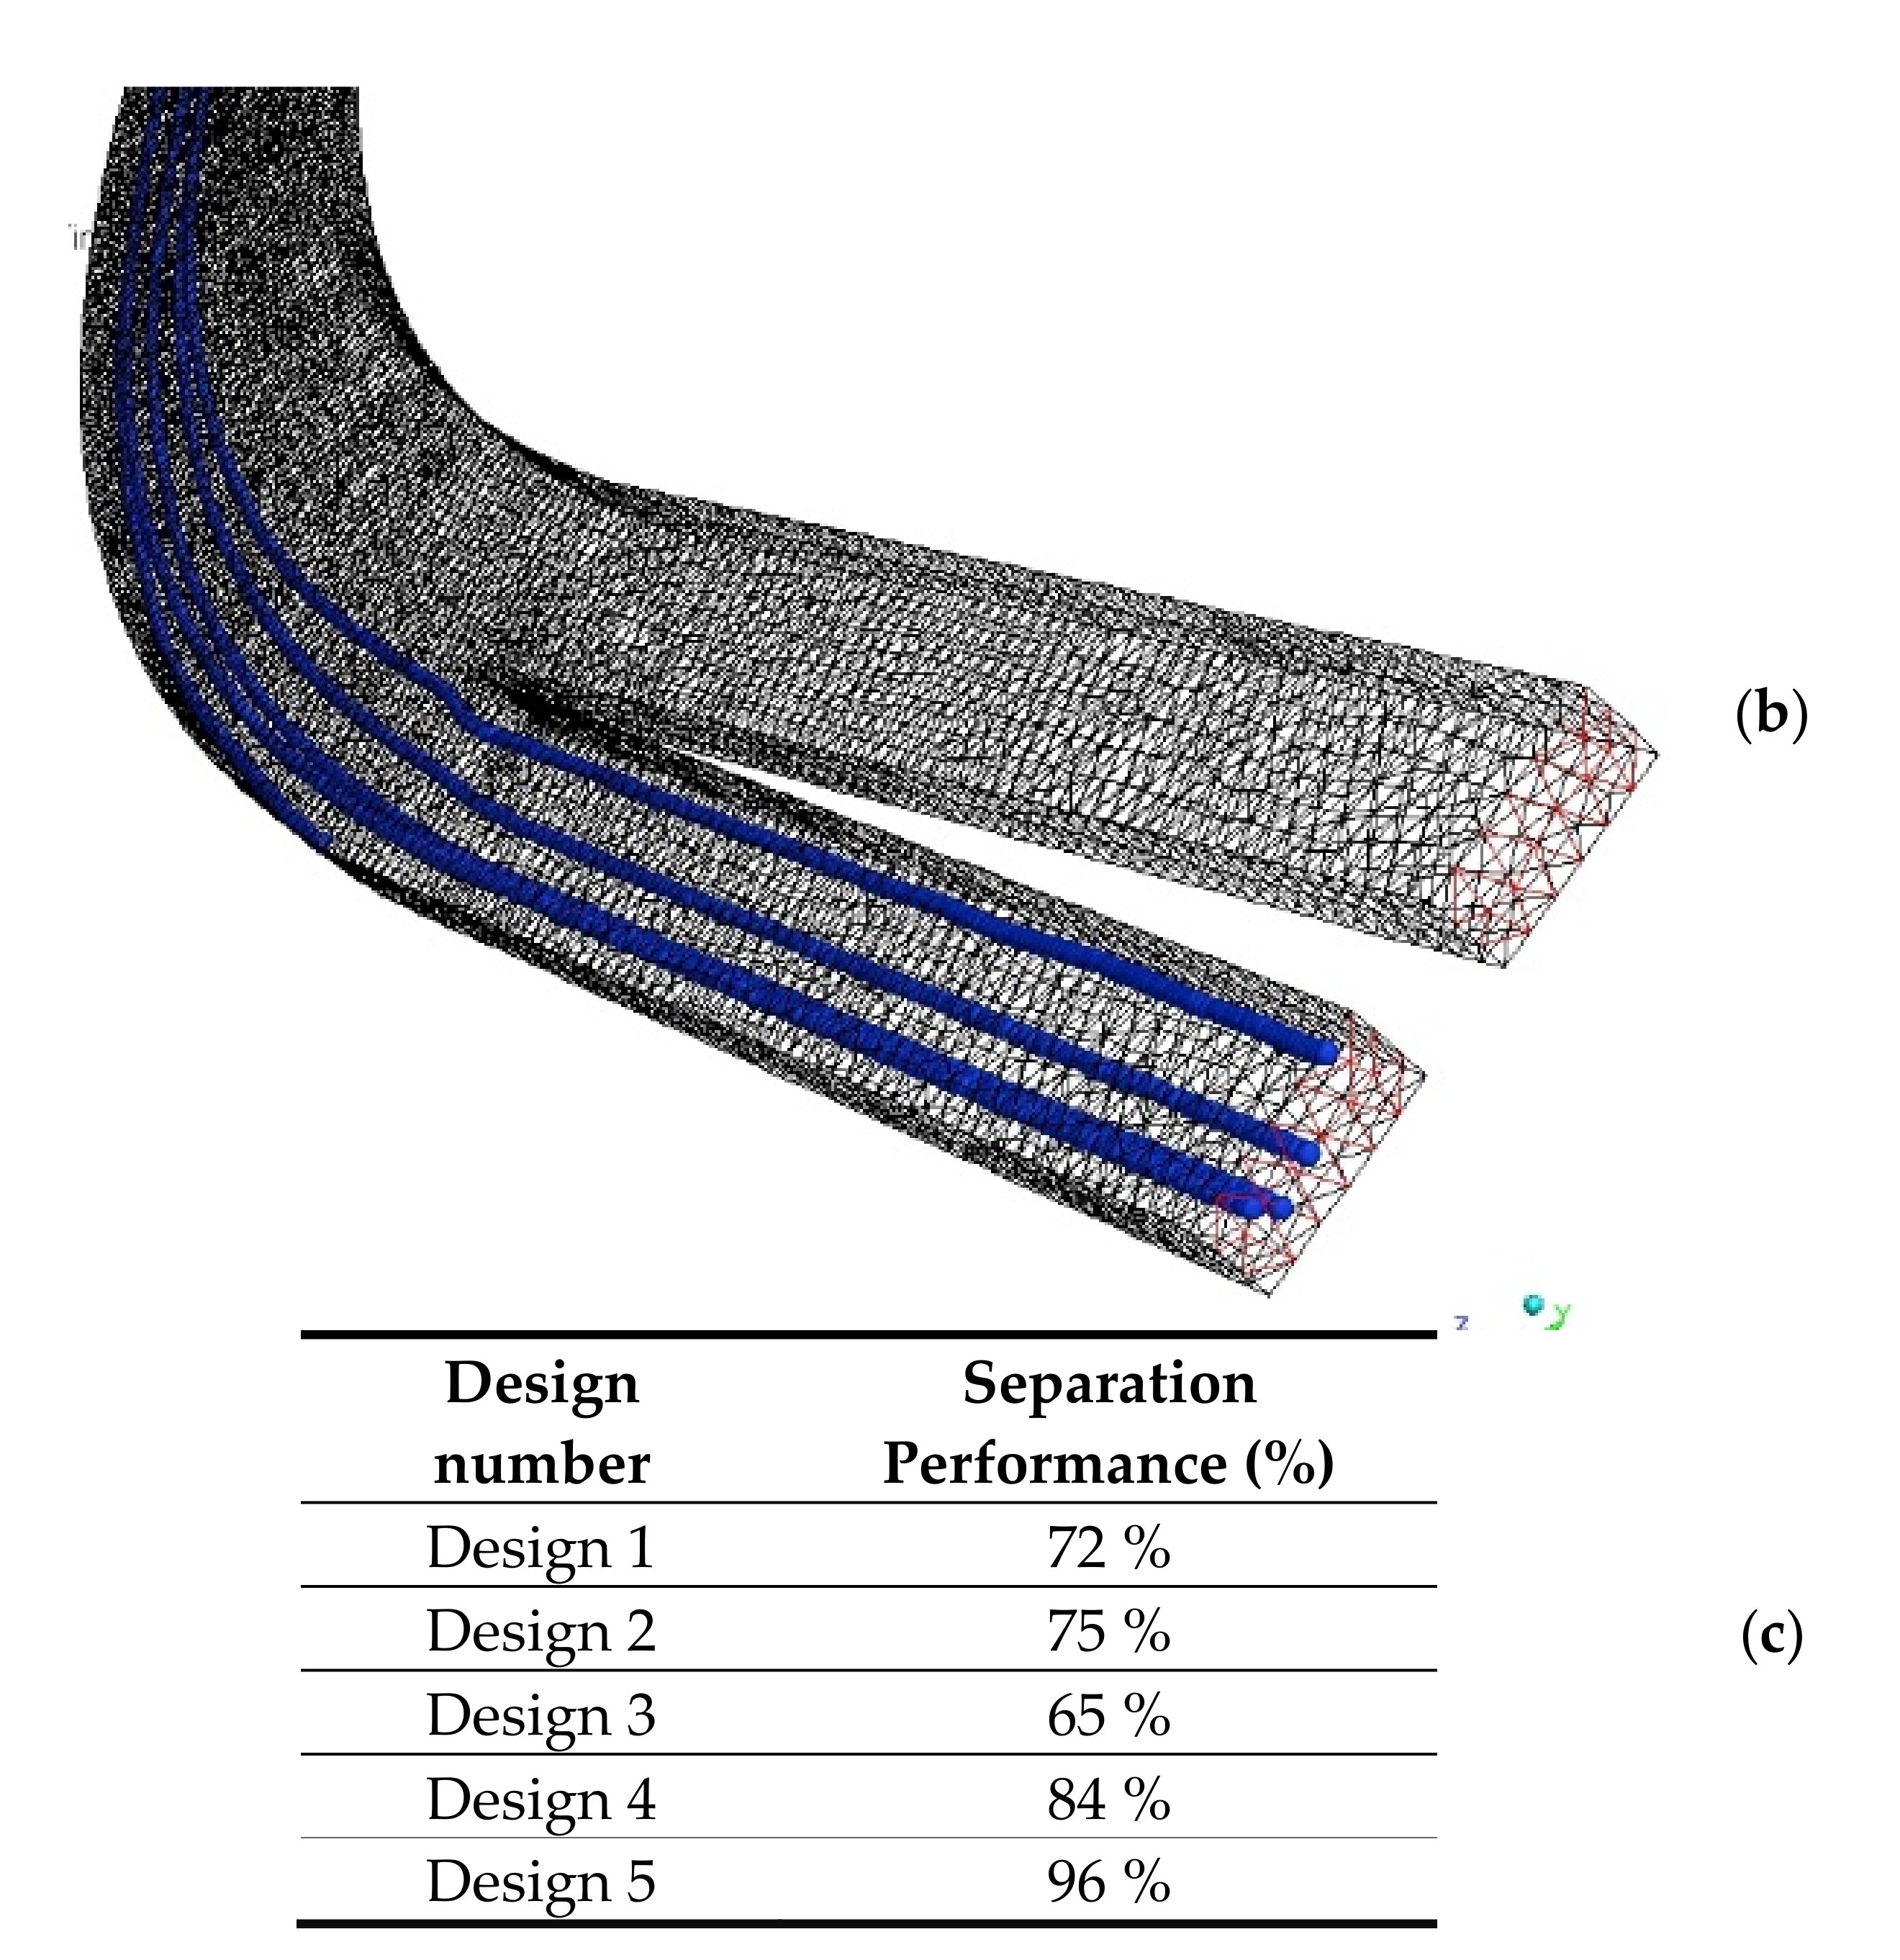
The Ansys Fluent package was used for the particle-flow interaction simulation of the proposed inertia-based particle separator using a discrete phase modeling (DPM) approach. The microfluidic system should be optimized for a specific particle size range and intake air flow rate. All the configurations listed in Table 1 are being simulated to select the highest performing particle separation embodiment. The simulation results for designs 1 and 5 are presented in Figure 5a,b. The separation performance results also summarized in Figure 5c show that by using design 5, about 96% of the particle streams are being separated in the outlet.
The simulation results show that the separation performance is more sensitive to the channel cross-section aspect ratio (width to height) than the spiral pitch (or channel curvature). For the construction of the design configuration in Table 1, the manufacturability assumption was a main factor, and the upper and lower limits were set based on available spaces and the presumed microfluidic chip footprint.
From Figure 5b, the efficiency of design 5 appears to be 100%. However, in DPM simulation, when a particle is located very close to the walls, the simulated particle velocity drastically reduces due to the negligible shear force, and particles seem to be sticking to the walls. As a result, the calculated efficiency is not 100% as it seems. The authors believe this design will be very efficient in practical applications.

3.2. Effect of Ammonia on Permittivity of Adsorbent

Based on the data reported by Li et al. [4], the dielectric response of the adsorption module increases with NH3 concentration. The permittivity of zeolite Y drops up to 20% by adsorbing about 0.28% of NH3 with an average change of 0.022/100 ppm in NH3 concentrations below 2800 ppm. Although their empirical results indicate that the dielectric properties of zeolite Y make it one of the best available candidates as an adsorption agent for NH3 sensors, however, the gas diffusion of intra-zeolite is still a limiting step with a diffusion coefficient below 5×10⁻³ s−1. Therefore, there is a need for further studies to design a more efficient propagative structure of the adsorption module for developing NH3 sensors in the future.
The relative permittivity of zeolite Y for different NH3 concentrations is publicly available at a frequency range of 60 to 90 GHz. To calculate the corresponding values at 3 GHz, we have used a method to extrapolate the published data. This method is explained in detail in Appendix A. The permittivity values that are used for microwave simulation are summarized in Table 3.

3.3. Microwave Simulation

Microwave simulation was conducted with the high-frequency simulation software (HFSS) by ANSYS employing the finite element method featuring the adaptive meshing. The frequency domain simulation of the microwave resonator is being done at different relative permittivity, K’.
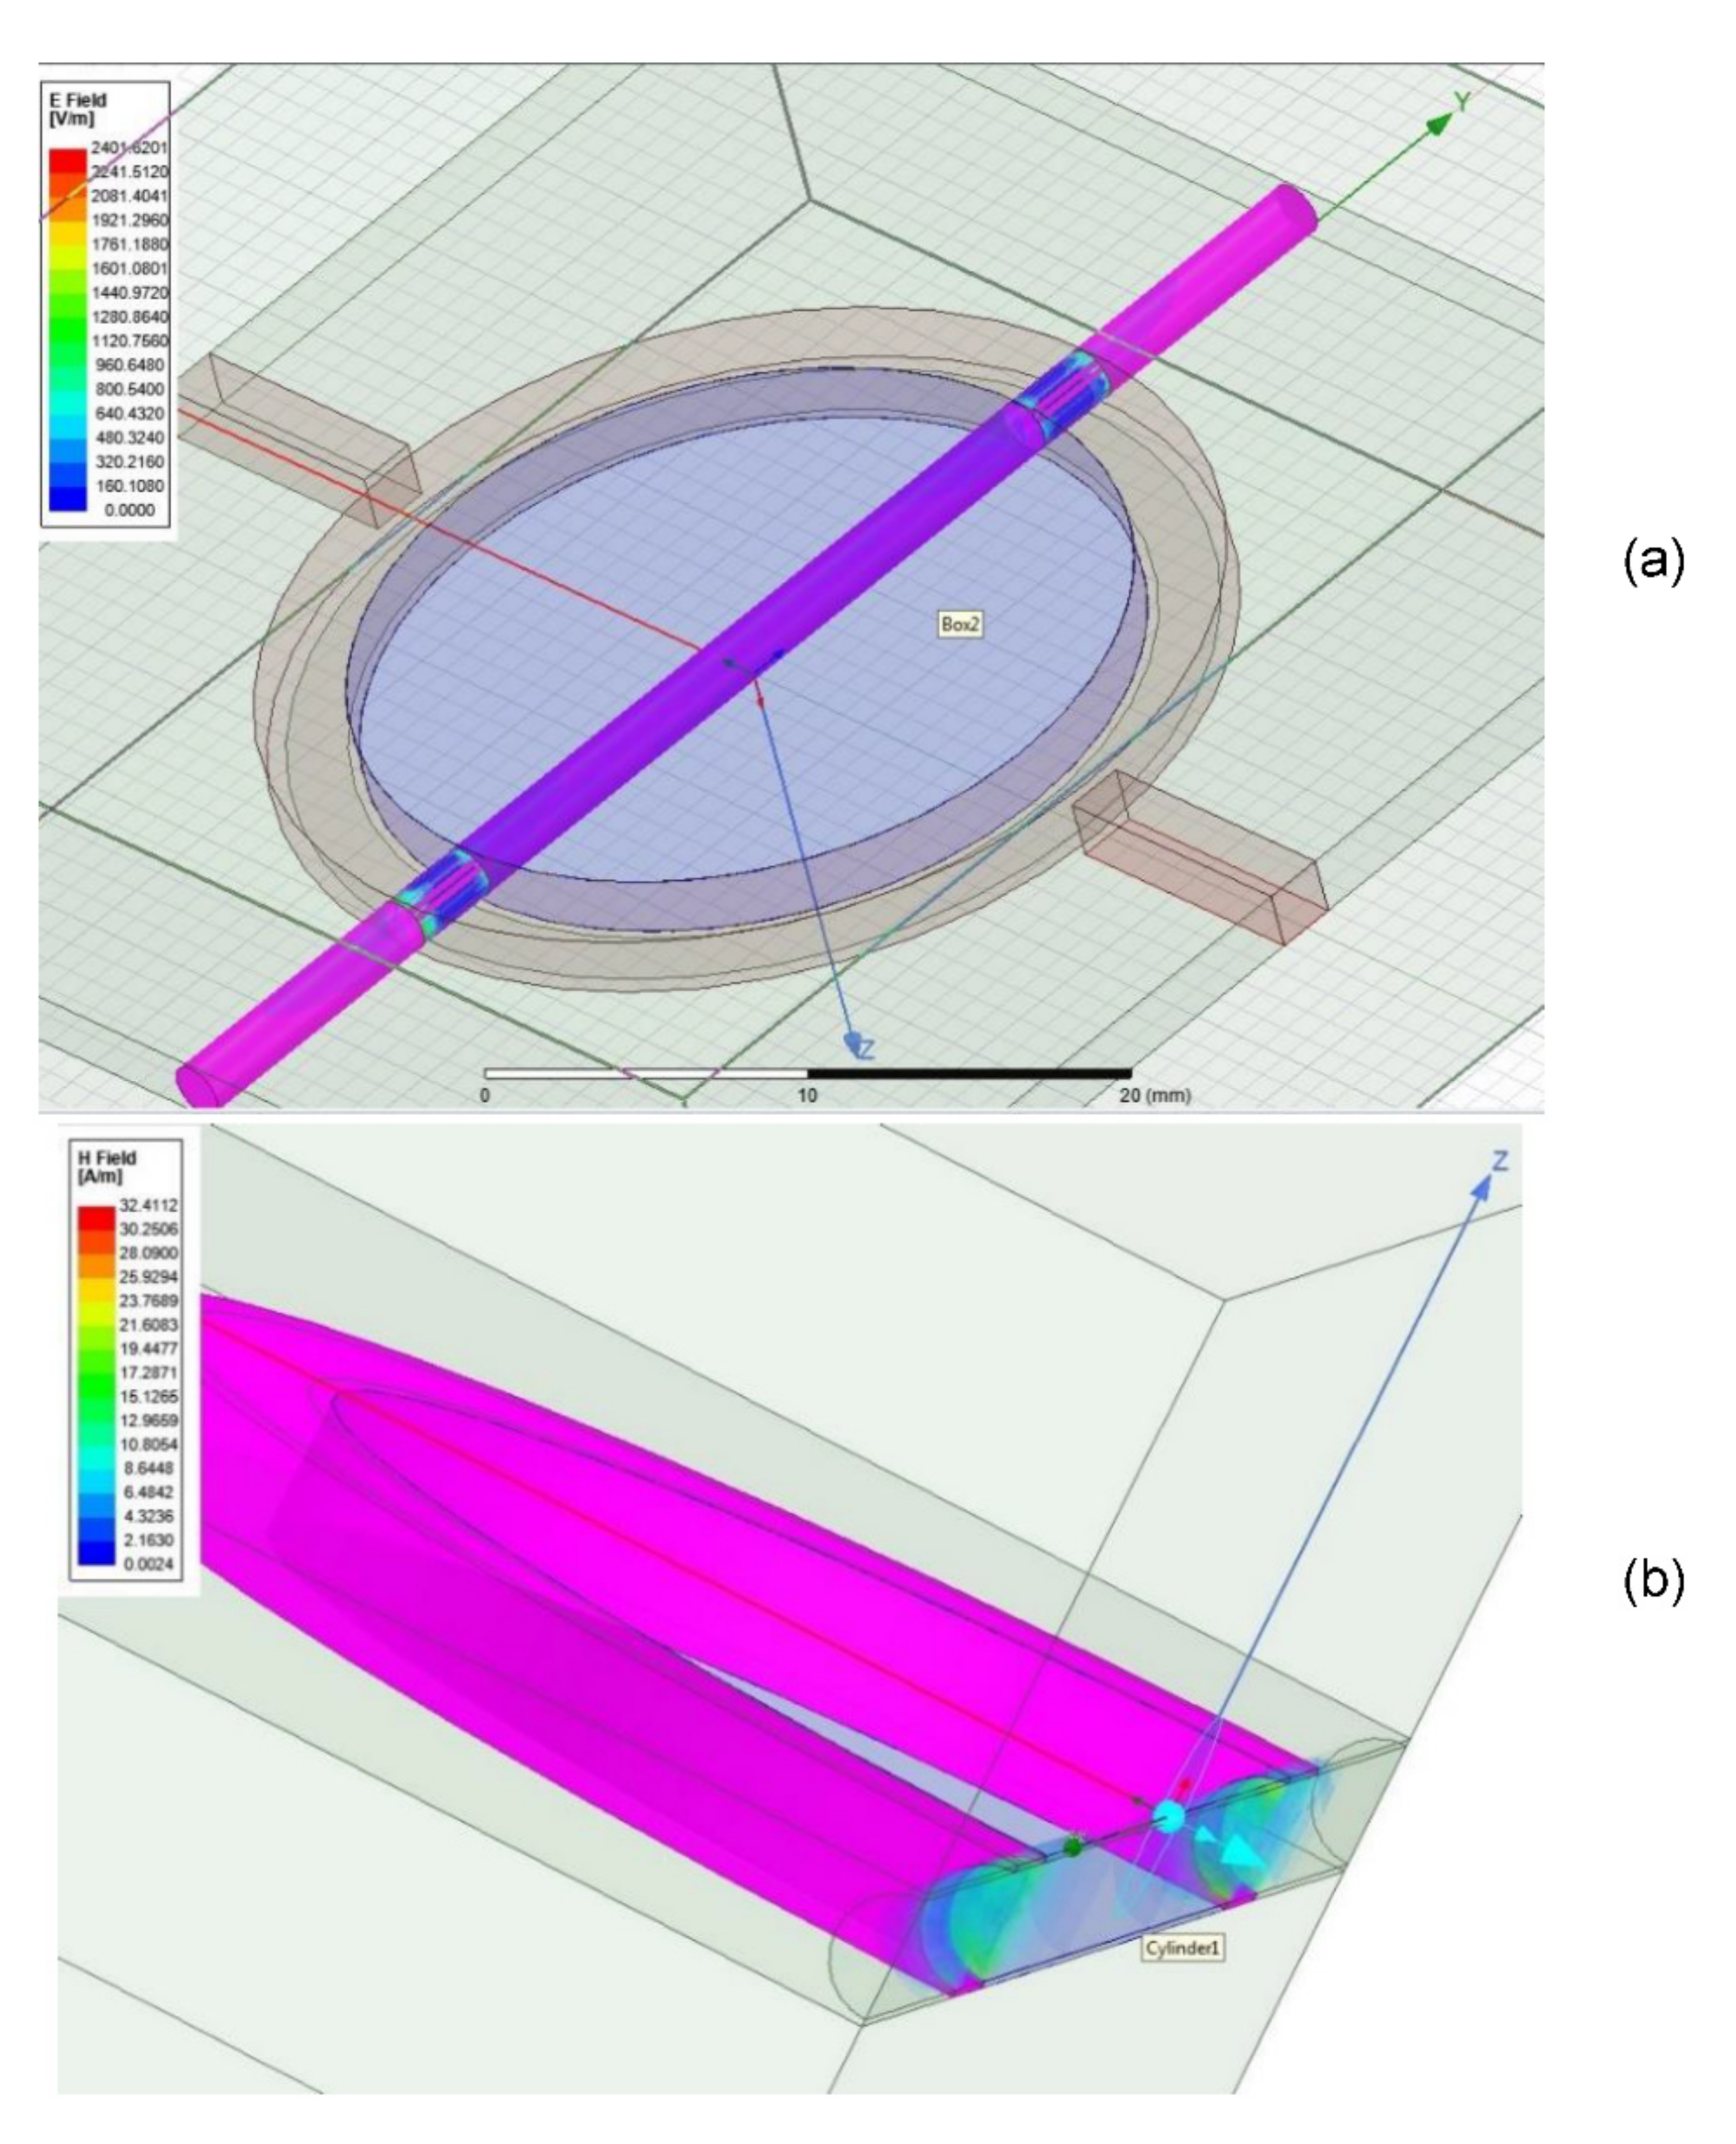
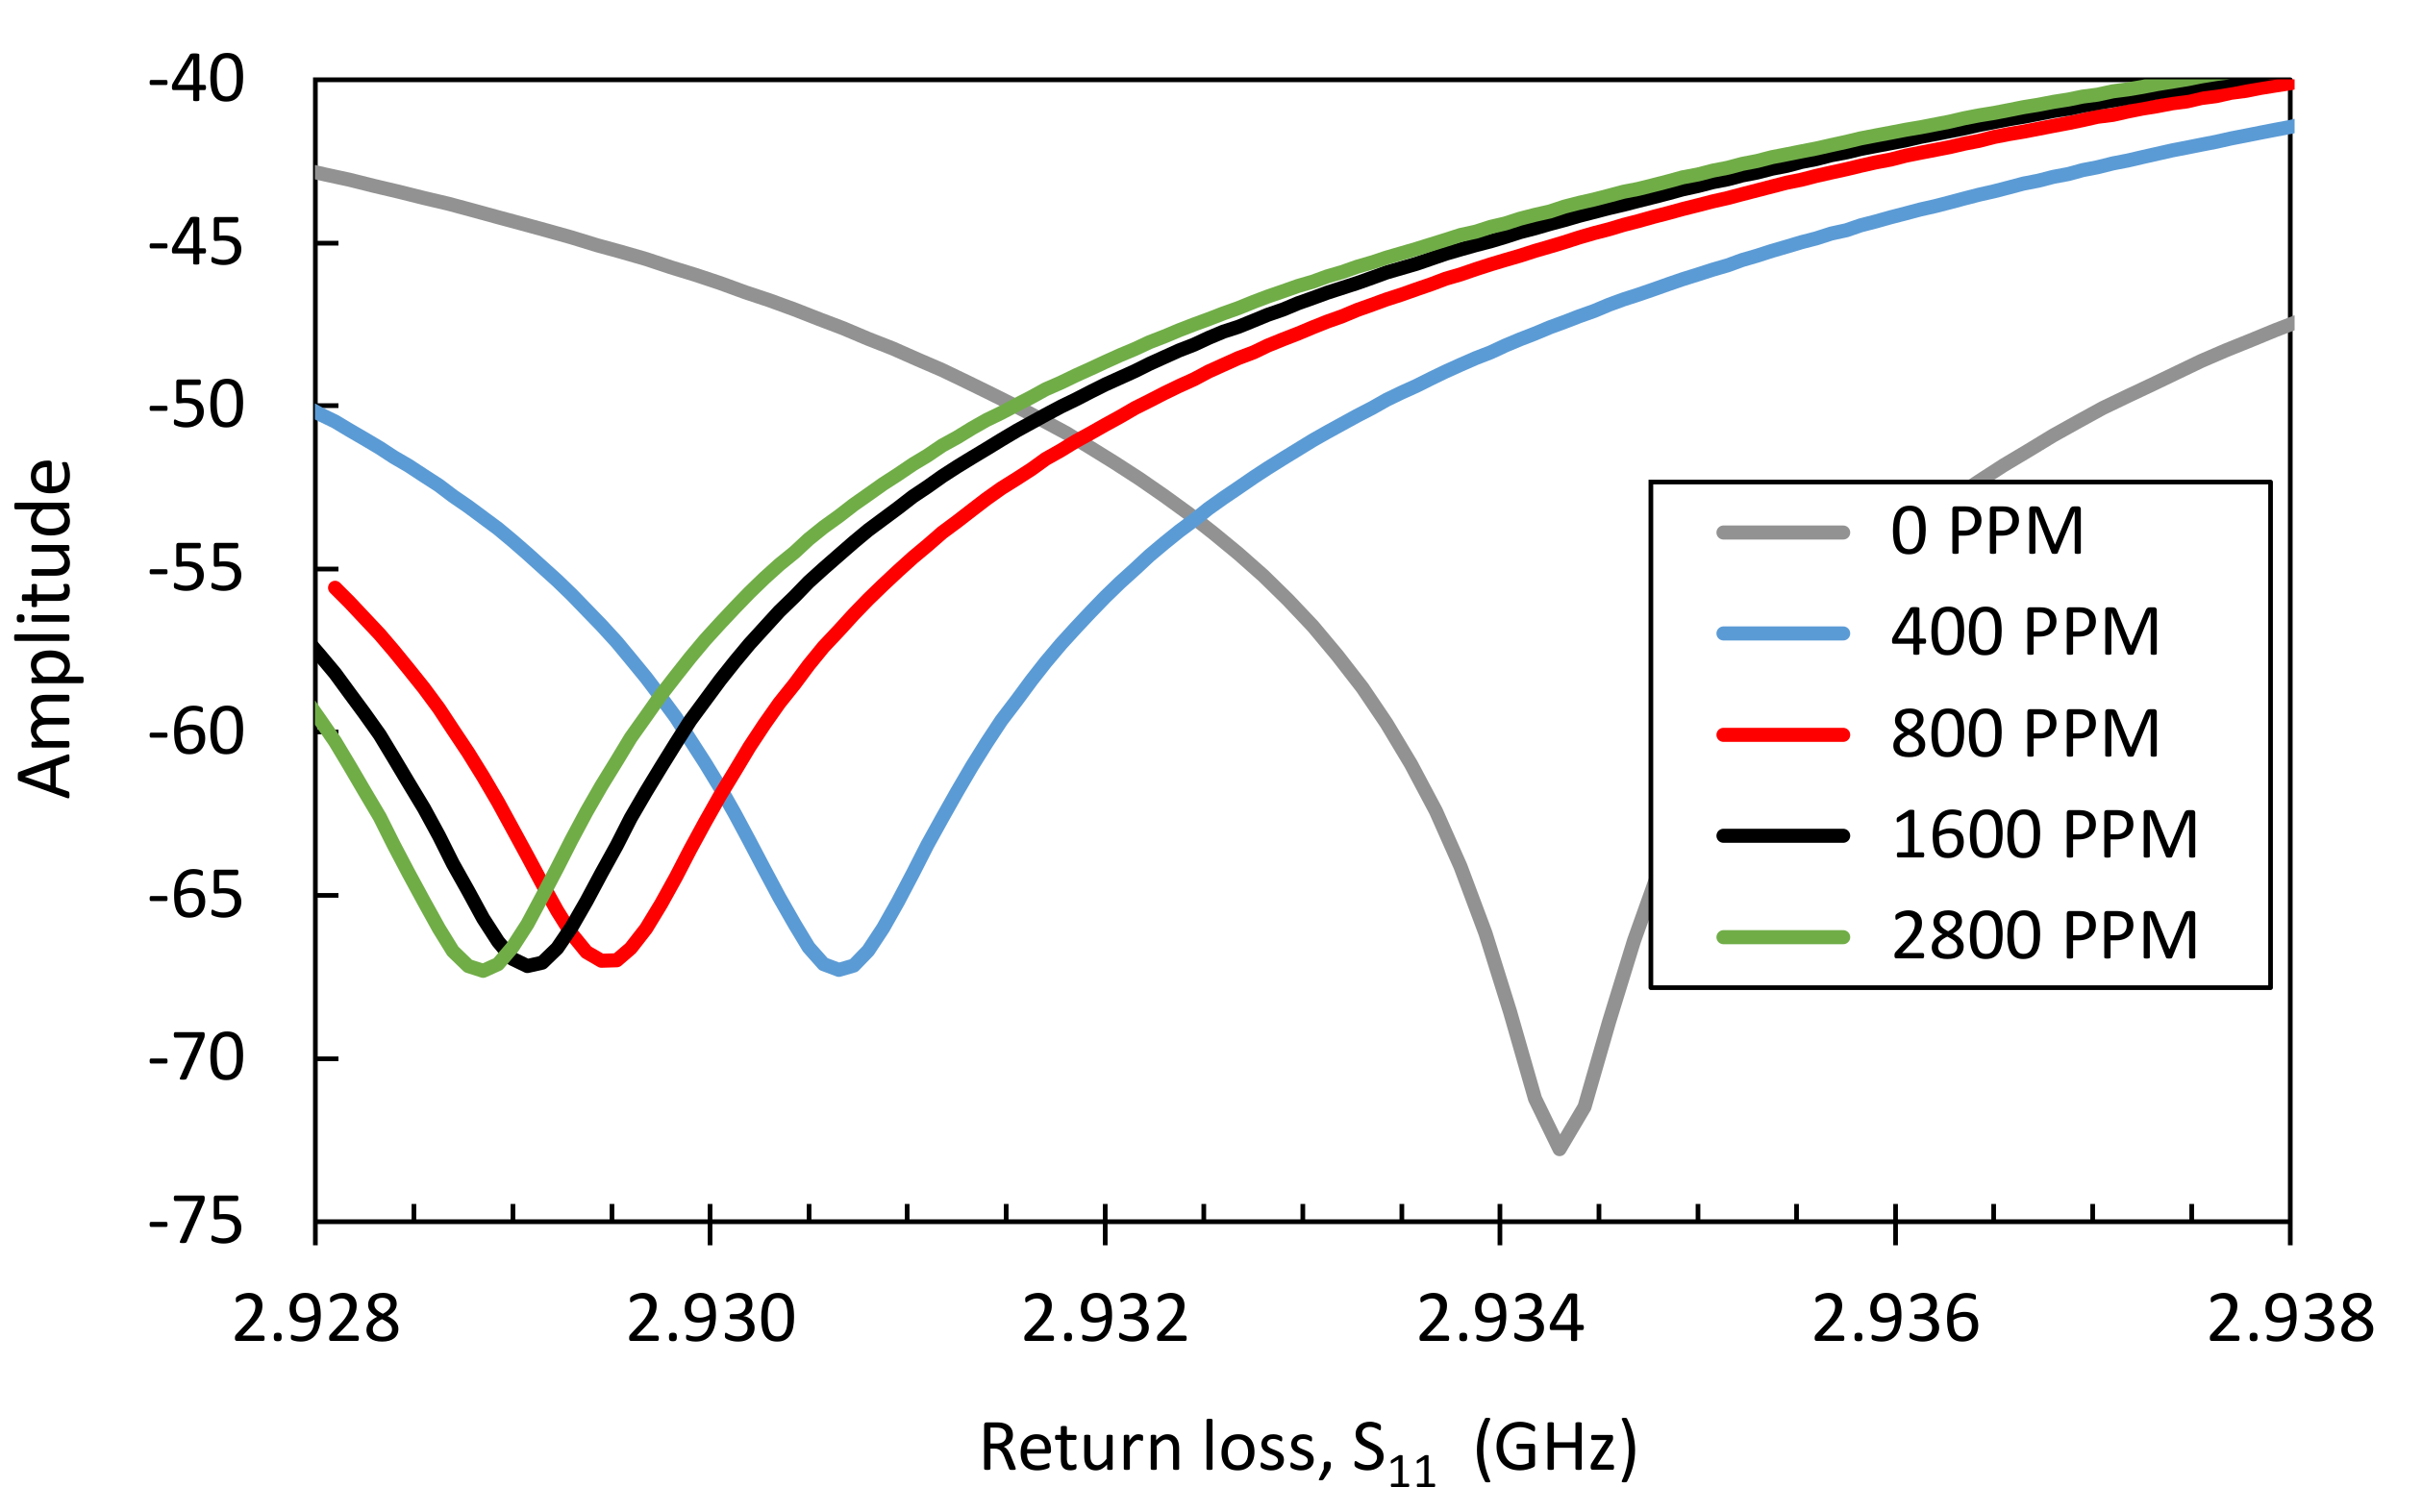
For the first scenario, the material filling the channel is considered bare zeolite Y with K’ = 7.17, and in the next scenarios, K’ was changed for each ammonia concentration. Figure 6 shows the contour plot of the transmission coefficient or S12 of the proposed resonator detector in the presence of the ammonia with 400 ppm. After several rounds of the simulation and narrowing down the range of the simulation to the most responsive area, the frequency was detected to be swept from 2.9277 to 2.9377 GHz. Within this range, a clear contrast could be obtained when the slight changes in the permittivity associated with the small increments in the concentration of the ammonia were given as the variable and the respective outcomes, which were S11 and S12. Figure 7 shows the changes in S11 due to the change in the permittivity. The increments of the concentration of the ammonia and the change in the frequency of the minimum value of S11 is used to indicate the concentration of the gas.
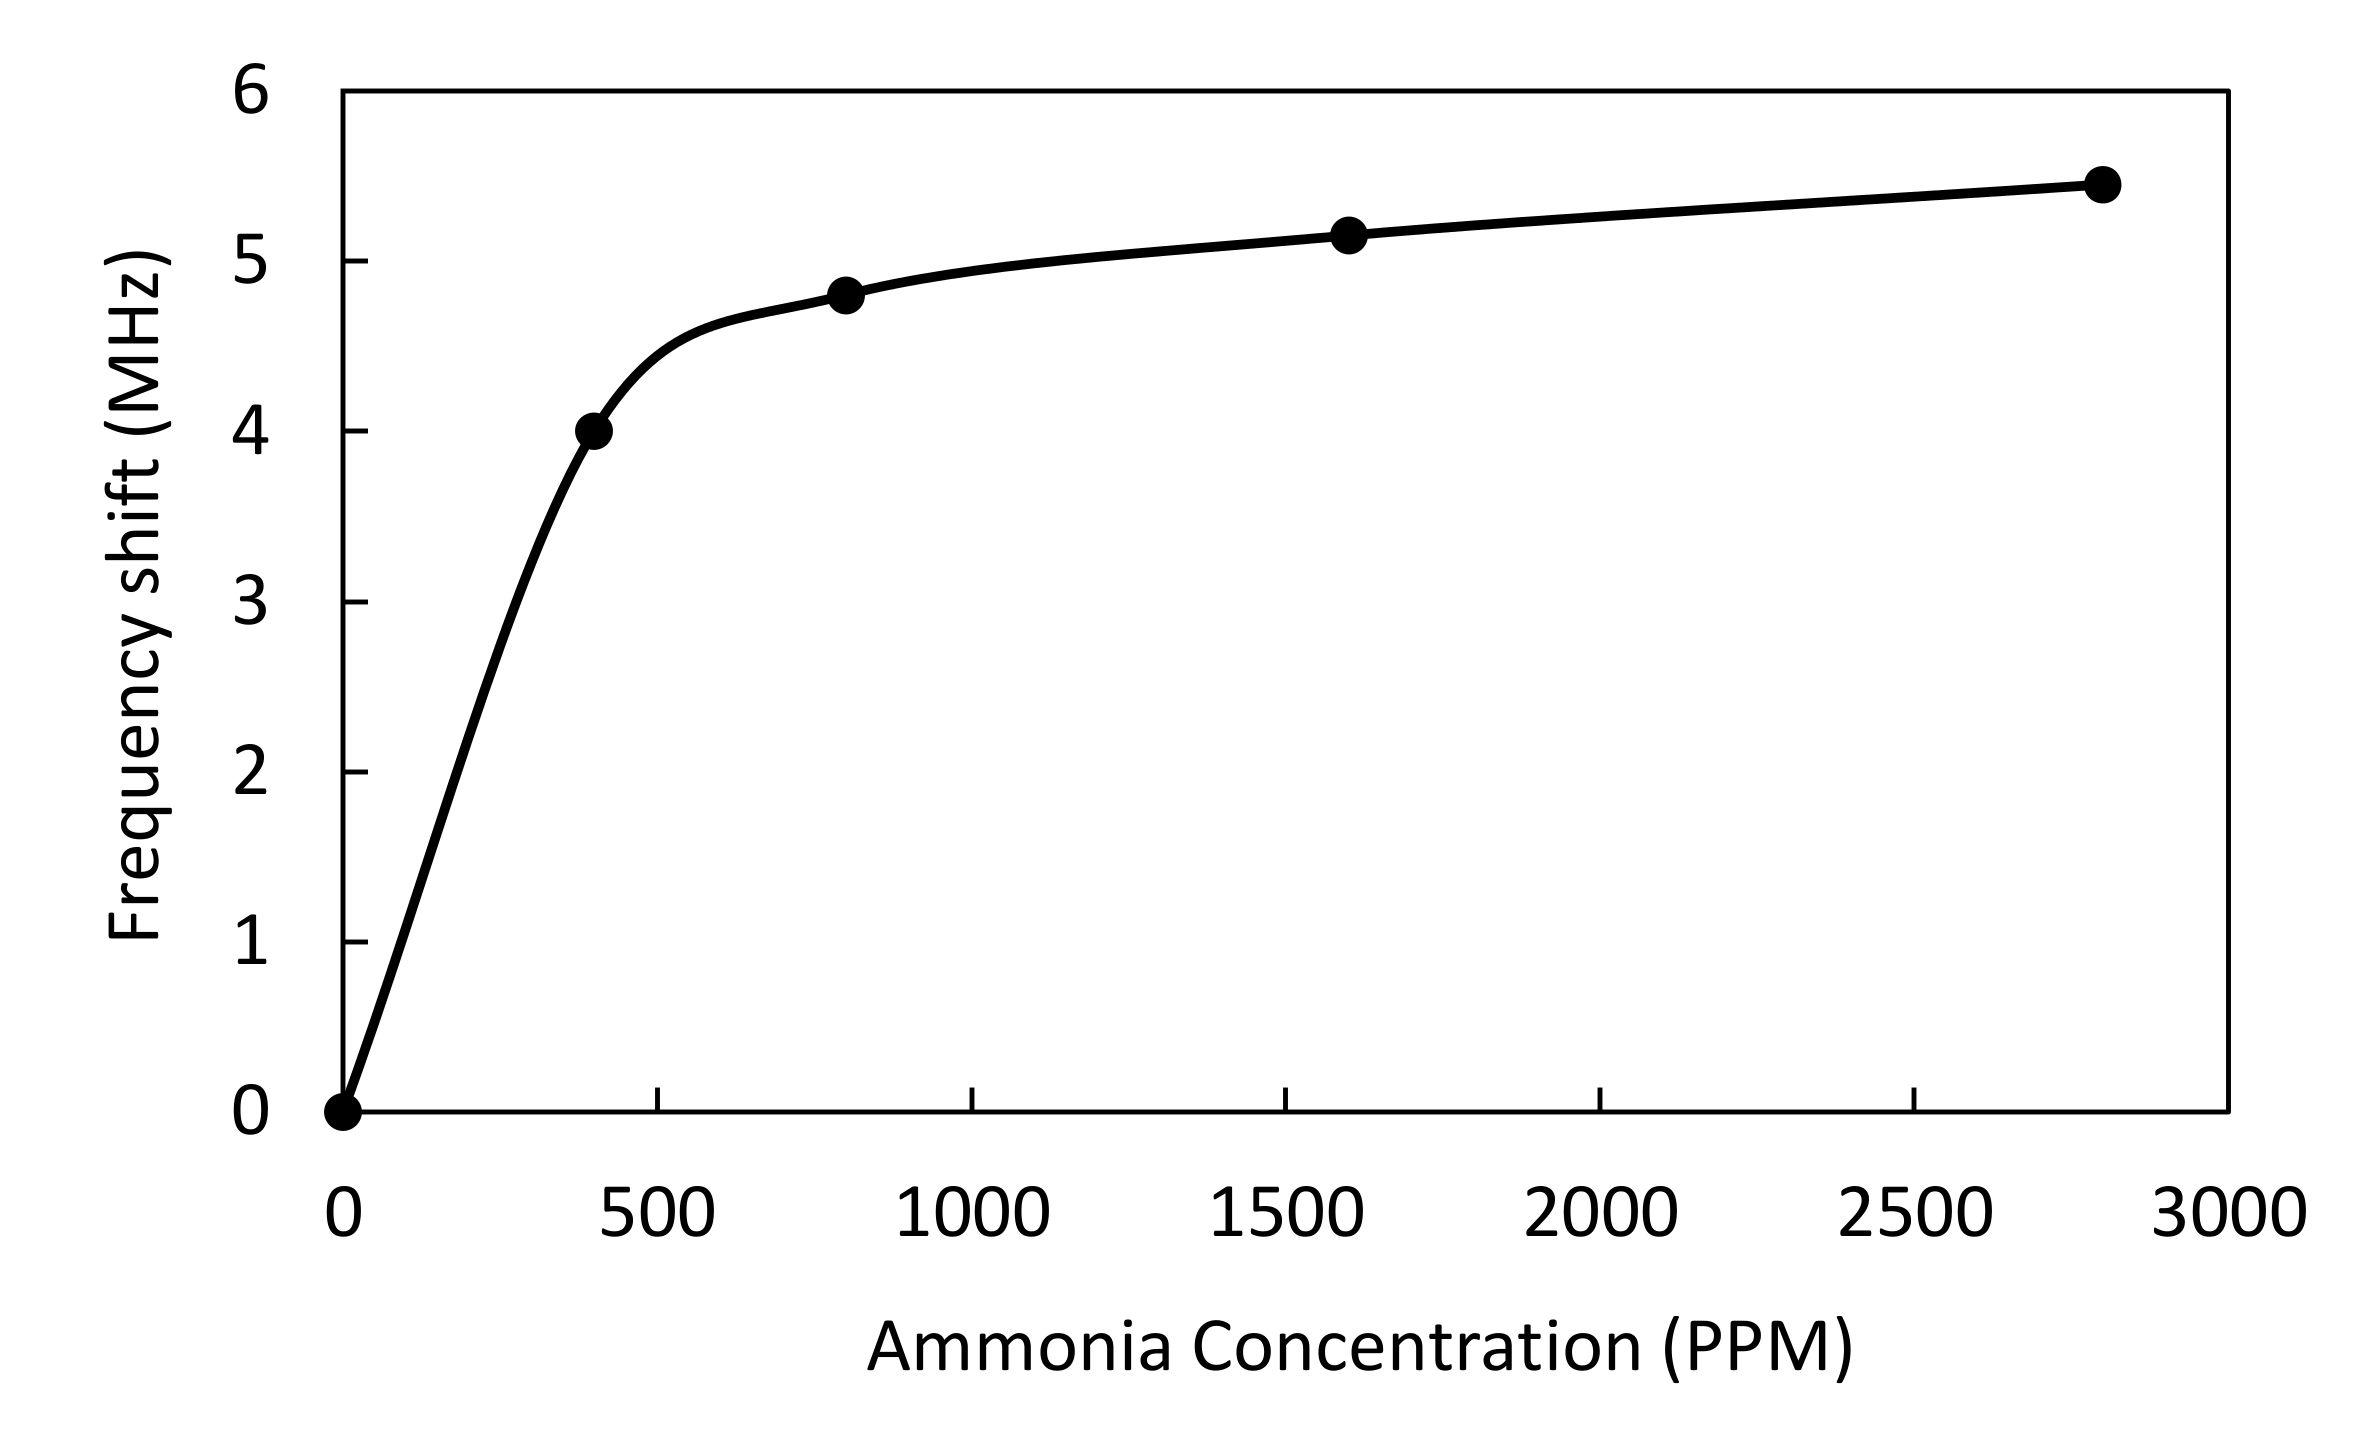
Another way is to monitor S11 at a single frequency, for example, 2.9317 GHz, and correlate the concentration to the value of S11 that is read at that point. To verify the correct detection, we can always employ a second operating frequency at the VNA and check the value of S11 in that frequency and cross-check the value based on the diagram given at Figure 7. This way, we can even extrapolate the graph for more concentration levels of the toxic gases. We can even read the concentrations between the given steps as the precision of the VNAs as fine as one kilohertz or even lower. Figure 8 shows the amount of observed frequency shift in return loss (S11) as a function of ammonia concentration. From the figure, it seems that the resonator is very sensitive to concentrations below 800 ppm, and for the range of 800 to 2800 ppm, the sensitivity has declined. This is a good indication that the microwave resonator is more sensitive to the small presence of ammonia, and upon increasing the concentration, the system reaches its saturation limit. Further simulation with empirical permittivity data is needed to conclude the sensitivity of the sensor in different ammonia concentrations.
In addition to the ammonia concentration that was studied here, environmental factors such as humidity and temperature could potentially change the permittivity of zeolite Y over time. Such an incremental permittivity change results in a baseline shift that is characterized differently from the impulsive permittivity change due to NH3 adsorption. A microwave resonator monitors the permittivity in real time and is sensitive to any spontaneous change; hence, those gradual effects should have a minimal effect. In addition, by employing machine learning (ML) and artificial intelligence (AI) approaches, one can calibrate the output to correct the measured baseline by using previously measured data in a similar condition as the ML/AI training data.

4. Conclusions

A modular and reconfigurable microfluidics–microwave integrated sensor was presented in this paper to detect toxic gases is a particle polluted environment. The proof of principle of the sensor is validated through simulation approach. The platform has three main modules, including a microfluidic-based particle separator, adsorption module, and a microwave-based detection system. An inertia-based spiral fluidic system was used for the continuous filter-free separation of aerosol particles before entering the system. The results show that the optimized microfluidic system could filter the aerosols from the mainstream intake air with 96% efficiency. An adsorption module was designed and integrated into the 3D microwave structure. Zeolite Y was selected as the adsorbent for ammonia detection. A low-cost and low-frequency 3D microwave split-ring resonator is proposed for sensing ammonia. The frequency band that was considered for operation of the sensor was 2.5 to 3 GHz. A finite element full wave simulation was performed to simulate the contrast in results when different molarities of the adsorbent are present in the adsorbent tube using publicly available permittivity data. Both the transmission coefficient and the reflection coefficient were monitored for different scenarios. The results show that the microwave module generates a clear contrast at 2.9 GHz that can be used for NH3 detection.

Author Contributions

Conceptualization, H.S.; methodology, H.S., A.B. and A.S.E.; software, H.S., A.B.; validation, H.S., A.B. and A.S.E.; formal analysis, H.S. and A.B.; investigation, H.S., A.B. and A.S.E.; resources, H.S., A.B. and A.S.E.; writing—original draft preparation, H.S., A.B. and A.S.E.; writing—review and editing, H.S., A.B. and A.S.E.; visualization, H.S.; supervision, H.S.; project administration, H.S.; funding acquisition, H.S., A.B. and A.S.E. All authors have read and agreed to the published version of the manuscript.

Funding

This research was partially funded by Kuwait Foundation for the Advancement of Sciences, KFAS, grant number CN19-35EC-01.

Institutional Review Board Statement

Not applicable.

Informed Consent Statement

Not applicable.

Data Availability Statement

Not applicable.

Acknowledgments

The authors would like to thank KFAS (Kuwait foundation for the advancement of sciences) for their support in this project.

Conflicts of Interest

The authors declare no conflict of interest.

Appendix A. Calculation of Relative Permittivity of Zeolite-Y at 3 GHz

As mentioned in Section 3.1, the relative permittivity for different ammonia concentrations was only publicly available at very high frequencies ranging from 60 to 90 GHz. To calculate the corresponding values at 3 GHz, we have used a method to extrapolate the published data by Li et al. [4].
In the first step, the saturated dielectric response of zeolite Y (K’R) at different frequencies (i.e., 60 GHz, 70 GHz, 80 GHz, and 90 GHz) were directly obtained from published graphs for each ammonia concentrations. The sample data for 400 ppm concentration is shown in Table A1.
Table A1. Saturated dielectric response for 400 ppm ammonia concentration from published data.
Frequency (GHz)Saturated Dielectric Response K’R
601.94
702.30
803.02
903.53
Then, an exponential curve was fitted into the data, and the corresponding dielectric responses at 3GHz were extrapolated. For 400 ppm concentration, the dielectric response at 3.0 GHz was estimated to be K’R = 0.60, as shown in Figure A1. The same procedure was used to calculate dielectric response for different ammonia concentration. Table A2 shows the obtained data for different adsorbed ammonia concentrations.
Figure A1. An exponential curve fitting was used to estimate/extrapolate the saturated dielectric response K’R of zeolite Y at 3 GHz.
Chemosensors 09 00328 g0a1
Table A2. Calculated K’R for different NH3 concentrations at 3 GHz.
Ammonia ConcentrationCalculated K’R
400 ppm0.60
800 ppm1.50
1600 ppm4.20
2800 ppm5.00
In the next step, the relative permittivity of the original zeolite Y in air (no adsorbed ammonia) at different frequencies were extracted from the published graphs. Using the same method as explained earlier, an exponential curve fitting was used to extrapolate the relative permittivity of zeolite Y at 3 GHz and K’g = 7.17 was obtained (Table A3).
Table A3. Relative permittivity K’g of zeolite Y in air at different frequencies.
Frequency (GHz)Relative Permittivity (K’g)
3.07.17 (extrapolated)
603.73
703.15
802.84
902.60
By knowing the dielectric response K’R of zeolite Y for different concentrations (Table A3) at 3 GHz and having the relative permittivity of zeolite Y in the original state, K’g (Table A1), one can calculate the relative permittivity of zeolite Y for different concentration using the equation below:
K R = K g K a K a   %
where K R is the dielectric response in percentage, K g = 7.17 is the relative permittivity of zeolite Y in air, and K a is the relative permittivity of zeolite in the presence of NH3, ammonia. Table A4 shows the calculated relative permittivity K’ that is further being used in the microwave simulation of the proposed sensor.
Table A4. Relative permittivity K’ of zeolite Y at different frequencies.
Ammonia ConcentrationRelative Permittivity K’
0 ppm (zeolite Y)7.17
400 ppm7.13
800 ppm7.06
1600 ppm6.87
2800 ppm6.81

References

  1. Tang, N.; Zhou, C.; Xu, L.; Jiang, Y.; Qu, H.; Duan, X. A fully integrated wireless flexible ammonia sensor fabricated by soft nano-lithography. ACS Sens. 2019, 4, 726–732. [Google Scholar] [CrossRef] [PubMed]
  2. Yu, Y.; Liao, Z.; Meng, F.; Yuan, Z. Theoretical and experimental research on ammonia sensing properties of sulfur-doped graphene oxide. Chemosensors 2021, 9, 220. [Google Scholar] [CrossRef]
  3. Madhaiyan, G.; Sun, A.-T.; Zan, H.-W.; Meng, H.-F.; Horng, S.-F.; Chen, L.-Y.; Hung, H.-W. Solution-processed chloroaluminum phthalocyanine (ClAlPc) ammonia gas sensor with vertical organic porous diodes. Sensors 2021, 21, 5783. [Google Scholar] [CrossRef] [PubMed]
  4. Li, F.; Wu, H.; Hua, C.; Zheng, Y. Ammonia adsorption-induced change in permittivity of zeolite Y in millimeter-wave band. Sens. Actuators A Phys. 2020, 303, 111852. [Google Scholar] [CrossRef]
  5. Sadabadi, H.; Bostani, A.; Esmaeili, A. Detection of toxic gas in dust-filled environment using integrated microwave-microfluidics. In Proceedings of the 3 International Conference on Microelectronic Devices and Technologies (MicDAT ′2020), Canary Island, Spain, 22–23 October 2020; pp. 42–45. [Google Scholar]
  6. Bourrounet, B.; Talou, T.; Gaset, A. Application of a multi-gas-sensor device in the meat industry for boar-taint detection. Sens. Actuators B Chem. 1995, 27, 250–254. [Google Scholar] [CrossRef]
  7. Vargas, A.P.; Gámez, F.; Roales, J.; Lopes-Costa, T.; Pedrosa, J.M. A paper-based ultrasensitive optical sensor for the selective detection of H2S vapors. Chemosensors 2021, 9, 40. [Google Scholar] [CrossRef]
  8. Hsieh, L.-T.; Chen, T.-C. Characteristics of ambient ammonia levels measured in three different industrial parks in southern Taiwan. Aerosol Air Qual. Res. 2010, 10, 596–608. [Google Scholar] [CrossRef]
  9. The National Institute for Occupational Safety and Health (NIOSH). Immediately Dangerous to Life or Health Concentrations of Chemicals, Ammonia; CAS number: 7664-41-7; U.S. Department of Health & Human Services, CDC: Washington, DC, USA, 1994. Available online: https://www.cdc.gov/niosh/idlh/7664417.html (accessed on 11 November 2021).
  10. Kendler, S.; Zuck, A. The Challenges of Prolonged Gas Sensing in the Modern Urban Environment. Sensors 2020, 20, 5189. [Google Scholar] [CrossRef]
  11. Fine, G.F.; Cavanagh, L.M.; Afonja, A.; Binions, R. Metal oxide semi-conductor gas sensors in environmental monitoring. Sensors 2010, 10, 5469–5502. [Google Scholar] [CrossRef] [Green Version]
  12. Zuck, A.; Sharabi, H.; Kendler, S. Detection of hazardous vapours in a dusty environment–development of a protective module for chemical sensor using a laboratory setup for systematically simulating realistic conditions. Int. J. Environ. Anal. Chem. 2020, 100, 134–151. [Google Scholar] [CrossRef]
  13. Wagner, F.; Bortoli, D.; Pereira, S.; Costa, M.J.; Maria Silva, A.; Weinzierl, B.; Esselborn, M.; Petzold, A.; Rasp, K.; Heinold, B. Properties of dust aerosol particles transported to Portugal from the Sahara Desert. Tellus B Chem. Phys. Meteorol. 2009, 61, 297–306. [Google Scholar] [CrossRef] [Green Version]
  14. Al-Attar, I.; Wakeman, R.J.; Tarleton, E.; Husain, A. Physical and Chemical Characterization of Kuwaiti Atmospheric Dust and Synthetic Dusts: Effects on the Pressure Drop and Fractional Efficiency of HEPA Filters; A&M University: College Station, TX, USA, 2010; Available online: https://hdl.handle.net/1969.1961/94141 (accessed on 11 November 2021).
  15. Lee, J.; Arrigan, D.W.; Silvester, D.S. Achievement of prolonged oxygen detection in room-temperature ionic liquids on mechanically polished platinum screen-printed electrodes. Anal. Chem. 2016, 88, 5104–5111. [Google Scholar] [CrossRef] [Green Version]
  16. Erdem, K.; Ahmadi, V.E.; Kosar, A.; Kuddusi, L. Differential sorting of microparticles using spiral microchannels with elliptic configurations. Micromachines 2020, 11, 412. [Google Scholar] [CrossRef] [PubMed] [Green Version]
  17. Kuntaegowdanahalli, S.S.; Bhagat, A.A.S.; Kumar, G.; Papautsky, I. Inertial microfluidics for continuous particle separation in spiral microchannels. Lab Chip 2009, 9, 2973–2980. [Google Scholar] [CrossRef] [PubMed] [Green Version]
  18. Zarifi, M.H.; Sadabadi, H.; Hejazi, S.H.; Daneshmand, M.; Sanati-Nezhad, A. Noncontact and nonintrusive microwave-microfluidic flow sensor for energy and biomedical engineering. Sci. Rep. 2018, 8, 139. [Google Scholar] [CrossRef] [PubMed] [Green Version]
  19. Guo, X.-L.; Chen, Y.; Jiang, H.-L.; Qiu, X.-B.; Yu, D.-L. Smartphone-based microfluidic colorimetric sensor for gaseous formaldehyde determination with high sensitivity and selectivity. Sensors 2018, 18, 3141. [Google Scholar] [CrossRef] [Green Version]
  20. Montazeri, M.M.; O’Brien, A.; Hoorfar, M. Understanding microfluidic-based gas detectors: A numerical model to investigate fundamental sensor operation, influencing phenomena and optimum geometries. Sens. Actuators B Chem. 2019, 300, 126904. [Google Scholar] [CrossRef]
  21. Gradov, O.V.; Gradova, M.A. Microwave enthrakometric labs-on-a-chip and on-chip enthrakometric catalymetry: From non-conventional chemotronics towards microwave-assisted chemosensors. Chemosensors 2019, 7, 48. [Google Scholar] [CrossRef] [Green Version]
  22. Zarifi, M.H.; Shariaty, P.; Hashisho, Z.; Daneshmand, M. A non-contact microwave sensor for monitoring the interaction of zeolite 13X with CO2 and CH4 in gaseous streams. Sens. Actuators B Chem. 2017, 238, 1240–1247. [Google Scholar] [CrossRef]
  23. Salim, A.; Ghosh, S.; Lim, S. Low-cost and lightweight 3D-printed split-ring resonator for chemical sensing applications. Sensors 2018, 18, 3049. [Google Scholar] [CrossRef] [Green Version]
  24. Chen, C.C.; Hsiao, C.T.; Sun, S.; Yang, K.-Y.; Wu, P.C.; Chen, W.T.; Tang, Y.H.; Chau, Y.-F.; Plum, E.; Guo, G.-Y. Fabrication of three dimensional split ring resonators by stress-driven assembly method. Opt. Express 2012, 20, 9415–9420. [Google Scholar] [CrossRef]
  25. Keller, J.U.; Staudt, R. Gas Adsorption Equilibria: Experimental Methods and Adsorptive Isotherms; Springer Science & Business Media: Berlin/Heildelberg, Germany, 2005. [Google Scholar]
  26. Yavari, F.; Chen, Z.; Thomas, A.V.; Ren, W.; Cheng, H.-M.; Koratkar, N. High sensitivity gas detection using a macroscopic three-dimensional graphene foam network. Sci. Rep. 2011, 1, 166. [Google Scholar] [CrossRef] [PubMed] [Green Version]
  27. Park, J.-K.; Kang, T.-G.; Kim, B.-H.; Lee, H.-J.; Choi, H.H.; Yook, J.-G. Real-time humidity sensor based on microwave resonator coupled with PEDOT: PSS conducting polymer film. Sci. Rep. 2018, 8, 439. [Google Scholar]
  28. Brochocka, A.; Nowak, A.; Zajączkowska, H.; Sieradzka, M. Chemosensitive thin films active to ammonia vapours. Sensors 2021, 21, 2948. [Google Scholar] [CrossRef] [PubMed]
  29. Sadabadi, H.; Sanati Nezhad, A. Nanofluids for performance improvement of heavy machinery journal bearings: A simulation study. Nanomaterials 2020, 10, 2120. [Google Scholar] [CrossRef]
  30. Francis, D.; Alshamsi, N.; Cuesta, J.; Gokcen Isik, A.; Dundar, C. Cyclogenesis and density currents in the Middle East and the associated dust activity in September 2015. Geosciences 2019, 9, 376. [Google Scholar] [CrossRef] [Green Version]
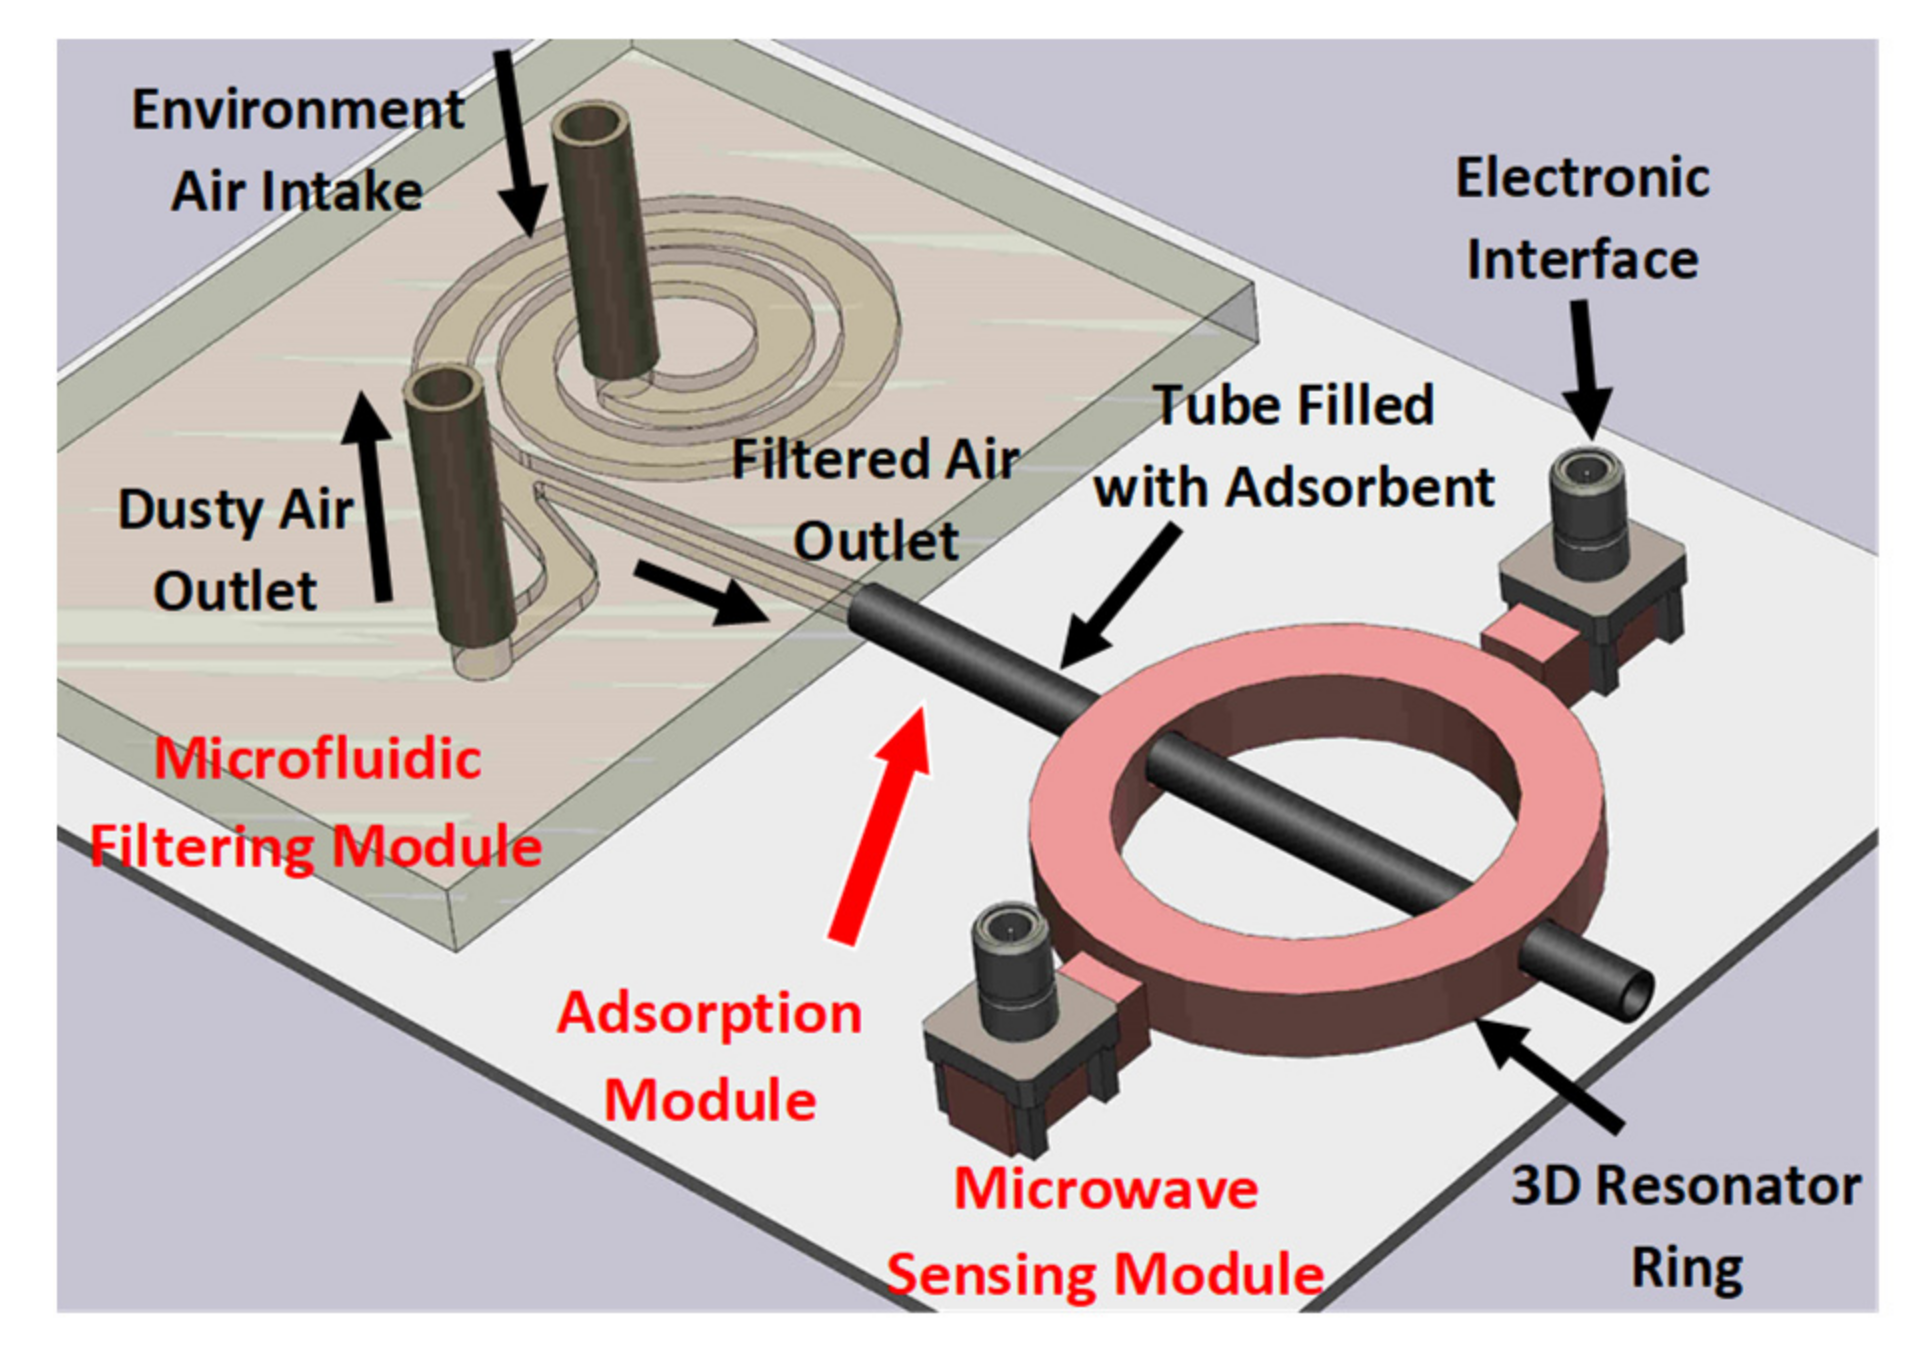
Figure 1. Schematic of the proposed modular gas sensor for in-line continuous gas detection in a particle-polluted environment.
Chemosensors 09 00328 g001
Figure 2. Sensor operation flowchart for detection of a toxic gases.
Chemosensors 09 00328 g002
Figure 3. Schematic of the fluidic system used for optimization.
Chemosensors 09 00328 g003
Figure 4. Overall geometry of the microwave resonator structure.
Chemosensors 09 00328 g004
Figure 5. Simulation of particle separation in microfluidics for in-line filtering of the inlet air containing particle pollution; (a) design 1; (b) design 5; (c) separation performance of each design.
Chemosensors 09 00328 g005aChemosensors 09 00328 g005b
Figure 6. Microwave high-frequency simulation; (a) the transmission coefficient of the proposed microwave detector in the presence of the NH3 at 400 ppm; (b) isometric view of the microwave resonator sensor with a glimpse of the electric field distribution at the occurrence of the resonance in the presence of NH3.
Chemosensors 09 00328 g006
Figure 7. The return loss (S11) of the proposed sensor at different concentrations of NH3 [S11].
Chemosensors 09 00328 g007
Figure 8. The frequency shift in return loss (S11) in the presence of different concentrations of NH3.
Chemosensors 09 00328 g008
Table 1. Spiral microfluidic configuration scenarios used for optimization.
Design #Channel
Cross-Section (W × H)
Pitch (mm)
Design 13 mm × 1 mm4 mm
Design 23 mm × 1 mm6 mm
Design 33 mm × 1 mm8 mm
Design 44 mm × 1 mm8 mm
Design 53 mm × 0.5 mm8 mm
Table 2. Parameters used in CFD simulation of fluidic system.
Flow Simulation ParameterValue
Intake air densityρ = 1.225 kg/m3
Particle pollution average sizeD = 6 µm
Intake flow velocityV = 0.25 m/s
Air viscosity (@15 °C)µ = 1.8 × 10⁻⁵ Pa·s
Table 3. Relative permittivity of zeolite Y at 3 GHz.
Concentration of Adsorbed Ammonia in Zeolite YRelative Permittivity (K’)
0 ppm (bare zeolite Y)7.17
400 ppm7.13
800 ppm7.06
1600 ppm6.87
2800 ppm6.81
Publisher’s Note: MDPI stays neutral with regard to jurisdictional claims in published maps and institutional affiliations.