Article

Development of a New Screen-Printed Transducer for the Electrochemical Detection of Thiram

by
David Ibáñez
*,
Daniel Izquierdo-Bote
,
María Begoña González-García
,
David Hernández-Santos
and
Pablo Fanjul-Bolado
*
Metrohm DropSens S.L., Vivero de Ciencias de la Salud, C/Colegio Santo Domingo de Guzmán s/n, 33010 Oviedo, Asturias, Spain
*
Authors to whom correspondence should be addressed.
Chemosensors 2021, 9(11), 303; https://doi.org/10.3390/chemosensors9110303
Submission received: 27 September 2021 / Revised: 21 October 2021 / Accepted: 22 October 2021 / Published: 25 October 2021

Abstract

:
A new transducer based on a screen-printed carbon electrode has been developed for the quantification of thiram. Detection of this fungicide is based on the performance of two enzymes: (1) aldehyde dehydrogenase catalyzes the aldehyde oxidation using NAD+ as a cofactor and simultaneously, (2) diaphorase reoxidizes the NADH formed in the first enzymatic process due to the presence of hexacyanoferrate(III) which is reduced to hexacyanoferrate(II). Taking into account that aldehyde dehydrogenase is inhibited by thiram, the current decreases with pesticide concentration and thiram can be electrochemically quantified below legal limits. The transducer proposed in this work involves the modification of the carbon WE with the co-factors (NAD+ and hexacyanoferrate(III)) required in the enzymatic system. The new device employed in this work allows the detection of 0.09 ppm thiram, a concentration below legal limits (Maximum Residue Limits 0.1–10 ppm).

Graphical Abstract

1. Introduction

Dithiocarbamate fungicides (thiram, ziram, mancozeb, maneb, zineb, etc.) are one of the most important pesticides currently used in the control of a huge variety of diseases on seeds, fruits and vegetables. However, several studies relate this family of fungicide to health diseases such as Parkinson [1,2,3], teratogenesis [4] and carcinogenesis [5]. Due to their toxicity, their Maximum Residue Limits (MRLs) are limited in the range of ppm or even some dithiocarbamate pesticides are forbidden in several countries. Particularly, thiram is a fungicide widely used in forestry to control fungal diseases and protect fruits and vegetables [6]. MRLs of thiram in food for human and animal consumption are established by the European Union (EU) from 0.1 to 10 ppm depending on the food product [7].
Traditional methods for the detection of dithiocarbamate fungicides, spectrophotometry [8,9], HPLC [10,11] or chromatography [12,13], are based on the detection of carbon disulfide liberated after acidic hydrolysis and show several drawbacks, such as time consuming, low sensitivity and complex instrumentation. Although new alternative methods (fluorescence, colorimetric, chemiluminescence, surface-enhanced Raman scattering spectroscopy, etc.) have been used to facilitate the detection and quantification of this family of fungicides [14,15,16,17,18,19,20,21,22], there is still a need to develop selective and sensitive procedures for each substance. In that way, analytical methods with enzymes (cholinesterase, aldehyde dehydrogenase, tyrosinase) open new gates for the identification and quantification of dithiocarbamate fungicides. Electrochemical devices offer easy, quick and reproducible alternatives for the detection of these compounds, while their sensitivity must be evaluated for each application. In particular, Table 1 shows the comparison among various methods for the determination of thiram in terms of sensitivity.
Enzymatic detection of thiram is based on the aldehyde dehydrogenase (ALDH), which catalyzes the oxidation of several aldehydes (acetaldehyde, propionaldehyde, benzaldehyde, etc.) to carboxylic acids using NAD+ as a cofactor (Scheme 1):
The quantification of aldehyde converted into carboxylic acid is easily determined measuring NADH by different routes, for instance, electrochemistry. As thiram inhibits ALDH activity, the pesticide concentration can be determined by measuring the decrease of the intensity in respect to the signal obtained when thiram is not present in the system. In addition, the conversion of aldehyde to acid is favored working with high concentrations of NAD+ and alkaline pH media. However, the equilibrium of this reaction is shifted towards the product side by coupling a second enzymatic reaction and the sensitivity improves when diaphorase (DP) is also used.
In the two-enzyme system, the NADH previously generated in the first enzymatic process is reoxidized by DP, while the simultaneous reduction of hexacyanoferrate(III) to hexacyanoferrate(II) takes place (Scheme 2). Thus, the intensity of the sensor response is proportional to the aldehyde concentration. Furthermore, the combination of enzymes and screen-printed electrodes (SPEs) allows the fabrication of reproducible biosensors for medical, biochemical, environmental and food control applications [36,37,38,39,40,41].
In the present work, the development of a new disposable transducer is described. This electrochemical device combines, for the first time, a screen-printed carbon electrode modified with NAD+ and hexacyanoferrate(III), and ALDH and DP enzymes for the electrochemical detection of dithiocarbamate pesticide. This device is based on the thiram inhibition of ALDH and enables the accurate and sensitive electrochemical detection of this fungicide below legal limits.

2. Materials and Methods

2.1. Reagents and Intrumentation

Aldehyde Dehydrogenase, potassium-activated from baker’s yeast (S. cerevisiae) (ALDH, EC 1.2.1.5, Sigma-Aldrich, Madrid, Spain), Diaphorase from Clostridium kluyveri (DP, EC 1.8.1.4, Sigma-Aldrich), β-Nicotinamide adenine dinucleotide, reduced disodium salt hydrate (NADH, Sigma-Aldrich), β-Nicotinamide adenine dinucleotide hydrate (NAD+, Sigma-Aldrich), Bovine Serum Albumin (BSA, Sigma-Aldrich), potassium hexacyanoferrate(III) (K3[Fe(CN)6], Sigma-Aldrich), acetaldehyde (AA, Sigma-Aldrich), propionaldehyde (PPA, Sigma-Aldrich) and thiram (PESTANAL®, Sigma-Aldrich). All chemicals were analytical grade. Aqueous solutions were prepared using ultrapure water (Direct-QTM 5 system, Millipore, Spain). Thiram pesticide is initially dissolved in ethanol (1 mM) and subsequently diluted in 0.1 M phosphate buffer solution pH 8.0, containing 0.1 M KCl.
Screen-printed carbon electrodes (DRP-110, Metrohm DropSens, Oviedo, Spain) were used to perform the electrochemical measurements. The electrodic systems consist of a flat ceramic card with a circular carbon working electrode (WE, 4 mm diameter), a carbon counter electrode (CE) and a silver pseudo-reference electrode (RE). Spectroscopic determination of the enzymatic activity of ALDH and DP was conducted using SPELEC instrument (Metrohm DropSens, Spain) controlled by DropView SPELEC software. Electrochemical measurements were performed at room temperature using a multi potentiostat/galvanostat µStat 8000 (Metrohm DropSens) controlled by DropView 8400 software.

2.2. Methods

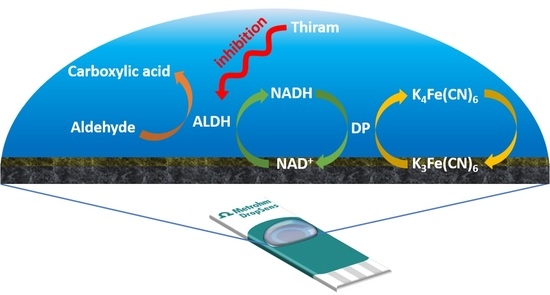
2.2.1. Fabrication of NAD+/K3[Fe(CN)6]/Carbon Transducer

NAD+/K3[Fe(CN)6]/carbon transducer is fabricated by the modification of WE of DRP-110. For that purpose, a mixture of 10 mM NAD+ and 10 mM K3[Fe(CN)6] in 0.1 M phosphate + 0.1 M KCl buffer solution (pH 8) is prepared. A 10 µL drop solution is added on the WE surface and the SPE is dried at 30–40 °C.

2.2.2. Electrochemical Detection of Thiram

The methodology employed for the electrochemical detection of thiram consists of two steps: (1) inhibition of the enzymatic reaction and (2) electrochemical detection of thiram. In the first one, the preparation of solutions depends on the transducer selected: all reagents involved in the enzymatic system (0.24 U/mL ALDH, 0.24 U/mL DP, 2 mM PPA, 1 mM NAD+, 1 mM K3[Fe(CN)6] and different concentrations of thiram) are mixed when a carbon transducer is used. On the other hand, only 0.58 U/mL ALDH, 0.58 U/mL DP, 2 mM PPA and different concentrations of thiram are mixed in solution when NAD+/K3[Fe(CN)6]/carbon transducer is employed. Once the solution is prepared, a drop of 60 µL is added on the SPE for 20 min, ensuring that the solution covers WE, RE and CE. After that and taking into account that the second step is intended to the electrochemical detection of thiram, chronoamperometry at a fixed potential for 60 s is carried out. For preliminary optimization studies, carbon SPE (DRP-110) was used. For the detection of thiram, NAD+/K3[Fe(CN)6]/carbon transducer was employed.
Prior to calculating the percentage of inhibition, the current intensities were corrected with the electrochemical signal obtained without an aldehyde substrate but with ALDH, DP and a high concentration of thiram (50 ppm).
The percentage of thiram inhibition is calculated as shown in Equation (1):
%   I n h i b i t i o n = ( I 0 I i I 0 ) × 100
where I0 represents the current of the control sample, that is, the product of the enzymatic reaction without the addition of thiram, and Ii means the current of the product of the enzymatic reaction in the presence of the selected concentration of thiram.

2.3. Determination of Enzyme Activities and Michaelis Constants

Enzyme activity of ALDH and DP is expressed in U (µmole of substrate transformed per minute and per mg of protein) and was measured following spectroscopic methods [42]:

2.3.1. Aldehyde Dehydrogenase (ALDH) Activity

ALDH activity was measured following the rate of reduction of NAD+. For that purpose, the increase of absorption band at 340 nm associated with NADH was monitored during 3 min. The reaction mixture in the final volume of 1 mL consists of 135 µL of 0.05 mg/mL ALDH solution, 2.7 mM NAD+, 0.44 mM AA and 1 mM 4-aminothiphenol in 0.1 M phosphate + 0.1 M KCl buffer solution (pH 8). Spectroscopic determination was performed in transmission configuration considering Lambert-Beer’s law:
A = ε   ×   b   ×   C
where A is the absorbance at 340 nm after 3 min, ε is the molar absorption coefficient (ε340nm, NAD+ = 6300 M−1·cm−1), b is the optical pathway length and C is the units of ALDH in the sample. Calculated ALDH activity under these experimental conditions was 0.26 U/mg.

2.3.2. Diaphorase (DP) Activity

DP activity was measured following the rate of reduction of K3[Fe(CN)6] by the analysis of band at 420 nm during 3 min. The reaction mixture in the final volume of 1 mL consists of 135 µL of 0.03 mg/mL DP solution, 2.7 mM NADH and 0.25 mM K3[Fe(CN)6] in 0.1 M phosphate + 0.1 M KCl buffer solution (pH 8). Spectroscopic determination in transmission configuration was calculated using Lambert-Beer’s law (Equation (2)), considering A the absorbance at 420 nm after 3 min, ε the molar absorption coefficient of K3[Fe(CN)6] (ε420nm, K3[Fe(CN)6] = 1040 M−1·cm−1), b the optical pathway length and C the units of DP in the sample. Calculated DP activity under the selected experimental conditions was 5.93 U/mg.

2.3.3. Michaelis Constants

Michaelis constants for NAD+, AA and PPA were calculated from chronoamperometric measurements, applying +0.40 V for 60 s. KM (NAD+) was calculated from experiments performed in 0.39 U/mL ALDH, 0.39 U/mL DP, 2 mM AA, 1 mM K3[Fe(CN)6] 0.1% BSA and different concentrations of NAD+ in 0.1 M phosphate + 0.1 M KCl buffer solution. KM of AA and PPA were obtained in 0.39 U/mL ALDH, 0.39 U/mL DP, 1 mM NAD+, 1 mM K3[Fe(CN)6] 0.1% BSA and different concentrations of AA or PPA in 0.1 M phosphate + 0.1 M KCl buffer solution.

3. Results

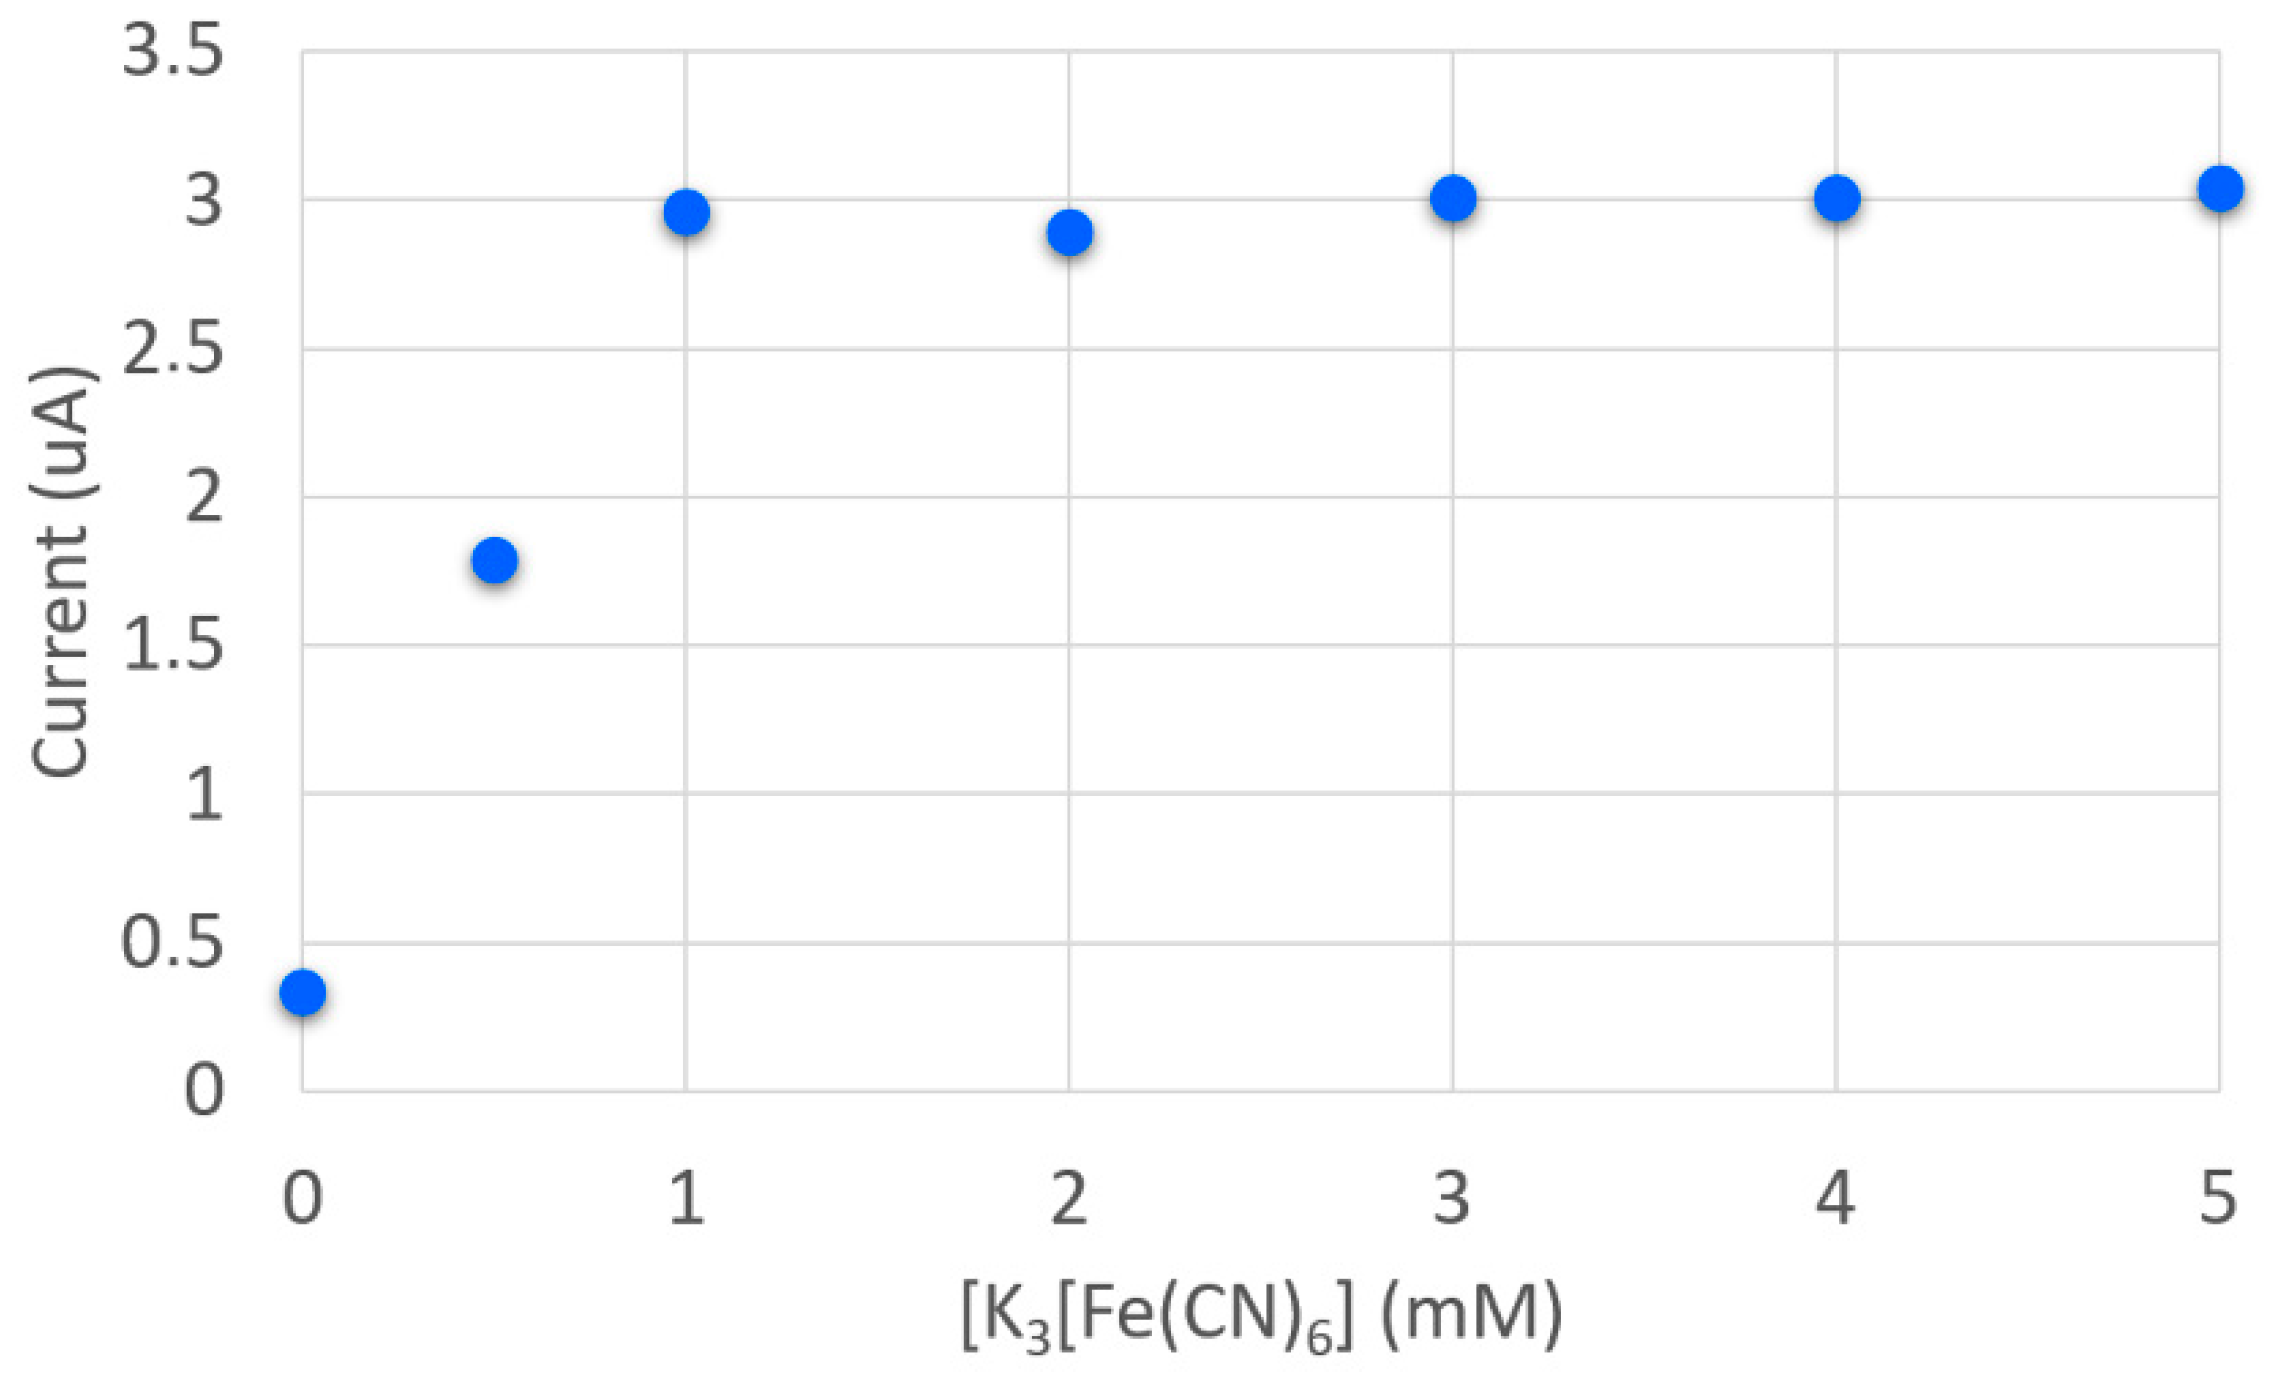
3.1. Optimization of Experimental Conditions

Initially, the Michaelis constants of NAD+ was calculated by the analysis of the chronoamperometric experiments carried out as is described in Section 2.3.3. KM (NAD+) was obtained by the fitting of the electrochemical data to the Lineweaver-Burk model (Figure S1). The calculated value was KM (NAD+) = 0.101 mM.
Both AA and PPA were evaluated as aldehyde substrates required in the enzymatic system. The Michaelis constants of both aldehydes were calculated from data shown in Figure 1 (procedure previously explained in Section 2.3.3). KM (PPA) = 1.473 mM is higher than KM (AA) = 0.907 mM, but also, PPA shows a much higher vapor pression (400.46 hPa at 23.6 °C) than AA (1.202 hPA at 25 °C). Selection of the substrate with higher vapor pression, in this case PPA, facilitates the preparation of the samples because the evaporation risk is reduced, the reproducibility of the electrochemical measurements improves and more precise control of the enzymatic reaction is achieved. Then, PPA is selected because it displays the best physical features and the volatility problems observed with AA are avoided.
Concentration of K3[Fe(CN)6] involved in the enzymatic sensor system was evaluated in 0.24 U/mL ALDH, 0.24 U/mL DP, 1 mM NAD+, 2 mM PPA, and 0.1% BSA in 0.1 M phosphate + 0.1 M KCl buffer solution. Electrochemical response obtained at +0.40 V for 60 s is plotted in Figure 2. It shows that current increases up to 1 mM, while at higher concentrations the value remains constant. Then, 1 mM K3[Fe(CN)6] is considered for the next experiments.
In order to obtain the highest electrochemical signal, different concentrations of ALDH and DP were tested. The ratio between ALDH and DP is a crucial parameter because a lack of activity of one of them could hamper the reliability of the electrochemical measurements [15]. According to previous works [15,21], ratio ALDH/DP = 1 was considered. Amperometric experiments were performed applying +0.40 V for 60 s in 1 mM NAD+, 2 mM PPA, 1 mM K3[Fe(CN)6] and 0.1% BSA in 0.1 M phosphate + 0.1 M KCl buffer solution. Figure 3 demonstrates that the current increases up to 0.24 U/mL, but at higher enzymatic concentrations the electrochemical signal remains constant or even decreases. Then, the optimal concentration of ALDH and DP is 0.24 U/mL.

3.2. Detection of Thiram Fungicide with NAD+/K3[Fe(CN)]6/Carbon Transducer

Detection of thiram is based on its inhibition effect on the enzymatic system. The inhibition of ALDH by dithiocarbamate fungicides was shown to be competitive with respect to NAD+ and non-competitive with respect to aldehydes [19]. Taking into account the optimization of the experimental conditions (Section 3.1), the electrochemical detection of thiram with carbon electrode was performed in a solution mixing all the reagents under the experimental conditions previously optimized (0.24 U/mL ALDH, 0.24 U/mL DP, 1 mM NAD+, 1 mM K3[Fe(CN)]6, 2 mM PPA, 0.1% BSA in 0.1 M phosphate + 0.1 M KCl buffer solution) and waiting 20 min before performing the chronoamperometry at +0.40 V for 60 s. The electrochemical signal is corrected with the background current of the transducer when no aldehyde but ALDH (0.24 U/mL), DP (0.24 U/mL) and high concentrations of thiram (50 ppm) are present in solution.
Obtained results (blue columns in Figure 4) show that the minimum concentration of thiram, which is electrochemically detected with the screen-printed carbon transducer, is 0.24 ppm. The RSD of blank signal without thiram is 2.2%. Then, this value corresponds to the minimum value that can be considered as inhibition.
In order to improve the sensitivity, WE was modified by drop-casting with the reagents involved in the enzymatic system (Section 2.2). However, the enzymatic activity of ALDH and DP decreases abruptly when they are retained on the electrode surface. Then, SPE is only modified with NAD+ and K3[Fe(CN)6] while both enzymes are present in the solution. The concentration of ALDH and DP (ratio 1:1) was newly optimized, obtaining 0.58 U/mL of ALDH and DP as the optimal concentration (data not shown). WE was modified with 6 mM NAD+ and 6 mM K3[Fe(CN)6] since the concentration of both compounds will be 1 mM when they are dissolved after adding 60 µL of solution on the SPE. As Figure 3 demonstrates, 1 mM K3[Fe(CN)6] and NAD+ with 2 mM PPA and 0.1% BSA in 0.1 M phosphate + 0.1 M KCl buffer solution pH 8.0 provides the highest electrochemical signal.
Modification of SPE with NAD+ and K3[Fe(CN)6] was conducted at different temperatures (from 4 to 50 °C), but the most reproducible results were obtained at 30 and 40 °C. Taking into account that a high temperature reduces the drying time, 40 °C is selected to fabricate the transducer. Furthermore, the thermal stability of NAD+ [43,44] shows that no significant degradation is observed at 60 °C and its degradation takes place at 85 °C, when it results mostly in the generation of nicotinamide and ADP-ribose. Then, electrochemical detection of different concentrations of thiram was performed at +0.40 V for 60 s in 0.58 U/mL ALDH, 0.58 U/mL DP and 2 mM PPA in 0.1 M phosphate + 0.1 M KCl buffer solution. The inhibition calibration of the enzymatic sensor (orange columns in Figure 4) shows that the percentage increases from 0.12 to 6 ppm and remains constant at higher concentrations of the pesticide. Then, the sensitivity of NAD+/K3[Fe(CN)]6/carbon transducer allows the detection of 0.12 ppm.
The electrochemical parameters involved in the detection of thiram were optimized, particularly, thiram calibration was also performed at a lower potential, +0.20 V. The transducer was fabricated with 6 mM NAD+ and 6 mM K3[Fe(CN)6] as is previously described. The calibration of thiram (blue columns in Figure 5) shows that 0.09 ppm can be detected since the inhibition of 5.6% is obtained. However, there is a lack of reproducibility as it can be observed in the error bars in Figure 5 (blue columns). Although the reproducibility must be improved, the detection potential of +0.20 V shows a lower blank current of the transducer than +0.40 V, and in that way, it is selected as a potential for thiram calibration due to it providing better results.
Different concentrations of NAD+ and K3[Fe(CN)6] (1, 3, 6, 10 and 15 mM) were evaluated. The sensitivity of modifications with 1, 3 and 15 mM does not allow the detection of lower concentrations of thiram than 0.24 ppm (1 mM) and 0.12 ppm (3 and 15 mM), so they are discarded. On the other hand, concentrations of 6 and 10 mM enable the detection of 0.09 ppm, i.e., below the legal limits established in the MRLs. Regarding the reproducibility, modification with 10 mM NAD+ and K3[Fe(CN)6] (orange columns in Figure 5) improves the results previously obtained with 6 mM NAD+ and K3[Fe(CN)6] modification (blue columns in Figure 5) and lower error bars are achieved. Under these experimental conditions, thiram calibration (0.09–6 ppm) fits the equation y = 18.95Ln(x) + 54.83 (R2 = 0.98). LOD was calculated considering current (blank experiment)—3σ and the calibration curve y = −1014x + 2714 (R2 = 0.988, Figure S2), obtaining a value of 0.118 ppm.

4. Conclusions

A new electrochemical transducer has been developed in this work. After testing different modifications of the carbon surface, amperometric detection shows that the best results are provided when only the cofactors NAD+ and K3[Fe(CN)6] (10 mM of both of them) are fixed on the working electrode surface, while the ALDH and DP enzymes are present in solution. This transducer simplifies thiram detection since the cofactors are present on the WE surface instead of in solution. The sensitivity of this electrochemical device allows the detection of 0.09 ppm thiram at +0.20 V, which is lower than the limits established in the MRLs (0.1 ppm). Then, the electrochemical transducer developed in this work opens up new possibilities in the detection of dithiocarbamate pesticides due to the usefulness of modified carbon surfaces. In order to fabricate a quick, easy and reproducible thiram SPE sensor, further studies will be focused on the modification of WE with all components of the enzymatic system.

Supplementary Materials

The following are available online at https://www.mdpi.com/article/10.3390/chemosensors9110303/s1, Figure S1: Lineweaver-Burk plot of NAD+. Figure S2: Calibration plot of thiram used for LOD calculation.

Author Contributions

Investigation, D.I. and D.I.-B.; Supervision, M.B.G.-G., D.H.-S., P.F.-B. All authors have read and agreed to the published version of the manuscript.

Funding

This research was funded by ENZ4IFACES (IDE/2020/000017) project funding by IDEPA and European Regional Development Funds under the framework ERA-NET.

Conflicts of Interest

The authors declare no conflict of interest.

References

  1. Pouchieu, C.; Piel, C.; Carles, C.; Gruber, A.; Helmer, C.; Tual, S.; Marcotullio, E.; Lebailly, P.; Baldi, I. Pesticide use in agriculture and Parkinson’s disease in the AGRICAN cohort study. Int. J. Epidemiol. 2018, 47, 299–310. [Google Scholar] [CrossRef] [PubMed]
  2. Soleo, L.; Defazio, G.; Scarselli, R.; Zefferino, R.; Livrea, P.; Foà, V. Toxicity of fungicides containing ethylene-bis-dithiocarbamate in serumless dissociated mesencephalic-striatal primary coculture. Arch. Toxicol. 1996, 70, 678–682. [Google Scholar] [CrossRef] [PubMed]
  3. Fitzmaurice, A.G.; Rhodes, S.L.; Lulla, A.; Murphy, N.P.; Lam, H.A.; O’Donnell, K.C.; Barnhill, L.; Casida, J.E.; Cockburn, M.; Sagasti, A.; et al. Aldehyde dehydrogenase inhibition as a pathogenic mechanism in Parkinson disease. Proc. Natl. Acad. Sci. USA 2013, 110, 636–641. [Google Scholar] [CrossRef] [Green Version]
  4. Woo, Y.T. Carcinogenicity, mutagenicity and teratogenicity of carbamates, thiocarbamates and related compounds: An overview of structure- activity relationships and environmental concerns. J. Environ. Sci. Heal. Part C 1983, C1, 97–133. [Google Scholar] [CrossRef]
  5. Vettorazzi, G.; Almeida, W.F.; Burin, G.J.; Jaeger, R.B.; Puga, F.R.; Rahde, A.F.; Reyes, F.G.; Schvartsman, S. International safety assessment of pesticides: Dithiocarbamate pesticides, ETU, and PTU-A review and update. Teratog. Carcinog. Mutagen. 1996, 15, 313–337. [Google Scholar] [CrossRef]
  6. Sharma, V.K.; Aulakh, J.S.; Malik, A.K. Thiram: Degradation, applications and analytical methods. J. Environ. Monit. 2003, 5, 717–723. [Google Scholar] [CrossRef]
  7. EU Pesticides Database. Available online: https://eur-lex.europa.eu/legal-content/EN/TXT/?uri=CELEX:32016R0001 (accessed on 21 October 2021).
  8. Keppel, G.E. Collaborative Study of the Determination of Dithiocarbamate Residues by a Modified Carbon Disulfide Evolution Method. J. Assoc. Off. Anal. Chem. 1971, 54, 528–532. [Google Scholar] [CrossRef]
  9. Caldas, E.D.; Conceição, M.H.; Miranda, M.C.C.; De Souza, L.C.K.R.; Lima, J.F. Determination of dithiocarbamate fungicide residues in food by a spectrophotometric method using a vertical disulfide reaction system. J. Agric. Food Chem. 2001, 49, 4521–4525. [Google Scholar] [CrossRef]
  10. Al-Alam, J.; Bom, L.; Chbani, A.; Fajloun, Z.; Millet, M. Analysis of Dithiocarbamate Fungicides in Vegetable Matrices Using HPLC-UV Followed by Atomic Absorption Spectrometry. J. Chromatogr. Sci. 2017, 55, 429–435. [Google Scholar] [CrossRef] [Green Version]
  11. Lehotay, J.; Kisová, D. HPLC Study of Mancozeb Degradation on Leaves. J. Liq. Chromatogr. 1993, 16, 1015–1022. [Google Scholar] [CrossRef]
  12. Woodrow, J.E.; Seiber, J.N.; Fitzell, D. Analytical Method for the Dithiocarbamate Fungicides Ziram and Mancozeb in Air: Preliminary Field Results. J. Agric. Food Chem. 1995, 43, 1524–1529. [Google Scholar] [CrossRef]
  13. Gustafsson, K.H.; Thompson, R.A. High-Pressure Liquid Chromatographic Determination of Fungicidal Dithiocarbamates. J. Agric. Food Chem. 1981, 29, 729–732. [Google Scholar] [CrossRef] [PubMed]
  14. Azab, H.A.; Duerkop, A.; Mogahed, E.M. Fluorescence and Electrochemical Sensing of Pesticides Methomyl, Aldicarb and Prometryne by the Luminescent Europium-3-Carboxycoumarin Probe. J. Fluoresc. 2012, 22, 659–676. [Google Scholar] [CrossRef]
  15. Nsibande, S.A.; Forbes, P.B.C. Fluorescence detection of pesticides using quantum dot materials—A review. Anal. Chim. Acta 2016, 945, 9–22. [Google Scholar] [CrossRef]
  16. Cai, K.; Xiang, Z.; Zhang, J.; Zhou, S.; Feng, Y.; Geng, Z. Determination of eight tobacco alkaloids in flue-cured tobacco samples by gas chromatography with nitrogen chemiluminescence detection (NCD). Anal. Methods 2012, 4, 2095–2100. [Google Scholar] [CrossRef]
  17. Gámiz-Gracia, L.; García-Campaña, A.M.; Soto-Chinchilla, J.J.; Huertas-Pérez, J.F.; González-Casado, A. Analysis of pesticides by chemiluminescence detection in the liquid phase. Trends Anal. Chem. 2005, 24, 927–942. [Google Scholar] [CrossRef]
  18. Marty, J.L.; Mionetto, N.; Noguer, T.; Ortega, F.; Roux, C. Enzyme sensors for the detection of pesticides. Biosens. Bioelectron. 1993, 8, 273–280. [Google Scholar] [CrossRef]
  19. Noguer, T.; Marty, J.L. High sensitive bienzymic sensor for the detection of dithiocarbamate fungicides. Anal. Chim. Acta 1997, 347, 63–70. [Google Scholar] [CrossRef]
  20. Ibáñez, D.; González-García, M.B.; Hernández-Santos, D.; Fanjul-Bolado, P. Detection of dithiocarbamate, chloronicotinyl and organophosphate pesticides by electrochemical activation of SERS features of screen-printed electrodes. Spectrochim. Acta-Part A Mol. Biomol. Spectrosc. 2021, 248, 119174–119180. [Google Scholar] [CrossRef] [PubMed]
  21. Saute, B.; Premasiri, R.; Ziegler, L.; Narayanan, R. Gold nanorods as surface enhanced Raman spectroscopy substrates for sensitive and selective detection of ultra-low levels of dithiocarbamate pesticides. Analyst 2012, 137, 5082–5087. [Google Scholar] [CrossRef] [PubMed]
  22. Zhang, H.; Kang, Y.; Liu, P.; Tao, X.; Pei, J.; Li, H.; Du, Y. Determination of Pesticides by Surface-enhanced Raman Spectroscopy on Gold Nanoparticle Modified Polymethacrylate. Anal. Lett. 2016, 49, 2268–2278. [Google Scholar] [CrossRef]
  23. Sharma, V.K.; Aulakh, J.S.; Malik, A.K. Fourth derivative spectrophotometric determination of fungicide thiram (tetramethyldithiocarbamate) using sodium molybdate and its application. Talanta 2005, 65, 375–379. [Google Scholar] [CrossRef] [PubMed]
  24. Filipe, O.M.S.; Vidal, M.M.; Duarte, A.C.; Santos, E.B.H. A solid-phase extraction procedure for the clean-up of thiram from aqueous solutions containing high concentrations of humic substances. Talanta 2007, 72, 1235–1238. [Google Scholar] [CrossRef]
  25. Filipe, O.M.S.; Vidal, M.M.; Duarte, A.C.; Santos, E.B.H. Influence of fulvic acids and copper ions on thiram determination in water. J. Agric. Food Chem. 2008, 56, 7347–7354. [Google Scholar] [CrossRef] [PubMed]
  26. Fernández, C.; Reviejo, A.J.; Polo, L.M.; Pingarrón, J.M. HPLC-Electrochemical detection with graphite-poly(tetrafluoroethylene) electrode. Determination of the fungicides thiram and disulfiram. Talanta 1996, 43, 1341–1348. [Google Scholar] [CrossRef]
  27. Waseem, A.; Yaqoob, M.; Nabi, A. Determination of thiram in natural waters using flow-injection with cerium(IV)-quinine chemiluminescence system. Luminescence 2010, 25, 71–75. [Google Scholar] [CrossRef] [PubMed]
  28. Waseem, A.; Yaqoob, M.; Nabi, A. Photodegradation and flow-injection determination of dithiocarbamate fungicides in natural water with chemiluminescence detection. Anal. Sci. 2009, 25, 395–400. [Google Scholar] [CrossRef] [PubMed] [Green Version]
  29. Girotti, S.; Maiolini, E.; Ghini, S.; Ferri, E.; Fini, F.; Nodet, P.; Eremin, S. Quantification of thiram in honeybees: Development of a chemiluminescent ELISA. Anal. Lett. 2008, 41, 46–55. [Google Scholar] [CrossRef] [Green Version]
  30. Malik, A.K.; Faubel, W. Capillary electrophoretic determination of tetramethylthiuram disulphide (Thiram). Anal. Lett. 2000, 33, 2055–2064. [Google Scholar] [CrossRef]
  31. Substrates, S.R.S. Direct Detection of Toxic Contaminants in Minimally Processed Food Products Using Dendritic Surface-Enhanced Raman Scattering Substrates. Sensors 2018, 18, 2726. [Google Scholar] [CrossRef] [Green Version]
  32. Zhang, L.; Wang, B.; Zhu, G.; Zhou, X. Synthesis of silver nanowires as a SERS substrate for the detection of pesticide thiram. Spectrochim. Acta Part A Mol. Biomol. Spectrosc. 2014, 133, 411–416. [Google Scholar] [CrossRef] [PubMed]
  33. Saute, B.; Narayanan, R. Solution-based direct readout surface enhanced Raman spectroscopic (SERS) detection of ultra-low levels of thiram with dogbone shaped gold nanoparticles. Analyst 2011, 136, 527–532. [Google Scholar] [CrossRef]
  34. Fernández, C.; Reviejo, A.J.; Pingarrón, J.M. Development of graphite-poly(tetrafluoroethylene) composite electrodes Voltammetric determination of the herbicides thiram and disulfiram. Anal. Chim. Acta 1995, 305, 192–199. [Google Scholar] [CrossRef]
  35. Hernández-Olmos, M.A.; Agüí, L.; Yáñez-Sedeño, P.; Pingarrón, J.M. Analytical voltammetry in low-permitivity organic solvents using disk and cylindrical microelectrodes. Determination of thiram in ethyl acetate. Electrochim. Acta 2000, 46, 289–296. [Google Scholar] [CrossRef]
  36. Law Al, A.T.; Adeloju, S.B. Progress and recent advances in phosphate sensors: A review. Talanta 2013, 114, 191–203. [Google Scholar] [CrossRef]
  37. Fernández-Fernández, M.; Sanromán, M.Á.; Moldes, D. Recent developments and applications of immobilized laccase. Biotechnol. Adv. 2013, 31, 1808–1825. [Google Scholar] [CrossRef]
  38. Arduini, F.; Micheli, L.; Moscone, D.; Palleschi, G.; Piermarini, S.; Ricci, F.; Volpe, G. Electrochemical biosensors based on nanomodified screen-printed electrodes: Recent applications in clinical analysis. TrAC-Trends Anal. Chem. 2016, 79, 114–126. [Google Scholar] [CrossRef] [Green Version]
  39. Avramescu, A.; Andreescu, S.; Noguer, T.; Bala, C.; Andreescu, D.; Marty, J.L. Biosensors designed for environmental and food quality control based on screen-printed graphite electrodes with different configurations. Anal. Bioanal. Chem. 2002, 374, 25–32. [Google Scholar] [CrossRef]
  40. Neves, M.M.P.S.; González-García, M.B.; Hernández-Santos, D.; Fanjul-Bolado, P. Streptavidin functionalized nickel nanowires: A new ferromagnetic platform for biotinylated-based assays. Talanta 2015, 144, 283–288. [Google Scholar] [CrossRef] [PubMed]
  41. Neves, M.M.P.S.; González-García, M.B.; Hernández-Santos, D.; Fanjul-Bolado, P. Screen-Printed Electrochemical 96-Well Plate: A High-Throughput Platform for Multiple Analytical Applications. Electroanalysis 2014, 26, 2764–2772. [Google Scholar] [CrossRef]
  42. Noguer, T.; Marty, J.L. An amperometric bienzyme electrode for acetaldehyde detection. Enzyme Microb. Technol. 1995, 17, 453–456. [Google Scholar] [CrossRef]
  43. Honda, K.; Hara, N.; Cheng, M.; Nakamura, A.; Mandai, K.; Okano, K.; Ohtake, H. In vitro metabolic engineering for the salvage synthesis of NAD+. Metab. Eng. 2016, 35, 114–120. [Google Scholar] [CrossRef] [PubMed] [Green Version]
  44. Hachisuka, S.; Sato, T.; Atomi, H. Metabolism Dealing with Thermal Degradation of NAD+ in the Hyperthermophilic Archaeon Thermococcus kodakarensis. J. Bacteriol. 2017, 199, e00162-17. [Google Scholar] [CrossRef] [PubMed] [Green Version]
Scheme 1. Aldehyde oxidation is catalyzed by the enzymatic system ALDH (enzyme) and NAD+ (cofactor).
Chemosensors 09 00303 sch001
Scheme 2. Two-enzyme system formed by ALDH, DP, NAD+ and K3[Fe(CN)6] catalyzes the aldehyde oxidation.
Chemosensors 09 00303 sch002
Figure 1. Lineweaver-Burk plot obtained for different concentrations of PPA (blue dots) or AA (orange dots) in 0.39 U/mL ALDH, 0.39 U/mL DP, 1 mM NAD+, 1 mM K3[Fe(CN)6], 0.1% BSA in 0.1 M phosphate + 0.1 M KCl buffer solution pH 8.0.
Chemosensors 09 00303 g001
Figure 2. Calibration of different concentration of K3[Fe(CN)6] in 0.24 U/mL ALDH, 0.24 U/mL DP, 1 mM NAD+, 2 mM PPA and 0.1% BSA in 0.1 M phosphate + 0.1 M KCl buffer solution pH 8.0.
Chemosensors 09 00303 g002
Figure 3. Calibration plot obtained with different concentrations of ALDH and DP (ratio = 1) and 1 mM NAD+, 1 mM K3[Fe(CN)6], 2 mM PPA and 0.1% BSA in 0.1 M phosphate + 0.1 M KCl buffer solution pH 8.0.
Chemosensors 09 00303 g003
Figure 4. Detection of thiram at +0.40 V after the incubation of the enzymatic system with various concentrations of thiram and 0.24 U/mL ALDH, 0.24 U/mL DP, 1 mM NAD+, 1 mM K3[Fe(CN)6], 2 mM PPA and 0.1% BSA in 0.1 M phosphate + 0.1 M KCl buffer solution pH 8.0 with DRP-110 carbon transducer (blue columns). Detection of thiram with the transducer DRP-110 modified with 6 mM NAD+ and 6 mM K3[Fe(CN)6] in 0.58 U/mL ALDH, 0.58 U/mL DP and 2 mM PPA in 0.1 M phosphate + 0.1 M KCl buffer solution pH 8.0 (orange columns).
Chemosensors 09 00303 g004
Figure 5. Detection of thiram at +0.20 V. Incubation was performed with various concentrations of thiram and 0.58 U/mL ALDH, 0.58 U/mL DP and 2 mM PPA in 0.1 M phosphate + 0.1 M KCl buffer solution pH 8.0. DRP-110 modified with 6 mM NAD+ and 6 mM K3[Fe(CN)6] (blue columns) and with 10 mM NAD+ and 10 mM K3[Fe(CN)6] (orange columns) were used as transducers.
Chemosensors 09 00303 g005
Table 1. Comparison among several methods for the determination of thiram.
Detection TechniqueLOD (ppm)Reference
Spectrophotometry0.3[23]
Spectrophotometry0.33[24]
HPLC-UV0.088[25]
HPLC-EC0.14[26]
FI-CL0.0075[27]
FI-CL0.005[28]
CL-ELISA0.009[29]
Electrophoresis0.5[30]
SERS0.115[31]
SERS0.024[32]
SERS0.0024[33]
EC0.013[34]
EC0.103[35]
EC0.09This work
HPLC-UV: high-performance liquid chromatography-ultraviolet; HPLC-EC: high-performance liquid chromatography-electrochemistry; FI-CL: flow injection-chemiluminescence; CL-ELISA: chemiluminescence-enzyme-linked immune-sorbent assay; SERS: surface-enhance Raman scattering; EC: electrochemistry.
Publisher’s Note: MDPI stays neutral with regard to jurisdictional claims in published maps and institutional affiliations.

