Abstract
Ultraviolet-visible (UV-vis) spectroscopy has shown successful results in the last few years to characterize and classify wine vinegar according to its quality, particularly those with a protected designation of origin (PDO). Due to these promising results, together with the simplicity, price, speed, portability of this technique and its ability to create robust hierarchical classification models, the objective of this work was the development of a computer tool or software, named VinegarScan, which uses the UV-vis spectra to be able to perform quality control and authentication of wine vinegar in a quick and user-friendly way. This software was based on the open-source GUI created in C++ using several data mining algorithms (e.g., decision trees, classification algorithms) on UV-vis spectra. This software achieved satisfactory prediction results with the available analytical UV-vis data. The future idea of utility is to combine the VinegarScan tool with a portable UV-vis device that could be used by control bodies of the wine vinegar industry to achieve a clear differentiation from their competitors to avoid fraud.
1. Introduction
Ultraviolet-visible (UV-vis) spectroscopy is the most straightforward and economical spectroscopic technique applied to analyze food liquids, such as wine, beer, or vinegar [1,2,3,4], due to its wide applicability, fastness of analysis, absence of generated residues, and its ease of use, with no costs and non-skilled operators [4]. It is based on the measurement absorption of the electromagnetic radiation from the ultraviolet and visible regions, from 190 to 750 nm [5]. Chemical information contained in the UV-vis spectra resides in the band positions, intensities, and shapes. Thus, the spectral position of an absorption band in this region is indicative of the presence or absence of certain structural features or functional groups. However, the identification and quantification of compounds is possible in a pure component system, but in foods, UV-vis spectra generally show only a few broad absorbance bands that are often rather broad and difficult to associate to single chromophores [6]. For this reason, this technique has mainly been applied to non-targeted food analysis [4].
The spectroscopic non-target or fingerprint approach, also recently named as spectralprint analysis [4], aims to capture as many compounds or features as technically possible from the entire spectra to gain a general insight into the composition of the sample. Thus, the results obtained by the use of the whole UV-vis spectra as a fingerprint, that is for example by the development of classification models and even by the direct observation of the spectra, could avoid the use of quantitative methods that need to know the specific compounds related to the characteristic to be determined, which would require trained operators as well as the use of standards and time-consuming analyses. Its application has been very interesting in the field of the verification of food-authenticity claims, this being extremely important for example in the case of foods labeled as protected designation of origin (PDO) as is the case of some vinegars [6].
There are many different kinds of vinegars. Thus, vinegars can be produced by a rapid method (i.e., the submerged method), which makes cheaper vinegars with less organoleptic notes, and a slow or traditional method (i.e., surface method) that produced higher quality vinegars, which are those that have been protected under a PDO. Furthermore, those vinegars, which are also made from specific raw materials, are submitted under a special system of aging and maturation producing different categories according to that. These categories are listed in the specifications of each PDO [7,8,9].
The authentication of the vinegar type, origin or category, also considering PDO wine vinegars, that is in general, the authentication of the vinegar according to its quality, is nowadays an important issue. Although misleading information regarding the geographical origin of foods, in particular vinegar, have few health implications, they may nonetheless represent a serious commercial fraud affecting both consumers and producers. Moreover, the increasing diversity of vinegars on the market, the growing consumer demand for some of them, which also makes them a greater target for fraud, are other facts that also promote the need of reliable quality control tools to defend the vinegar identity, mainly of those with higher quality, such as the PDO wine vinegars. For this reason, the authentication of the vinegars with PDO and their categories has been studied by the use of different techniques.
Thus, on the one hand, due to the fact that vinegar’s quality is mainly associated with its aroma, some classical analytical techniques, such as gas-chromatography-mass spectrometry (GC-MS), have been widely applied to characterize them [10,11]. However, although these conventional methods provide high-quality information, as they allow to determine several compounds from different families that contribute to vinegar flavor and quality, these classical techniques usually take a long time and high costs, as well as they also require the use of reagents and well-trained analysts.
On the other hand, and due to these aforementioned disadvantages, rapid, non-destructive and direct methodologies based on non-targeted techniques, are becoming nowadays more interesting for the vinegar authentication approach. In this group, some spectroscopies, have emerged as competitive fingerprinting techniques in vinegar’s quality control. Thus, methods such as near infrared spectroscopy (NIRs), mid infrared spectroscopy (MIR), or fluorescence spectroscopy, have been applied to determine the origin or category of those vinegars [12,13,14].
Nevertheless, among the aforementioned strategies that have enabled the characterization and classification of them according to their origin or category, UV-vis spectroscopy has demonstrated in the last few years its great ability to characterize and classify wine vinegar according to their quality, particularly those with a protected designation of origin (PDO), and to their production process or aging time, showing successful results and opening up the possibility of developing an efficient quality control tool [15,16,17,18,19]. UV-vis spectrum of wine vinegars, and also wines, presents absorption bands in the range 300–400 nm related to absorbent species relevant for color and taste characteristics, such as polyphenolic compounds (e.g., some acids as hydroxycinnamic acids, some aldehydes such as benzaldehyde, stilbenes, flavanols, and anthocyanins), together with the presence of other compounds such those related to the grape-must caramel added to the vinegars [17,18]. This makes a unique fingerprint that can be characteristic for each type or category of vinegar.
In particular, a previous study [17] showed the classification ability of UV–vis spectroscopy to differentiate many different wine vinegars according to different categories and to characterize wine vinegars without PDO with different ages and origins. Moreover, there is also a recently published study that reaffirms the ability of differentiation PDO wine vinegars by UV-vis spectroscopy [19]. In order to do that, as the characterization, authentication, and quality control of a PDO wine vinegar require a complex study, the success of the spectral analysis cannot be understood without referring to the implementation of powerful algorithms to handle all data generated for each spectrum, that is, spectral analysis is not understood without chemometrics.
Chemometrics is a well-known discipline that allows the extraction of information initially hidden in the data in a multivariate manner. However, sometimes it becomes cumbersome to know which multivariate method is the most appropriate for every purpose. Among the main chemometric techniques for classification purposes, partial least square–discriminant analysis (PLS-DA), decision trees (DT), and artificial neural networks (ANN) are the most highlighted [14,20,21,22,23]. In a previous UV-vis study of vinegars [17], a hierarchical classification model (HCM) formed by soft independent modelling-class (SIMCA) and partial least squares-discriminant analysis (PLS-DA) models in each of the nodes was needed to classify all the vinegar samples due to many different characteristics or vinegar types were considered (i.e., aged or not aged, with or without a PDO, from different PDOs and for different aging categories). HCM was needed for this study due to the classification problem being complex, since one or more classes can be divided into subclasses or grouped into superclasses, that is, with the classes to be predicted being hierarchically related.
Despite the successful results obtained [17], transferring the developed methodologies to the productive and industrial sectors for routine analysis remains challenging. Non-experts in data treatment and winemakers or workers of food companies or industries, which are very interested in the spectroscopic quality control of their products, are not always familiar with pre-processing, data modelling, and in general, chemometrics. For this reason, the development of easy-to-use tools or software able to extract results from spectral data in a simple manner is an important issue.
Different software applications have been developed for food analysis. Molano et al. [24] developed a web application to segment magnetic resonance images of hams. Gil-Sánchez et al. [25] have developed a graphical user interface in order to implement artificial neural networks on potentiometric electronic tongue data to discriminate several varieties of honey according to their floral origins (citrus, rosemary, polyfloral, and honeydew) and considering three different physical treatment: raw, liquefied, and pasteurized. Mishra et al. [26] provided a graphical user interface-based toolbox (FRUITNIR-GUI) for basic chemometric processing (regression and variable selection) to be applied in multi-batch NIR spectroscopic experiments related to fresh fruits. Lu and Lu [27] developed a user-friendly Matlab-based GUI to facilitate the analysis of structured-illumination reflectance imaging for fruit defect detection. Predic et al. [28] performed a data mining-based tool for early prediction of fruit pathogen infection. However, there is no classification software tool to authenticate PDO wine vinegars to the best of our knowledge.
Due to the promising results acquired in the previous study [17], together with the simplicity, price, speed, and portability of the UV-vis spectrometer, the objective of this work was the development of a new simple and easy-to-use software that, combined with a portable UV-vis spectroscopic device, could be able to authenticate and classify wine vinegars in a considerably short time and friendly-use way. It could be implemented as a routine method for process control and monitoring (directly in-situ and at real-time) in the wine vinegar production chain. Furthermore, it would help to achieve a clear differentiation from their competitors and avoid fraud. From this tool, different origins, production methods, ageing or qualities of vinegars could be identified. The application is based on the open-source GUI created in C++, and it uses several data mining algorithms.
2. Materials and Methods
2.1. Software Description
The VinegarScan software application was developed by using Visual C++ under tool Qt Creator 4.9.0. (Qt Co., Espoo, Finland), being the graphical user interface (GUI) developed with Qt framework and the classification model implemented with Visual C++ [29] and compiled by the MigGW 7.3 compiler. All the functions included in the tool are either built-in in the programming environment or codes developed in-house.
The software can be freely downloaded as ‘VinegarScan.zip’ on the website (www.hypertools.org, accessed on 15 October 2021) and installed on a PC with a Windows system (preferred versions 10 or more recent) just downloading the .zip folder and extracting it in C://, this location being mandatory for the tool to work properly. Then, in order to run the stand-alone executable “VinegarScan” (the file identified with a vinegar bottle icon), users only have to execute it and then load data and run the analysis, which can be launched by clicking the corresponding buttons.
The dataset corresponding to the case study discussed in this article as validation set is inside the VinegarScan.zip folder, in a “Spectra” subfolder. These files that contain the UV-vis spectra must be in .txt data format, due to the graphical user interface (GUI) only supporting this format. These files should have specific characteristics that will be further explained in detail in a following section.
The software contains a GUI for interacting with data files and producing visual and easily interpretable results.
2.2. Dataset for Developing VinegarScan Tool
The analytical method to obtain the dataset was the one described in a previous publication [17]. Thus, the samples were measured after diluting the vinegar samples in water in a rate 1/10 vinegar/water (v/v). These diluted samples were used to optimize the spectral conditions and to acquire suitable spectra. The analytical determinations were performed with a UV–vis spectrophotometer Ocean Optics CHEMUSB4 (Orlando, FL, USA) coupled with a detector with diode array. Samples were placed in a quartz cuvette with a path length of 10 mm. The zero value of absorbance was calibrated with the Ultra-pure water (MilliQ quality) absorbance, and the value 1 was obtained with the absorbance of a blackbody. All the samples were analyzed in duplicate. The spectra were acquired in the range 180–890 nm with a resolution of 2 nm.
The selected informative region for building the models was from 280 to 599 nm. This spectral range was selected because it is the most informative region in the UV-vis spectra for wines and vinegars as it was shown in a previous work [4]. In fact, this range was the one that provided the best classification rate according to the different classification criteria (aging and PDOs) [17].
The wine vinegar samples used to develop the models and the software were reported in a previous study [17]. A total of 67 different wine vinegars were analyzed, 43 of them being aged in wood barrels in different periods, and the other 24 without any ageing (being also called “Rapid vinegars” or RV). All these samples were collected directly from the producers to check the origin and type of the vinegars. In the case of the PDO samples, they were supplied by the corresponding producers under the control of the PDO regulatory council. Table 1 summarizes the details of the samples included in this study.

Table 1.
Information about the samples included in the study.
Within the first group, the “Aged vinegars’’ corresponded to wine vinegars with a Spanish PDO. The categories within each PDO corresponded to the different recognized categories according to their regulations [7,8,9]. These regulations define the vinegar categories based on the aging periods. In particular, in this study, the following samples and categories were analyzed: 14 samples from the “Vinagre de Condado de Huelva” PDO (7 of the “Solera”-CSO-category, and 7 of the “Reserva”-CRE-category); 16 from the “Vinagre de Jerez” PDO (7 of the “Crianza”-JCR- category and 9 of the “Reserva”-JRE-category); and 13 from the “Vinagre de Montilla-Moriles” PDO (6 and 7 of the “Crianza”-MCR- and “Reserva”-MRE-categories, respectively). The aging time of each category is defined in Table 1.
Concerning the “Not aged” group, it included 7 samples of the category “Not aged” from “Vinagre de Condado de Huelva” (coded as CSC), and 17 samples without any recognition or ageing being from Spain and Argentina (coded as RV). In contrast to the aged vinegars produced by a surface production method, all these rapid wine vinegars were made by the submerged method, being a more rapid procedure of production, which provides vinegar with lower quality properties.
As reported previously [17], different tests were assessed to optimize the UV-vis analysis and models. Thus, the optimization of the sampling procedure (e.g., the use of diluted samples or not or the range of dilution), the hierarchical structures (e.g., first starting with PDO/non-PDO, or first with the aged/not aged differentiation), the preprocessing methods (e.g., selection of different spectral regions, first derivate, second derivate, etc.), as well as the different algorithms of classification were assessed. Therefore, the optimal parameters were those implemented in the proposed software, that were the dilution 1/10 vinegar/water (v/v), the selection of the spectral region between 280 to 599 nm, removing the noise and non-informative regions, the preprocessing by standard normal variate and mean centering, and the “Aging” parameter as the starting point of the DT model.
The validation procedure followed in this manuscript for the DT models follows the strategies posed by Ríos-Reina et al. [17]. The DT models were satisfactorily validated by an internal and external validation by means of cross-validation and the use of different train and test sets, respectively. The low number of samples was also mitigated by applying bootstrapping, whose results showed the robustness of the model. Different data sets were prepared by randomly dividing the samples into two groups, a train and a test set. Thus, the training sets were formed with 100 spectra corresponding to the duplicates of 50 samples. These sets was used for the model training. On the other hand, the validation sets were formed with 34 spectra (i.e., the duplicate analysis of 17 samples) for testing the performance of the classification model. Each dataset contained samples of all the categories and types of vinegars. One of the validation or test set of samples was included in a folder of the software to be used as example.
Standard normal variate (SNV) and mean centering were the pre-processing applied to the dataset in the classification models of the tool. This spectral pre-processing was used since it provided the best performance in terms of variance explained in the model after testing different procedures [17].
2.3. Software Architecture
The designed software was based on the structure of the hierarchical classification model (HCM) built with the UV-vis spectral data that made up the calibration set of the published work by Ríos-Reina et al. [17]. The HCM is a classification method in which a sample belongs to several classes at the same time and these classes are organized as a tree according to a hierarchy [30]. The HCM developed in that previous work [17] is schematized in Figure 1, including the definition of the different nodes according to the different vinegar categories studied.

Figure 1.
Diagram of the hierarchical classification model (HCM) followed for the development of the decision tree included in the tool.
Considering the required classification of vinegars in which each sample can belong to a single class only in each node, a tree structure was selected as HCM [31]. Thus, in this tree structure, unlike other types of HCM, each node has just one parent node. This specific structure, shown in Figure 1, was composed in an order representing the specificity in the classification. Thus, in HCM, the deeper the class in the hierarchy, the more specific knowledge of the sample acquired. This specificity is also associated to a larger difficulty in the prediction [31]. In particular, the HCM developed in the previous work [17] in which the tool will be based, started the classification with the distribution of the samples in two large groups, aged and not aged, which was considered the 1st level. Then, in a 2nd level, the samples were classified in the different PDO. Finally, in the 3rd level, the samples were distributed into the PDO aging categories. In that structure, the first and the last nodes were developed by using soft independent modelling by class analogy (SIMCA) and the second level by partial least squares-discriminant analysis (PLS-DA), according to the different classes studied [17].
The software object of this work was developed using a lateral discriminant decision tree algorithm. The decision trees (DT) algorithms have a tree-based structure similar to HCM and it is a decision model tool that graphically displays the classification process from a given input and once the possible output categories are known [32]. The algorithm is developed by creating subsets of data, decomposing the entire data set into smaller subsets. One of the advantages is that DT models have high comprehensibility, that is, the knowledge acquired by the tree during its training is easy to understand and interpret [31]. This was one of the reasons for the choice of this approach for the development of the tool. The final structure of the DT can be seen in Figure 2.
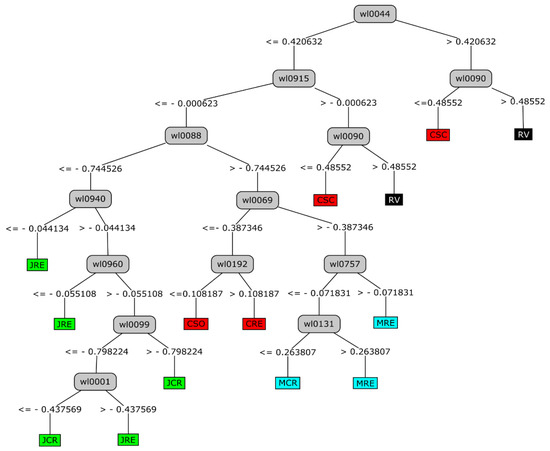
Figure 2.
Decision tree (DT) developed for the tool based on the HCM carried out in a previous work [17].
2.4. Model Development
The model developed for the software application was performed by applying the free software tool Waikato Environment for Knowledge Analysis (WEKA) (http://cs.waikato.ac.nz/~ml/weka last accessed on 15 June 2020).
DT was used as a classification technique in this chemometric model [32,33]. The J48 DT is a WEKA implementation of the well-known C4.5 DT algorithm [34]. This algorithm was performed according to the configuration described in previous studies [35,36,37,38]. The J48 DT was applied to develop the model with the following parameters: 0.5 as the confidence factor and 5 as the minimum size of grouped records.
This DT is based on the information gain ratio approach (entropy of data set). The DT algorithm selects the splitting attribute that minimizes the entropy value, maximizing the difference among the classification groups. Thus, the attributes are evaluated and ranked by the entropy values. Then, the top-ranked attributes are selected as the potential attributes used in the classification model. To identify the splitting attribute of the DT, one must calculate the information gain ratio for each attribute according to the non-classified information. The entropy is calculated using the following equation:
where k is the number of classes of the target attributes, Pi is the number of occurrences of class i divided by the total number of instances (i.e., the probability of i occurring) [39]. Once the attribute to discriminate is selected, the threshold adjustment process is carried out by a divide-and-conquer strategy, obtaining each step the threshold that maximizes the number of samples classified correctly.
Thus, a decision tree was generated for each level of the HCM. In the first level, a DT was generated to discriminate between “Aged” and “Not aged” categories. In the second level, a DT was created for classifying the “Aged” vinegars among the PDO studied (“Vinagre de Condado de Huelva”, “Vinagre de Jerez” y “Vinagre de Montilla-Moriles”) and another to classify between the two specified categories of the “Not aged” vinegars (Rapid vinegars from Spain and Argentina and the Not aged vinegars from the PDO “Vinagre del Condado de Huelva”). In the last level, for each PDO category, a DT tree was generated to classify the specified categories of each PDO.
3. Results and Discussion
3.1. Brief Mathematical Background Resulting from Training Datasets
The classification model based on DT has been developed with the tree structure shown in Figure 2. This DT classification model represents all possible paths in the tree created as a result of the process of prediction model creation, based on a J48 DT classifier. This model has the categories in the leaves of the tree structure and the attributes (in this case, the wavelengths of the UV-Vis spectra) in the decision nodes. Figure 2 shows the 13 rules created that represent all possible paths in the DT with the vinegar samples considered in the study, which was created as a result in the process of prediction model creation based on a J48 classifier.
By looking at the mean spectrum of UV-vis for each class of vinegars (Figure 3) and following the same schema of the HCM (Figure 1) and DT developed (Figure 2), it could be seen the spectral regions that differs for each type of wine vinegar.
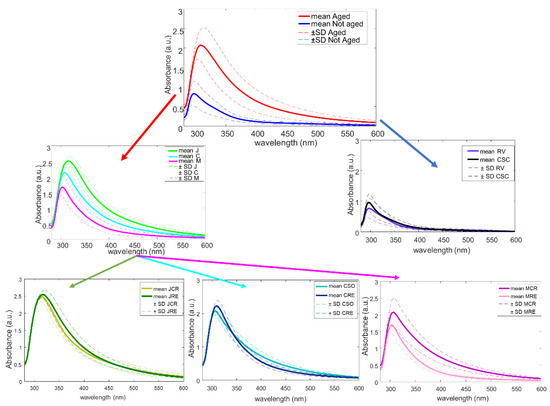
Figure 3.
Mean spectra of each type of wine vinegar following the DT structure of the study.
The intensity of the maximum around 300 nm seemed to be the key for the separation made in the first level, between “Aged”, with higher intensity around 325 nm, from “Not aged” vinegars, with a maximum around 290 nm and with a lower intense spectrum. Although the identification of specific compounds is a difficult task in UV-vis spectroscopy, the different composition of phenolic compounds, as well as aldehydes such as benzaldehyde, syringaldehyde, and vanillin in aged vinegars in wood barrels than in not aged vinegars could be one of the reasons of the differentiation. Hence, during aging in wood, some changes such as evaporation of water (and therefore concentration of compounds) or transference of components from wood make an increasing of some of these compounds that could be related to the difference in the intensity of the absorbance bands [17].
In the second level, and within the “Aged” group that was formed by PDO wine vinegars (J, C, and M), there could be also seen a difference in intensity of the bands around 300 nm. However, although this spectral difference could be associated to some of the compounds aforementioned, in this case, this difference belongs to the grape variety used on each PDO and therefore, to the geographical origin. In the case of the differentiation between RV and those “Not aged” from the PDO “Condado de Huelva” (CSC), there could be seen a differentiation on the spectra, which showed higher intensity at 300 nm for CSC vinegars, which could be explained by the fact that high-quality vinegars contain a more complex composition provided by the traditional and slow production method, which led to this higher intensity.
Finally, regarding the last level, as it was mentioned before, the deeper the class in the hierarchy, the larger difficulty in the prediction. Hence, it could be seen that the spectral differences between categories within the each PDO are more complex to observe visually, although similar spectral regions from the above mentioned were responsible for the separation. This is explained by the fact that the study of the aging category is a difficult task, due to “aging” is a continuous variable, which means that one sample from the “Reserva” category (≥2 years of aging in wood barrels) and other sample from the “Crianza” category (with aging in wood barrels ≥6 months and <2 years old) could be differentiated by one more day of aging in the barrel. So, the differences between some samples could be too small.
3.2. Format of the Spectral File
The graphical user interface (GUI) supports and read UV-vis spectra in .txt format. The UV-vis spectral range should comprise the wavelength ranges from 280 to 599 nm every 2 nm (i.e., comprise a total of 1566 variables). This is because it is the spectral range used for carrying out the models and calibrating the tool. The tool can read other spectral ranges, but the prediction could be failed. This spectral range, which can be initially obtained of different formats (e.g., Excel file) should be saved as “unicode text with tabs”, i.e., in .txt data format, which can be nominated by any name (e.g., “s1.txt”), and it should have only one column, without wavelength headings or names, with decimal places delimited by dots, otherwise, it cannot be read by the software. Some examples of these files, that were used as test set, are found in the “Spectra” folder included in the GUI that can be seen marked with a dotted orange square in Figure 3.
3.3. GUI Design and Operating Procedure for Vinegar Authentication
As shown in Figure 4, when the .zip folder is extracted as the first step of the installation, different folders and files are found inside. The two with utility for the user are the folder called “Spectra”, where the user can find a set of different samples used to test the tool, and the executable file “VinegarScan” symbolized by a vinegar bottle, which is the tool to be used. In addition, the same icon of the vinegar bottle will appear in the Windows status bar.
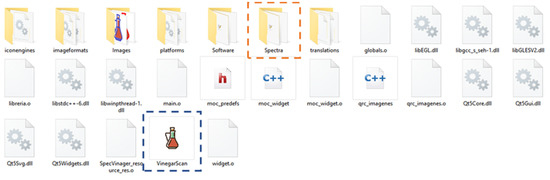
Figure 4.
Folders and files present in the computer location “C://VinegarScan” after successfully installing the software.
The VinegarScan GUI involves a single main window consisting of three buttons: Load, Start, and Exit (Figure 5). As can be seen in Figure 5, when the user runs the software for the first time, only the Load and the Exit buttons are available.

Figure 5.
Main screen of the graphical user interface (GUI) for the VinegarScan tool.
The Load button is used to load the samples in .txt format. After clicking on this button, a new screen will appear allowing us to select the spectrum to be analyzed. Once the sample is loaded, the graphical representation of the UV-vis spectrum will be displayed on the right side of the main screen and the Start button will be activated (Figure 6a). Once this Start button has been pressed, the visual inspection of the spectrum is possible and the result of the analysis will appear on the screen in three different ways, as shown in Figure 6b: The full name of the vinegar category in the Results box; the percentage of probability to be classified in this class in the Probability box; and an image of a vinegar bottle with a specific color for each category or type of vinegar, filled with a specific volume proportional to the percentage of probability of correct classification (Figure 7).
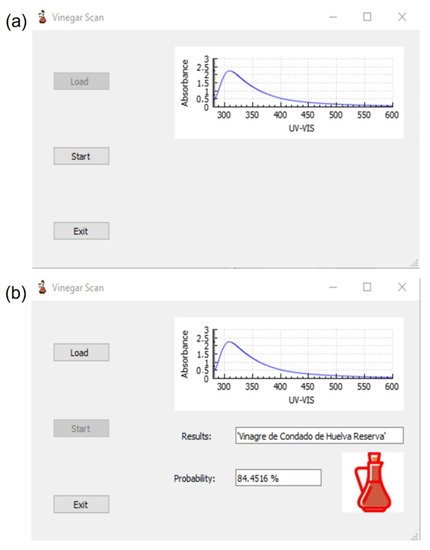
Figure 6.
Screens of the VinegarScan GUI: (a) screen once the spectrum has been loaded; (b) screen once the analysis has been performed by pressing the Start button.
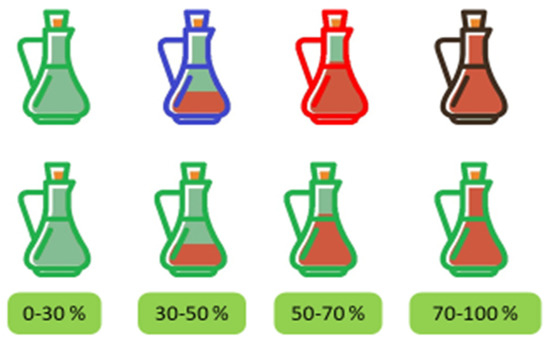
Figure 7.
Different colors and fill possibilities of the graphic representation of the vinegar bottle resulting from the analysis.
In the provided example (Figure 6b), the software has been able to identify the type and category of the vinegar sample correctly, “Vinagre del Condado de Huelva Reserva”, showing the probability of this prediction (84.4516%) and an image of a colored filled bottle of vinegar, which allows us to graphically identify which vinegar it is and what is the percentage of probability in this identification (in this case, a red bottle, almost full).
Four different colors have been established for the vinegar bottles: the bottle is red if the vinegar is from the PDO “Vinagre del Condado de Huelva”, the bottle is green if the vinegar is from the PDO “Vinagre de Jerez”, blue if the vinegar is from the PDO “Vinagre de Montilla-Moriles”, and black for the rest of the cases (rapid vinegars without PDO and without ageing). Figure 7 shows these colors as well the different fill level depending on the resulting probability percentage.
Finally, once the analysis has been performed, the Start button is deactivated and only the Exit button is active to exit the application and the Load button to load another spectrum, as shown in Figure 6b.
3.4. Test Results
Regarding the classification results of the test samples included in the software, 100% of the samples were correctly classified in their corresponding category. However, it could be seen that some of the percentages of probability provided by the software (Table 2) are sometimes low, although the classification was correct. This is explained by the fact that this % or probability was the one obtained for the global or final classification, that is, the classification probability obtained for the last level of the DT. This step was the ageing category within each PDO, whose difficulty was shown and discussed above (Figure 3). This is one of the reasons for the low percentages, although they were always higher than 50%, which allows to assign one or another category. It should be also considered that when we move through the lower steps of the DT, the number of samples decreases, which could be also the reason of the low % of probability obtained at the end. To improve the models, more data will be included with time (and availability from the producers). In addition, the percentages of probability obtained for prior steps, such as between “Aged” or “Not aged”, as well as between PDOs were higher than for the last step.
Table 2.
Classification results (i.e., identification of the type) and % of probability provided by VinegarScan tool for the test samples included as an example in the software.
In general, test samples of the PDO “Condado de Huelva” were the ones that showed higher percentage of probability of being from the category indicated by the software (i.e., with probability media of 72.5%), while within the different aging categories, the “Reserva” category was predicted with higher probability in general (about 85.8% for CRE and 60% for JRE and MRE) than the less aged ones.
3.5. Future Software Application
VinegarScan tool comprises a simple-to-use window with three buttons, a graphical representation area and a results area. Therefore, vinegar authentication could be done in a very intuitive and easy manner.
In the software validation, the model classification results and validation were satisfactory (a 100% correct classification in prediction). These results matched those described by Ríos-Reina et al. [17], where 100% of correct prediction rates were obtained for all the vinegar types and categories. Moreover, in that study, the limited number of samples, especially in the last step of the HCM, was compensated using the bootstrap resampling method [40]. In addition to the cross-validation procedure carried out in each model, this method confirmed the reliability of the model.
The usage of UV-vis spectroscopy might undergo several issues when compared with other spectroscopies. Nevertheless, going to specific scenarios of food quality assessment, many works can be found in the literature as example of successful applications of UV-vis technology in the authentication of wine, vinegars, and other foodstuff [15,18,41,42]. In addition, the capability of UV-vis for the authentication of vinegars has been also supported by a recently research paper of other authors [19].
The software approach, even being a first prototype, is simple but reliable. However, as it is said in the manuscript, we will keep improving the models by increasing the number of vinegars analyzed and optimizing the graphical interface with better visualization and extending its usefulness. This might lead in the future to change, if needed, the classification paradigm to a more evolved algorithm as neural network architecture. Moreover, another future idea of utility is to combine the VinegarScan tool with a portable UV-vis device. In this case, the GUI should have an extension with the necessary buttons to run the spectroscopic analysis first before addressing the data analysis with the VinegarScan tool. It should have a power button, a space to insert a quartz cuvette with the diluted vinegar sample, and a touch screen to control the device and the tool. Thus, the application usability of the GUI allows for upgrades to incorporate news functions and, in fact, the development of the GUI for advanced features and the possibility of combining it with a portable UV-vis device are in progress.
4. Conclusions
This paper describes a software tool for possible vinegar authentication. The VinegarScan GUI was demonstrated with a real-world dataset related to predicting the type and category of a vinegar. It is designed to be used by the end user, which can be from a trained producer or an employee of a certified lab service or a researcher, as the software prototype has very simple installation and use instructions, requiring only basic computer skills. Hence, due to this simplicity and because it allows the classification of a vinegar sample very quickly (1 min of UV-vis analysis, plus 1–2 min of data export, and less than 1 min in the use of the software), this tool could be implemented in the control laboratories of the Regulatory Councils of PDOs, as well as for inspectors, and could even be useful for the producers themselves, since the equipment is portable and would only need a computer in the cellar to perform a routine check of their vinegars.
The tool is based on the open-source engine WEKA with GUI created in C++, which makes it free to download and compatible with a Windows system. The analysis presented in this article can be replicated by following the steps illustrated in the paper and by using the spectral dataset of examples included inside the tool.
Satisfactory prediction results were achieved with this software running with the analytical UV-vis data that we had available (around 100%). However, to verify its correct operation and ensure more precise and correct classifications, it is necessary to expand the number of samples analyzed, including more control samples and samples from other origins, types, or even testing it with adulterated samples. Moreover, the authors’ future research will also be to design improvements for the initial version, upgrade and streamline its use and display, and design an associated portable UV-vis device adapted for in-situ applications.
Author Contributions
Conceptualization, R.M.C., D.L.G.-G. and J.M.A.; Methodology, S.M.A. and R.R.-R.; Software, D.C.; Validation, R.R.-R. and S.M.A.; Formal analysis, S.M.A.; Investigation, R.R.-R.; Resources, R.M.C.; Data curation, R.R.-R.; Writing—original draft preparation, R.R.-R., D.C. and S.M.A.; Writing—review and editing, R.M.C., D.L.G.-G. and J.M.A.; Supervision, J.M.A.; Project administration, R.M.C.; Funding acquisition, R.M.C. All authors have read and agreed to the published version of the manuscript.
Funding
This research was funded by “Consejería de Economía, Innovación y Ciencia” of “Junta de Andalucía” [P12-AGR-1601].
Institutional Review Board Statement
Not applicable.
Informed Consent Statement
Not applicable.
Data Availability Statement
The data and the software will be freely available after acceptation in the following website (www.hypertools.org (accessed on 15 October 2021)). Alternatively, they can be provided upon request to: josemanuel.amigo@ehu.eus.
Acknowledgments
We acknowledge the Regulatory Councils of the PDO wine vinegars for their invaluable help with the acquisition of the samples for this study. Moreover, the authors also thank to the Argentinian wineries for the samples provided. In addition, we would like to thank the University of Seville for the mobility grant for international staff dedicated to research that allowed Professor Azcarate to stay with our research group [VI Plan Propio De Investigación y Trasnferencia-US 2017], and the Ministerio de Educación, Cultura y Deporte for the Mobility grants for short stays and temporary relocations (2017) and for the FPU pre-doctoral fellowship [grant number FPU2014/01247].
Conflicts of Interest
The authors declare no conflict of interest.
References
- Xie, H.D.; Bu, L.J.; Peng, X.W.; Li, Z.X. Ultraviolet Spectroscopy Method for Classifying Vinegars. Adv. Mater. Res. 2011, 346, 865–874. [Google Scholar] [CrossRef]
- Chapman, J.; Gangadoo, S.; Truong, V.K.; Cozzolino, D. Spectroscopic approaches for rapid beer and wine analysis. Curr. Opin. Food Sci. 2019, 28, 67–73. [Google Scholar] [CrossRef]
- Cozzolino, D.; Cynkar, W.U.; Shah, N.; Smith, P.A. Can spectroscopy geographically classify Sauvignon Blanc wines from Australia and New Zealand? Food Chem. 2011, 126, 673–678. [Google Scholar] [CrossRef]
- Ríos-Reina, R.; Camiña, J.M.; Callejón, R.M.; Azcarate, S.M. Spectralprint techniques for wine and vinegar characterization, authentication and quality control: Advances and projections. TrAC—Trends Anal. Chem. 2021, 134, 116121. [Google Scholar] [CrossRef]
- Power, A.; Chapman, J.; Chandra, S.; Cozzolino, D. Ultraviolet-visible spectroscopy for food quality analysis. In Evaluation Technologies for Food Quality; Zhong, J., Wang, X., Eds.; Woodhead Publishing: Southston, UK, 2019; pp. 91–104. ISBN 9780128142172. [Google Scholar]
- Casale, M.; Bagnasco, L.; Casolino, C.; Lanteri, S.; Leardi, R. Spectroscopic fingerprinting techniques for food characterisation. Acta IMEKO 2016, 5, 32–35. [Google Scholar] [CrossRef] [Green Version]
- BOJA 15/10 Inscripción de la Denominación de Origen Protegida “Vinagre de Jerez”. Boletín Oficial de la Junta de Andalucía 2008, 184, 29–35. Available online: https://www.juntadeandalucia.es/organismos/agriculturaganaderiapescaydesarrollosostenible/areas/industrias-agroalimentarias/calidad/paginas/denominaciones-calidad-vinagres.html (accessed on 15 January 2021).
- BOJA 03/11 Inscripción de la Denominación de Origen Protegida “Vinagre de Montilla-Moriles”. Boletín Oficial de la Junta de Andalucía. 2008. Available online: https://www.juntadeandalucia.es/organismos/agriculturaganaderiapescaydesarrollosostenible/areas/industrias-agroalimentarias/calidad/paginas/denominaciones-calidad-vinagres.html (accessed on 15 January 2021).
- BOJA 15/10 Inscripción de la Denominación de Origen Protegida “Vinagre del Condado de Huelva”. Boletín Oficial de la Junta de Andalucía 2008, 184, 35–40. Available online: https://www.juntadeandalucia.es/organismos/agriculturaganaderiapescaydesarrollosostenible/areas/industrias-agroalimentarias/calidad/paginas/denominaciones-calidad-vinagres.html (accessed on 15 January 2021).
- Ríos-Reina, R.; Segura-Borrego, M.P.; García-González, D.L.; Morales, M.L.; Callejón, R.M. A comparative study of the volatile profile of wine vinegars with protected designation of origin by headspace stir bar sorptive extraction. Food Res. Int. 2019, 123, 298–310. [Google Scholar] [CrossRef] [PubMed]
- Ríos-Reina, R.; Segura-Borrego, M.P.; Morales, M.L.; Callejón, R.M. Characterization of the aroma profile and key odorants of the Spanish PDO wine vinegars. Food Chem. 2020, 311, 126012. [Google Scholar] [CrossRef]
- Ríos-Reina, R.; García-González, D.L.; Callejón, R.M.; Amigo, J.M. NIR spectroscopy and chemometrics for the typification of Spanish wine vinegars with a protected designation of origin. Food Control 2018, 89, 108–116. [Google Scholar] [CrossRef]
- Ríos-Reina, R.; Callejón, R.M.; Oliver-Pozo, C.; Amigo, J.M.; García-González, D.L. ATR-FTIR as a potential tool for controlling high quality vinegar categories. Food Control 2017, 78, 230–237. [Google Scholar] [CrossRef]
- Ríos-Reina, R.; Elcoroaristizabal, S.; Ocaña-González, J.A.; García-González, D.L.; Amigo, J.M.; Callejón, R.M. Characterization and authentication of Spanish PDO wine vinegars using multidimensional fluorescence and chemometrics. Food Chem. 2017, 230, 108–116. [Google Scholar] [CrossRef] [Green Version]
- Geana, E.I.; Ciucure, C.T.; Apetrei, C.; Artem, V. Application of spectroscopic UV-Vis and FT-IR screening techniques coupled with multivariate statistical analysis for red wine authentication: Varietal and vintage year discrimination. Molecules 2019, 24, 4166. [Google Scholar] [CrossRef] [Green Version]
- Torrecilla, J.S.; Aroca-Santos, R.; Cancilla, J.C.; Matute, G. Linear and non-linear modeling to identify vinegars in blends through spectroscopic data. LWT—Food Sci. Technol. 2016, 65, 565–571. [Google Scholar] [CrossRef]
- Ríos-Reina, R.; Azcarate, S.M.; Camiña, J.; Callejón, R.M.; Amigo, J.M. Application of hierarchical classification models and reliability estimation by bootstrapping, for authentication and discrimination of wine vinegars by UV–vis spectroscopy. Chemom. Intell. Lab. Syst. 2019, 191, 42–53. [Google Scholar] [CrossRef]
- Ríos-Reina, R.; Azcarate, S.M.; Camiña, J.M.; Callejón, R.M. Sensory and spectroscopic characterization of Argentinean wine and balsamic vinegars: A comparative study with European vinegars. Food Chem. 2020, 323, 126791. [Google Scholar] [CrossRef]
- González-Domínguez, R.; Sayago, A.; Fernández-Recamales, Á. Potential of ultraviolet-visible spectroscopy for the differentiation of spanish vinegars according to the geographical origin and the prediction of their functional properties. Foods 2021, 10, 1830. [Google Scholar] [CrossRef]
- Ballabio, D.; Vasighi, M. A MATLAB toolbox for Self Organizing Maps and supervised neural network learning strategies. Chemom. Intell. Lab. Syst. 2012, 118, 24–32. [Google Scholar] [CrossRef]
- Bro, R. Multiway calibration. Multilinear PLS. J. Chemom. 1996, 10, 47–61. [Google Scholar] [CrossRef]
- Caballero, D.; Caro, A.; Rodríguez, P.G.; Durán, M.L.; Del Mar Ávila, M.; Palacios, R.; Antequera, T.; Pérez-Palacios, T. Modeling salt diffusion in Iberian ham by applying MRI and data mining. J. Food Eng. 2016, 189, 115–122. [Google Scholar] [CrossRef]
- Mitchell, T.M. Machine learning and data mining. Commun. ACM 1999, 42, 30–36. [Google Scholar] [CrossRef]
- Molano, R.; Rodríguez, P.G.; Caro, A.; Durán, M.L. Finding the largest area rectangle of arbitrary orientation in a closed contour. Appl. Math. Comput. 2012, 218, 9866–9874. [Google Scholar] [CrossRef]
- Gil-Sánchez, L.; Garcia-Breijo, E.; Garrigues, J.; Alcañiz, M.; Escriche, I.; Kadar, M. Classification of honeys of different floral origins by artificial neural networks. Proc. IEEE Sens. 2011, 1780–1783. [Google Scholar] [CrossRef]
- Mishra, P.; Roger, J.M.; Marini, F.; Biancolillo, A.; Rutledge, D.N. FRUITNIR-GUI: A graphical user interface for correcting external influences in multi-batch near infrared experiments related to fruit quality prediction. Postharvest Biol. Technol. 2021, 175, 111414. [Google Scholar] [CrossRef]
- Lu, Y.; Lu, R. SIRITOOL: A Matlab graphical user interface for image analysis in structured-illumination reflectance imaging for fruit defect detection. Am. Soc. Agric. Biol. Eng. 2020, 63, 1037–1047. [Google Scholar] [CrossRef]
- Predic, B.; Ilic, M.; Spalevic, P.; Trajkovic, S.; Jovic, S.; Stanic, A. Data mining based tool for early prediction of possible fruit pathogen infection. Comput. Electron. Agric. 2018, 154, 314–319. [Google Scholar] [CrossRef]
- Blanchette, J.; Summerfield, M. C++ GUI Programming with Qt 4; Robbins, A., Ed.; Prentice Hall Publishing: Westford, MA, USA, 2008; ISBN 978-0-13-714397-9. [Google Scholar]
- Vens, C.; Struyf, J.; Schietgat, L.; Džeroski, S.; Blockeel, H. Decision trees for hierarchical multi-label classification. Mach. Learn. 2008, 73, 185–214. [Google Scholar] [CrossRef] [Green Version]
- Costa, E.P.; Lorena, A.C.; Carvalho, A.C.P.L.F.; Freitas, A.A.; Holden, N. Comparing several approaches for hierarchical classification of proteins with decision trees. In Brazilian Symposium on Bioinformatics; Springer: Berlin/Heidelberg, Germany, 2007; Volume 4643, pp. 126–137. [Google Scholar] [CrossRef] [Green Version]
- Drazin, S.; Montag, M. Decision Tree Analysis using Weka. In Machine Learning-Project II; University of Miami: Coral Gables, FL, USA, 2012; pp. 1–3. [Google Scholar]
- Safavian, S.R.; Landgrebe, D. A Survey of Decision Tree Classifier Methodology. IEEE Trans. Syst. Man Cybern. 1991, 21, 660–674. [Google Scholar] [CrossRef] [Green Version]
- Salzberg, S.L. C4.5: Programs for Machine Learning by J. Ross Quinlan. Morgan Kaufmann Publishers, Inc., 1993. Mach. Learn. 1994, 16, 235–240. [Google Scholar] [CrossRef] [Green Version]
- Caballero, D.; Asensio, M.; Fernández, C.; Martín, N.; Silva, A. Classifying different Iberian pig genetic lines by applying chemical–instrumental parameters of dry-cured Iberian shoulders. J. Food Sci. Technol. 2018, 55, 4589–4599. [Google Scholar] [CrossRef]
- Caballero, D.; Asensio, M.; Fernández, C.; Reina, R.; García-Casco, J.; Martín, N.; Silva, A. Chemical-instrumental-sensory traits and data mining for classifying dry-cured Iberian shoulders from pigs with different diets. J. Food Meas. Charact. 2019, 13, 2935–2950. [Google Scholar] [CrossRef]
- Anyanwu, M.N.; Shiva, S. Comparative Analysis of Serial Decision Tree Classification Algorithms. Int. J. Comput. Sci. Secur. 2009, 3, 230–240. [Google Scholar]
- Priyam, A.; Gupta, R.; Rathee, A.; Srivastava, S. Comparative Analysis of Decision Tree Classification Algorithms. Int. J. Curr. Eng. Technol. 2013, 3, 334–337. [Google Scholar]
- Bramer, M. Principles of Data Mining; Springer: London, UK, 2016; ISBN 9781447173076. [Google Scholar]
- Efron, B. Bootstrap Methods: Another Look at the Jackknife. Ann. Stat. 1979, 7, 1–26. [Google Scholar] [CrossRef]
- Azcarate, S.M.; Cantarelli, M.Á.; Pellerano, R.G.; Marchevsky, E.J.; Camiña, J.M. Classification of argentinean sauvignon blanc wines by UV spectroscopy and chemometric methods. J. Food Sci. 2013, 78, 432–436. [Google Scholar] [CrossRef] [PubMed]
- Sen, I.; Tokatli, F. Differentiation of wines with the use of combined data of UV-visible spectra and color characteristics. J. Food Compos. Anal. 2016, 45, 101–107. [Google Scholar] [CrossRef] [Green Version]
Publisher’s Note: MDPI stays neutral with regard to jurisdictional claims in published maps and institutional affiliations. |
© 2021 by the authors. Licensee MDPI, Basel, Switzerland. This article is an open access article distributed under the terms and conditions of the Creative Commons Attribution (CC BY) license (https://creativecommons.org/licenses/by/4.0/).