Article

A Practical Hydrazine-Carbothioamide-Based Fluorescent Probe for the Detection of Zn2+: Applications to Paper Strip, Zebrafish and Water Samples

1
Department of Fine Chem, Seoul National University of Science and Technology, Seoul 01811, Korea
2
Department of Environment Engineering, Seoul National University of Science and Technology, Seoul 01166, Korea
*
Authors to whom correspondence should be addressed.
Chemosensors 2022, 10(1), 32; https://doi.org/10.3390/chemosensors10010032
Submission received: 30 November 2021 / Revised: 6 January 2022 / Accepted: 10 January 2022 / Published: 12 January 2022
(This article belongs to the Special Issue Feature Papers on Optical Chemical Sensors and Biosensors)

Abstract

:
A practical hydrazine-carbothioamide-based fluorescent chemosensor TCC (N-(4-chlorophenyl)-2-(thiophene-2-carbonyl)hydrazine-1-carbothioamide) was applied for Zn2+ detection. TCC exhibited selective fluorescence emission for Zn2+ and did not show any interference with other metal ions. In particular, TCC was utilized for the detection of Zn2+ in paper strips, zebrafish and real water samples. TCC could detect Zn2+ down to 0.39 μM in the solution phase and 51.13 μM in zebrafish. The association ratio between TCC and Zn2+ was determined to be 2:1 by ESI-mass and Job plot. The sensing mechanism of TCC for Zn2+ was illustrated to be a chelation-enhanced fluorescence process through spectroscopic experiments and theoretical calculations.

1. Introduction

Zinc is a crucial trace nutrient for organisms and the second-most plentiful transition metal in the body [1,2,3,4]. For decades, zinc has been noted for its pivotal roles involved in biological processes, such as the growth of living organisms, neural signal transmission and gene transcription [5,6,7,8]. Due to the various functions of zinc in biological processes, however, an unbalance of zinc has been associated with various pathological troubles [9,10,11].
Particularly, zinc deficiency in the human body results in a severe effect on impaired taste, depressed immunity, delayed sexual maturation and growth defects [12]. In contrast, too much zinc can lead to neurodegenerative damage, including infantile diarrhea, Alzheimer’s disease, diabetes and Parkinson’s disease [13,14]. Thus, there is an imperative need to develop tools that can prevent undue exposure to zinc in living organisms.
The zinc detection methods reported thus far include atomic absorption spectrometry, electrochemistry, potentiometry and fluorescence spectroscopy [15,16,17,18,19,20,21,22]. Among them, chemosensors based on fluorescence spectroscopy have been a useful method for sensing of Zn2+ due to the fast response, high selectivity and sensitivity, ease of manipulation and bioimaging ability [23,24,25,26].
Hitherto, several studies have reported that fluorescent probes based on naphthalene, coumarin, phenanthrene, anthracene, rhodamine, antipyrine and triazole have been applied to the sensing of Zn2+ [27,28,29,30,31,32,33]. However, there are still many disadvantages, such as complex synthesis processes and difficulty in bioimaging. Thus, it is necessary to develop an easily accessible fluorescent chemosensor for detecting zinc in biological systems.
Thiourea has attracted attention for its capability to bind to metals [34,35]. In particular, the sulfur atom in thiourea prefers to chelate with soft metal ions, such as Zn2+ and Hg2+, through the hard-soft acid base theory [36,37,38]. In order to selectively detect only Zn2+ with the thiourea moiety, we intended to endow a hard character to the thiourea by combination with hydrazine with hard base nitrogen atoms [39,40].
Moreover, hydrazine has a water-soluble character [41]. To keep these properties in mind, we designed and found the compound TCC, including the thiourea and hydrazine moieties, as reported in the literature [42,43]. We applied TCC as a sensor with the expectation that it could coordinate well to zinc ion and might be soluble in water for biological applications.
Herein, we address a practical hydrazine-carbothioamide-based fluorescent sensor TCC for detecting Zn2+. TCC exhibited selective fluorescence emission for only Zn2+ and all the other cations did not interfere with the fluorescence emission of TCC to Zn2+. Significantly, TCC was a suitable chemosensor capable of detecting Zn2+ with practical applications, such as real water samples, paper-strips and zebrafish. TCC could detect down to 0.39 μM of Zn2+ in the solution phase and 51.13 μM of Zn2+ in zebrafish. The sensing interaction of TCC for Zn2+ was demonstrated by ESI-mass, 1H NMR titration, calculations, fluorescent experiments and UV-vis titration.

2. Experiments

2.1. Materials and Equipment

All the chemicals were supplied by Sigma–Aldrich (Burlington, MA, USA). A Varian spectrometer was employed to obtain 1H NMR and 13C NMR. Perkin Elmer model spectrometers were employed to obtain the absorption and fluorescent spectra. ESI-mass measurements were conducted using a Thermo MAX instrument (Molecular Devices, San Jose, CA, USA).

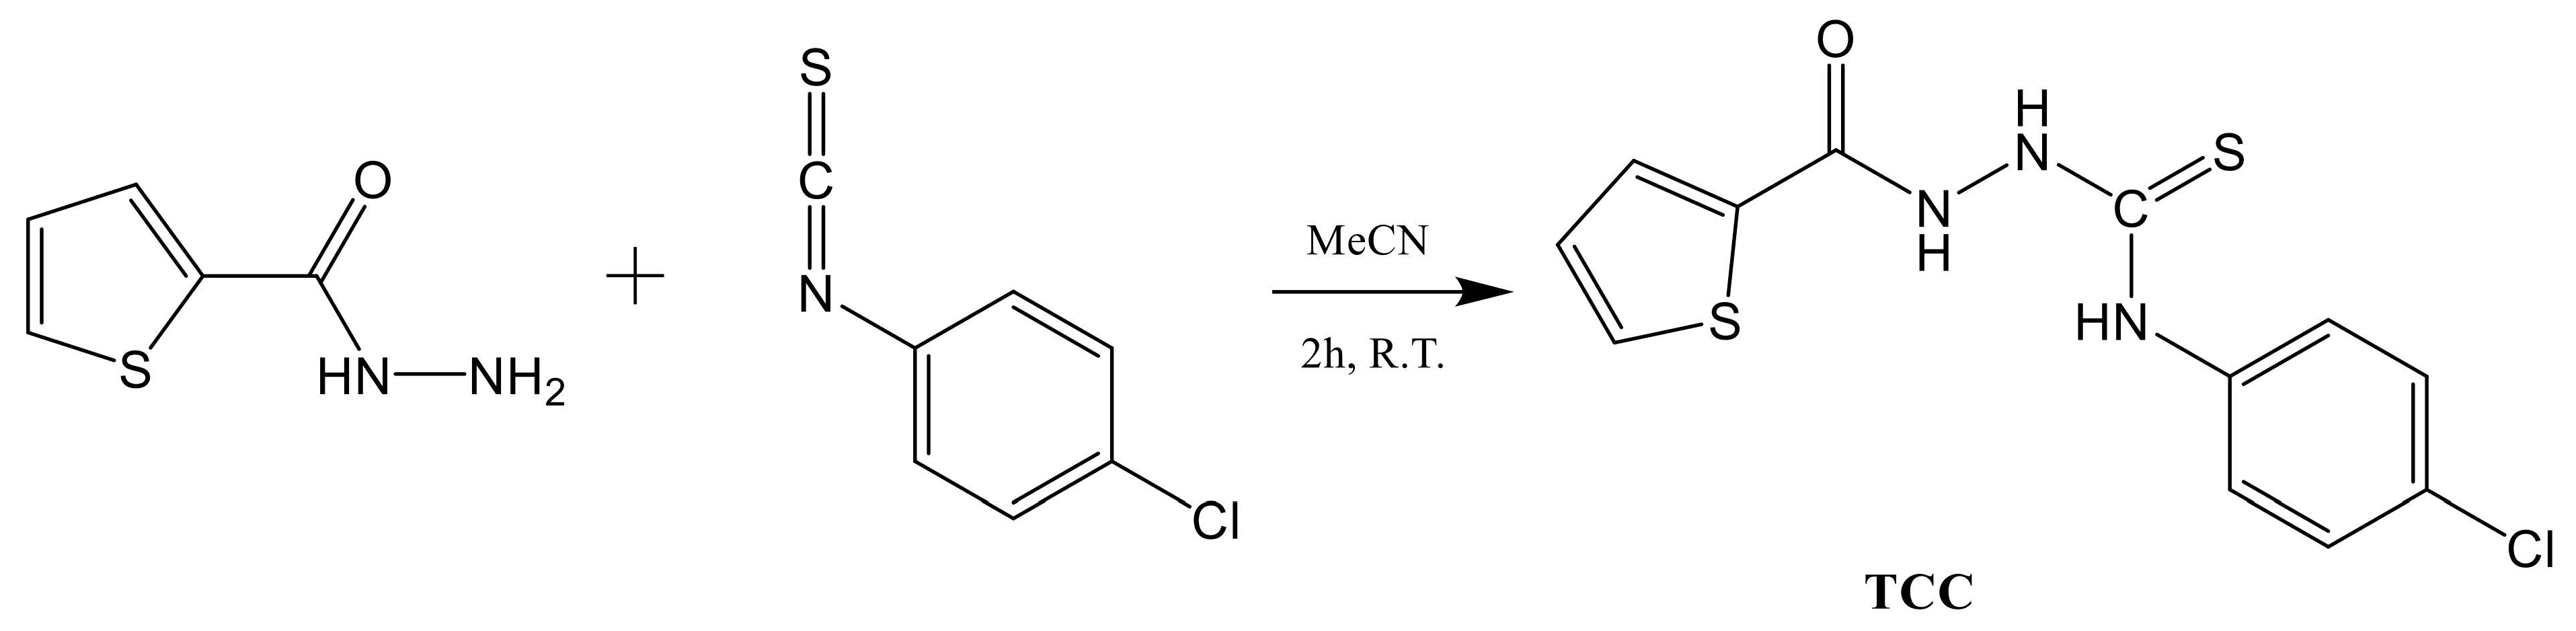
2.2. Synthesis of TCC (N-(4-Chlorophenyl)-2-(thiophene-2-carbonyl)hydrazine-1-carbothioamide)

The compound TCC reported in the literature [42,43] was synthesized in reaction solvent acetonitrile as follows (Scheme 1). Thiophene-2-carbohydrazide (128 mg, 9.0 × 10⁻⁴ mol) and 1-chloro-4-isothiocyanatobenzene (170 mg, 1.0 × 10⁻³ mol) were dissolved in 5.0 mL acetonitrile. The resulting solution was shaken for 2 h at room temperature. The white powder produced was collected by filtration, washed with diethyl ether and dried at 60 °C for 4 h (yield: 75%).
TCC was affirmed by 1H, 13C NMR and ESI-MS (Figures S1–S3). 1H NMR (DMSO-d6): 10.60 (s, 1H), 9.95 (s, 1H), 9.92 (s, 1H), 7.87 (d, 2H), 7.60 (s, 1H), 7.47 (d, 1H), 7.35 (t, 1H), 7.21 (d, 2H). 13C NMR (DMSO-d6): 140.73 (1C), 137.33 (1C), 131.73 (2C), 129.55 (3C), 127.99 (2C) and 124.73 (3C). ESI-MS for [TCC + H+ + H2O]+, calcd, 330.01 (m/z); found, 330.08. Water solubility of TCC: 0.11 g/L (Figure S4).

2.3. Fluorescent and UV-Vis Titrations
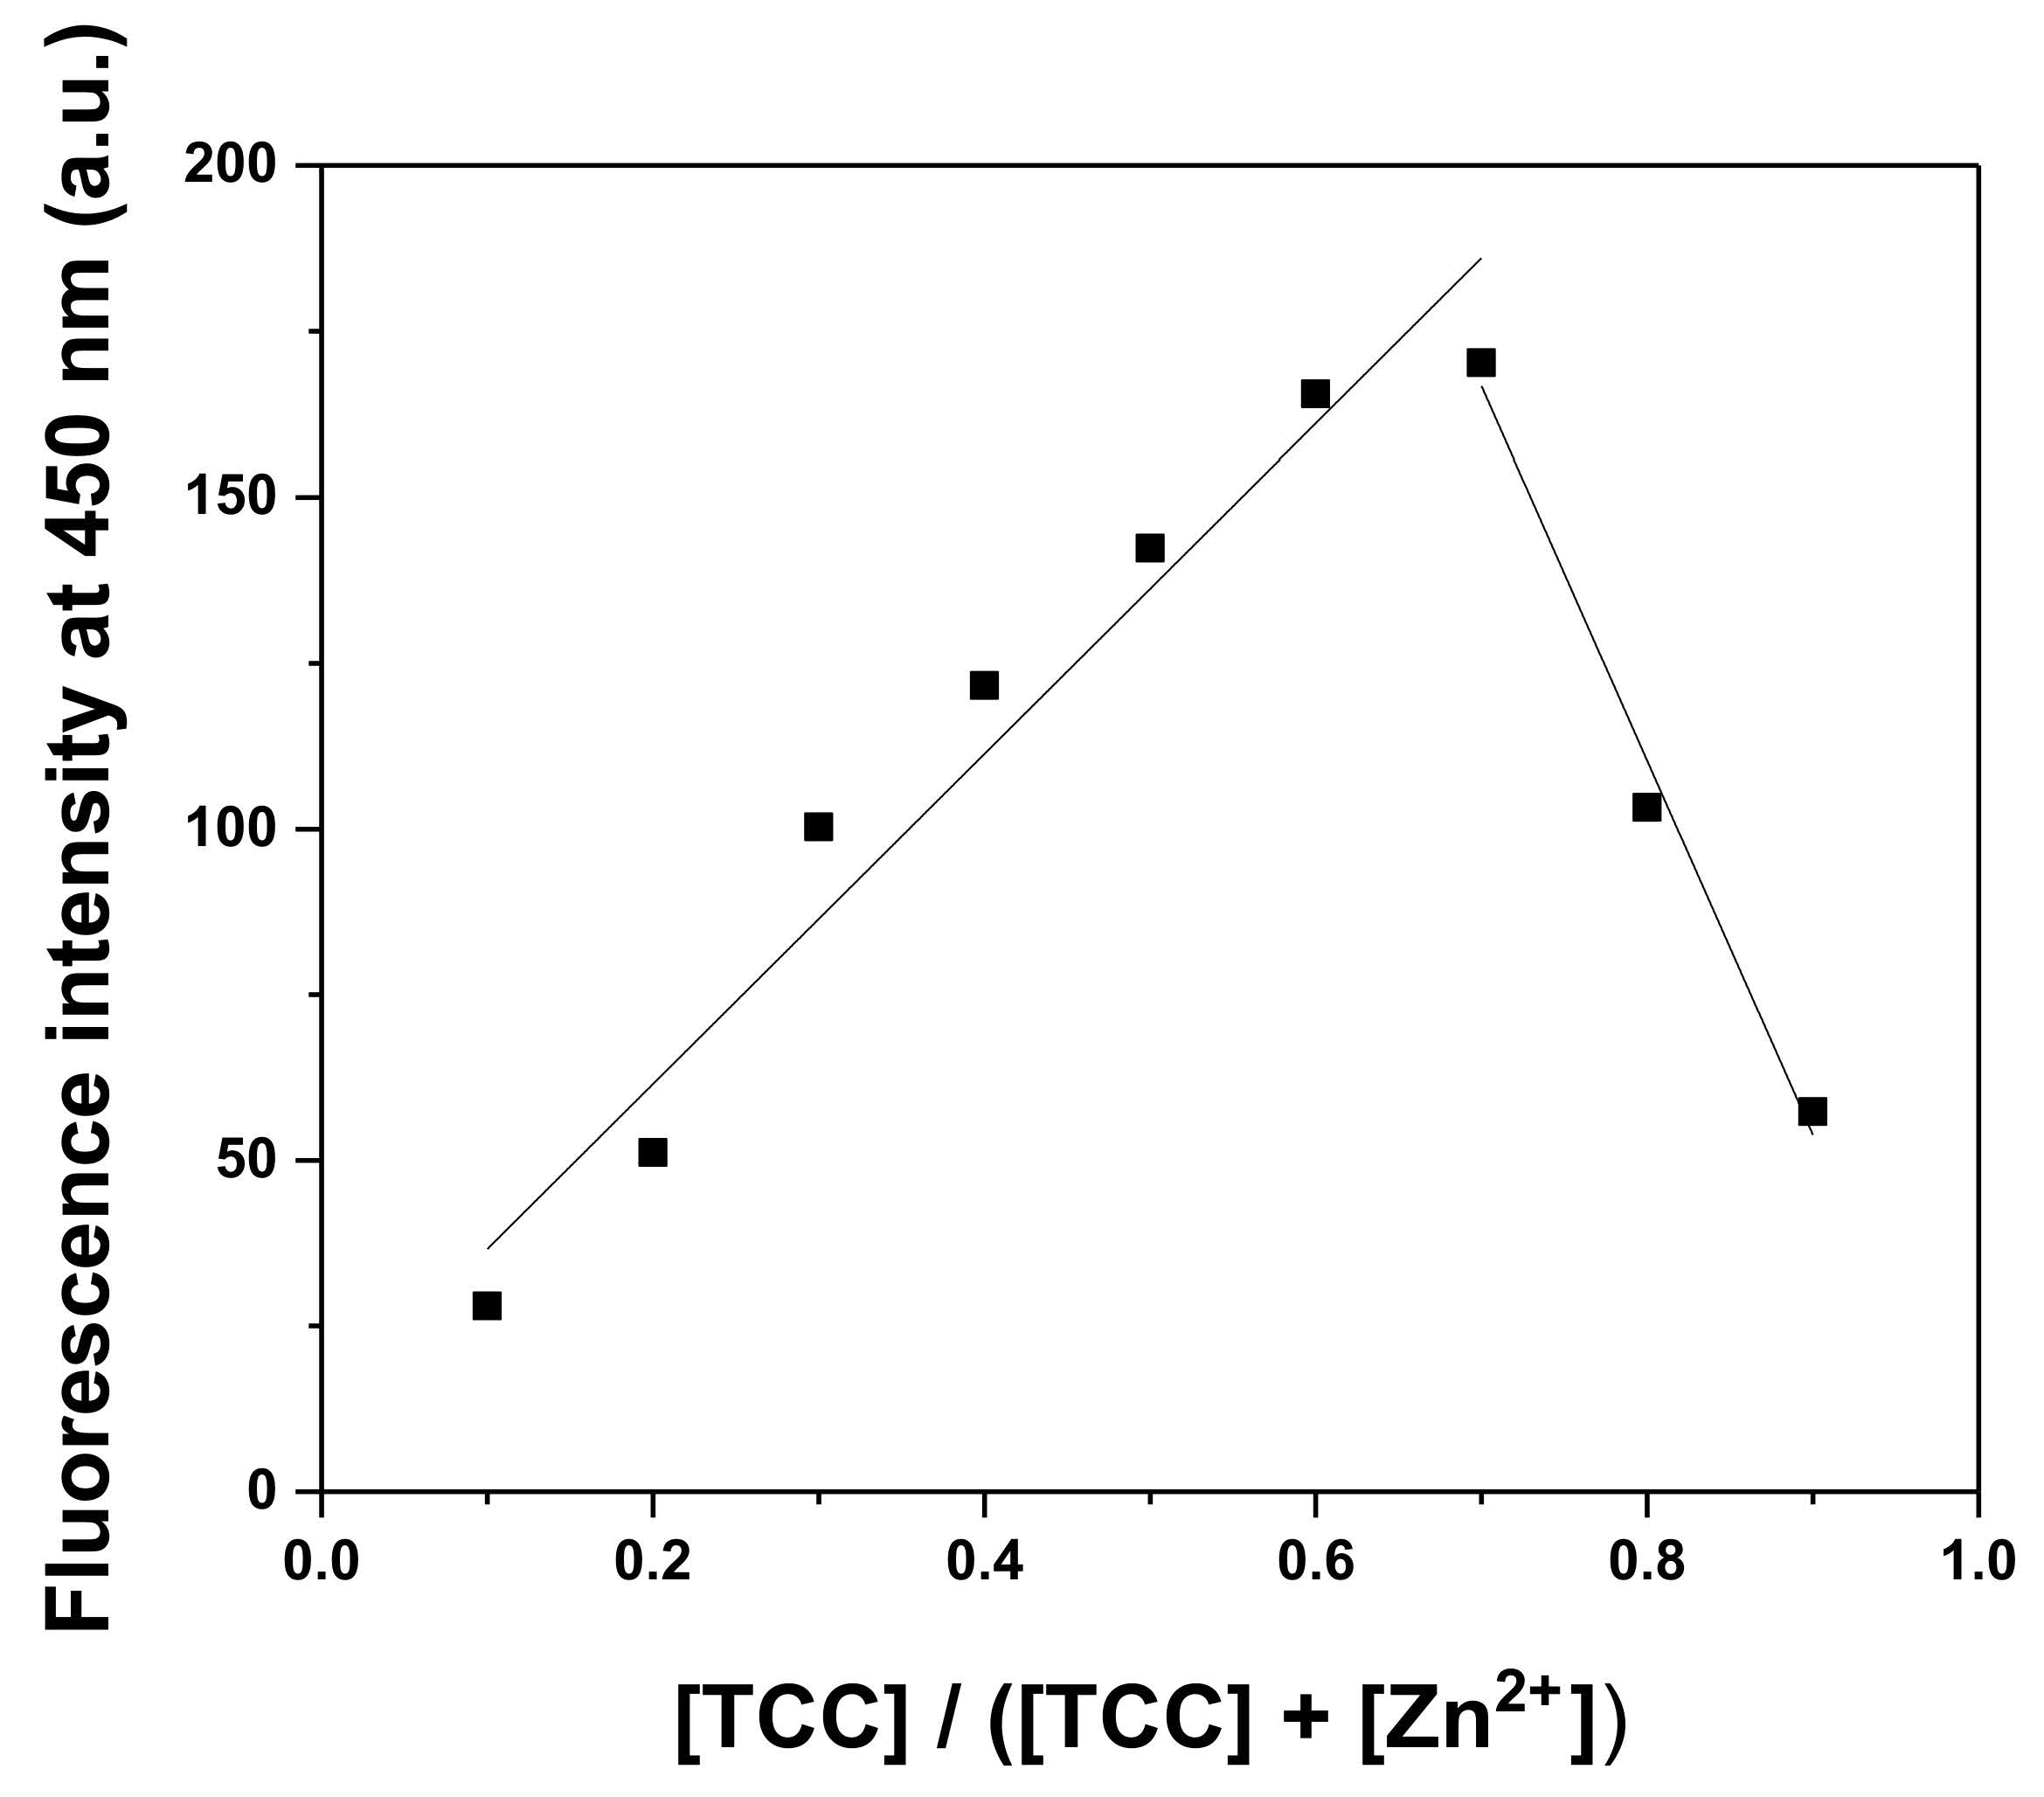
TCC (3.1 mg, 2.0 × 10⁻⁵ mol) was dissolved in 1.0 mL DMF to make a stock (2.0 × 10⁻² M). We added 6 μL of the TCC stock to 2.990 mL bis-tris buffer (1 × 10⁻² M, pH 7.0) to make 40 μM. Zn(NO3)2 (15.2 mg, 5 × 10⁻⁵ mol) was dissolved in 5 mL buffer to make a Zn2+ stock (1.0 × 10⁻² M). We added 1.2–20.4 μL of the Zn2+ stock to TCC (40 μM). After blending them for 5 s, their fluorescent and UV-vis data were obtained.

2.4. Job Plot

Two stock solutions, TCC (2.0 × 10⁻² M) and Zn2+ (1.0 × 10⁻² M), were prepared as described in titration section. We diluted 100 μL of the TCC stock in 49.9 mL buffer to give 4 × 10⁻⁵ M, and 200 μL of the Zn2+ stock was diluted to 49.9 mL buffer to afford 4 × 10⁻⁵ M. We delivered 0.3–2.7 mL of the diluted TCC to the UV-vis cell. The diluted Zn2+ was delivered to the cells to provide 3 mL. After blending them for 5 s, fluorescent data were obtained.

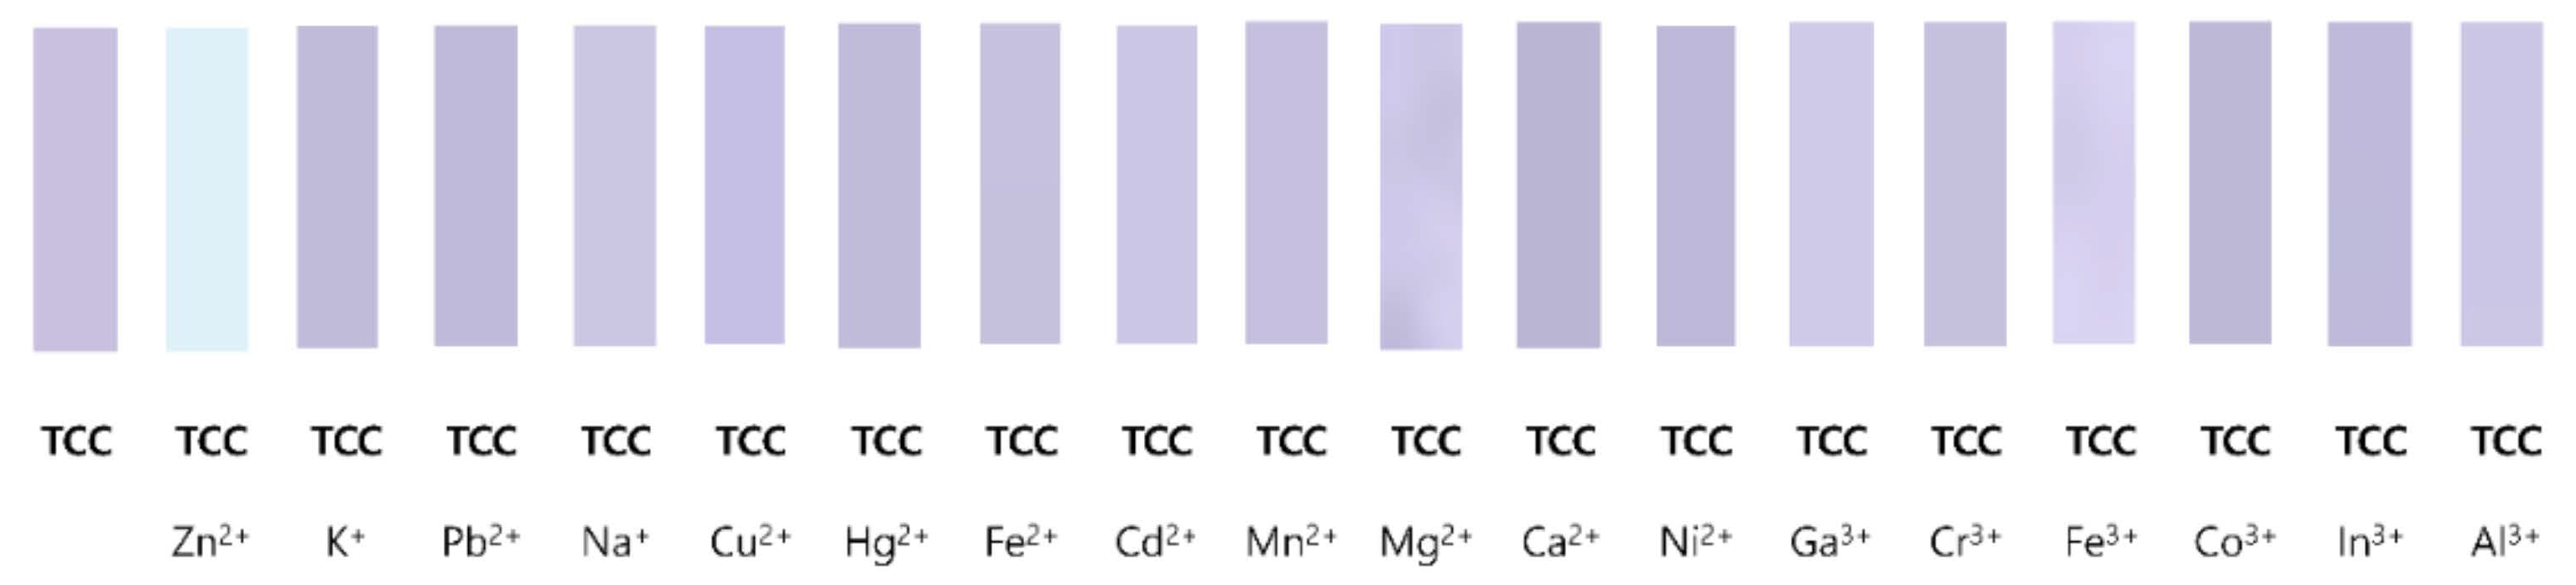
2.5. Competitive Tests

The TCC (40 μM) solution was prepared as mentioned in the titration section. To provide metal stocks (1.0 × 10⁻² M), 5x10⁻⁵ mol of various cations (Zn2+, K+, Pb2+, Na+, Cu2+, Hg2+, Fe2+, Cd2+, Mn2+, Mg2+, Ca2+, Ni2+, Ga3+, Cr3+, Fe3+, Co3+, In3+ and Al3+) was dissolved separately in 5 mL of buffer. We added 19.2 μL of each metal stock (1.0 × 10⁻² M) into TCC (40 μM). Then, 19.2 μL of Zn(NO3)2 stock (1.0 × 10⁻² M) was delivered to the mixed solution of TCC and each metal. Fluorescent data were obtained after blending them for 5 s.

2.6. 1H NMR Titration

Four NMR glass tubes of TCC (3.1 mg, 1.0 × 10⁻⁵ mol) dissolved in deuterated DMF (1.0 mL) were prepared. We added 0–20 μL (0–2.0 equiv) of Zn2+ dissolved in deuterated DMF to the TCC. After blending these for 5 s, their 1H NMR spectra were obtained.

2.7. pH Test

A diverse pH range (6–9) of buffer solutions was prepared by mixing KOH and HCl in Tris-HCl buffer and bis-tris buffer. We placed 6 μL of TCC (2.0 × 10⁻² M) stock into 2.99 mL buffer solutions to produce 4.0 × 10⁻⁵ M. We added 19.2 μL of a Zn2+ solution (1.0 × 10⁻² M) to each TCC solution (4.0 × 10⁻⁵ M). After blending them for 5 s, fluorescent data were obtained.

2.8. Water Sample

To analyze the utilization of TCC for Zn2+ in real water samples, tap and drinking water were prepared in our laboratory. A TCC stock (2.0 × 10⁻² M) was prepared as described in titration section. We added 6 µL of the TCC stock to a 2.99 mL water sample containing Zn2+ (8.00 µM). After blending for 5 s, fluorescent data were obtained.

2.9. Fluorescent Paper-Strips

The TCC-paper strips were provided by soaking the filter papers in TCC (2 × 10⁻² M, DMF) and drying them. TCC-paper strips were added to 1 mM of metal ions in buffer. After drying, their photographs were taken.

2.10. Zebrafish Imaging

The 6-day-old zebrafish were reared under our former conditions [44]. Before proceeding with the imaging experiment, we prepared a TCC stock (2.0 × 10⁻² M) and a Zn2+ stock (1.0 × 10⁻² M). We added 50 µL of the TCC stock to 19.95 mL E2 media. The zebrafish were incubated with TCC (50 µM) in E2 media with 0.3% DMSO for 15 min and then washed with E2 media.
The zebrafish were separated into four groups. One was a control group, and the other groups were further treated with 150, 250 or 500 μM of Zn2+ for 15 min. The zebrafish were anesthetized by ethyl-3-aminobenzoate methanesulfonate. A few seconds later, we conducted all the imaging experiments using a fluorescence microscope. With Icy software, the mean fluorescence intensity of the images was analyzed.

2.11. Theoretical Studies

Theoretical calculations for TCC and TCC-Zn2+ were studied using the Gaussian 16 program [45]. The DFT method was employed for geometry optimizations [46,47]. The B3LYP and 6–31G(d,p) basis set was employed for all atoms except Zn2+ [48,49]. In the case of TCC-Zn2+, the LANL2DZ basis set was applied to Zn2+ [50,51,52]. None of the imaginary frequency appeared in the optimized-patterns and local minima of TCC and TCC-Zn2+ were verified. The solvent effect of water was dealt with IEFPCM [53]. The thirty probable UV-vis transition states were calculated with the TD-DFT method based on the energy-optimized patterns of TCC and TCC-Zn2+.

3. Results and Discussion

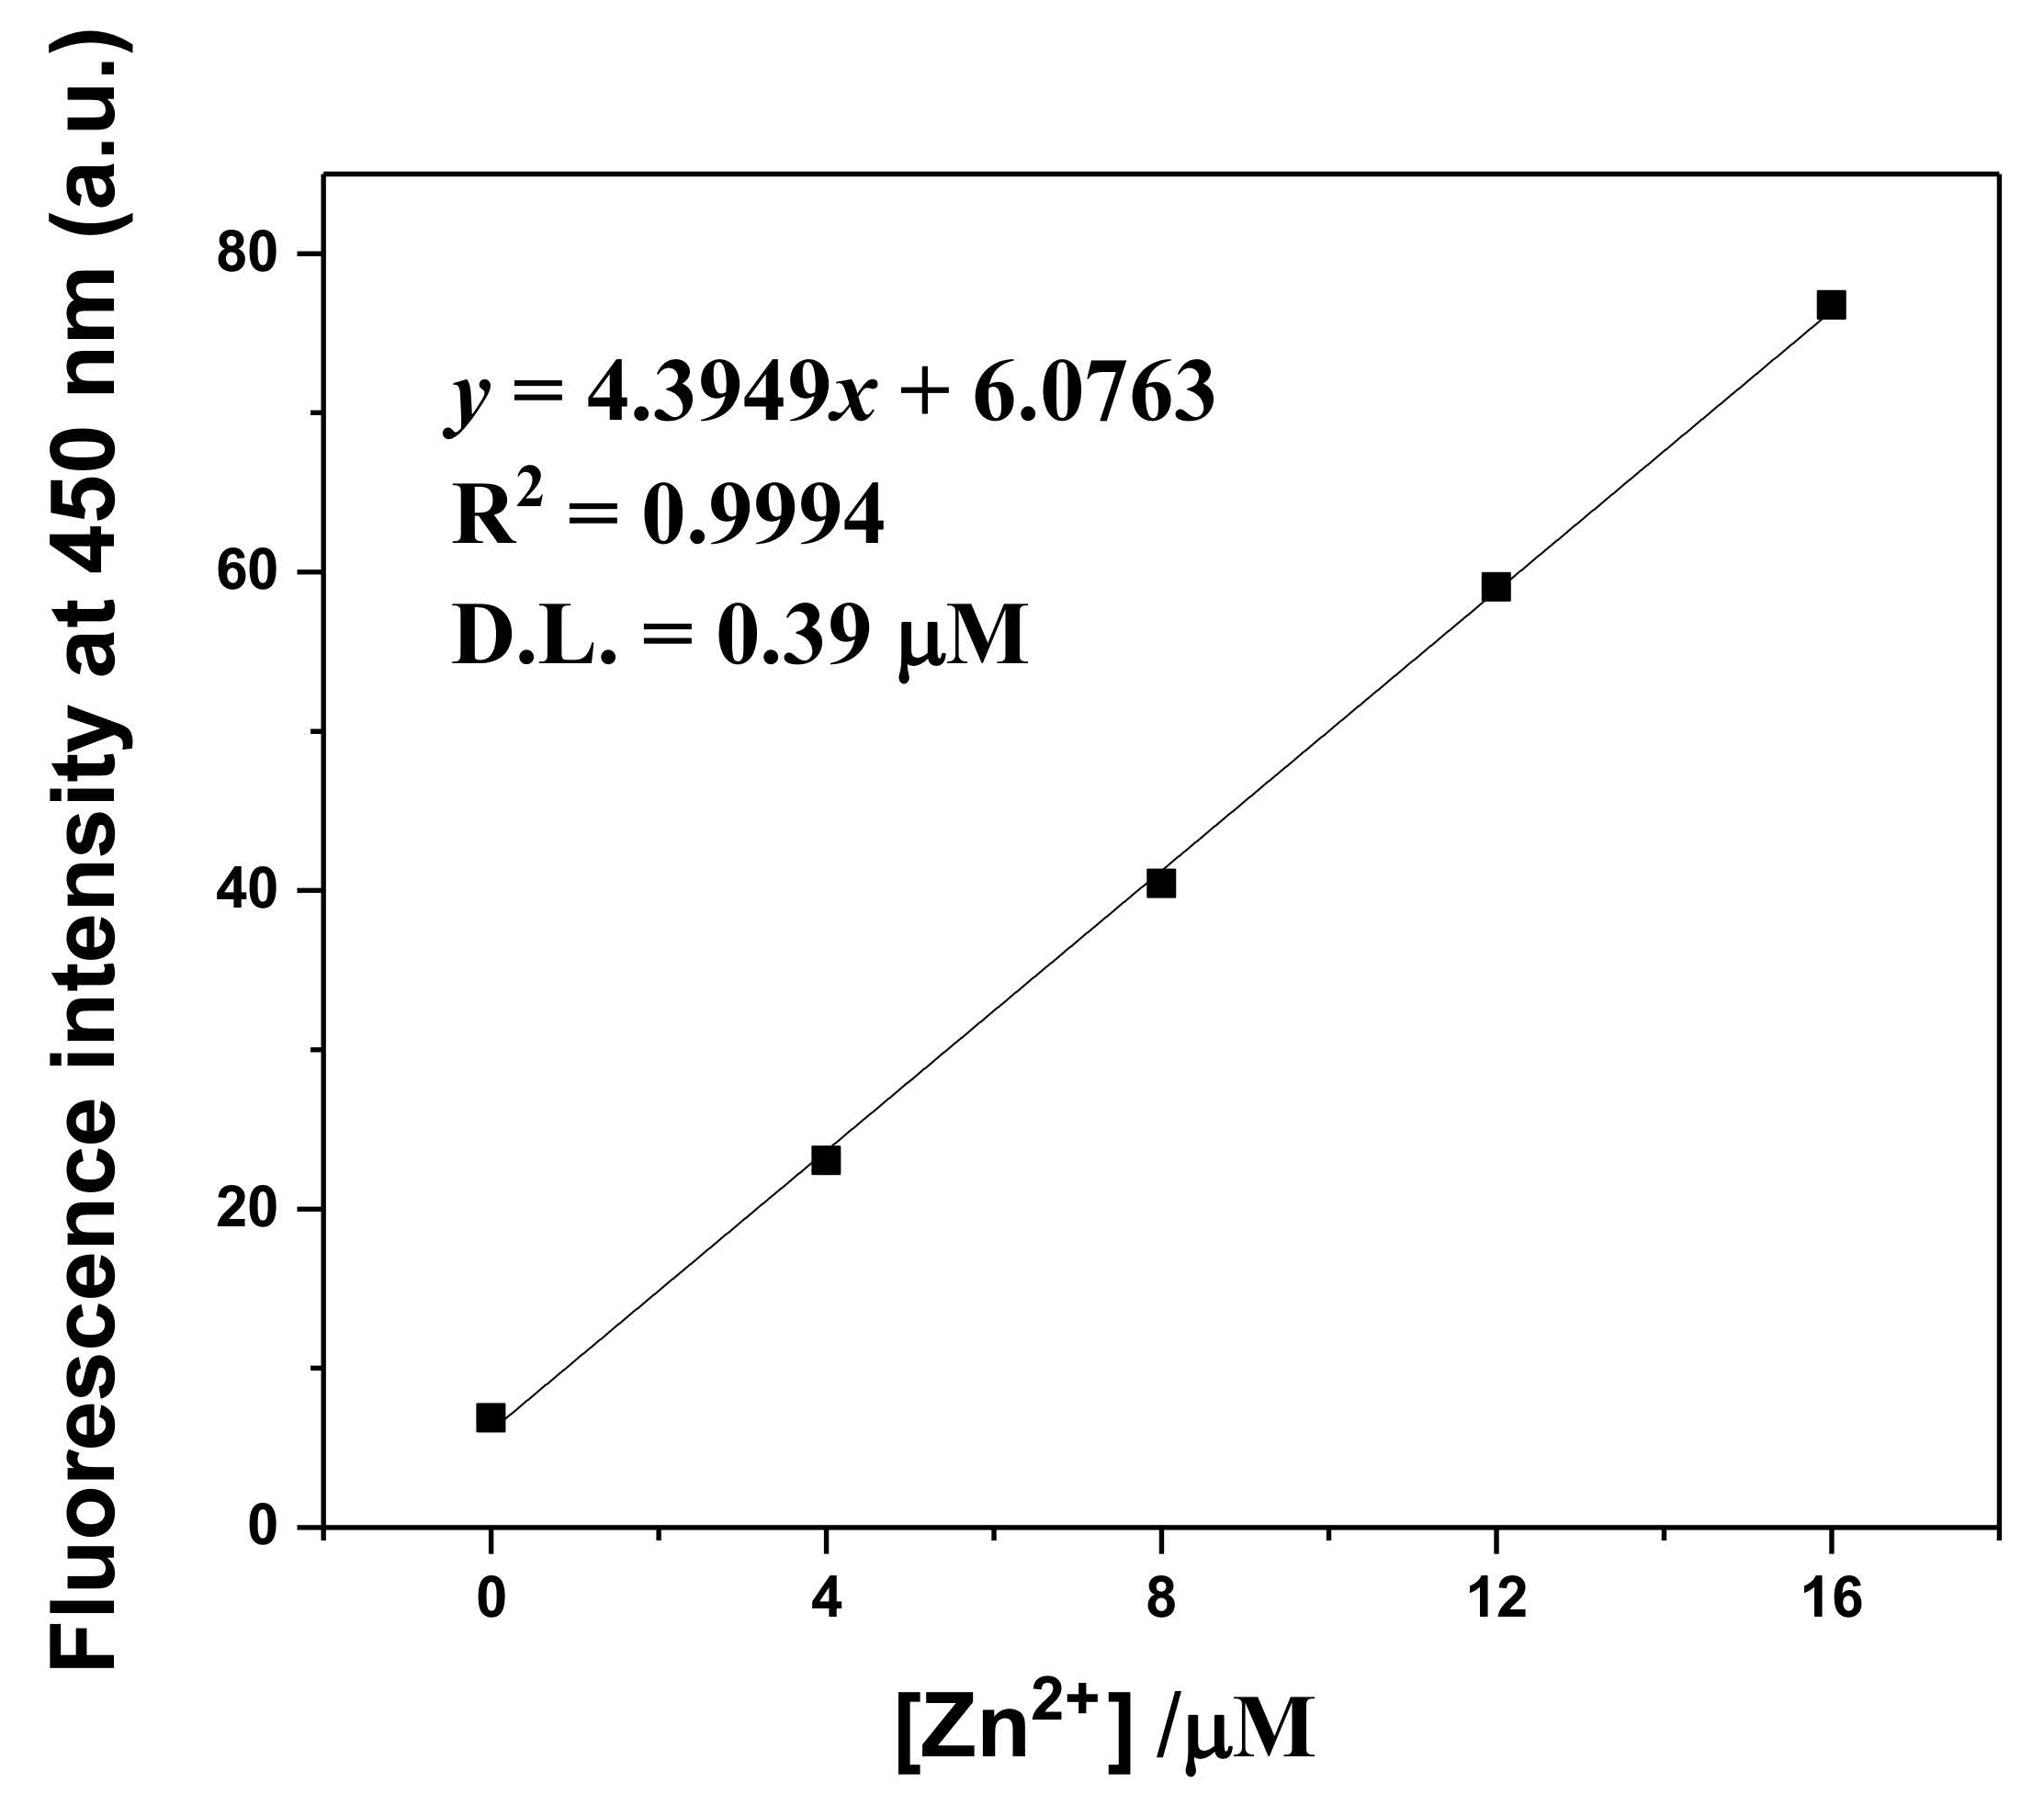
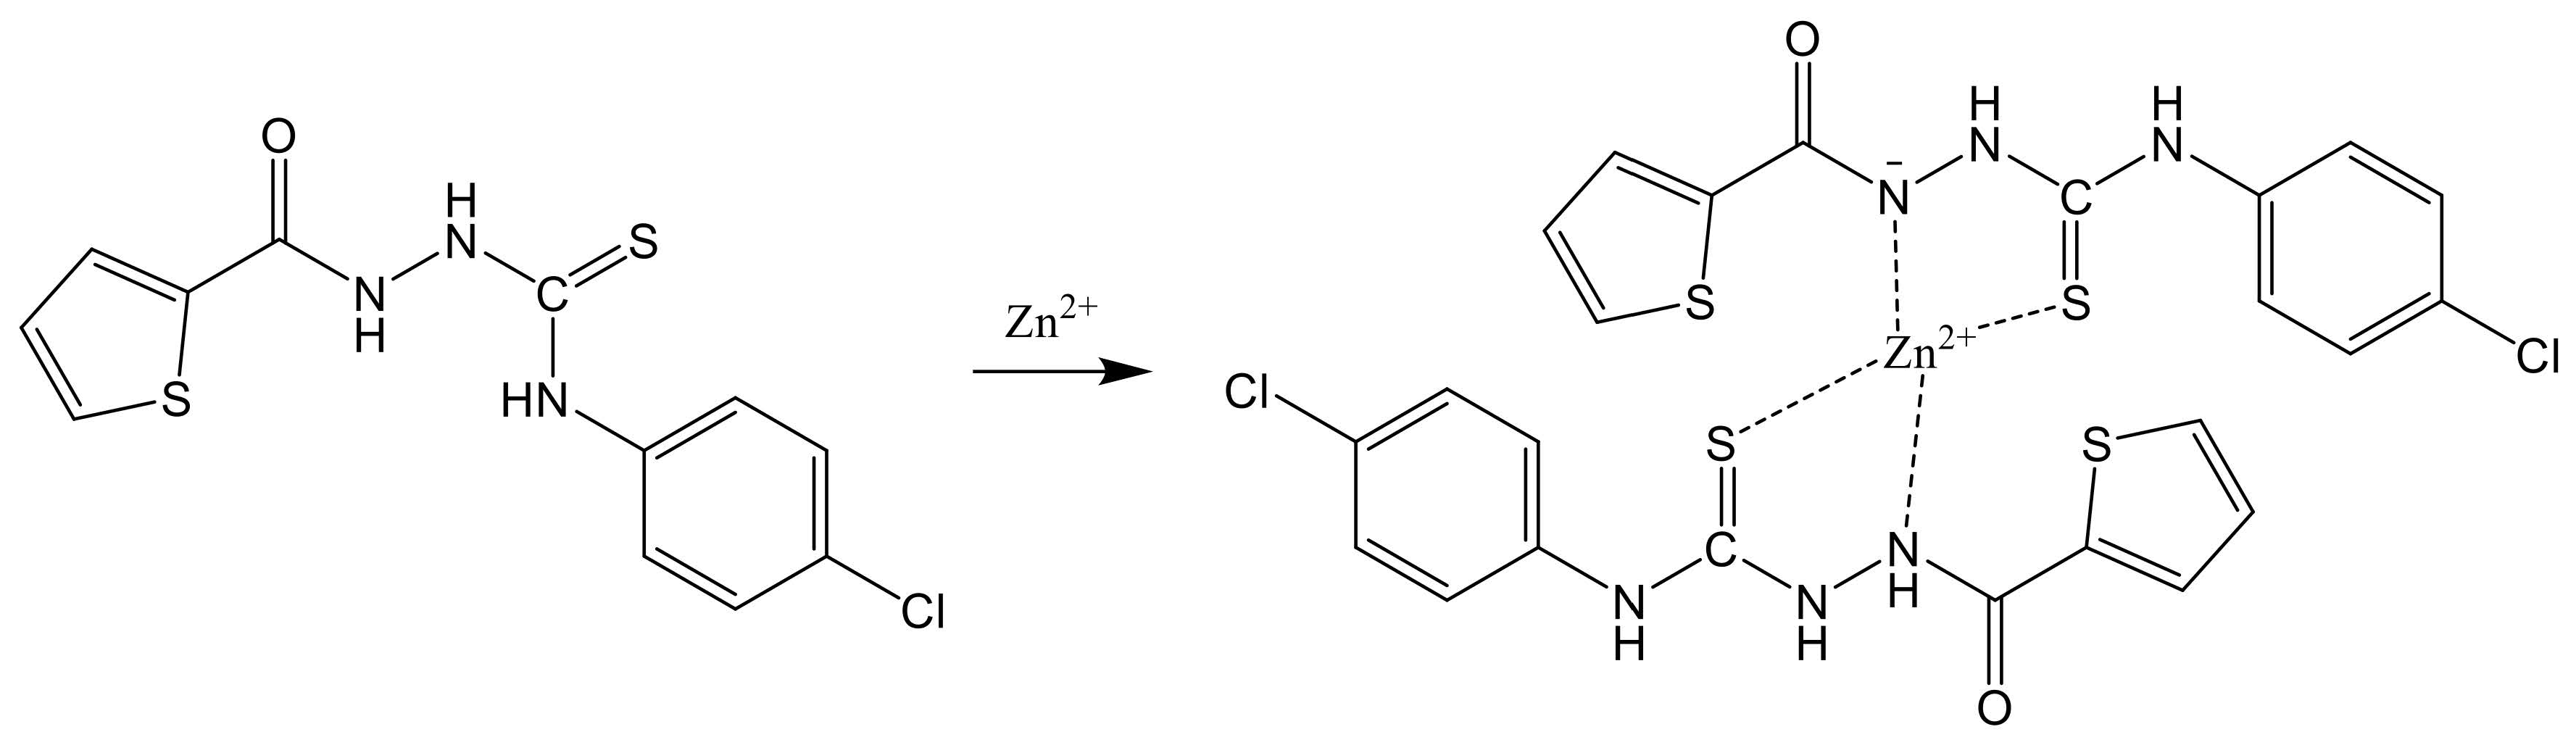
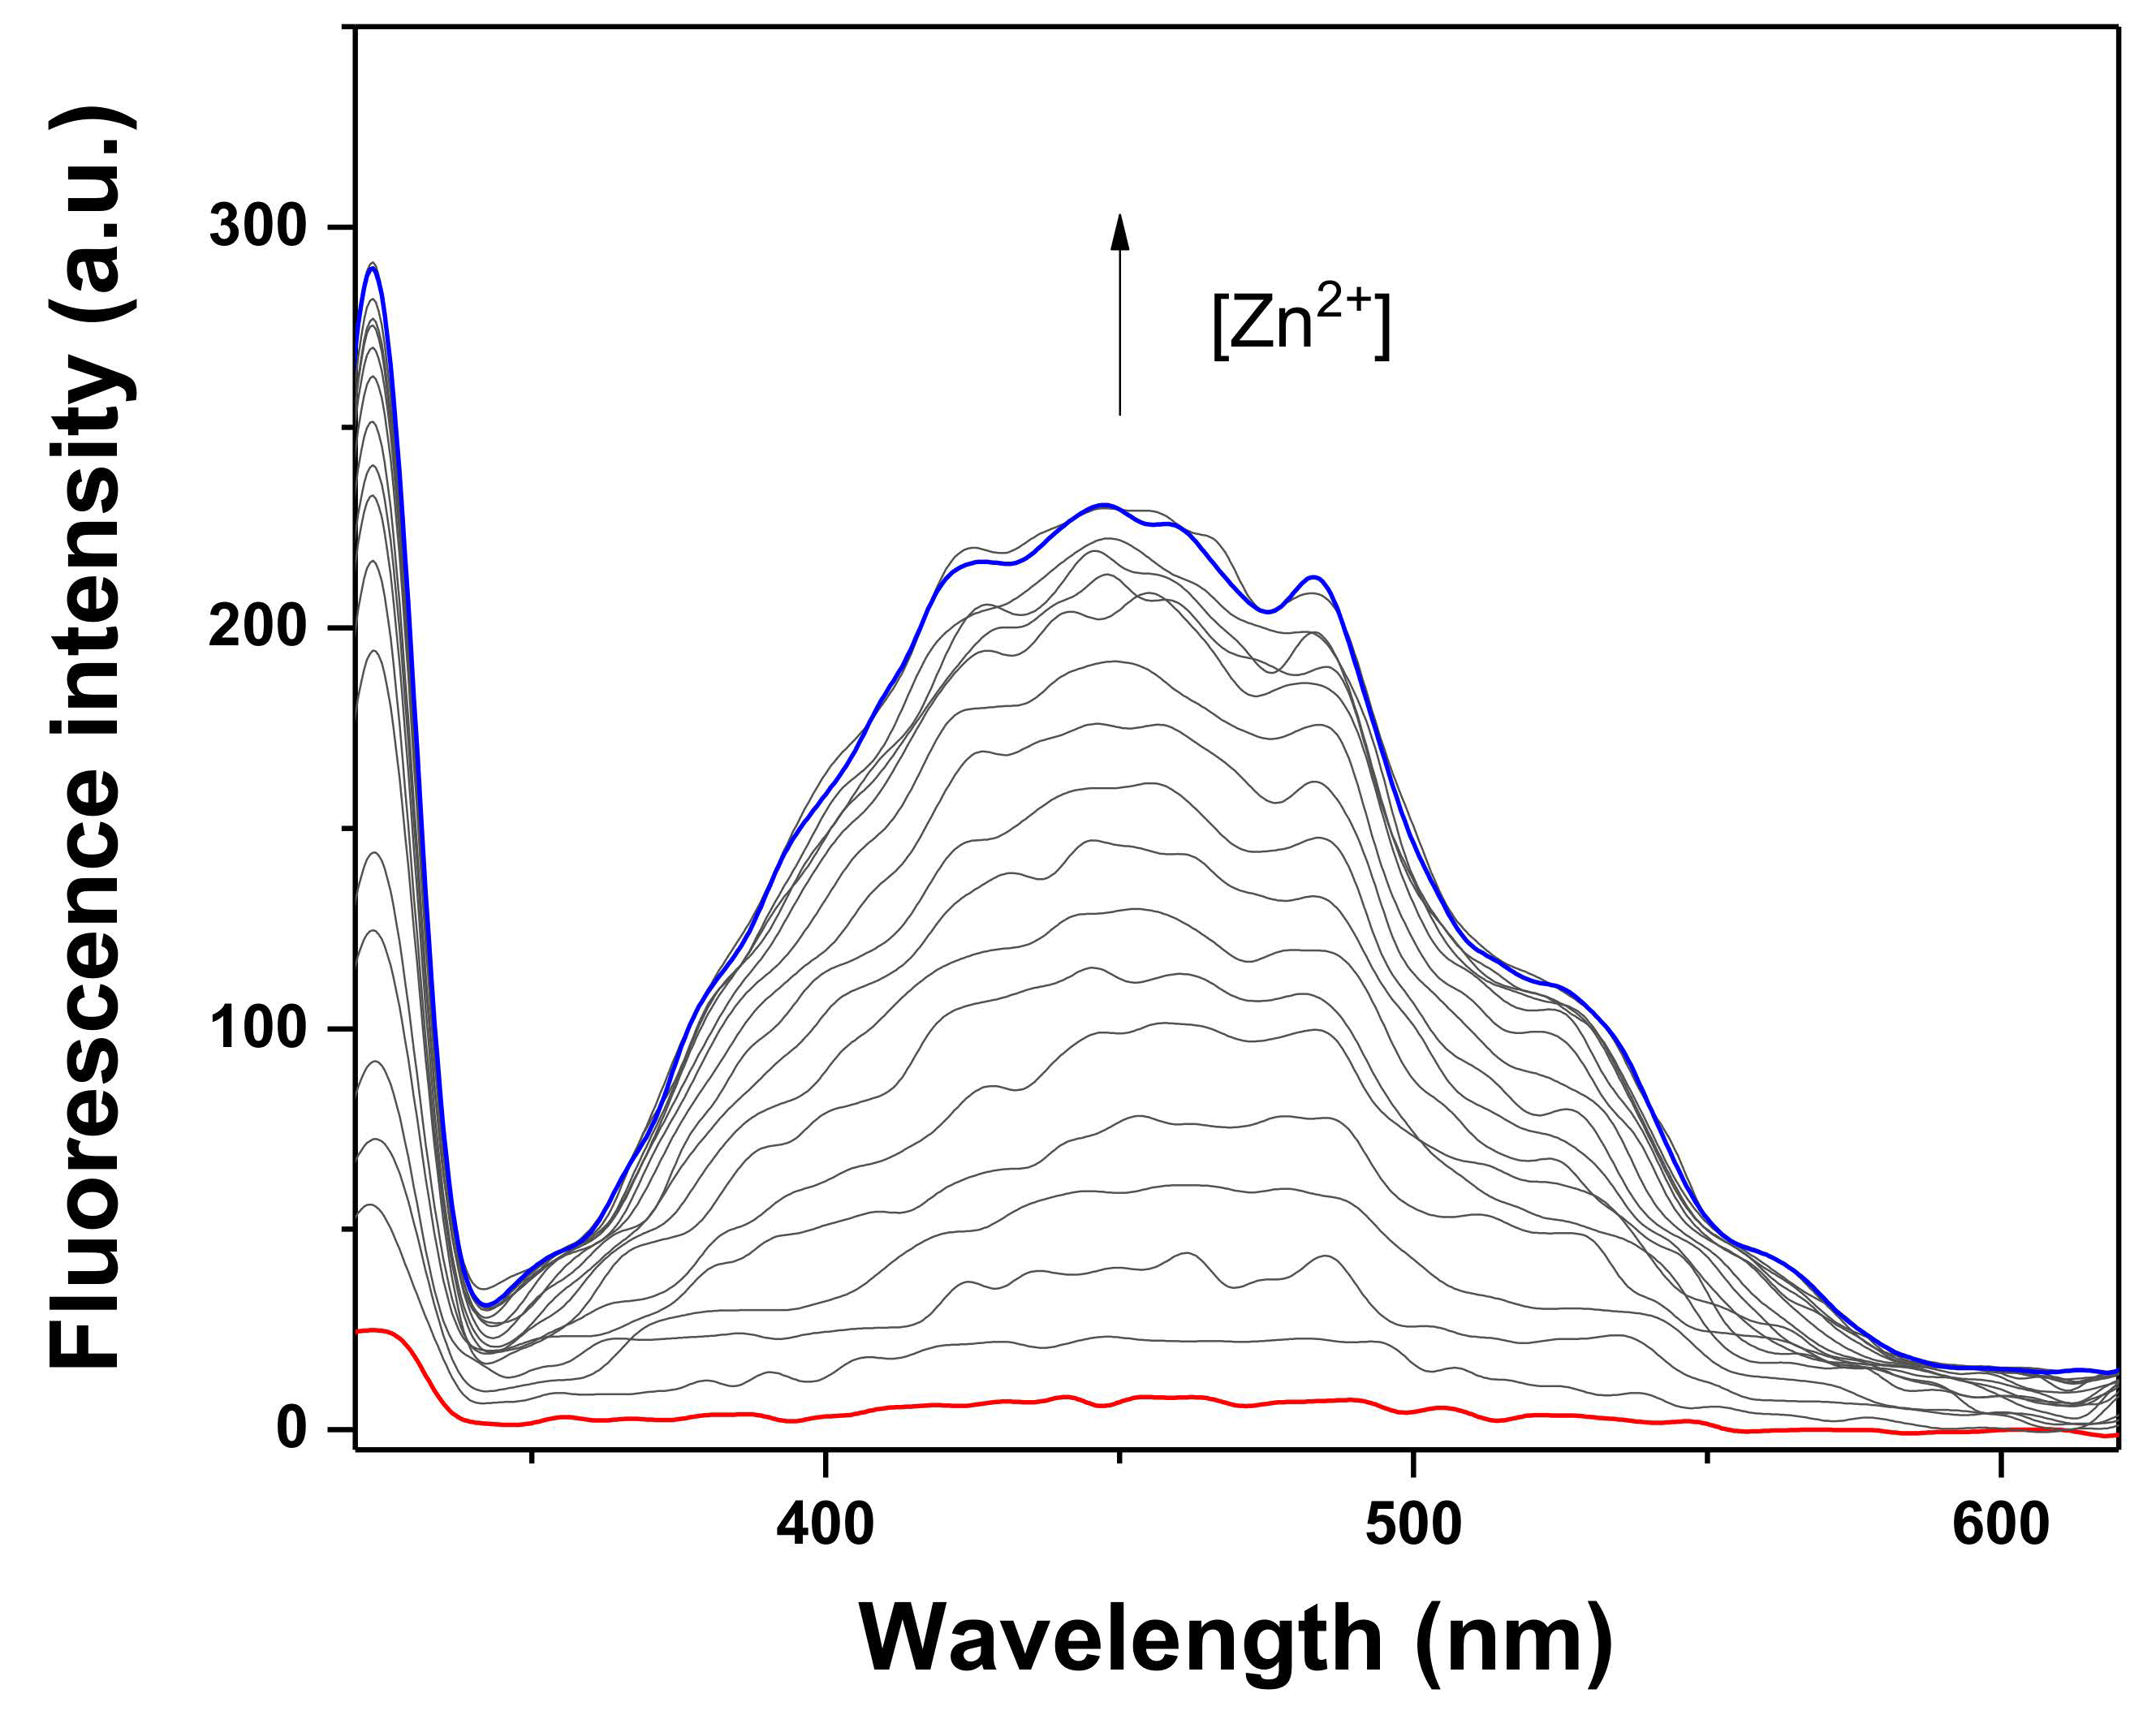
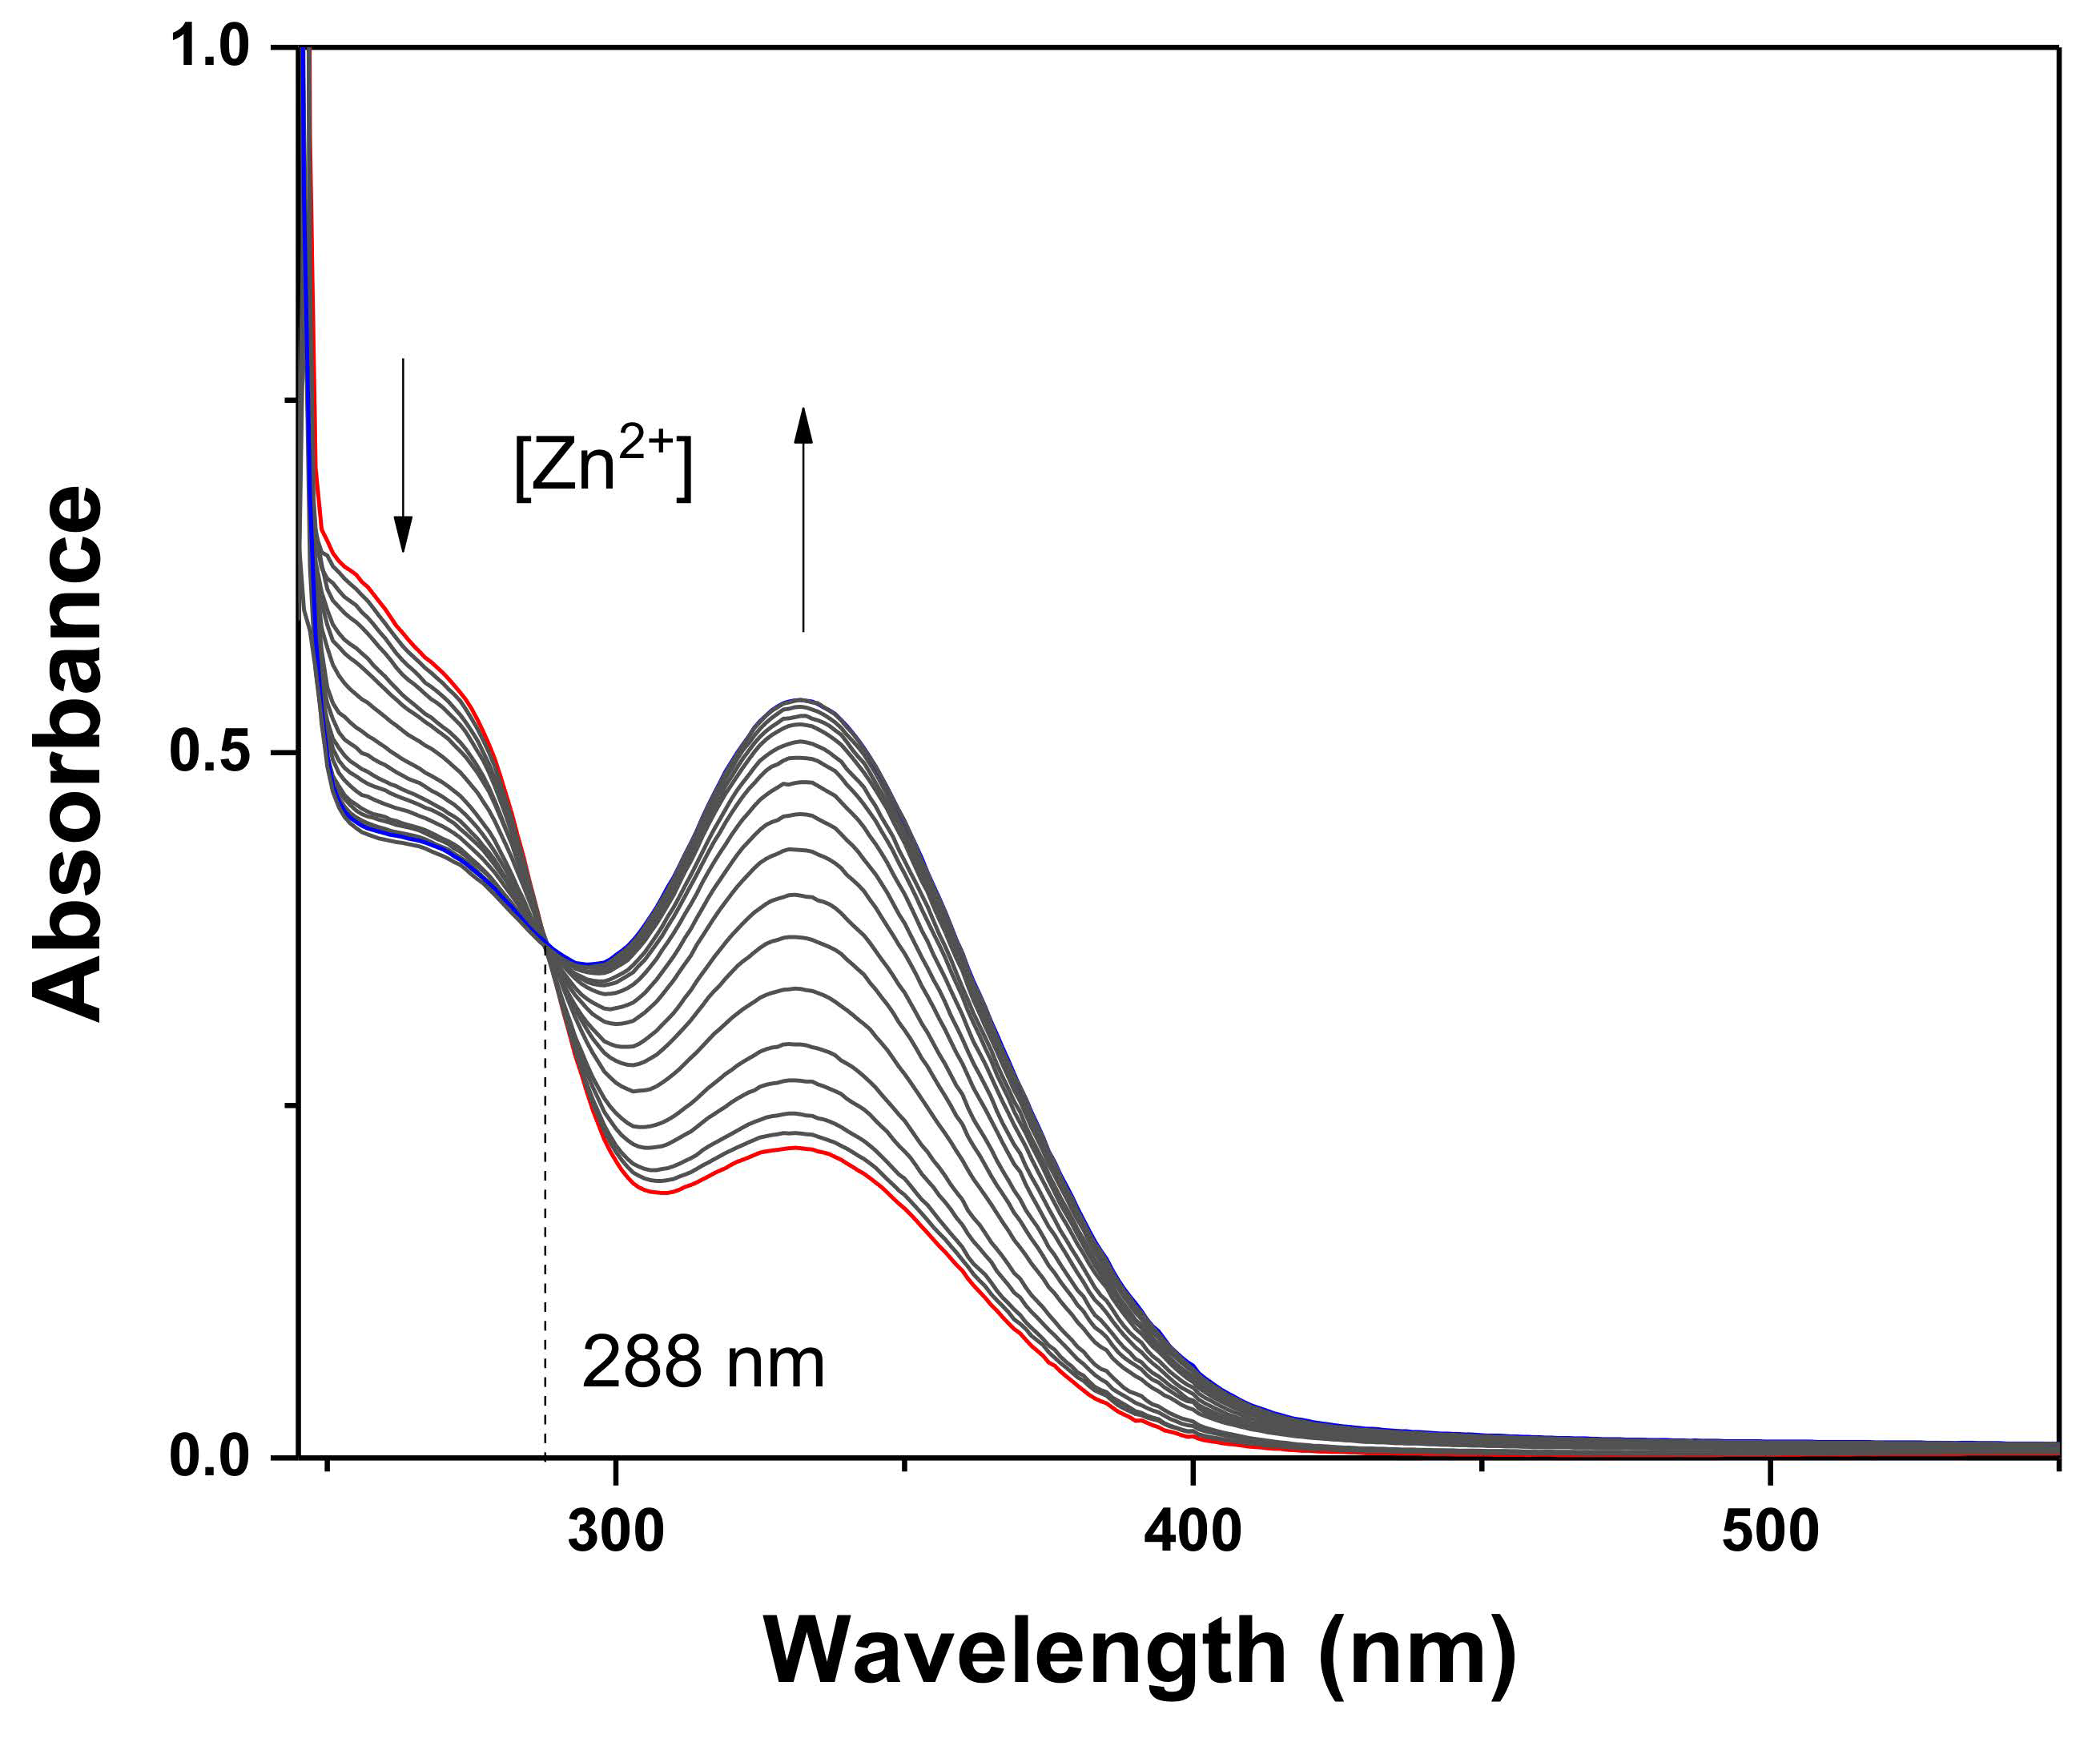
3.1. Fluorescence Investigation of TCC to Zn2+

To identify the selectivity of TCC toward various cations (Zn2+, K+, Pb2+, Na+, Cu2+, Hg2+, Fe2+, Cd2+, Mn2+, Mg2+, Ca2+, Ni2+, Ga3+, C3+, Fe3+, Co3+, In3+ and Al3+) the fluorescent response was tested in bis-tris buffer (Figure 1). With excitation at 320 nm, TCC displayed no fluorescence around 450 nm (λex = 320 nm, Φ = 0.0258).
When each cation (1.6 equiv) was added to TCC, only Zn2+ rapidly induced remarkable fluorescence emission at 450 nm (Φ = 0.1255). There was no fluorescence emission with the other analytes, indicating that TCC may work as a selective fluorescent probe for detecting Zn2+. On the other hand, the quenching effect of S2− and pyrophosphate (PPi) to TCC-Zn2+ was examined, but no fluorescence change occurred.
Fluorescence and UV-vis titrations were conducted to examine the sensing property of TCC for Zn2+ (Figure 2 and Figure 3). As different concentrations of Zn2+ (0–1.7 equiv) were added to TCC, the fluorescence emission at 450 nm constantly increased until 1.6 equiv of Zn2+ was added. UV-vis titration was also performed under the same condition. Upon addition of Zn2+ into TCC, the absorbance of 340 nm consistently increased and that of 270 nm decreased until Zn2+ reached at 1.6 equiv. There was an evident isosbestic point at 288 nm, which signifies that the interaction of TCC and Zn2+ provided a product.
A Job plot was employed to apprehend the association ratio of TCC for Zn2+ (Figure 4). The greatest fluorescence emission at 450 nm appeared at a molar fraction of 0.7, which means that TCC and Zn2+ formed a complex with a 2:1 association ratio. The ratio was also proven by ESI-MS (Figure S5). The peak of 725.82 (m/z) corresponded to [2·TCC − H+ + Zn2+ + MeCN]+ (calculated m/z = 725.94) in the positive-ion spectrum.
From the definition of IUPAC (CDL = 3σ/k) [54], the detection limit for Zn2+ was calculated to be 0.39 μM (Figure 5). This was much lower than the drinking water standard (76 μM) stipulated by the World Health Organization (WHO) [55]. More importantly, the value is the lowest among those formerly addressed for hydrazine-carbothioamide-based fluorescent Zn2+ chemosensors (Table S1) [34,39,56,57,58]. The association constant (K) of TCC-Zn2+ was given as 2 × 10⁸ M−2 from Li’s equation (Figure S6).
To determine an appropriate sensing mechanism between TCC and Zn2+, 1H NMR titrations were conducted (Figure S7). When 0.5 equiv of Zn2+ was added to TCC, the peak of thiourea protons (H4, H5 and H6) shifted downfield. Upon the addition of Zn2+ up to 2.0 equiv, the integral value of H4 decreased to half, indicating that the proton H4 of one of two TCC molecules was deprotonated by binding with Zn2+. Thus, we predicted that both the nitrogen of amide and the sulfur of thiourea would bind to Zn2+. Based on the results of the ESI-mass, Job plot and 1H NMR titration, a proper structure of Zn2+-2·TCC was suggested (Scheme 2).
A competition test was performed to understand a probing ability of TCC toward Zn2+. The fluorescent spectra of TCC were recorded in the presence of Zn2+ along with other cations (Figure 6). There was no interference in the fluorescent spectra of TCC for detecting Zn2+, indicating that TCC was an excellent sensor to detect Zn2+ without interference from other cations. The pH test of TCC and Zn2+-2·TCC was conducted in different pH conditions (pH 6–9) (Figure S8). For TCC, there was no fluorescence emission from pH 6 to 9. Meanwhile, the fluorescence intensity of Zn2+-2·TCC was prominently increased between pH 7 and 9. This outcome signified that TCC may be utilized for sensing Zn2+ at pH 7–9.
To ensure the practical availability of TCC, a fluorescent paper-strip application was performed under fluorescence lamp (λex = 365 nm) (Figure 7). Among the various metals, TCC could detect only Zn2+ with definite fluorescent emission. The results suggested that TCC was able to detect Zn2+ in the paper-applied phase. The application of TCC in real samples was conducted to inspect the practical utility of TCC (Table 1). Reliable recoveries and R.S.D. values were observed in both drinking and tap water samples, meaning that TCC has a great potential to be employed as a reliable tool for monitoring Zn2+ in real samples.

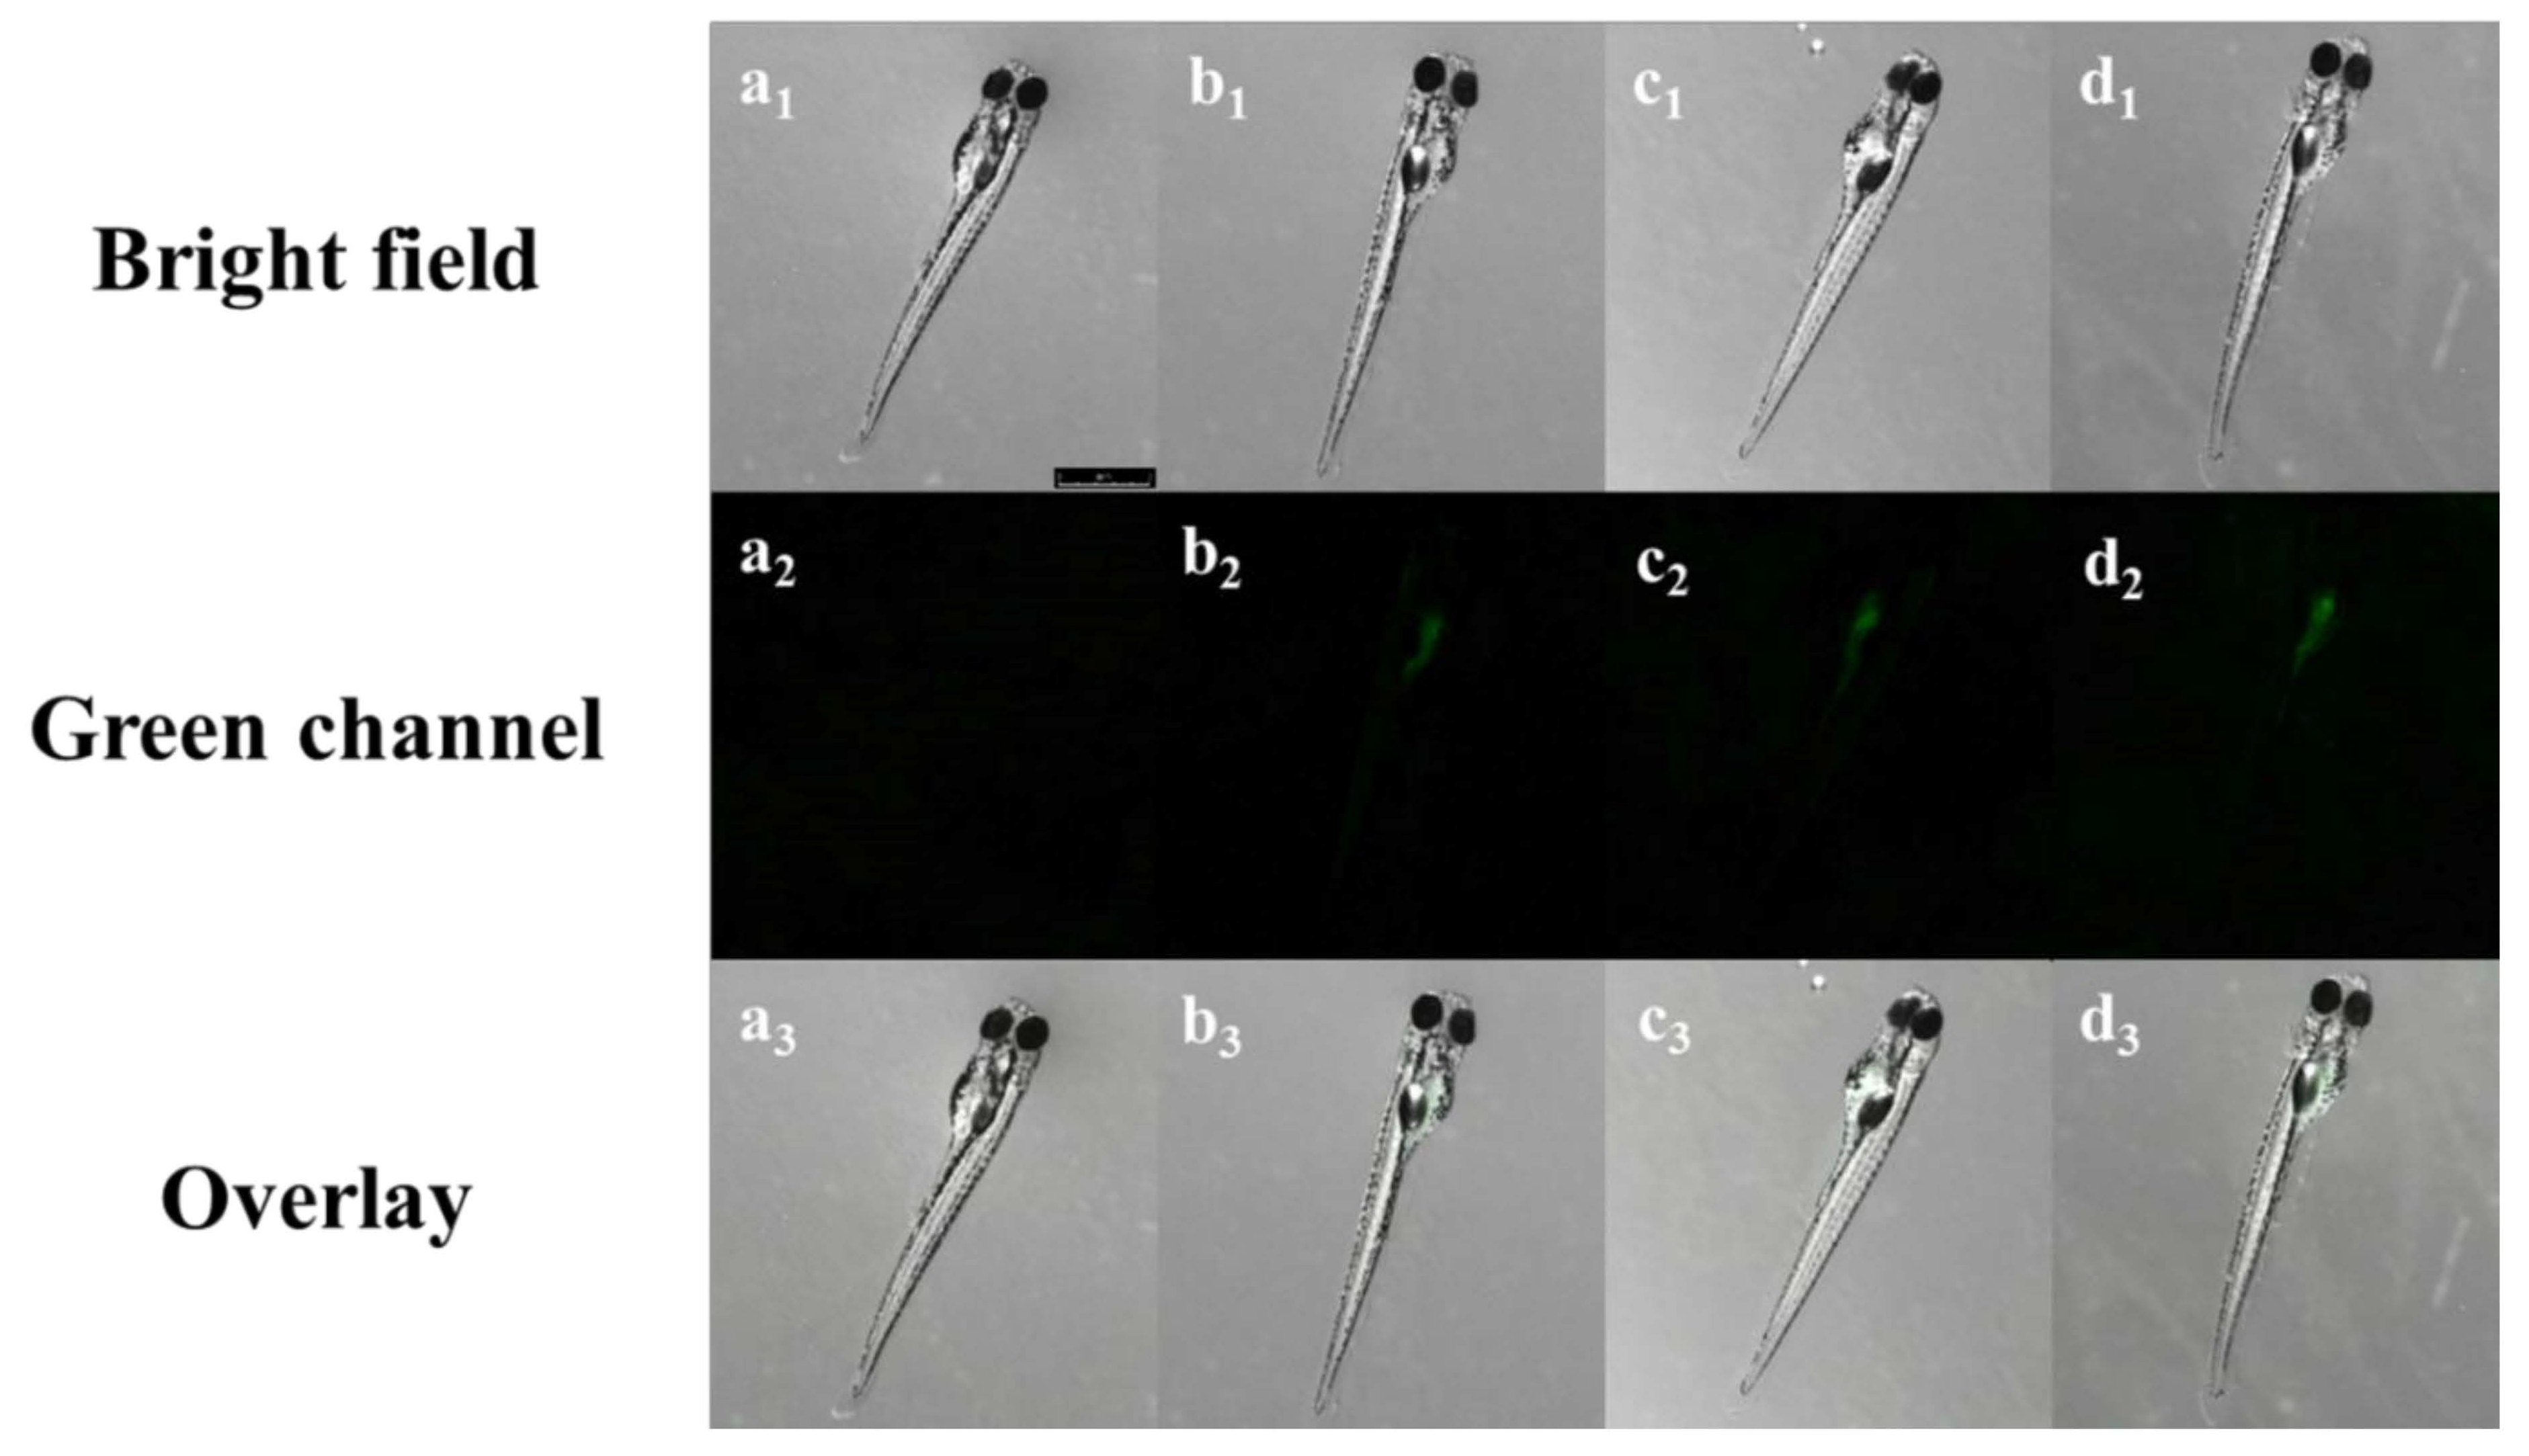
3.2. Imaging in Zebrafish
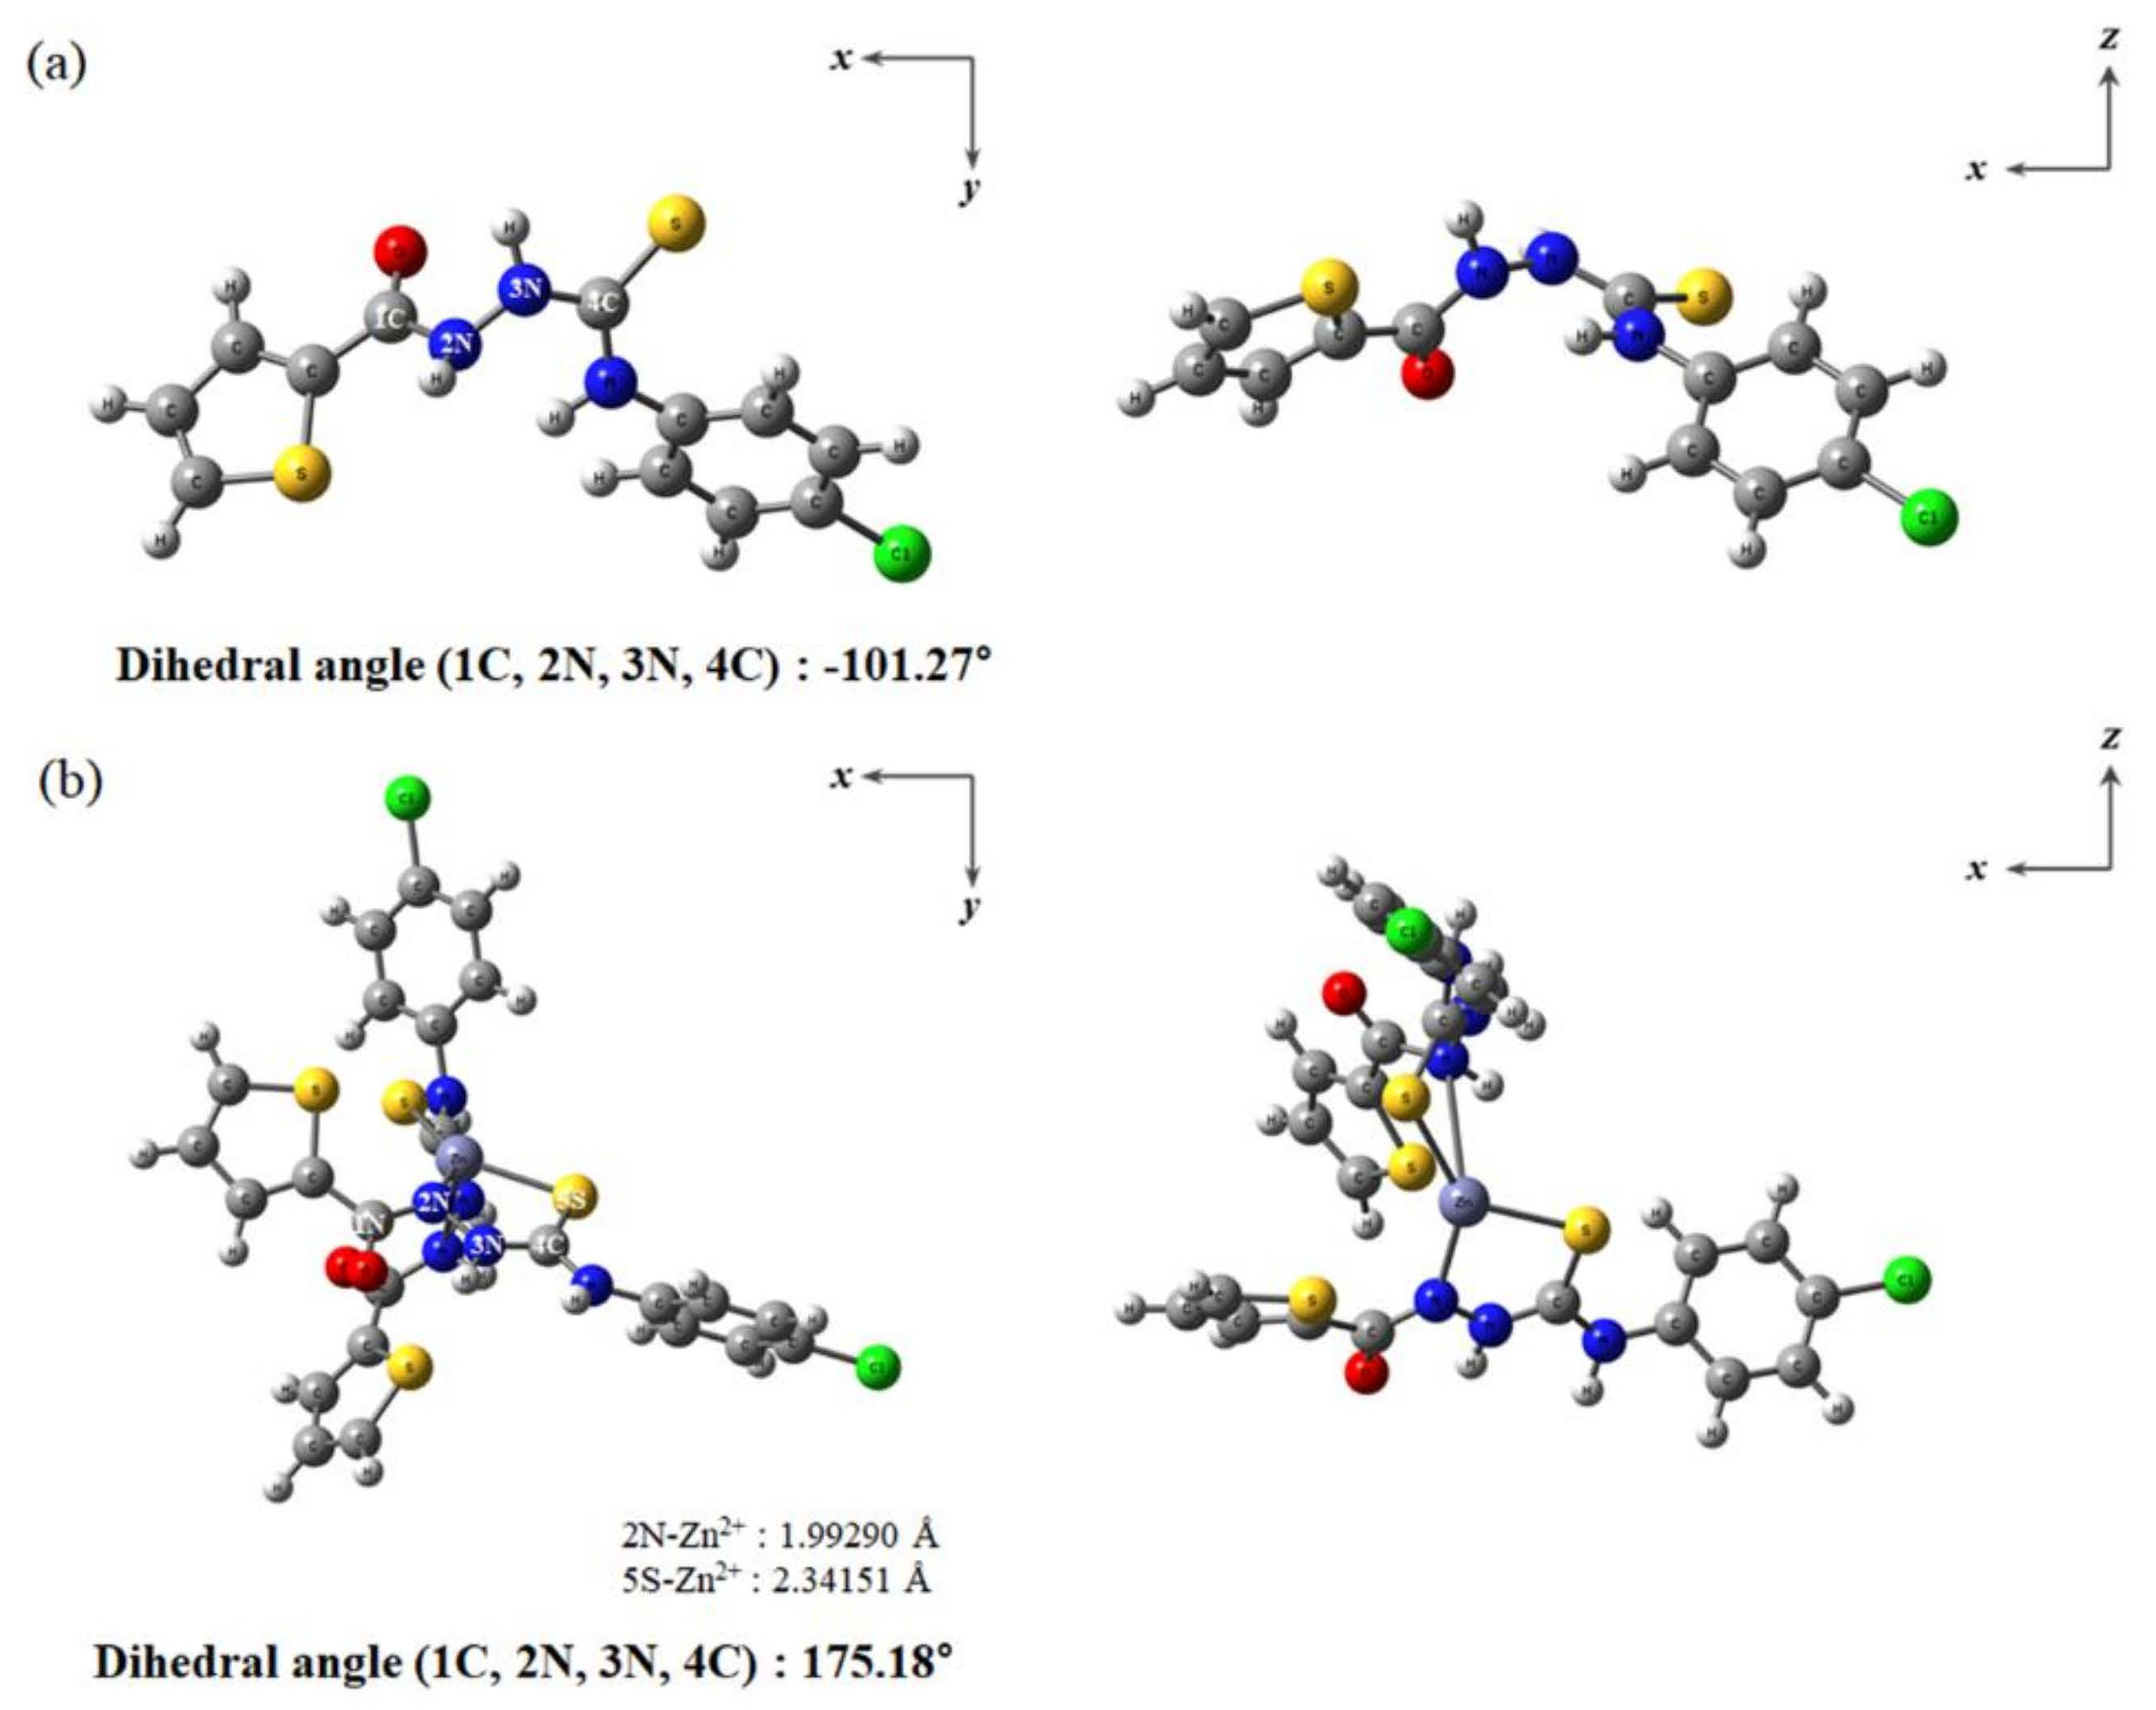
To identify the biological applications of TCC for Zn2+, imaging experiments were achieved with zebrafish (Figure 8). When the zebrafish were treated with TCC (50 μM) for 15 min, there was no fluorescence in the swim bladder (Figure 8(a2)). However, as the amounts of Zn2+ increased to 150, 250 and 500 μM (Figure 8(b2–d2)), the fluorescence in the swim bladder gradually increased. In the swim bladder, the detection limit for Zn2+ was analyzed to be 51.13 μM with the Icy software (Figure S9). These results illustrate that TCC may be applied to trace Zn2+ in live organisms.

3.3. Calculations

Optimized patterns of TCC and Zn2+-2·TCC were investigated according to the analyses of the ESI-mass and Job plot. As shown in Figure 9, TCC had a twist structure with a dihedral angle of −101.27° for 1C, 2N, 3N and 4C, whereas the coordination of Zn2+ to two TCC molecules displayed a more rigid tetrahedral structure (dihedral angle = 175.18°). The bond distances related to coordination of Zn2+ to TCC were calculated to be 1.992 Å for 2N-Zn2+ and 2.341 Å for 5S-Zn2+, which are in the range of the general bond distances for binding with Zn2+ [59,60].
TD-DFT calculations were achieved based on energy-optimized patterns of TCC and Zn2+-2·TCC complex. The leading absorption of TCC at 259.1 nm was caused from the HOMO-3 → LUMO (61%), HOMO-4 → LUMO (17%) and HOMO-6 → LUMO (13%) transitions, which are related to the π → π* transition (Figures S10 and S11). For the Zn2+-2·TCC complex, an absorption band related to the red-shift originated from the HOMO → LUMO+2 (96%) transition (319.9 nm, Figures S11 and S12) and exhibited a π → π* transition. The red-shift recorded in the UV-vis spectra corresponded well with the calculated transition states.
Both TCC and its complex state showed similar transition characters, and the rigidity in the complex state of TCC increased. Thus, fluorescent ‘turn-on’ sensing would be caused by chelation-enhanced fluorescence process [61]. When TCC was converted into the complex state with Zn2+, the reduction of nonradiative transitions, such as rotations and vibrations, would lead to the enhancement of radiative transitions, like fluorescence. Referring to various spectroscopic experiments and theoretical calculations, we present a plausible sensing model of Zn2+ by TCC (Scheme 2).

4. Conclusions

We presented a practical hydrazine-carbothioamide-based fluorescent chemosensor TCC that could effectively detect Zn2+ in aqueous media. Probe TCC could detect Zn2+ among the other metal ions through selective fluorescence emission. In addition, TCC could clearly recognize Zn2+ with competition from metal ions. Particularly, TCC could be used as a practical probe capable of detecting Zn2+ in paper-strip, zebrafish and real water samples.
The detection limit of TCC for Zn2+ was calculated to be 0.39 μM in the solution phase and 51.13 μM in zebrafish. Importantly, the value in the solution phase is the lowest among those formerly addressed for hydrazine-carbothioamide-based fluorescent Zn2+ chemosensors. The binding mode of TCC for Zn2+ was revealed to be a 2:1 by the Job plot and ESI-mass. The detecting mechanism of TCC toward Zn2+ was described as the chelation-enhanced fluorescence process based on the results of spectroscopic studies and theoretical calculations.
Future study will focus on the development of hydrazine-carbothioamide-based chemosensors, which may operate at long excitation wavelengths for fluorescence bio-imaging. In addition, we will consider the development of an integrated system with portable fluorescent recognition or smartphone-based sensors [62,63].

Supplementary Materials

The following supporting information can be downloaded at: https://www.mdpi.com/article/10.3390/chemosensors10010032/s1, Table S1: Examples of hydrazine-carbothioamide-based fluorescence chemosensors for detecting Zn2+. Figure S1: 1H NMR spectrum of TCC. Figure S2: 13C NMR spectrum of TCC. Figure S3: Positive-ion ESI-mass spectrum of TCC (100 μM). Figure S4: Solubility of TCC in distilled water based on the absorbance at 320 nm. Solubility was calculated to the TCC-saturated solution with linear fitting curve of TCC (0, 40, 80, 120, 160 and 200 μM). Figure S5: Positive-ion ESI-mass spectrum of TCC (100 μM) upon the addition of Zn2+ (1 equiv). Figure S6: Li’s equation plot (at 450 nm) of TCC (40 µM) based on fluorescence titration, assuming 2:1 stoichiometry for association between TCC and Zn2+. Figure S7: 1H NMR titration of TCC (10 mM) upon the addition of different amounts of Zn2+ (0–2.0 equiv). Figure S8: Fluorescence intensity of TCC and TCC-Zn2+ at a pH range of 6 to 9. Figure S9: Quantification of the mean fluorescence intensity in Figure 8a2–d2. Figure S10: (a) The theoretical excitation energies and the experimental UV-vis spectrum of TCC. (b) The major electronic transition energies and molecular orbital contributions of TCC. Figure S11: The major molecular orbital transitions and excitation energies of TCC and the Zn2+-2·TCC complex. Figure S12: (a) The theoretical excitation energies and the experimental UV-vis spectrum of the Zn2+-2·TCC complex. (b) The major electronic transition energies and molecular orbital contributions of the Zn2+-2·TCC complex.

Author Contributions

Conceptualization, B.S. and C.K.; formal analysis, B.S.; investigation, B.S., D.G. and S.Y.; data curation, B.S. and D.G.; writing—original draft preparation, B.S. and D.G.; writing—review and editing, B.S. and C.K.; supervision, C.K. and K.-T.K.; funding acquisition, C.K. and K.-T.K. All authors have read and agreed to the published version of the manuscript.

Funding

The National Research Foundation of Korea (2018R1A2B6001686) is gratefully.

Institutional Review Board Statement

The maintenance of zebrafish was approved by the Institutional Animal Care and Use Committees at the Seoul National University of Science and Technology. Ethical review and approval were waived for this study because early-life stages of zebrafish (<120 hpf) are not protected according to the European Union (EU) Directive 2010/63/EU.

Informed Consent Statement

Not applicable.

Data Availability Statement

Not applicable.

Conflicts of Interest

The authors declare no conflict of interest.

References

  1. Yun, D.; Chae, J.B.; So, H.; Lee, H.; Kim, K.T.; Kim, C. Sensing of zinc ions and sulfide using a highly practical and water-soluble fluorescent sensor: Applications in test kits and zebrafish. New J. Chem. 2019, 44, 442–449. [Google Scholar] [CrossRef]
  2. Qu, W.J.; Guan, J.; Wei, T.B.; Yan, G.T.; Lin, Q.; Zhang, Y.M. A turn-on fluorescent sensor for relay recognition of two ions: From a F--selective sensor to highly Zn2+-selective sensor by tuning electronic effects. RSC Adv. 2016, 6, 35804–35808. [Google Scholar] [CrossRef]
  3. Gilbert, R.; Peto, T.; Lengyel, I.; Emri, E. Zinc Nutrition and Inflammation in the Aging Retina. Mol. Nutr. Food Res. 2019, 63, e1801049. [Google Scholar] [CrossRef] [PubMed]
  4. Kim, M.J.; Kaur, K.; Singh, N.; Jang, D.O. Benzimidazole-based receptor for Zn2+ recognition in a biological system: A chemosensor operated by retarding the excited state proton transfer. Tetrahedron 2012, 68, 5429–5433. [Google Scholar] [CrossRef]
  5. Berg, J.M.; Shi, Y. The galvanization of biology: A growing appreciation for the roles of zinc. Science 1996, 271, 1081–1085. [Google Scholar] [CrossRef]
  6. Zhang, C.; Liu, Z.; Li, Y.; He, W.; Gao, X.; Guo, Z. In vitro and in vivo imaging application of a 1,8-naphthalimide-derived Zn2+ fluorescent sensor with nuclear envelope penetrability. Chem. Commun. 2013, 49, 11430–11432. [Google Scholar] [CrossRef] [Green Version]
  7. Maity, D.; Govindaraju, T. A differentially selective sensor with fluorescence turn-on response to Zn2+ and dual-mode ratiometric response to Al3+ in aqueous media. Chem. Commun. 2012, 48, 1039–1041. [Google Scholar] [CrossRef]
  8. Helal, A.; Rashid, M.H.O.; Choi, C.H.; Kim, H.S. New regioisomeric naphthol-substituted thiazole based ratiometric fluorescence sensor for Zn2+ with a remarkable red shift in emission spectra. Tetrahedron 2012, 68, 647–653. [Google Scholar] [CrossRef]
  9. Vallee, B.L.; Auld, D.S. Zinc Coordination, Function, and Structure of Zinc Enzymes and Other Proteins. Biochemistry 1990, 29, 5647–5659. [Google Scholar] [CrossRef]
  10. Quang, D.T.; Kim, J.S. Fluoro- and chromogenic chemodosimeters for heavy metal ion detection in solution and biospecimens. Chem. Rev. 2010, 110, 6280–6301. [Google Scholar] [CrossRef]
  11. Yun, J.Y.; Jo, T.G.; Han, J.; Jang, H.J.; Lim, M.H.; Kim, C. A highly sensitive and selective fluorescent chemosensor for the sequential recognition of Zn2+ and S2− in living cells and aqueous media. Sens. Actuators B Chem. 2018, 255, 3108–3116. [Google Scholar] [CrossRef]
  12. Ploysangam, A.; Falciglia, G.A.; Brehm, B.J. Effect of marginal zinc deficiency on human growth and development. J. Trop. Pediatr. 1997, 43, 192–198. [Google Scholar] [CrossRef]
  13. Kim, S.; Lee, H.; So, H.; Lee, H.; Kim, K.T.; Kim, C. A benzyl carbazate-based fluorescent chemosensor for detecting Zn2+: Application to zebrafish. Spectrochim. Acta Part A 2020, 228, 117787–117793. [Google Scholar] [CrossRef]
  14. Chan, W.C.; Saad, H.M.; Sim, K.S.; Lee, V.S.; Ang, C.W.; Yeong, K.Y.; Tan, K.W. A rhodamine based chemosensor for solvent dependent chromogenic sensing of cobalt (II) and copper (II) ions with good selectivity and sensitivity: Synthesis, filter paper test strip, DFT calculations and cytotoxicity. Spectrochim. Acta Part A 2021, 262, 120099–120112. [Google Scholar] [CrossRef]
  15. Sturgeon, R.E.; Berman, S.S.; Desaulniers, A.; Russell, D.S. Reply to Comments on Determination of Iron, Manganese, and Zinc by Graphite Furnace Atomic Absorption Spectrometry. Anal. Chem. 1980, 52, 1767–1770. [Google Scholar] [CrossRef]
  16. Antunes, G.A.; Dos Santos, H.S.; Da Silva, Y.P.; Silva, M.M.; Piatnicki, C.M.S.; Samios, D. Determination of Iron, Copper, Zinc, Aluminum, and Chromium in Biodiesel by Flame Atomic Absorption Spectrometry Using a Microemulsion Preparation Method. Energy Fuels 2017, 31, 2944–2950. [Google Scholar] [CrossRef]
  17. Srivastava, S.K.; Gupta, V.K.; Jain, S. PVC-based 2,2,2-cryptand sensor for zinc ions. Anal. Chem. 1996, 68, 1272–1275. [Google Scholar] [CrossRef] [PubMed]
  18. Chaiyo, S.; Mehmeti, E.; Žagar, K.; Siangproh, W.; Chailapakul, O.; Kalcher, K. Electrochemical sensors for the simultaneous determination of zinc, cadmium and lead using a Nafion/ionic liquid/graphene composite modified screen-printed carbon electrode. Anal. Chim. Acta 2016, 918, 26–34. [Google Scholar] [CrossRef] [PubMed]
  19. Ansari, R.; Delavar, A.F.; Mohammad-Khah, A. Solid-state ion selective electrode based on polypyrrole conducting polymer nanofilm as a new potentiometric sensor for Zn2+ ion. J. Solid State Electrochem. 2012, 16, 3315–3322. [Google Scholar] [CrossRef]
  20. Shamsipur, M.; Rouhani, S.; Ganjali, M.R.; Sharghi, H.; Eshghi, H. Zinc-selective membrane potentiometric sensor based on a recently synthesized benzo-substituted macrocyclic diamide. Sens. Actuators B Chem. 1999, 59, 30–34. [Google Scholar] [CrossRef]
  21. Goswami, S.; Paul, S.; Manna, A. A differentially selective chemosensor for a ratiometric response to Zn2+ and Al3+ in aqueous media with applications for molecular switches. RSC Adv. 2013, 3, 25079–25085. [Google Scholar] [CrossRef]
  22. Narayanaswamy, N.; Maity, D.; Govindaraju, T. Reversible fluorescence sensing of Zn2+ based on pyridine-constrained bis(triazole-linked hydroxyquinoline) sensor. Supramol. Chem. 2011, 23, 703–709. [Google Scholar] [CrossRef]
  23. Lee, D.Y.; Singh, N.; Kim, M.J.; Jang, D.O. Ratiometric fluorescent determination of Zn(II): A new class of tripodal receptor using mixed imine and amide linkages. Tetrahedron 2010, 66, 7965–7969. [Google Scholar] [CrossRef]
  24. Helal, A.; Kim, S.H.; Kim, H. Thiazole sulfonamide based ratiometric fluorescent chemosensor with a large spectral shift for zinc sensing. Tetrahedron 2010, 66, 9925–9932. [Google Scholar] [CrossRef]
  25. Wei, T.B.; Zhang, P.; Shi, B.B.; Chen, P.; Lin, Q.; Liu, J.; Zhang, Y.M. A highly selective chemosensor for colorimetric detection of Fe3+ and fluorescence turn-on response of Zn2+. Dye. Pigment. 2013, 97, 297–302. [Google Scholar] [CrossRef]
  26. Cheah, P.W.; Heng, M.P.; Saad, H.M.; Sim, K.S.; Tan, K.W. Specific detection of Cu2+ by a pH-independent colorimetric rhodamine based chemosensor. Opt. Mater. 2021, 114, 110990–110997. [Google Scholar] [CrossRef]
  27. Darjee, S.M.; Modi, K.M.; Panchal, U.; Patel, C.; Jain, V.K. Highly selective and sensitive fluorescent sensor: Thiacalix[4]arene-1-naphthalene carboxylate for Zn2+ ions. J. Mol. Struct. 2017, 1133, 1–8. [Google Scholar] [CrossRef]
  28. Bhattacharyya, A.; Ghosh, S.; Makhal, S.C.; Guchhait, N. Hydrazine bridged coumarin-pyrimidine conjugate as a highly selective and sensitive Zn2+ sensor: Spectroscopic unraveling of sensing mechanism with practical application. Spectrochim. Acta Part A 2017, 183, 306–311. [Google Scholar] [CrossRef]
  29. Hwang, S.M.; Kim, C. Fluorescent detection of Zn2+ and Cu2+ by a phenanthrene-based multifunctional chemosensor that acts as a basic pH indicator. Inorg. Chim. Acta 2018, 482, 375–383. [Google Scholar] [CrossRef]
  30. Kim, J.H.; Noh, J.Y.; Hwang, I.H.; Kang, J.; Kim, J.; Kim, C. An anthracene-based fluorescent chemosensor for Zn2+. Tetrahedron Lett. 2013, 54, 2415–2418. [Google Scholar] [CrossRef]
  31. Wechakorn, K.; Suksen, K.; Piyachaturawat, P.; Kongsaeree, P. Rhodamine-based fluorescent and colorimetric sensor for zinc and its application in bioimaging. Sens. Actuators B Chem. 2016, 228, 270–277. [Google Scholar] [CrossRef]
  32. Gupta, V.K.; Singh, A.K.; Kumawat, L.K. A turn-on fluorescent chemosensor for Zn2+ ions based on antipyrine schiff base. Sens. Actuators B Chem. 2014, 204, 507–514. [Google Scholar] [CrossRef]
  33. Gusev, A.N.; Shul’Gin, V.F.; Meshkova, S.B.; Smola, S.S.; Linert, W. A novel triazole-based fluorescent chemosensor for Zinc ions. J. Lumin. 2014, 155, 311–316. [Google Scholar] [CrossRef]
  34. So, H.; Cho, H.; Lee, H.; Tran, M.C.; Kim, K.T.; Kim, C. Detection of zinc (II) and hypochlorite by a thiourea-based chemosensor via two emission channels and its application in vivo. Microchem. J. 2020, 155, 104788–104795. [Google Scholar] [CrossRef]
  35. Vonlanthen, M.; Finney, N.S. Thioureas as reporting elements for metal-responsive fluorescent chemosensors. J. Org. Chem. 2013, 78, 3980–3988. [Google Scholar] [CrossRef]
  36. Zhu, H.; Fan, J.; Zhang, S.; Cao, J.; Song, K.; Ge, D.; Dong, H.; Wang, J.; Peng, X. Ratiometric fluorescence imaging of lysosomal Zn2+ release under oxidative stress in neural stem cells. Biomater. Sci. 2014, 2, 89–97. [Google Scholar] [CrossRef]
  37. Seo, Y.; Park, S.; Kim, G.; Lee, M.; Kim, C. A naphthyl thiourea-based effective chemosensor for fluorescence detection of Ag+ and Zn2+. Luminescence 2021, 36, 1725–1732. [Google Scholar] [CrossRef]
  38. Chen, Z.E.; Zhang, H.; Iqbal, Z. A new thiosemicarbazone fluorescent probe based on 9,9′-bianthracene for Hg2+ and Ag+. Spectrochim. Acta Part A 2019, 215, 34–40. [Google Scholar] [CrossRef]
  39. Li, Z.; Xiang, Y.; Tong, A. Ratiometric chemosensor for fluorescent determination of Zn2+ in aqueous ethanol. Anal. Chim. Acta 2008, 619, 75–80. [Google Scholar] [CrossRef]
  40. Parr, R.G.; Pearson, R.G. Absolute Hardness: Companion Parameter to Absolute Electronegativity. J. Am. Chem. Soc. 1983, 105, 7512–7516. [Google Scholar] [CrossRef]
  41. Von Burg, R. Toxicology Update. J. Appl. Toxicol. 1992, 12, 73–74. [Google Scholar] [CrossRef]
  42. Dzitko, K.; Paneth, A.; Plech, T.; Pawełczyk, J.; Stączek, P.; Stefańska, J.; Paneth, P. 1,4-Disubstituted Thiosemicarbazide Derivatives Are Potent Inhibitors of Toxoplasma Gondii Proliferation. Molecules 2014, 19, 9926–9943. [Google Scholar] [CrossRef] [PubMed]
  43. Al-Wahaibi, L.H.; Rahul, B.; Mohamed, A.A.B.; Abdelbaky, M.S.M.; Garcia-Granda, S.; El-Emam, A.A.; Percino, M.J.; Thamotharan, S. Supramolecular Self-Assembly Built by Weak Hydrogen, Chalcogen, and Unorthodox Nonbonded Motifs in 4-(4-Chlorophenyl)-3-[(4-fluorobenzyl)sulfanyl]-5-(thiophen-2-yl)-4 H-1,2,4-triazole, a Selective COX-2 Inhibitor: Insights from X-ray and Theoretical Studi. ACS Omega 2021, 6, 6996–7007. [Google Scholar] [CrossRef]
  44. Kang, J.H.; Han, J.; Lee, H.; Lim, M.H.; Kim, K.T.; Kim, C. A water-soluble fluorescence chemosensor for the sequential detection of Zn2+ and pyrophosphate in living cells and zebrafish. Dye. Pigment. 2018, 152, 131–138. [Google Scholar] [CrossRef]
  45. Frisch, M.J.; Trucks, G.W.; Schlegel, H.B.; Scuseria, G.E.; Robb, M.A.; Cheeseman, J.R.; Scalmani, G.; Barone, V.; Petersson, G.A.; Nakatsuji, H.; et al. Gaussian 16 Revision C.01; Gaussian, Inc.: Wallingford, UK, 2016. [Google Scholar]
  46. Becke, A.D. Density-functional thermochemistry. III. The role of exact exchange. J. Chem. Phys. 1993, 98, 5648–5652. [Google Scholar] [CrossRef] [Green Version]
  47. Lee, C.; Yang, W.; Parr, R.G. Development of the Colle-Salvetti correlation-energy formula into a functional of the electron density. Phys. Rev. B 1988, 37, 785–789. [Google Scholar] [CrossRef] [PubMed] [Green Version]
  48. Hariharan, P.C.; Pople, J.A. The influence of polarization functions on molecular orbital hydrogenation energies. Theor. Chim. Acta 1973, 28, 213–222. [Google Scholar] [CrossRef]
  49. Francl, M.M.; Pietro, W.J.; Hehre, W.J.; Binkley, J.S.; Gordon, M.S.; DeFrees, D.J.; Pople, J.A. Self-consistent molecular orbital methods. XXIII. A polarization-type basis set for second-row elements. J. Chem. Phys. 1982, 77, 3654–3665. [Google Scholar] [CrossRef] [Green Version]
  50. Hay, P.J.; Wadt, W.R. Ab initio effective core potentials for molecular calculations. Potentials for the transition metal atoms Sc to Hg. J. Chem. Phys. 1985, 82, 270–283. [Google Scholar] [CrossRef]
  51. Wadt, W.R.; Hay, P.J. Ab initio effective core potentials for molecular calculations. Potentials for main group elements Na to Bi. J. Chem. Phys. 1985, 82, 284–298. [Google Scholar] [CrossRef]
  52. Hay, P.J.; Wadt, W.R. Ab initio effective core potentials for molecular calculations. Potentials for K to Au including the outermost core orbitals. J. Chem. Phys. 1985, 82, 299–310. [Google Scholar] [CrossRef]
  53. Klamt, A.; Moya, C.; Palomar, J. A Comprehensive Comparison of the IEFPCM and SS(V)PE Continuum Solvation Methods with the COSMO Approach. J. Chem. Theory Comput. 2015, 11, 4220–4225. [Google Scholar] [CrossRef] [PubMed] [Green Version]
  54. Goswami, S.; Aich, K.; Das, S.; Das Mukhopadhyay, C.; Sarkar, D.; Mondal, T.K. A new visible-light-excitable ICT-CHEF-mediated fluorescence “turn-on” probe for the selective detection of Cd2+ in a mixed aqueous system with live-cell imaging. Dalton Trans. 2015, 44, 5763–5770. [Google Scholar] [CrossRef] [PubMed]
  55. World Health Organization. WHO Guidelines for Drinking-Water Quality, 2nd ed.; World Health Organization: Geneva, Switzerland, 1998; Volume 1. [Google Scholar]
  56. Ji, Z.J.; Wu, Y.M.; Wu, F.Y. A ratiometric fluorescence sensor for zinc in neutral solution based on thiourea receptor. Chem. Lett. 2006, 35, 950–951. [Google Scholar] [CrossRef]
  57. Samanta, S.; Manna, U.; Ray, T.; Das, G. An aggregation-induced emission (AIE) active probe for multiple targets: A fluorescent sensor for Zn2+ and Al3+ & a colorimetric sensor for Cu2+ and F. Dalt. Trans. 2015, 44, 18902–18910. [Google Scholar] [CrossRef]
  58. Zhang, C.; Pu, S.; Sun, Z.; Fan, C.; Liu, G. Highly Sensitive and Selective Fluorescent Sensor for Zinc Ion Based on a New Diarylethene with a Thiocarbamide Unit. J. Phys. Chem. B 2015, 119, 4673–4682. [Google Scholar] [CrossRef]
  59. Gui, Z.; Green, A.R.; Kasrai, M.; Michael Bancroft, G.; Stillman, M.J. Sulfur K-Edge EXAFS Studies of Cadmium-, Zinc-, Copper-, and Silver-Rabbit Liver Metallothioneins. Inorg. Chem. 1996, 35, 6520–6529. [Google Scholar] [CrossRef]
  60. Deerfield, D.W.; Carter, C.W.; Pedersen, L.G. Models for protein-zinc ion binding sites. II. The catalytic sites. Int. J. Quantum Chem. 2001, 83, 150–165. [Google Scholar] [CrossRef]
  61. Kshirsagar, N.; Sonawane, R.; Patil, P.; Nandre, J.; Sultan, P.; Sehlangia, S.; Pradeep, C.P.; Wang, Y.; Chen, L.; Sahoo, S.K. Inorganica Chimica Acta Fluorescent chemosensor for Al (III) based on chelation-induced fluorescence enhancement and its application in live cells imaging. Inorg. Chim. Acta 2020, 511, 119805–119810. [Google Scholar] [CrossRef]
  62. Liu, L.; Shan, D.; Zhou, X.; Shi, H.; Song, B.; Falke, F.; Leinse, A.; Heideman, R. TriPleXTM waveguide-based fluorescence biosensor for multichannel environmental contaminants detection. Biosens. Bioelectron. 2018, 106, 117–121. [Google Scholar] [CrossRef]
  63. Xing, Y.; Zhu, Q.; Zhou, X.; Qi, P. A dual-functional smartphone-based sensor for colorimetric and chemiluminescent detection: A case study for fluoride concentration mapping. Sens. Actuators B Chem. 2020, 319, 128254–128261. [Google Scholar] [CrossRef]
Scheme 1. The synthesis of TCC.
Chemosensors 10 00032 sch001
Figure 1. Fluorescence spectral response of TCC (4.0 × 10⁻⁵ M) toward diverse metal ions (Zn2+, K+, Pb2+, Na+, Cu2+, Hg2+, Fe2+, Cd2+, Mn2+, Mg2+, Ca2+, Ni2+, Ga3+, Cr3+, Fe3+, Co3+, In3+ and Al3+; λex = 320 nm). Inset: Fluorescent pictures of TCC (4.0 × 10⁻⁵ M) and TCC (4.0 × 10⁻⁵ M) with Zn2+ (1.6 equiv).
Chemosensors 10 00032 g001
Figure 2. Fluorescence spectral response of TCC (4.0 × 10⁻⁵ M) with varied concentrations of Zn2+ex = 320 nm). The arrow from bottom to top represents that fluorescence emission increased with the increasing Zn2+ (0, 4, 8, 12,16, 20, 24, 28, 32, 36, 40, 44, 48, 52, 56, 60, 64 and 68 μM).
Chemosensors 10 00032 g002
Figure 3. Absorption variations of TCC (4.0 × 10⁻⁵ M) with varied concentrations of Zn2+. As indicated by the arrow, the absorption of 270 nm gradually decreased with the increasing Zn2+ (0, 4, 8, 12, 16, 20, 24, 28, 32, 36, 40, 44, 48, 52, 56, 60, 64 and 68 μM), while the absorption of 340 nm increased.
Chemosensors 10 00032 g003
Figure 4. A Job plot for TCC with Zn2+ex = 320 nm).
Chemosensors 10 00032 g004
Figure 5. The detection limit for Zn2+ by TCC (4.0 × 10⁻⁵ M) based on the fluorescence emission at 450 nm (λex = 320 nm).
Chemosensors 10 00032 g005
Scheme 2. The proposed response mechanism of TCC for Zn2+.
Chemosensors 10 00032 sch002
Figure 6. The fluorescence intensity for the reaction of TCC (4.0 × 10⁵ M) at 450 nm with the addition of Zn2+ (1.6 equiv) with/without other metal ions (1.6 equiv; λex = 320 nm).
Chemosensors 10 00032 g006
Figure 7. Photographs of TCC-paper strips dipped in varied metal ions.
Chemosensors 10 00032 g007
Figure 8. Fluorescence images of 6-day-old zebrafish exposed to TCC followed by the addition of Zn2+. (a1a3): TCC only; (b1b3): TCC with 150 μM Zn2+; (c1c3): TCC with 250 μM Zn2+; and (d1d3): TCC with 500 μM Zn2+. [TCC] = 50 μM. Scale bar: 2.00 mm.
Chemosensors 10 00032 g008
Figure 9. Energy-optimized patterns of (a) TCC and (b) Zn2+-2·TCC.
Chemosensors 10 00032 g009
Table 1. The determination of Zn2+ a.
SampleZn2+ Added (µM)Zn2+ Found (µM)Recovery
(%)
R.S.D. (n = 3)
(%)
Drinking water0.0*n.d.
8.00 b8.25103.120.94
Tap water0.0*n.d.
8.00 b7.9098.750.19
a Conditions: [TCC] = 40 µM in buffer. b 8 µM of Zn2+ was artificially added. *n.d.: Not detected.
Publisher’s Note: MDPI stays neutral with regard to jurisdictional claims in published maps and institutional affiliations.

