Abstract
3D hierarchical graphitic carbon nanowalls encapsulating cobalt nanoparticles HPC-Co were prepared in high yield from solid-state pyrolysis of cobalt 2,2′-bipyridine chloride complex. Annealing of HPC-Co in air gave HPC-CoO, which consists of a mixture of crystallite Co3O4 nanospheres and nanorods bursting out of mesoporous carbon. Both nanocomposites were fully characterized using SEM, TEM, BET, and powder X-ray diffraction. The elemental composition of both nanocomposites examined using SEM elemental mapping and TEM elemental mapping supports the successful doping of nitrogen. The powder X-ray diffraction studies supported the formation of hexagonal cobalt in HPC-Co, and cubic crystalline Co3O4 with cubic cobalt in HPC-CoO. HPC-Co and HPC-CoO can be used as a modified carbon electrode in cyclic voltammetry experiments for the detection of fructose with limit of detection LOD 0.5 mM. However, the single-frequency impedimetric method has a wider dynamic range of 8.0–53.0 mM and a sensitivity of 24.87 Ω mM−1 for the electrode modified with HPC-Co and 8.0–87.6 mM and a sensitivity of 1.988 Ω mM−1 for the electrode modified with HPC-CoO. The LOD values are 3 and 4 mM, respectively. The effect of interference increases in the following order: ascorbic acid, ethanol, urea, and glucose. A simple method was used with negligible interference from glucose to measure the percentage of fructose in a corn syrup sample with an HPC-CoO electrode. A specific capacitance of 47.0 F/g with 76.6% retentivity was achieved for HPC-Co and 28.2 F/g with 87.9% for HPC-CoO for 3000 charge–discharge cycles. Thus, (1) has better sensitivity and specific capacitance than (2), because (1) has a higher surface area and less agglomerated cobalt nanoparticles than (2).
1. Introduction
Diabetes is one of the life-threatening metabolic disorders, which has caused around 1.6 million deaths worldwide every year. According to the World Health Organization WHO, it is predicted that the number of people with diabetes will increase dramatically by 2030 [1,2]. High fructose level plays a crucial role in the etiological conditions of type 2 diabetes, hyperlipidemia, and cardiovascular diseases [3,4,5,6]. It has been reported that fructose is lipogenic and, in animals, 60% of the fructose energy caused obesity, hyperuricemia, hypertension, hyperglycemia, and insulin resistance [7,8]. In addition, similar results were observed in humans [9]. It has been indicated that hyperglycemia induces the production of reactive oxygen species (ROS), which leads to an increase in oxidative stress that is ultimately responsible for diabetes mellitus-related cardiovascular diseases [10]. Therefore, there is an urgent need to discover an efficient D-Fructose quantification method for clinical diagnosis, for monitoring and controlling the daily intake of D-Fructose and assessing commercial food. Although conventional detection systems of fructose such as chromatography [11,12], electrophoresis [13], and colorimetry [2] have been used, the electrochemical systems are promising alternatives due to several advantages, such as simplicity, tunability, low-cost instrumentations, short detection time, high sensitivity, selectivity, and low detection limit [14,15]. In addition, they do not require rigorous sample preparation or highly skilled operators. Electrochemical fructose sensors can be classified into two categories: Enzymatic sensors and non-enzymatic sensors. However, the enzyme-based biosensors are associated with different limitations, such as low stability, the need for cofactors, and complex immobilization procedures, though they are highly sensitive and selective to fructose at various pH [16,17,18]. Among the different types of the materials used in non-enzymatic sensors, metal oxides appeared to be interesting because they can oxidize both organic and inorganic molecules electrochemically [18]. The use of various cobalt oxide polymorphs such as CoO and Co3O4 nanostructures or hybrid nanocomposites have gained attention in biosensing applications [19,20,21]. The electrocatalytic activity of metal and metal oxide nanoparticles can be improved by using carbon supports, such as activated carbon, carbon black, nanocarbon, graphene, and graphite, since they have high electrical conductivity, large surface areas, and high mechanical resistance [22,23,24,25,26,27]. Graphitic carbon nanostructures were found to be an excellent support for the dispersion of catalyst nanoparticles. 2D graphene interacts with the catalyst, resulting in high conductivity and electron transfer [27]. Therefore, many preparation methods have been used to deposit metal or metal oxide nanoparticles on graphitic carbon nanocomposites. However, this requires several steps for the preparation of metal carbon nanocomposites. Recently, a simpler method was used to prepare metal/metal oxide carbon nanocomposites from one-step pyrolysis of cobalt and nickel complexes. It is interesting that these nanomaterials have wide application in water treatment [28,29,30,31], sensors [32] and electrochemical detection of organic molecules [21], electrocatalysis [33,34,35], and supercapacitor [36].
Normally, the most important factors that enhance the capacitive performance of nanomaterials are high electrical conductivity, large surface area, large pore volume and pore size distribution [36]. Especially for chemical sensors application nanomaterials should have large number of suitable electroactive metal species.
There is an urgent need to develop a simple, high-yield, cheap method for preparing advanced functional nanomaterials that exhibit high performance electrochemical sensors and supercapacitors. Moreover, it is of great interest to corelate the structure and composition effect of nanomaterials to electrochemical properties of supercapacitors and electrochemical sensors. For this reason, we prepared two cobalt nanomaterials, such as (a) hierarchical porous carbon/cobalt “HPC-Co” (1) and (b) hierarchical porous carbon/cobalt oxide “HPC-CoO” (2) nanocomposites, and deeply studied their electrochemical properties [36,37].
2. Experimental
2.1. Materials, Characterization Instruments, and Methods
Cobalt(II) nitrate hexahydrate (99%, SDFCL), 2,2′-bipyridine (+99%, Acros Organics, Fairrun, NJ, USA), ethanol (ACS grade, Scharlau, Germany), sodium hydroxide (pure, Acros Organic, Geel, Belgium), fructose (≥99.0%), glucose (99.5%), ascorbic acid (99%), and urea (>98%) were Merck brand.
Morphology of the nanocomposites 1 and 2 was probed using field emission scanning Electron Microscope (FESEM, JSM-6460LV, JEOL, Tokyo, Japan, and FESEM, QuantaFEG450, FEI). Scanning electron microscopy imaging studies and energy dispersive X-ray analysis (SEM-EDX) were also performed on a FEI Quanta 450FEG high-vacuum electron microscope equipped with an EDX system (elemental mapping) from EDAX, JEOL-JEM-1011, Tokyo, Japan. Transmission electron microscopy TEM and energy dispersive X-ray Spectroscopy EDS were used to measure nanoparticle size and morphology. Powder X-ray diffraction (PXRD) analysis was performed using the PAN analytical X’Pert PRO MP X-ray diffractometer with a focusing elliptical mirror and a fast-high-resolution detector (PIXCEL) at radiation wavelength of 0.15418 nm. PXRD measurements were also conducted with a Cu Kα (λ = 1.5405 Å) radiation source operating at 40 kV and 40 mA, and a divergence slit of 1/16° over the 2θ range of 1–60° with a step size of 0.01° for phase identification (using both crystallography open database COD and inorganic crystal structure database ICSD).
The structural order and disorder properties of the nanocomposites 1 and 2 was characterized using Raman DXR spectrometer-Thermo scientific. The X-ray photoelectron spectroscopy XPS spectra of the nanocomposites were measured using (SPECS GmbH, Berlin, Germany) under high-vacuum multi-technique surface analysis system equipped with an Mg-Kα 1253.6 eV X-ray source and aligned by setting C 1s line at 284.8 eV. The nitrogen adsorption isotherm was measured with a Micro-metrics 3Flex gas sorption analyzer. A 60 mg of the nanocarbon sample was degassed at 150 °C for 36 h and backfilled with nitrogen gas. Adsorption isotherms were obtained using incremental exposure to nitrogen up to 1 atm in a liquid nitrogen bath. Surface area value were calculated using Brunauer–Emmett–Teller (BET) equation included in Micromeritics ASAP 2020 V4.00 software suite.
Electrochemical analysis of the nanocomposites (1) and (2) was carried out using a potentiostat/galvanostat cyclic voltammeter (PGSTAT204, Metrohm Autolab, Utrecht, The Netherlands) with Nova software. The electrochemical cell contains three electrodes: Platinum Pt sheet (counter electrode), saturated Ag/AgCl (reference electrode), and working electrode (bare or modified glassy carbon, 3 mm in diameter).
Electrochemical impedance and capacitance measurements were achieved using a Gamry potentiostat/galvanostat/ZRA Reference 600 with software v7, using three-electrode system: Platinum wire 1 mm (counter electrode), saturated calomel electrode SCE (reference electrode), and a graphite paper coated 2 × 1 cm both sides with nanomaterials (working electrode) was used for capacitance measurement. Modified glassy carbon was used as working electrode for impedance measurement. A sinusoidal voltage perturbation of amplitude 10 mV rms was applied in the frequency range 100 kHz−0.1 Hz with 10 points/decade.
2.2. Synthesis of Hierarchical Porous Carbon Cobalt and Cobalt Oxide Nanocomposites
A 0.30 g of Co(2,2′-bipy)Cl2 complex [38] and 0.30 g of anthracene were mixed and pyrolyzed in a crucible at 300 °C for 2 h in a nitrogen atmosphere furnace “Nanyang Xinyu Furnace”. The mixture was slowly heated to 850 °C and then kept at this temperature for 10 h. After a slow cooling to room temperature, black flakes of HPC-Co (1) were obtained (0.11 g).
Hierarchical porous carbon cobalt oxide nanocomposite, HPC-CoO (2) was prepared by heating 0.3 gm of flakes HPC-Co (1) in an air furnace for 2 h at 400 °C. After cooling, 0.18 gm of black powder of (2) was obtained (Figure 1).
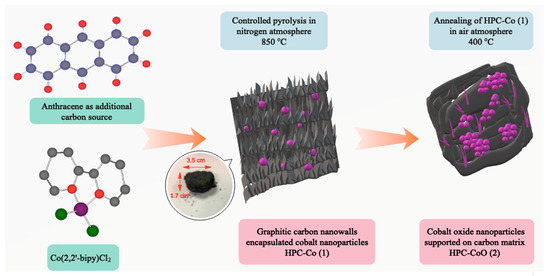
Figure 1.
An illustrative diagram of synthesis of cobalt-carbon nanocomposites.
2.3. Preparation of Modified Electrodes
A 0.5 mg of nanocomposite (1) or (2) was mixed with 0.5 mL of deionized water and 12.5 μL of Nafion solution. The suspension was sonicated and then drop-casted on a polished glassy carbon electrode (3.0 mm diameter). The modified glassy carbon electrode was dried in an air oven at 70 °C. The modified graphite paper electrode used to test capacitance was prepared by successive drop-pasting of continuously sonicated 50 μL of Nafion, 1.5 mL deionized water and 1.5 mg of nanocomposites (1) or (2). The casting was done on two sides of graphite paper each of area 1 cm × 2 cm.
3. Results and Discussion
3.1. Characterization of Nanocomposites
The size and surface morphology of the as-synthesized hierarchical porous carbon cobalt HPC-Co and cobalt oxide HPC-CoO nanocomposites were characterized by scanning and transmission electron microscopy. SEM images of HPC-Co (1) (Figure 2a) exhibits ultrathin hierarchical graphite nanowalls embedding cobalt nanoparticles with diameter less than 500 nm. The distribution of cobalt nanoparticles is accurately spotted in the SEM image taken with high-contrast vCD detector (Figure 2b). Formation of graphite is further confirmed by TEM (Figure 2c). It revealed the crinkled and rippled signature of graphene sheets [39]. After annealing in air, the morphological structure remarkably changed as the graphitic nanowalls collapsed and converted to mesoporous carbon in HPC-CoO (Figure 2d). Furthermore, the exposed cobalt nanoparticles were oxidized to congregated nanospheres with a wide range of diameters and to some randomly pointed cobalt oxide nanorods (Figure 2e). The average diameter of the cobalt oxide nanorods are less than 22 nm and the length of the nanorods can be up to ~440 nm approximately.
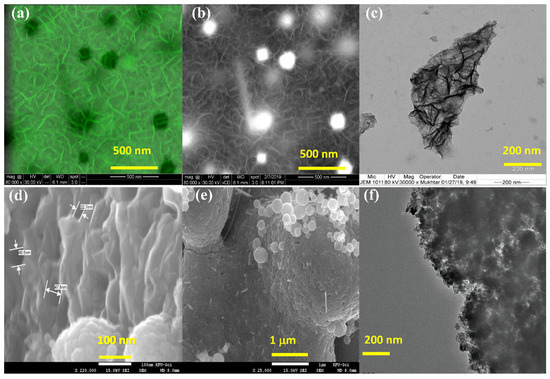
Figure 2.
(a) High-magnification SEM image of HPC-Co (1), (b) SEM image of (1) using high-contrast detector, (c) TEM image of (1) and (d–e) SEM images of HPC-CoO (2) at different magnifications and (f) TEM image of (2).
Thus, HPC-CoO were prepared from HPC-Co by heating in an air furnace at 400 °C for 2 h. During this process, some cobalt nanoparticles were oxidized to cobalt oxides nanoparticles and grouped to form either nanorod or nanospheres. The percentage of surface coverage ratio for nanoparticles with respect to graphite matrix is less than 20%, while the percentage of surface ratio for nanorods to nanospheres is less than 1%. The increased in the formation of cobalt nanospheres compared to nanorods can be because the first was formed faster because of less geometric restriction for their formation. Another reason is that the nanospheres were formed in the region where concentration of cobalt species is high. Also, the rate of heating and the final temperature of heating might affect the supply of cobalt species to the point where the nanoparticles were formed and agglomerated.
TEM of the HPC-CoO (Figure 2f) clearly shows microporous structures with nanoparticles of size around 20 nm. TEM/EDS cobalt, carbon, nitrogen and oxygen elemental mapping studies (Figure 3a) with scale 500 nm, clearly indicates the presence of nitrogen in HPC-Co and proves successful doping of nitrogen in (1). Figure 3b with scale 200 nm, shows the presence of abundant oxygen on the surface of HPC-Co. This indicates successful transformation of (1) into oxygenated nanocomposites form (2) and supports the existence of cobalt oxide nanoparticles and graphitic oxide. Energy dispersive X-ray analysis (SEM/EDX) were performed on HPC-Co (1) and HPC-CoO (2). Figure 4a is the EDX of (1) which consists of almost uniform cobalt nanocarbon structures with elemental percentage of weight composition of C 73.74%, N 3.70%, O 9.20% and Co 13.36%. On the other hand, three regions of (2) were mapped. Figure 4b with agglomerated cobalt oxide nanoparticles and nanorods has Co 72.80% and O 23.68%. Figure 4c with mostly cobalt nanoparticles has Co 93.2%. The region with abundant mesoporous carbon shown in Figure 4d has C 60.15%.
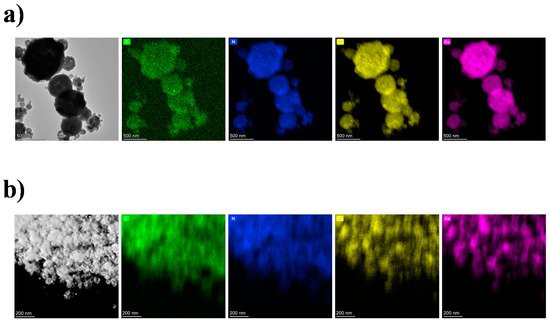
Figure 3.
TEM elemental mapping of carbon, nitrogen, oxygen and cobalt in (a) HPC-Co (1) and (b) HPC-CoO (2).
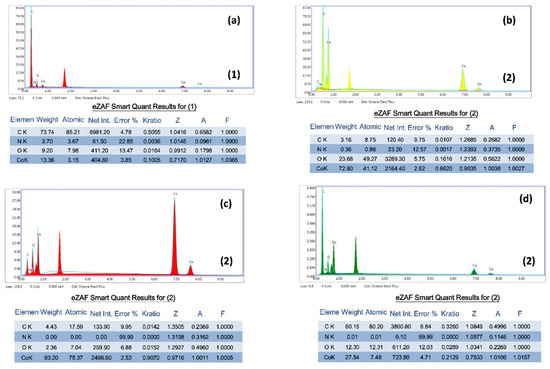
Figure 4.
Energy dispersive X-ray analysis (SEM/EDX) (a) of (1); while (b–d) are for (2) in three different mapping regions.
The microstructural properties of HPC-Co and HPC-CoO were investigated using nitrogen BET adsorption/desorption isotherms (Figure 5a). The nitrogen adsorption and desorption isotherms of HPC-Co and HPC-CoO were fitted to BET model. The fitted nitrogen isotherm showed higher surface area of 362.0 m2/g for HPC-Co and poor nitrogen uptake for HPC-CoO sample of only 5.2 m2/g. The BJH fitting method is used to determine pore size distribution of the HPC-Co and HPC-CoO nanocarbons (Figure 5b,c). The average pore size of nanocarbon HPC-Co was 53.4 Å, while the pore volume ranged between 0.081–0.114 cm3 g−1. This clearly indicate macro-porous nature of the nanocarbon HPC-Co. On the other hand, HPC-CoO exhibits nonporous property due to the poor nitrogen uptake. HPC-Co showed a H2 type hysteresis showing desorption pore blocking effects. The significant decrease in the surface area of HPC-CoO is attributed to the collapsing of the 3D nanowalls after annealing in air.
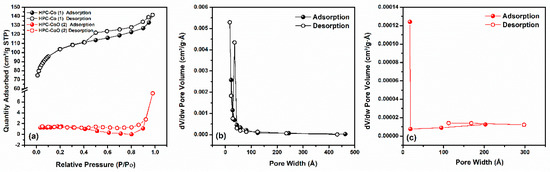
Figure 5.
(a) BET sorption isotherm of nanocarbons HPC-Co (1) and HPC-CoO (2) at 77 K, (b) BJH pore size distribution curve of (1) and (c) BJH pore size distribution curve of (2).
The crystalline nature of the HPC-Co and HPC-CoO were investigated using PXRD studies, Figure 6. The PXRD of HPC-Co showed sharp strong peaks corresponding to the (311), (202), (200) and (111) planes of hexagonal cobalt (JCPDS96-901-2950). PXRD studies supported the formation of cubic crystalline Co3O4 and cubic phase cobalt in both nanomaterials. This indicates that cobalt ions were reduced during pyrolysis to cobalt(0) nanoparticles. The later catalyzes the formation of graphite carbon from decomposed bipyridine ligands and anthracene.
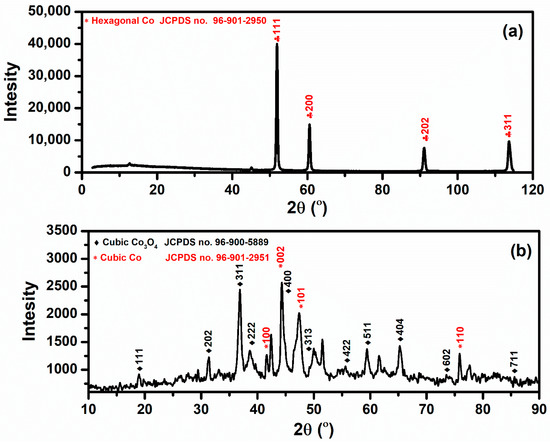
Figure 6.
(a) XRD of HPC-Co (1) and (b) XRD of HPC-CoO (2).
In the Raman spectra of HPC-Co, G band is characteristic of sp2 hybridized carbon in ordered graphite and usually appears at 1576-1580 cm−1 range [40]. HPC-Co shows G band at 1592 cm−1, Figure 7. The 12 cm−1 upshift in G band is due to strain, doping and the number of layers present in the HPC-Co nanocomposite [41]. The observed D band at 1339 cm−1 is characteristic of sp3 disordered or defected graphitic carbon, while the typical D band of defect graphite occurs at ~1350cm−1 [42]. The shift in D band is due to oxygen functional groups in the HPC-Co (as XPS revealed) which caused variation in bond distances of C-C and thus distortion of graphene [43]. The degree of graphitization is inferred from the ratio of intensity of disordered to graphitic carbon ID/IG [44]. The calculated value for HPC-Co 0.98 indicates the presence of graphitic carbon. HPC-Co shows also a broad 2D band at about 2750 cm-1 with relatively low intensities due to the large number of graphene layers [41,45]. Peak at 690 cm−1 was observed in Raman of HPC-Co and accompanied by two weaker peaks at ~ 510 cm−1 and ~ 480 cm−1. This is characteristic of Raman active modes of micro- and nano-crystalline Co2O3 [30].
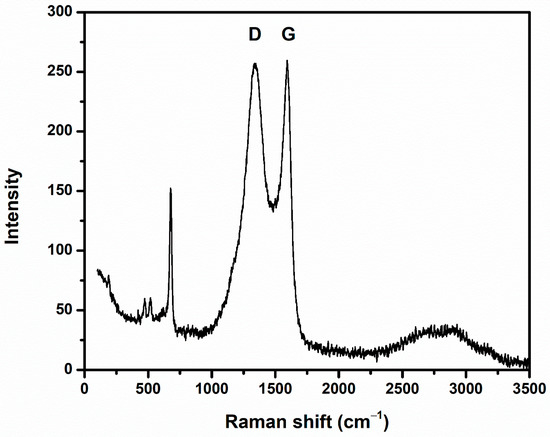
Figure 7.
Raman spectrum of HPC-Co (1).
XPS analysis of HPC-Co nanocomposite confirms the existence of three elements with atomic percentage, cobalt Co 2p3/2 (3.99%), oxygen O 1s (24.83%) and carbon C 1s (71.18%), (Figure 8). High-resolution of C 1s is deconvoluted to four individual curves. The curve assigned to sp2 hybridized carbon appears at 284.6 eV [46]. The three other signals appearing around 285, 286, and 289 eV are attributed to C−O /or amorphous carbon, C=O and COOH in the material surfaces, respectively [47,48]. It is noticeable that carbons with C−C bonds are predominant in HPC-Co, atomic percentage (36.89%), compared with other carbon groups C−O, O=C−OH and C=O which account for only 16.57%, 6.24% and 11.46%, respectively. In the deconvolution of O 1s spectra of HPC-Co, the peak located at 529.57 eV is due to the binding energy of Co−O bond [49]. The peak centered at 531.99 eV and 533.92 eV is attributed to C=O and C−O functional groups in the HPC-Co [48,50]. In the deconvoluted Co 2p2/3 spectra, Co3+ peak was observed at 780.77 eV accompanied with a relatively weak satellite peak around 790.0 eV [51]. The peak at 782.82 eV is attributed to Co2+ [52] for the HPC-Co nano composite.
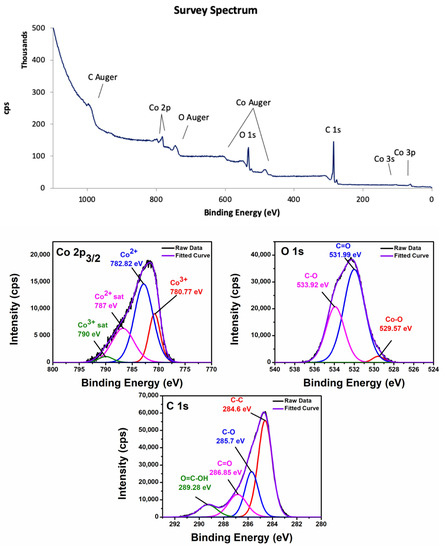
Figure 8.
XPS spectrum of HPC-Co (1) and the high-resolution spectra of Co, O, and C.
3.2. Electrochemical Behavior of HPC-Co and HPC-CoO Modified Electrodes
Cyclic voltammetry (CV) was conducted in 0.1 M NaOH solution to probe the electrocatalytic activity of HPC-Co and HPC-CoO casted on glassy carbon electrodes. The CV was measured in the potential window (−0.2 to 0.8 V vs. Ag/AgCl) and a scan rate of 25 mV/s in the absence and presence of 1.09 mM fructose. Two redox peaks are observed in the absence of fructose (Figure 9). The first redox couple labeled as (I/II) is attributed to the reversible transition between CoOx and CoOOH, (Equation (1)). The second redox couple labeled (III/IV) is attributed to further oxidation of cobalt to CoO2 at higher potential, (Equation (2)) [16,53]. The redox reaction can be represented as follows [53] Equations (1) and (2):
CoOx + OH− ↔ CoOOH + e−
CoOOH + OH− ↔ CoO2 + H2O + e−
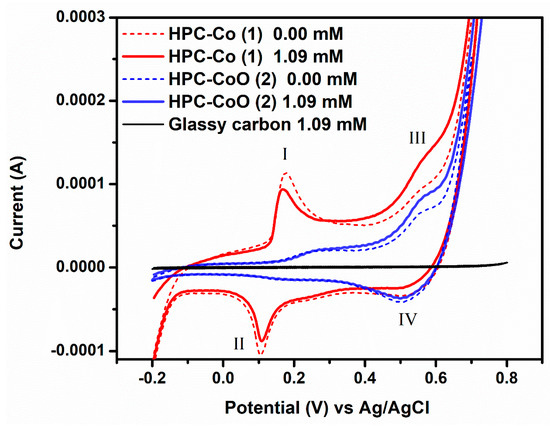
Figure 9.
Cyclic voltammetry in 0.1 M NaOH solution at a scan rate of 25 mV s−1 of the bare glassy carbon electrode in the presence of 1.09 mM fructose and of HPC-Co (1) and HPC-CoO (2) electrodes in the presence and absence of 1.09 mM fructose.
For HPC-Co (1), the cathodic and anodic currents of (I/II) redox peaks decrease in the presence of fructose. This can be attributed to the complexation of fructose with HPC-Co. Therefore, the electron transfer is blocked and hence the active surface area decreased [54]. For HPC-CoO, the current intensity for both cathodic and anodic peaks of (I/II) redox couple remains unchanged in the presence of fructose. Both HPC-Co and HPC-CoO modified electrodes showed an increase in the anodic peak of (III/IV) in the presence of fructose, indicating good electrocatalytic activity of CoO2 toward fructose oxidation. The bare glassy carbon electrode showed no redox peaks in the presence or absence of fructose, indicating the inactivity towards fructose oxidation. Although the mechanism of the electrooxidation of fructose by cobalt oxide in an alkaline medium remains unclear, it can be simplified as follows [16] Equations (3) and (4):
Co(IV) + fructose → intermediate + Co(III)
Co(IV) + intermediate → product + Co(III)
The possible intermediate is 5-Hydroxymethylfurfural (HMF), while the possible products are 2,5-diformylfuran (DFF), and sodium 5-formyl-2-furancarboxylate salt (Na2FFCA).
It is worth mentioning that the increase in (III/IV) anodic peak intensity for HPC-Co is higher than that for HPC-CoO. This can be attributed to the enhanced electrical conductivity of HPC-Co (1) due to synergistic effect of metallic cobalt nanoparticles and graphitic nanowalls present in HPC-Co.
Also, Co mainly present in HPC-Co works better than Co(IV)O2 and Co3O4 mainly present in HPC-CoO, this can be attributed to the ease of oxidation of Co to oxidized form that facilitate oxidation of fructose. We expected that HPC-CoO with abundant oxidized cobalt in the form of CoO2 and Co3O4 to work as a better oxidizing agent for fructose than HPC-Co. However, the distribution of cobalt oxides species is not uniform through the graphite matrix of (1). The cobalt oxides nanoparticles are agglomerated into a few nanorods and to large number of nanospheres of size 50 to 500 nm that are grouped together. This causes a decrease in their exposed surface area and contact with fructose (SEM, Figure 2d,e). This results in subsequent reduction in their electrocatalytic activities. This contrasts with electroactive species in (1) where the cobalt nanoparticles 50 to 100 nm are uniformly distributed in the graphitic matrix (SEM Figure 2a,b). Thus, (1) retained high surface area for contact with fructose and showed enhanced electro catalysis.
Voltammograms can be measured as a function of fructose concentration and thus play an important role to evaluate the electrocatalyst efficiency. Therefore, CV was conducted at different fructose concentrations in the range 1.1 to 18.8 mM at a scan rate of 25 mV/s. As fructose concentration increases, the (III/IV) peak current increases for both modified electrodes, Figure 10a,b.
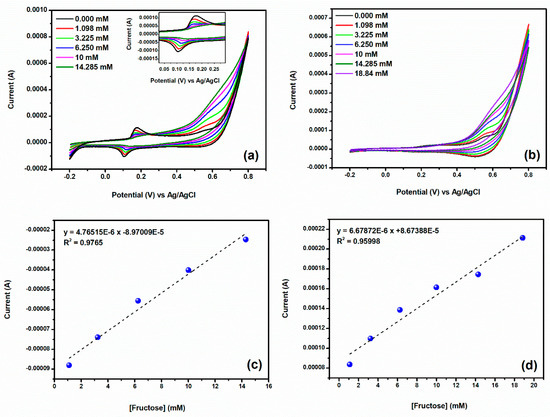
Figure 10.
Effect of fructose concentration in 0.1 M NaOH solution at a scan rate of 25 mV s−1 using (a) HPC-Co (1) modified electrode and (b) HPC-CoO (2) modified electrode. Calibration curves obtained (c) from the redox peak (I/II) in (1) and (d) from the redox peaks (III/IV) in (2).
In the case of HPC-Co (1), the redox peak current of (I/II) is inversely proportional to fructose concentration. Therefore, this method can be used as indirect quantitative detection of fructose (Figure 10c). The redox peak current of (III/IV) is directly proportional to fructose concentration in the case of HPC-CoO (2), (Figure 10d). The lower detection limits are the same 0.5 mM for (1) and (2).
CV of the modified electrodes was recorded in the presence of fructose at different scan rates (Figure 11a,b) to study electrocatalytic reaction in detail. Both cathodic and anodic peak currents (redox (III/IV)) increased as the scan rate increased, while the positive and negative shifts were observed for Epa and Epc, respectively. In addition, the electrochemical reaction of both modified electrodes is more controlled by surface confinement rather than by diffusion process. Since for the redox peaks (III/IV), the correlation coefficient R2 of the plot of peak current against scan rate (Figure 11c for (1) and Figure 11d for (2)) is greater than that of the linear plot of current intensity vs the square root of scan rate (Figure 11e for (1) and Figure 11f for (2)) [21,55,56].
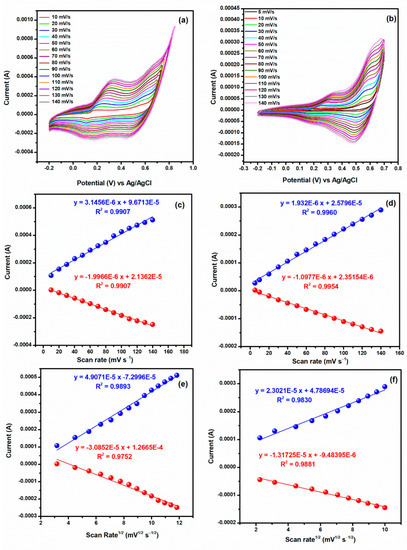
Figure 11.
Cyclic voltammograms for the oxidation of 1.09 mM fructose at (a) HPC-Co (1) electrode and (b) HPC-CoO (2) electrode in 0.1 M NaOH at different scan rates (mV s−1), (c,d) plot of current intensity for redox peak (III/IV) vs the scan rate (e,f) plot of current intensity for redox peak (III/IV) vs the square root of the scan rate of HPC-Co (1) and HPC-CoO (2) electrodes, respectively.
To verify the possibility to develop fructose sensor, the electrochemical impedance spectra (EIS) was measured for both modified electrodes with a wide range of fructose concentrations (Figure 12a,b,d,e). The plots are well fitted with the equivalent circuit represented in Figure 12d. The equivalent circuit consists of solution resistance (Rs), which reflects the ohmic resistance and the charge-transfer resistance (Rct) and Warburg element (W) connected in parallel with a constant phase element (CPE). The change of fructose concentration is well reflected through Rs/Rso as it is directly proportional to fructose concentration up to 31 mM with a sensitivity of 0.048 mM−1 for HPC-Co and up to concentration of 87.59 mM with a sensitivity of 0.0150 mM−1 for HPC-CoO (Figure 12c). Alternatively, Bode plots showed that the complex impedance increases systemically (at a frequency of 1 Hz for HPC-Co and 100 kHz for HPC-CoO) with the increased in fructose concentration up to 53 mM with a sensitivity of 24.87 Ω mM−1 for HPC-Co and up to 87.59 mM with a sensitivity of 1.988 Ω mM−1 for HPC-CoO. The limit of detections is 3 and 4 mM for (1) and (2) in both methods. Therefore, a calibration curves can be obtained based on the change in the complex impedance at a single frequency (Figure 12f). The single-frequency approach has been reported as an alternative for the change of charge-transfer resistance Rct with the increased concentration [57,58,59]. The results demonstrate that although Rs changes as function of fructose concentration could be exploited to quantify fructose, it is a time-consuming and laborious process, since the equivalent circuit should be well fitted to obtain the resistance values involved in the circuit. To our knowledge, there are a few reports that used single-frequency approach to fructose quantification. Table 1 shows comparison between HPC-Co and HPC-CoO and other reported fructose sensors in terms of linear range and limit of detection LOD. Both HPC-Co and HPC-CoO have the advantage of ease of preparation, low-cost materials, wide dynamic range, high linearity, and short detection time. In addition, the advantage of EIS is its probing relaxation phenomena for a wide frequency range. This makes measurements very precise since the response can be indefinitely steady and thus can be averaged over a long period [58].
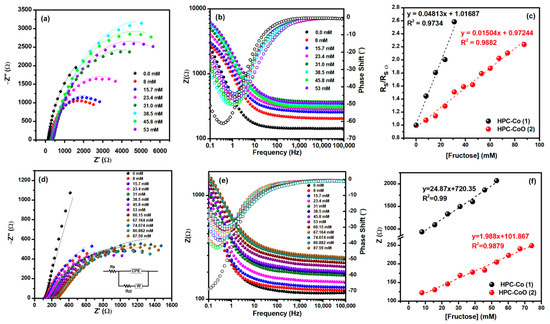
Figure 12.
(a,b) Nyquist and Bode plots of HPC-Co (1) electrode, (c) calibration curve obtained from the normalized Rs in the presence of different concentrations of fructose in 0.1 M NaOH, (d,e) Nyquist and Bode plots of the HPC-CoO (2) electrode, (f) calibration curve obtained from the complex impedance at a frequency of 1 Hz for HPC-Co (1) and 100 kHz for HPC-CoO (2) in the presence of different concentrations of fructose in 0.1 M NaOH. The best-fitted equivalent circuit is shown as inset in (d).

Table 1.
Comparison between HPC-Co and HPC-CoO sensors with the previous reported methods in the literature.
We found that HPC-Co (1) have better sensing than HPC-CoO (2). The decrease in sensor property of (2) compared to (1) is explained by decrease in surface area of nanoparticles due to agglomeration into nanospheres in the case of (2) as well as the decrease in surface area of nano carbon matrix, as indicated by the BET measurements.
Interference and Real Sample Measurement
As the selectivity is an important factor to make the designed impedimetric sensor applicable, the effects of some other potential interfering substances on solution resistance Rs of fructose were tested. Figure 13 shows the recorded Rs/Rso of 10 mM fructose in the absence and presence of 10 mM of each of urea, ascorbic acid, and ethanol, where Rso is solution resistance for the blank. For HPC-Co, there is no significant effect in the presence of ascorbic acid or ethanol (1.00%, 3.79% change, respectively). For HPC-CoO (2), Rs/Rso values changed by 5.94% and 9.17% in the presence of ascorbic acid and ethanol, respectively. In the presence of urea, the values changed by 11.18% and 18.40% for HPC-Co (1) and HPC-CoO (2), respectively. However, in the presence of glucose the interference was high, where the percentage change was 40.82% for (1) and 77.26% for (2) modified electrodes.
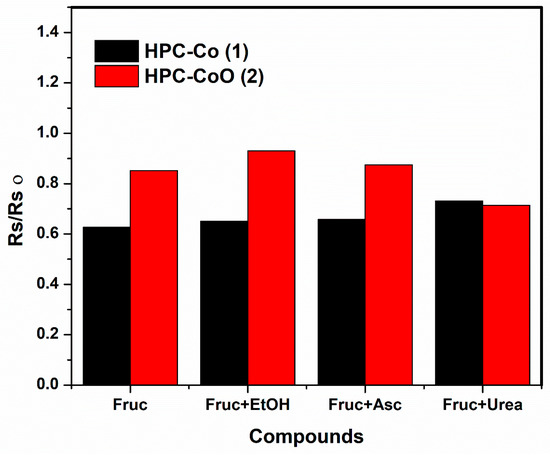
Figure 13.
Recorded Rs/Rso of 10 mM fructose in the absence and presence of 10 mM of each of urea, ascorbic acid, and ethanol by HPC-Co and HPC-CoO.
Another method, complex impedance Z (Ω) measurement at 1 Hz frequency from Bodes plot was used to study the interference effect of glucose using HPC-CoO electrode. The interference was calculated to be only 1.0%, Supplementary (Figure S1).
Complex impedance Z (Ω) measurement at 1 Hz frequency with HPC-CoO electrode was also used to calculate the percentage of fructose in a local corn syrup sample where the interference effect of glucose is minimum. The standard addition methods gave the value of fructose in the syrup to be 38.5%, Figure S2.
3.3. Capacitance Measurements
Since the specific capacitance and sensors depend on similar properties of nanomaterials such as surface area, porosity, graphitic structure, and electroactive cobalt species. We have measured the specific capacitance of nanomaterials (1) and (2).
For capacitance study, CV and galvanostatic charge–discharge has been performed using graphite paper casted with HPC-Co or HPC-CoO as a working electrode.
The specific capacitance values of (1) and (2) were calculated at the scan rates of 5 mV/s for a potential window of −0.45 to +0.55 V. The CV plot of HPC-Co showed a semi-rectangular shape demonstrating a perfect capacitive behavior shown in Figure 14. In the case of the HPC-CoO sample, the modification in oxidation/reduction peaks was observed, in addition to the capacitive nature.
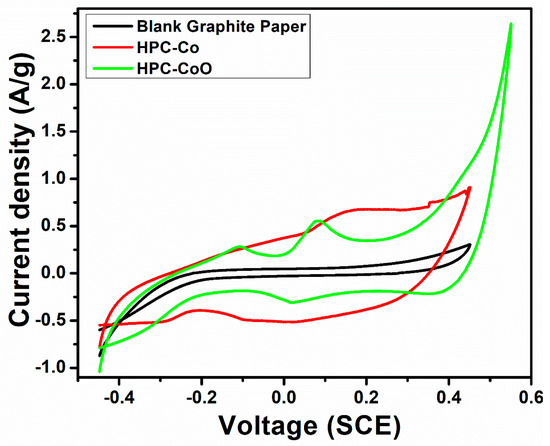
Figure 14.
Cyclic voltammetry plot of modified graphite paper with HPC-Co (1), showing semi-rectangular shape indicating a perfect capacitive behavior. For HPC-CoO (2) sample, the modification in oxidation/reduction peaks was evident.
For the calculation of specific capacitance, the following formula was used [64,65]:
Here, Cs is the specific capacitance of the material (F/g), ∆V is the potential window used (V), m is the active material mass (g), A is the area under CV curve and s is the scan rate. The obtained values of specific capacitance (F/g) for HPC-Co and HPC-CoO at scan rates of 5 mV/s were 61.94 F/g and 54.31 F/g, respectively. These results showed that HPC-Co (1) has higher value of specific capacitance than that of HPC-CoO sample.
The charge–discharge studies conducted on the HPC-Co and HPC-CoO modified graphite paper electrode were inspected by galvanostatic charge release strategy at a consistent current density of 0.25 A/g, 0.75 mA, and 1.25 A/g in the potential range from −0.45 to +0.50 V. Figure 15 and Figure 16 shows the galvanostatic charge–discharge curves of HPC-Co and HPC-CoO, respectively at 0.25 A/g, 0.75 mA, and 1.25 A/g current densities (V-t curves).
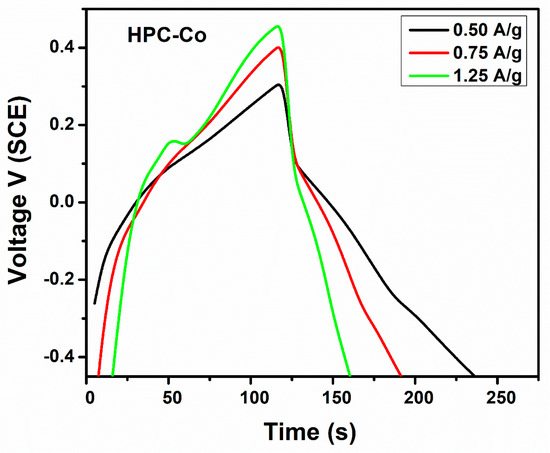
Figure 15.
Galvanostatic charge–discharge V-t curves of HPC-Co (1) at 0.25 A/g, 0.75 mA, and 1.25 A/g current densities.
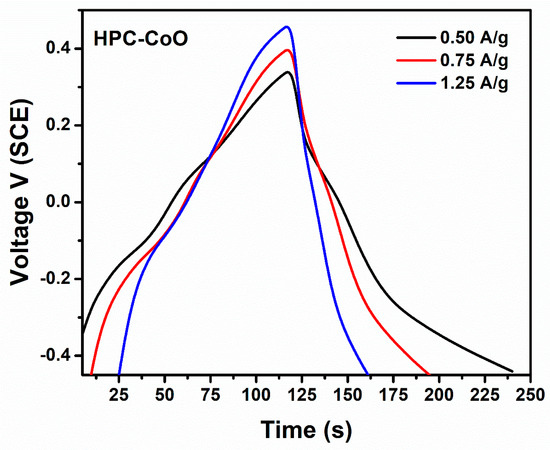
Figure 16.
Galvanostatic charge–discharge V-t curves of HPC-CoO (2) at 0.25 A/g, 0.75 mA, and 1.25 A/g current densities.
For the calculation of specific capacitance in case of charge–discharge curves, the following formula was used
where i is the discharging current, ∆t is the discharging time and m is the loading mass of the sample on current collector. The obtained values of specific capacitance (F/g) for HPC-Co and HPC-CoO at various current densities are given in Table 2.
Table 2.
Specific capacitance at different current densities.
From the above data (Table 2), it can be observed that the specific capacitance of HPC-Co has the maximum value of 49.64 F/g at the current density of 0.25 A/g.
The decrease in specific capacitance of (2) compared to (1) is related to the deformation in graphitic structure due to oxidation of nano carbon matrix which also leads to decrease in surface area and porosity. This is supported by BET measurement which indicated higher surface area of 362.0 m2/g for (1) and poor nitrogen uptake and small surface area for (2) which is only 5.2 m2/g.
To analyze stability of the HPC-Co and HPC-CoO electrodes, the recycling behavior of the HPC-Co and HPC-CoO electrodes was performed with 1mA current for 500 cycles with discharge step first and a duration of 120 s for each step, Figure S3. A 3000 cycles charge–discharge experiment was also performed with 0.5 mA current. The charging step was first and the duration of each step was 30 s, Figure 17.
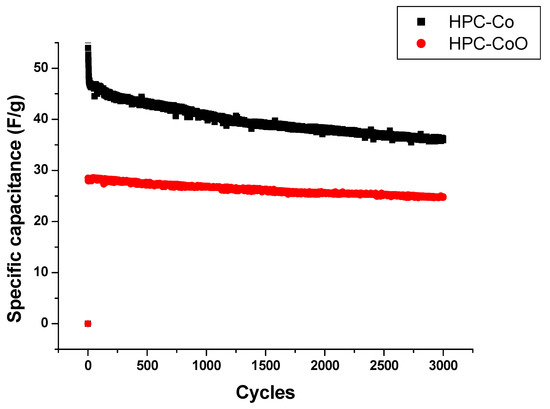
Figure 17.
Long-term cycling of HPC-Co (1) and HPC-CoO (2) electrodes for 3000 cycles.
Long-term recycling of (1) and (2) electrodes shows minor obvious fade with a small decrease of ~6%, and 9% respectively, in the specific capacitance value after 500 cycles. The decrease in the case of 3000 cycles experiment was 23.4% and 12.1% respectively. However, the rate of decrease stabilized at the final cycles. These re-cyclic stability results of HPC-Co and HPC-CoO-based electrodes indicated that minor changes might occur in the physical or chemical structure during the charge–discharge cycling procedure.
In the present study, specific capacitance of 47.0 F/g with 76.6% retentivity and specific capacitance of 28.2 F/g has been achieved with 87.9% retentivity for HPC-Co and HPC-CoO, respectively. The values are compared with other cobalt nanomaterials Table S1 (Supplementary Material), [66,67,68,69].
4. Conclusions
In this study, 3D hierarchical graphitic carbon encapsulating cobalt nanoparticles HPC-Co is prepared using cost-effective and uncomplicated solid-state pyrolysis. The prepared cobalt-carbon nanocomposite was annealed in air to give a mixture of Co3O4 crystallite nanoparticles and nanorods with a wide range of dimensions supported on mesoporous carbon HPC-CoO.
Nitrogen was successfully dopped in (1) while oxygen is abundant in (2) as expected. The hexagonal -Co phase was formed in HPC-Co during pyrolysis, while cubic crystalline Co3O4 and -Co were found in (2) as supported by PXRD studies. CV and impedimetric response toward fructose concentration of HPC-Co and its chemically modified form were studied to evaluate wide dynamic range. CV of HPC-Co can be used as indirect quantitative detection method with a linear range between 1.1–14.3 mM with LOD 0.5 mM, while single-frequency impedimetric method has wider dynamic range 8.0–53.0 for HPC-Co and 8.0–87.6 for HPC-CoO, with sensitivity 24.87 and 1.988 Ω mM−1, and LOD 3 and 4 mM, respectively.
The effect of interference on fructose sensing increases in the order ascorbic acid, ethanol, urea, and glucose. A simple method was used with negligible interference from glucose to measure the concentration of fructose in a corn syrup sample with HPC-CoO electrode.
Long-term stability of materials was tested for 3000 cycles of charge–discharge. A specific capacitance of 47.0 F/g with 76.6% retentivity was achieved for HPC-Co and 28.2 F/g with 87.9% for HPC-CoO. (1) has better sensitivity and specific capacitance than (2), because (1) has higher surface area and less agglomerated cobalt nanoparticles than (2).
Supplementary Materials
The following are available online at https://www.mdpi.com/2227-9040/9/1/6/s1, Table S1: Specific capacitance of HPC-Co and HPC-CoO compared with other materials, Figure S1: Bodes plot, complex impedance Z Ω measurement at 1 Hz frequency was used to study the interference effect of glucose using HPC-CoO electrode, Figure S2: Complex impedance Z Ω measurement at 1 Hz frequency was used to calculate the percentage of fructose in a local corn syrup sample, using HPC-CoO electrode, Figure S3: Long-term cycling of HPC-Co (1) and HPC-CoO (2) electrodes revealing minor decrease in the specific capacitance after 500 cycles.
Author Contributions
Conceptualization, H.H.H. and F.A.; methodology, all authors; software, N.A.; N.A.O.; F.A.; H.H.H., T.P.; validation, A.A. (Ameer Azam), H.H.H.; formal analysis, H.H.H., T.P., N.A. and N.A.O.; investigation, H.H.H. and F.A.; resources, H.H.H., T.P. and N.A.O.; data curation, N.A.; N.A.O.; H.H.H.; writing—original draft preparation and writing—review and editing, H.H.H., N.A., F.A. and A.A. (Ameer Azam); visualization, supervision, project administration, and funding acquisition, H.H.H. and A.A. (Abdullah Aljaafari). All authors have read and agreed to the published version of the manuscript.
Funding
This research was funded by the Deputyship for Research and Innovation, Ministry of Education in Saudi Arabia, grant number IFT20138.
Institutional Review Board Statement
Not applicable.
Informed Consent Statement
Not applicable.
Data Availability Statement
Not applicable.
Acknowledgments
The authors extend their appreciation to the Deputyship for Research & Innovation, Ministry of Education in Saudi Arabia for funding this research work through the project number IFT20138. T.P. thanks NYUAD for its support of the research program and the use of Core Technology Platform resources at NYUAD.
Conflicts of Interest
The authors declare no conflict of interest.
References
- World Health Organization. Global Report on Diabetes; World Health Organization: Geneva, Switzerland, 2016. [Google Scholar]
- Suzuki, Y.; Ikeda, A.; Ohno, K.; Fujihara, T.; Sugaya, T.; Ishihara, K. o-Azophenylboronic Acid-Based Colorimetric Sensors for d-Fructose: O-Azophenylboronic Acids with Inserted Protic Solvent Are the Key Species for a Large Color Change. J. Org. Chem. 2020, 85, 9680–9693. [Google Scholar] [CrossRef] [PubMed]
- Chen, H.; Yuan, B.; Miao, H.; Tan, Y.; Bai, X.; Zhao, Y.-Y.; Wang, Y. Urine metabolomics reveals new insights into hyperlipidemia and the therapeutic effect of rhubarb. Anal. Methods 2015, 7, 3113–3123. [Google Scholar] [CrossRef]
- Ludwig, D.S.; Peterson, K.E.; Gortmaker, S.L. Relation between consumption of sugar-sweetened drinks and childhood obesity: A prospective, observational analysis. Lancet 2001, 357, 505–508. [Google Scholar] [CrossRef]
- Schulze, M.B.; Manson, J.E.; Ludwig, D.S.; Colditz, G.A.; Stampfer, M.J.; Willett, W.C.; Hu, F.B. Sugar-sweetened beverages, weight gain, and incidence of type 2 diabetes in young and middle-aged women. JAMA 2004, 292, 927–934. [Google Scholar] [CrossRef]
- Alam, M.M.; Asiri, A.M.; Rahman, M.M.; Islam, M.A. Fabrication of sensitive D-fructose sensor based on facile ternary mixed ZnO/CdO/SnO2 nanocomposites by electrochemical approach. Surfaces Interfaces 2020, 100540. [Google Scholar] [CrossRef]
- Johnson, R.J.; Perez-Pozo, S.E.; Sautin, Y.Y.; Manitius, J.; Sanchez-Lozada, L.; Feig, D.; Shafiu, M.; Segal, M.S.; Glassock, R.J.; Shimada, M.; et al. Hypothesis: Could excessive fructose intake and uric acid cause type 2 diabetes? Endocr. Rev. 2009, 30, 96–116. [Google Scholar] [CrossRef]
- Elliott, S.S.; Keim, N.L.; Stern, J.S.; Teff, K.; Havel, P.J. Fructose, weight gain, and the insulin resistance syndrome. Am. J. Clin. Nutr. 2002, 76, 911–922. [Google Scholar] [CrossRef]
- Sievenpiper, J.L.; de Souza, R.J.; Mirrahimi, A.; Yu, M.E.; Carleton, A.J.; Beyene, J.; Chiavaroli, L.; Di Buono, M.; Jenkins, A.L.; Leiter, L.A.; et al. Effect of fructose on body weight in controlled feeding trials: A systematic review and meta-analysis. Ann. Intern. Med. 2012, 156, 291–304. [Google Scholar] [CrossRef]
- Vanessa Fiorentino, T.; Prioletta, A.; Zuo, P.; Folli, F. Hyperglycemia-induced oxidative stress and its role in diabetes mellitus related cardiovascular diseases. Curr. Pharm. Des. 2013, 19, 5695–5703. [Google Scholar] [CrossRef] [PubMed]
- Wahjudi, P.N.; Patterson, M.E.; Lim, S.; Yee, J.K.; Mao, C.S.; Lee, W.-N.P. Measurement of glucose and fructose in clinical samples using gas chromatography/mass spectrometry. Clin. Biochem. 2010, 43, 198–207. [Google Scholar] [CrossRef] [PubMed]
- Li, F.; Cousineau, C.; Xing, G.; Raha, N.; Clemens, S.; Mofikoya, M.; Kim, M.Y.; Zhang, J.Y. Development and validation of a quantitative ultra performance LC® hydrophilic interaction liquid chromatography MS/MS method to measure fructose and sorbitol in human plasma. Bioanalysis 2019, 11, 407–425. [Google Scholar] [CrossRef] [PubMed]
- Dominguez, M.A.; Jacksén, J.; Emmer, Å.; Centurión, M.E. Capillary electrophoresis method for the simultaneous determination of carbohydrates and proline in honey samples. Microchem. J. 2016, 129, 1–4. [Google Scholar] [CrossRef]
- Bollella, P.; Hibino, Y.; Kano, K.; Gorton, L.; Antiochia, R. Highly sensitive membraneless fructose biosensor based on fructose dehydrogenase immobilized onto aryl thiol modified highly porous gold electrode: Characterization and application in food samples. Anal. Chem. 2018, 90, 12131–12136. [Google Scholar] [CrossRef] [PubMed]
- Xu, D.; Luo, L.; Ding, Y.; Jiang, L.; Zhang, Y.; Ouyang, X.; Liu, B. A novel nonenzymatic fructose sensor based on electrospun LaMnO3 fibers. J. Electroanal. Chem. 2014, 727, 21–26. [Google Scholar] [CrossRef]
- Gota, T.; Chowdhury, M.; Ojumu, T. Non-enzymatic Fructose Sensor Based on Co3O4 Thin Film. Electroanalysis 2017, 29, 2855–2862. [Google Scholar] [CrossRef]
- Thévenot, D.R.; Toth, K.; Durst, R.A.; Wilson, G.S. Electrochemical biosensors: Recommended definitions and classification. Biosens. Bioelectron. 2001, 16, 121–131. [Google Scholar] [CrossRef]
- Maestre, E.; Katakis, I.; Narváez, A.; Domínguez, E. A multianalyte flow electrochemical cell: Application to the simultaneous determination of carbohydrates based on bioelectrocatalytic detection. Biosens. Bioelectron. 2005, 21, 774–781. [Google Scholar] [CrossRef]
- He, J.; Zhong, Y.; Xu, Q.; Sun, H.; Zhou, W.; Shao, Z. Nitrogen-doped graphic carbon protected Cu/Co/CoO nanoparticles for ultrasensitive and stable non-enzymatic determination of glucose and fructose in wine. J. Electrochem. Soc. 2018, 165, B543. [Google Scholar] [CrossRef]
- Wang, Y.; Wang, W.; Song, W. Binary CuO/Co3O4 nanofibers for ultrafast and amplified electrochemical sensing of fructose. Electrochim. Acta. 2011, 56, 10191–10196. [Google Scholar] [CrossRef]
- Alotaibi, N.; Hammud, H.H.; Al Otaibi, N.; Prakasam, T. Electrocatalytic Properties of 3D Hierarchical Graphitic Carbon–Cobalt Nanoparticles for Urea Oxidation. ACS Omega 2020, 5, 26038–26048. [Google Scholar] [CrossRef]
- Sudhakar, P.; Soni, H. Catalytic reduction of Nitrophenols using silver nanoparticles-supported activated carbon derived from agro-waste. J. Environ. Chem. Eng. 2018, 6, 28–36. [Google Scholar] [CrossRef]
- Cao, R.; Xia, T.; Zhu, R.; Liu, Z.; Guo, J.; Chang, G.; Zhang, Z.; Liu, X.; He, Y. Novel synthesis of core-shell Au-Pt dendritic nanoparticles supported on carbon black for enhanced methanol electro-oxidation. Appl. Surf. Sci. 2018, 433, 840–846. [Google Scholar] [CrossRef]
- Morales, D.M.; Kazakova, M.; Dieckhofer, S.; Selyutin, A.G.; Golubtsov, G.; Schuhmann, W.; Masa, J. Trimetallic Mn-Fe-Ni Oxide Nanoparticles Supported on Multi-Walled Carbon Nanotubes as High-Performance Bifunctional ORR/OER Electrocatalyst in Alkaline Media. Adv. Funct. Mater. 2020, 30, 1905992. [Google Scholar] [CrossRef]
- Khoshroo, A.; Hosseinzadeh, L.; Sobhani-Nasab, A.; Rahimi-Nasrabadi, M.; Ehrlich, H. Development of electrochemical sensor for sensitive determination of oxazepam based on silver-platinum core–shell nanoparticles supported on graphene. J. Electroanal. Chem. 2018, 823, 61–66. [Google Scholar] [CrossRef]
- Wang, P.; Zhang, X.; Wei, Y.; Yang, P. Ni/NiO nanoparticles embedded inporous graphite nanofibers towards enhanced electrocatalytic performance. Int. J. Hydrog. Energy 2019, 44, 19792–19804. [Google Scholar] [CrossRef]
- Trogadas, P.; Fuller, T.F.; Strasser, P. Carbon as catalyst and support for electrochemical energy conversion. Carbon N. Y. 2014, 75, 5–42. [Google Scholar] [CrossRef]
- Hammud, H.H.; El Hamaoui, B.; Noubani, N.H.; Feng, X.; Wu, Z.-S.; Mullen, K.; Ayub, K. Carbon-Cobalt nanostructures as an efficient adsorbent of malachite green. Nanosci. Nanotechnol. Asia 2018, 8, 263–280. [Google Scholar] [CrossRef]
- Alotaibi, N.; Hammud, H.H.; Karnati, R.K.; Hussain, S.G.; Mazher, J.; Prakasam, T. Cobalt–carbon/silica nanocomposites prepared by pyrolysis of a cobalt 2,2′-bipyridine terephthalate complex for remediation of cationic dyes. RSC Adv. 2020, 10, 17660–17672. [Google Scholar] [CrossRef]
- Alotaibi, N.; Hammud, H.H.; Al Otaibi, N.; Hussain, S.G.; Prakasam, T. Novel cobalt–carbon@silica adsorbent. Sci. Rep. 2020, 10, 18652. [Google Scholar] [CrossRef]
- Alramadhan, S.A.; Hammud, H.H. Graphene nickel silica supported nanocomposites as an efficient purifier for water treatment. Appl. Nanosci. 2020. [Google Scholar] [CrossRef]
- Kader, M.S.; Chusuei, C.C. A Cobalt (II) Oxide Carbon Nanotube Composite to Assay Dopamine. Chemosensors 2020, 8, 22. [Google Scholar] [CrossRef]
- Jiao, L.; Zhou, Y.-X.; Jiang, H.-L. Metal–organic framework-based CoP/reduced graphene oxide: High-performance bifunctional electrocatalyst for overall water splitting. Chem. Sci. 2016, 7, 1690–1695. [Google Scholar] [CrossRef] [PubMed]
- Urbańczyk, E.; Maciej, A.; Simka, W. Electrocatalytic properties of Co decorated graphene and graphene oxide for small organic molecules oxidation. Int. J. Hydrog. Energy 2020, 45, 1769–1783. [Google Scholar] [CrossRef]
- Chen, B.; Ma, G.; Zhu, Y.; Xia, Y. Metal-organic-frameworks derived cobalt embedded in various carbon structures as bifunctional electrocatalysts for oxygen reduction and evolution reactions. Sci. Rep. 2017, 7, 1–9. [Google Scholar] [CrossRef]
- Salunkhe, R.R.; Kaneti, Y.V.; Yamauchi, Y. Metal–organic framework-derived nanoporous metal oxides toward supercapacitor applications: Progress and prospects. ACS Nano 2017, 11, 5293–5308. [Google Scholar] [CrossRef] [PubMed]
- Kaneti, Y.V.; Tang, J.; Salunkhe, R.R.; Jiang, X.; Yu, A.; Wu, K.C.; Yamauchi, Y. Nanoarchitectured design of porous materials and nanocomposites from metal-organic frameworks. Adv. Mater. 2017, 29, 1604898. [Google Scholar] [CrossRef]
- Brewer, B.; Brooks, N.R.; Abdul-Halim, S.; Sykes, A.G. Differential metathesis reactions of 2,2′-bipyridine and 1,10-phenanthroline complexes of cobalt(II) and nickel(II): Cocrystallization of ionization isomers {[cis-Ni(phen)2(H2O)2][cis-Ni(phen)2(H2O)Cl]} (PF6)3·4.5H2O, and a synthetic route to asymmetric t. J. Chem. Crystallogr. 2003, 33, 651–662. [Google Scholar] [CrossRef]
- Meyer, J.C.; Geim, A.K.; Katsnelson, M.I.; Novoselov, K.S.; Booth, T.J.; Roth, S. The structure of suspended graphene sheets. Nature 2007, 446, 60–63. [Google Scholar] [CrossRef]
- Yang, Z.C.; Li, X.; Wang, J. Intrinsically fluorescent nitrogen-containing carbon nanoparticles synthesized by a hydrothermal process. Carbon N. Y. 2011, 49, 5207–5212. [Google Scholar] [CrossRef]
- Wei, D.; Liu, Y.; Wang, Y.; Zhang, H.; Huang, L.; Yu, G. Synthesis of n-doped graphene by chemical vapor deposition and its electrical properties. Nano Lett. 2009, 9, 1752–1758. [Google Scholar] [CrossRef]
- Maruyama, S.; Fukutsuka, T.; Miyazaki, K.; Abe, T. Observation of the intercalation of dimethyl sulfoxide-solvated lithium ion into graphite and decomposition of the ternary graphite intercalation compound using in situ Raman spectroscopy. Electrochim. Acta. 2018, 265, 41–46. [Google Scholar] [CrossRef]
- Ji, D.; Wan, Y.; Yang, Z.; Li, C.; Xiong, G.; Li, L.; Han, M.; Guo, R.; Luo, H. Nitrogen-doped graphene enwrapped silicon nanoparticles with nitrogen-doped carbon shell: A novel nanocomposite for lithium-ion batteries. Electrochim. Acta 2016, 192, 22–29. [Google Scholar] [CrossRef]
- Allaedini, G.; Tasirin, S.M.; Aminayi, P.; Yaakob, Z.; Talib, M.Z.M. Bulk production of bamboo-shaped multi-walled carbon nanotubes via catalytic decomposition of methane over tri-metallic Ni.Co.Fe catalyst. React. Kinet. Mech. Catal. 2015, 116, 385–396. [Google Scholar] [CrossRef]
- Srinivas, G.; Zhu, Y.; Piner, R.; Skipper, N.; Ellerby, M.; Ruoff, R. Synthesis of graphene-like nanosheets and their hydrogen adsorption capacity. Carbon N. Y. 2010, 48, 630–635. [Google Scholar] [CrossRef]
- Long, J.Y.; Yan, Z.S.; Gong, Y.; Lin, J.H. MOF-derived Cl/O-doped C/CoO and C nanoparticles for high performance supercapacitor. Appl. Surf. Sci. 2018, 448, 50–63. [Google Scholar] [CrossRef]
- Leroy, S.; Martinez, H.; Dedryvère, R.; Lemordant, D.; Gonbeaua, D. Influence of the lithium salt nature over the surface film formation on a graphite electrode in Li-ion batteries: An XPS study. Appl. Surf. Sci. 2007, 253, 11. [Google Scholar] [CrossRef]
- Alegre, C.; Modica, E.; Blasi, A.D.; Blasi, O.D.; Busacca, C.; Ferraro, M.; Arico, A.; Antonucci, V.; Baglio, V. NiCo-loaded carbon nanofibers obtained by electrospinning: Bifunctional behavior as air electrodes. Renew. Energy 2018, 125, 250–259. [Google Scholar] [CrossRef]
- Xu, W.; Lyu, F.; Bai, Y.; Gao, A.; Feng, J.; Cai, Z.; Yin, Y. Porous Cobalt Oxide Nanoplates Enriched with Oxygen Vacancies for Oxygen Evolution Reaction. Nano Energy 2018, 43, 110–116. [Google Scholar] [CrossRef]
- Sun, H.; Qu, X.; Zhao, A.; Gao, N.; Li, K.; Ren, J. Deciphering a Nanocarbon-Based Artificial Peroxidase: Chemical Identification of the Catalytically Active and Substrate-Binding Sites on Graphene Quantum Dots. Angew. Chem. Int. Ed. 2015, 54, 1–6. [Google Scholar]
- Gabe, A.; García-Aguilar, J.; Berenguer-Murcia, Á.; Morallón, E.; Cazorla-Amorós, D. Key Factors Improving Oxygen Reduction Reaction Activity in Cobalt Nanoparticles Modified Carbon Nanotubes. Appl. Catal. B Environ. 2017, 217, 303–312. [Google Scholar] [CrossRef]
- Majima, T.; Kono, E.; Ogo, S.; Sekine, Y. Pre-reduction and K loading effects on noble metal free Co-system catalyst for water gas shift reaction. Appl. Catal. A Gen. 2016, 523, 92–96. [Google Scholar] [CrossRef]
- Yu, J.; Ni, Y.; Zhai, M. Highly selective non-enzyme glucose detection based on Co-CoO-Co3O4 nanocomposites prepared via a solution-combustion and subsequent heat-treating route. J. Alloys Compd. 2017, 723, 904–911. [Google Scholar] [CrossRef]
- Batool, R.; Hayat, A.; Han, D.; Akhtar, M.A.; Niu, L.; Ahmad, M.A.; Nawaz, M.H. A nanocomposite prepared from magnetite nanoparticles, polyaniline and carboxy-modified graphene oxide for non-enzymatic sensing of glucose. Microchim. Acta 2019, 186, 267. [Google Scholar] [CrossRef] [PubMed]
- Tamiji, T.; Nezamzadeh-Ejhieh, A. Sensitive voltammetric determination of bromate by using ion-exchange property of a Sn (II)-clinoptilolite-modified carbon paste electrode. J. Solid State Electrochem. 2019, 23, 143–157. [Google Scholar] [CrossRef]
- Ghasemi, N.; Nezamzadeh-Ejhieh, A. Study of the interactions of influencing parameters on electrocatalytic determination of dopamine by a carbon paste electrode based on Fe (ii)–clinoptilolite nanoparticles. New J. Chem. 2018, 42, 520–527. [Google Scholar] [CrossRef]
- Mayorga-Martinez, C.C.; Guix, M.; Madrid, R.E.; Merkoçi, A. Bimetallic nanowires as electrocatalysts for nonenzymatic real-time impedancimetric detection of glucose. Chem. Commun. 2012, 48, 1686–1688. [Google Scholar] [CrossRef]
- Rinaldi, A.L.; Carballo, R. Impedimetric non-enzymatic glucose sensor based on nickel hydroxide thin film onto gold electrode. Sens. Actuators B Chem. 2016, 228, 43–52. [Google Scholar] [CrossRef]
- Tashkhourian, J.; Nami-Ana, S.F.; Shamsipur, M. A new bifunctional nanostructure based on Two-Dimensional nanolayered of Co (OH) 2 exfoliated graphitic carbon nitride as a high performance enzyme-less glucose sensor: Impedimetric and amperometric detection. Anal. Chim. Acta 2018, 1034, 63–73. [Google Scholar] [CrossRef]
- Aksorn, J.; Teepoo, S. Development of the simultaneous colorimetric enzymatic detection of sucrose, fructose and glucose using a microfluidic paper-based analytical device. Talanta 2020, 207, 120302. [Google Scholar] [CrossRef]
- Silva-Carrillo, C.; Reynoso-Soto, E.A.; Paraguay-Delgado, F.; Alonso-Núñez, G.; Félix-Navarro, R.M. Synthesis of PtNPs/MWCNT functionalized with 4-mercaptophenylboronic acid for an electrochemical sensor of fructose. J. Electrochem. Soc. 2017, 164, B86. [Google Scholar] [CrossRef]
- Raj, V.; Vijayan, A.N.; Joseph, K. Naked eye detection of infertility using fructose blue–A novel gold nanoparticle based fructose sensor. Biosens. Bioelectron. 2014, 54, 171–174. [Google Scholar] [CrossRef] [PubMed]
- Seraj, S.; Rouhani, S.; Faridbod, F. Fructose recognition using new ‘Off–On’ fluorescent chemical probes based on boronate-tagged 1,8-naphthalimide. New J. Chem. 2018, 42, 19872–19880. [Google Scholar] [CrossRef]
- Brousse, T.; Bélanger, D.; Long, J.W. To be or not to be pseudocapacitive. J. Electrochem. Soc. 2015, 162, A5185–A5189. [Google Scholar] [CrossRef]
- Nagamuthu, S.; Vijayakumar, S.; Muralidharan, G. Ag incorporated Mn 3 O 4/AC nanocomposite based supercapacitor devices with high energy density and power density. Dalt. Trans. 2014, 43, 17528–17538. [Google Scholar] [CrossRef]
- Iqbal, M.; Haider, S.S.; Zakar, S.; Alzaid, M.; Afzal, A.M.; Aftab, M. Cobalt-oxide/carbon composites for asymmetric solid-state supercapacitors. Mater. Res. Bull 2020, 131, 110974. [Google Scholar] [CrossRef]
- Wei, F.; Jiang, J.; Yu, G.; Sui, Y. A novel cobalt–carbon composite for the electrochemical supercapacitor electrode material. Mater. Lett. 2015, 146, 20–22. [Google Scholar] [CrossRef]
- Wang, S.; Wang, T.; Shi, Y.; Liu, G.; Li, J. Mesoporous Co3O4@carbon composites derived from microporous cobalt-based porous coordination polymers for enhanced electrochemical properties in supercapacitors. RSC Adv. 2016, 6, 18465–18470. [Google Scholar] [CrossRef]
- Zhu, J.; Zhang, X.; Zhang, S.; Wang, D. Preparation of Cobalt/Coal–Based Activated Carbon Composites with Synergistic Electrochemical Performance. Int. J. Electrochem. Sci. 2017, 12, 3991–4000. [Google Scholar] [CrossRef]


Publisher’s Note: MDPI stays neutral with regard to jurisdictional claims in published maps and institutional affiliations. |
© 2020 by the authors. Licensee MDPI, Basel, Switzerland. This article is an open access article distributed under the terms and conditions of the Creative Commons Attribution (CC BY) license (http://creativecommons.org/licenses/by/4.0/).