Article

SOI-Nanowire Biosensor for the Detection of Glioma-Associated miRNAs in Plasma

by
Kristina A. Malsagova
1,*,
Tatyana O. Pleshakova
1,
Rafael A. Galiullin
1,
Andrey F. Kozlov
1,
Tatyana S. Romanova
1,
Ivan D. Shumov
1,
Vladimir P. Popov
2,
Fedor V. Tikhonenko
2,
Alexander V. Glukhov
3,
Alexander Yu. Smirnov
4,
Olga A. Gadzhieva
5,
Boris A. Bashiryan
5,
Vadim N. Shimansky
5,
Alexander I. Archakov
1 and
Yuri D. Ivanov
1
1
Institute of Biomedical Chemistry, 119121 Moscow, Russia
2
Rzhanov Institute of Semiconductor Physics, Siberian Branch of Russian Academy of Sciences, 630090 Novosibirsk, Russia
3
JSC Novosibirsk Plant of Semiconductor Devices with OKB, 630082 Novosibirsk, Russia
4
Russian Union of Industrialists and Entrepreneurs, 109240 Moscow, Russia
5
Federal State Autonomous Institution «N. N. Burdenko National Medical Research Center of Neurosurgery» of the Ministry of Health of the Russian Federation, 125047 Moscow, Russia
*
Author to whom correspondence should be addressed.
Chemosensors 2020, 8(4), 95; https://doi.org/10.3390/chemosensors8040095
Submission received: 30 August 2020 / Revised: 23 September 2020 / Accepted: 29 September 2020 / Published: 2 October 2020
(This article belongs to the Section Materials for Chemical Sensing)

Abstract

:
Herein, we report the development of a highly sensitive nanotechnology-based system—silicon-on-insulator nanowire biosensor for the revelation of microRNAs (miRNAs), associated with the development of glioma in the human. In this system, a sensor chip, bearing an array of silicon nanowire structures, is employed. The sensor chip is fabricated using a top-down technology. In our experiments reported herein, we demonstrated the detection of DNA oligonucleotide (oDNA), which represents a synthetic analogue of microRNA-363 associated with the development of glioma. To provide biospecific detection of the target oligonucleotides, the surface of the nanowire structures is modified with oligonucleotide probes; the latter are complementary to the target ones. The concentration limit of the target oligonucleotide detection, attained using our nanowire biosensor, is at the level of DL~10−17 M. The revelation of the elevated level of glioma-associated miRNA in plasma is also demonstrated.

1. Introduction

Glioblastoma is a widely spread type of brain cancer. This oncological pathology comprises 12% to 15% of all brain tumour cases [1,2]. According to the World Health Organization (WHO), among astrocytomas, glioblastoma multiforme is characterized by grade IV. Glioblastoma is characterized by a negative prognosis: The mean value of two-year survival makes up 3%, and the three-year one is only 1% [3,4]. At present, the treatment of glioblastoma is commonly performed by a surgical removal (resection) of the tumour with subsequent radiochemotherapy (first of all, with alkylating agents such as Temozolomide) [5,6]. Despite the fact that the tumour rarely forms metastases, it actively infiltrates into surrounding brain tissues [7]. Due to the highly invasive behavior of the tumour, complete surgical removal of all involved cells is impossible [8].
In recent decades, numerous medical-biological studies were aimed at the improvement of glioblastoma therapy, and on the revelation of new therapeutic targets. To date, however, no significant results were achieved in this direction [9]. Molecular phenotyping of glioblastoma opens new opportunities for the molecule-targeted and precision therapy of cancer. MiRNAs attract particular interest as molecular targets [2,10,11]. To date, the expression of some miRNAs in malignant tumours is known to differ from that in normal tissues [12]. It was demonstrated that miRNAs participate in changing the activity of oncogens and tumour suppressors [13].
MiRNAs represent a class of short (containing about 20 nucleotides) endogeneous non-coding RNA molecules [14]. MiRNAs play a key role in RNA inactivation, and in post-transcriptional regulation of gene expression, thereby participating in numerous cell processes including cell proliferation [15], apoptosis [16], cell cycle [17], migration [18], differentiation [19], and energy metabolism [20]. In many studies, a correlation between miRNA level and the development of cancer in the human was demonstrated [21]. Thus, miRNAs play key functions in the development of glioblastoma.
To date, PubMed database (https://www.ncbi.nlm.nih.gov) includes more than 1400 research publications for the search phrase «MicroRNA and Glioblastoma» (access date: July 2020). In 2005, the group by Professor Chan et al., in their study of expression levels of various miRNA types, have demonstrated that inhibition of miR-21 leads to a significant increase in apoptosis. These authors supposed that miR-21 acts as an oncogen [22]. Subsequent studies confirmed that the miRNA spectrum is closely associated with the glioblastoma development. Among other miRNAs, the role of the following miRNAs can be distinguished: MiR-454-3p suppresses migration and invasion of cells by the regulation of CPEB1 gene expression (by a negative feedback mechanism) [23]; miR-574 inhibits proliferation and invasion of cells by direct suppression of homeobox 1 genes [24]; miR-124-3p plays a key role in providing the growth and angiogenesis of the tumour by regulating the NRP-1 gene expression [25]. To date, in the literature, more than 300 microRNAs are reported to be associated with the glioblastoma development.
The detection of miRNAs at low (10−15 M and lower) concentrations represents an actual task for both laboratory and clinical practice. The detection of oncogens at low concentrations (when commonly used clinical methods are inefficient) will allow one to improve quality and to increase the lifetime of cancer patients, as well as to select an effective drug therapy. For this purpose, the use of a highly sensitive silicon-on-insulator nanowire biosensor (SOI-NW-BS) is promising. This biosensor has an ultra-high (femtomolar) concentration sensitivity, which is necessary for the early serologic diagnostics of cancer. Other advantages of SOI-NW-BS consist of allowing one to perform label-free detection of nucleic acids in real time. Moreover, the use of microfluidic incubation (measurement) cells in such a biosensor will allow its further miniaturization.
MiRNA-363 plays the key role in the progression, development, and metastasis of the tumour; in some types of cancer, this miRNA also makes the tumour resistant to chemotherapy [26].
Herein, a chip for SOI-NW-BS, bearing an array of micron-sized silicon nanowire structures (sensors) on its surface, has been developed. oDNA, representing a synthetic analogue of miRNA-363 (associated with the development of glioma in human [27]), was used as a target object for the study. To provide biospecificity of the target oligonucleotide detection, the surface of the nanowire sensor elements was sensitized by covalent immobilization of oDNA probes, whose sequence was complimentary to that of the target oDNA. It has been experimentally demonstrated that SOI-NW-BS, whose sensor chip is sensitized with immobilized oDNA probes, can be well used for the detection of their complementary target oDNAs with a high concentration sensitivity: Namely, the concentration detection limit DL~10−17 M has been attained.

2. Materials and Methods

2.1. Chemicals

Isopropanol (C3H8O; 99.9% purity) was purchased from Acros Organics (Geel, Belgium); hydrofluoric acid (HF) and ethanol (C2H5OH, 96% purity) were purchased from Reakhim (Moscow, Russia). 3-aminopropyltriethoxysilane (APTES) was purchased from Sigma-Aldrich (St. Louis, MO, USA). 3,3′-dithiobis (sulfosuccinimidyl propionate) crosslinker (DTSSP) was purchased from Pierce (Waltham, MA, USA). Potassium phosphate monobasic (KH2PO4) was purchased from Sigma-Aldrich (St. Louis, MO, USA). Deionized water was obtained with a Simplicity UV system (Millipore, Molsheim, France).

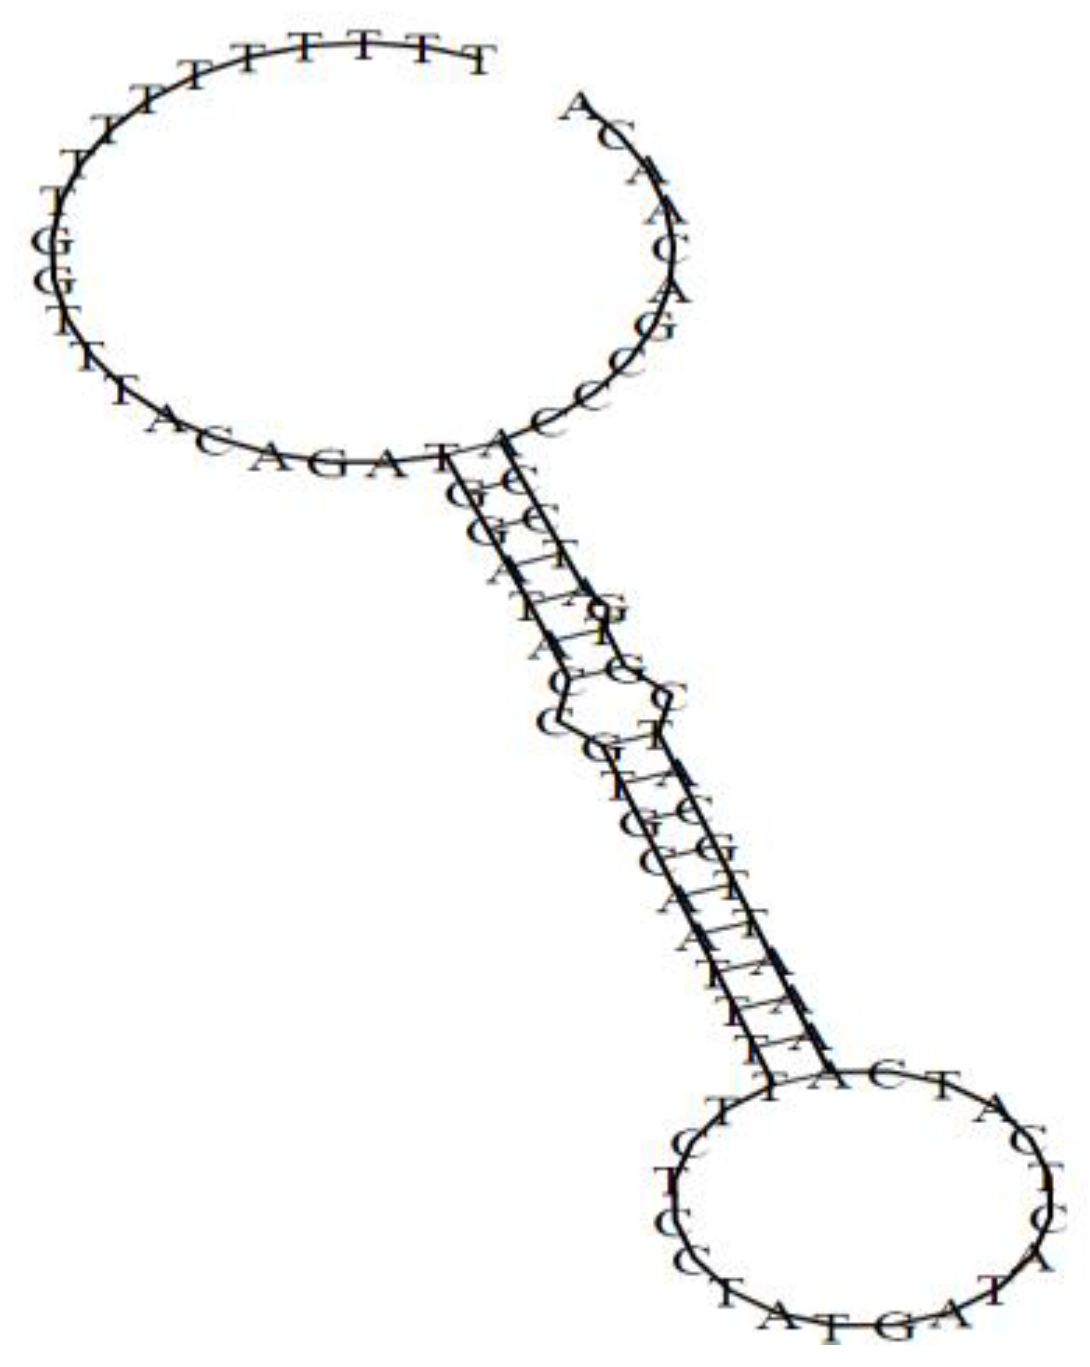
2.2. Oligonucleotides and MicroRNA

For the sensitization of the surface of working sensors, we used the oDNA probe with the following sequence: 5′-NH2-(T)10-GGTTTACAGATGGATACCGTGCAATTTTTCTCCTATGATACTCATCAAAATTGCATCGTGATCCACCCGACAACA; this sequence is complementary to that of the target oDNA (TGTTGTCGGGTGGATCACGATGCAATTTTGATGAGTATCATAGGAGAAAAATTGCACGGTATCCATCTGTAAACC), which corresponds to that of the target microRNA-363. The sequences of the oDNAs (synthetic analogues of miRNAs) were determined using the miRBase database (http://www.mirbase.org/). The oDNAs were purchased from Evrogen (Moscow, Russia). The surface of control sensors contained no immobilized oligonucleotides.
The chemical structure of microRNA-363, obtained using the RNAfold web server (http://rna.tbi.univie.ac.at/), is shown in Figure 1. The thermodynamic characteristics of this centroid secondary structure are as follows: The free energy of the thermodynamic ensemble is—18.11 kcal/mol; the frequency of the MFE structure in the ensemble is 1.45%; the ensemble diversity is 13.85.
The molecular weight of miRNA-363 is 22937.5 Da, while the guanine-cytosine (G-C) content in it is 41%. For the calculation of these data, Oligo Calc: Oligonucleotide Properties Calculator (http://biotools.nubic.northwestern.edu/OligoCalc.html) was used.

2.3. Silicon-on-Insulator Nanowire Biosensor

The SOI-NW-BS system includes two main units: An analytical one and an electronic measuring one. The analytical unit includes a 500 µL measuring cell; the sensor chip served as the cell bottom. The sensor chip was built-in into a standard microcircuit body. The surface of the sensor chip bore 10 arranged-in-pairs nanowire sensors with n-type conductance. The characteristics of the nanowire sensors are as follows: The cut-off silicon layer thickness is 32 nm; the buried oxide (BOX) layer thickness is 300 nm; the width, the thickness, and the length of each nanowire sensor are 3 µm, 32 nm, and 10 µm. The setup of the SOI-NW-BS was shown elsewhere [28,29,30,31,32,33]. The diameter of the sensitive area was ~2 mm. The solution in the cell was stirred at 3000 rpm.
The electronic measuring unit is intended for the simultaneous registration of the signal from ten sensors (which are located on the chip), and for the visualization of the signal on the screen of the personal computer in real time in the course of the experiment. The digitizing of the registered signal, the analysis, and the visualization of the measurements in graphical form were performed with a specialized software (“Agama+” JSC, Moscow, Russia).

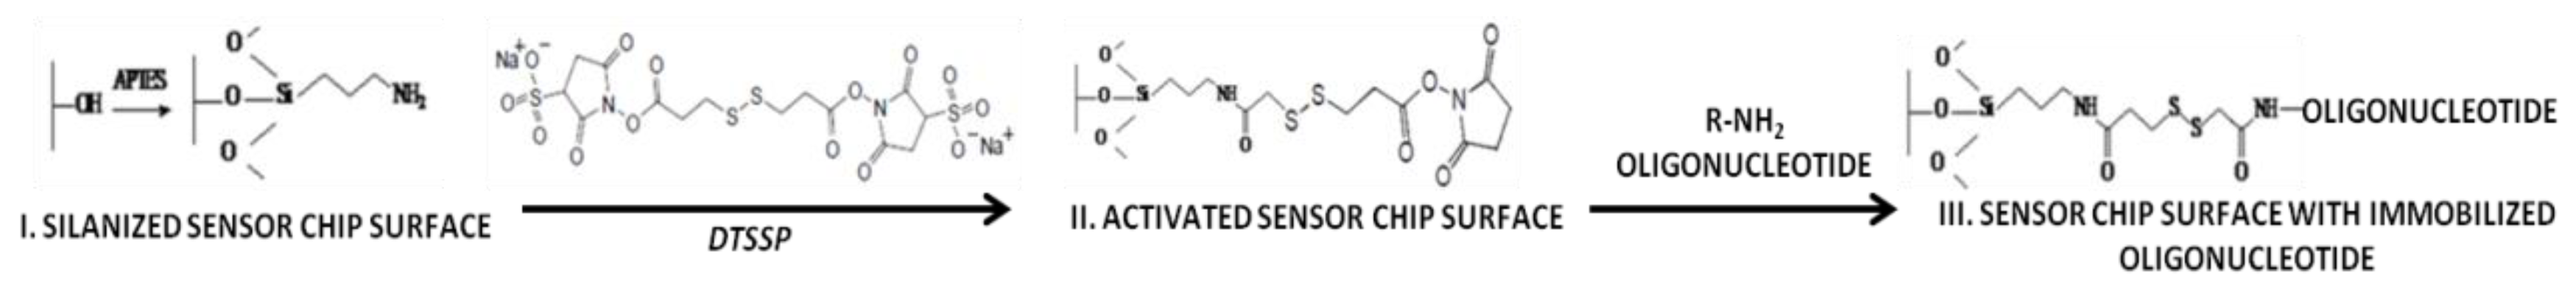
2.4. Chip Surface Modification

To remove the organic contaminants, the surface of the sensor chip was treated first with an aqueous isopropanol solution. Then, it was treated with a solution containing HF and ethanol to remove the native oxide formed during the storage of the chips. After that, the chip was placed into an ozonator (UV Ozone Cleaner—ProCleaner™ Plus, Ossila Ltd, Sheffield, UK) to form hydroxyl groups on the surface of the nanowires. The sensor chip was then silanized in APTES vapours for 20 h at room temperature [28,32]. After the silanization, the surface of the chip was washed with ethanol and dried.

2.5. Covalent Immobilization of Oligonucleotide Probes

To provide specificity of the target oDNA detection, the surface of the nanowire sensors was sensitized by covalent immobilization of oDNA probes complimentary to the target biomolecules. For this purpose, the silanized surface of the nanowire sensors was first activated with a DTSSP crosslinker. After the activation, 1 µM solution of oDNA probes in a 50 mM potassium phosphate buffer were precisely dispensed onto the surface of individual sensors with a Piezorray non-contact low-volume dispensing system (Perkin Elmer, Inc., Waltham, MA, USA). The volume of the oDNA solution, dispensed onto each nanowire sensor, was ~0.6 nL. The oDNA solutions were incubated onto the sensor surface for 0.5 h at 15 °C and then washed away.

2.6. Preparation of Solutions of Target oDNAs in the Buffer

The solutions of target oDNA with concentrations from 10−18 to 10−15 M were prepared from the initial 100 mM stock solution in the 50 mM potassium phosphate buffer (pH 7.4) by serial ten-fold dilution with a working buffer (1 mM potassium phosphate buffer, pH 7.4). At each dilution step, the solution was incubated in a shaker for 30 min at 10 °C. The solutions were prepared immediately before the measurements.

2.7. Electrical Measurements

Electrical measurements were performed employing a ten-channel data acquisition and storage system (“Agama+” JSC, Moscow, Russia). During the measurements, the support of SOI structures was used as a control electrode (transistor gate). The drain–source current vs. gate voltage dependencies (Ids(Vg) curves) were recorded at Vg from 0 to 60 V and Vds = 0.1 V. Time dependencies of the drain-source current Ids(t) were recorded in real time at Vg = 50 V and Vds = 0.1 V. To increase the time stability of SOI-NW-BS operation, an additional Pt electrode was immersed into the solution in the measuring cell analogous to [28,30,32].

2.8. Biosensor Measurements

For the detection of oDNA in the buffer, the following registration scheme was employed. The solution to be analyzed (150 μL in the 1 mM potassium phosphate buffer) was added into the measuring cell containing 300 μL of buffer, so that the final oDNA concentrations in the cell were 10−18 M, 10−17 M, 10−16 M, and 10−15 M. Control experiments were performed under the same conditions, but an oligonucleotide-free buffer solution was added into the cell. Upon the detection of miRNA, isolated from blood plasma samples, 7 μL of analyzed solution was added into the measuring cell containing 100 μL of buffer. The sensor signal from SOI-NW-BS was recorded in real time. The so-obtained data were presented in the form of sensogram curves, which represent time dependencies of dimensionless quantity of the current presented in relative units. For each nanowire sensor, the signal in relative units was calculated analogously to the technique described elsewhere [30]. Briefly, the signal obtained in the control experiments was subtracted from the absolute signal; the latter was registered upon the analysis of target oDNA solutions. Then, a differential signal between the working sensor (whose surface was sensitized with oDNA probes) and the control sensor (whose surface was free from oDNAs) was calculated. To avoid the influence of Debye screening effect, the detection of the target oDNA was carried out in a buffer with low salt concentration (1 mM potassium phosphate buffer) [34,35].

2.9. Plasma Samples

The patients were examined in the Institute of Urology and Reproductive Health (Sechenov University) and National Medical Research Center for Neurosurgery named after Academician N. N. Burdenko of the Russian Federation (Moscow, Russia). In control experiments, we used the plasma sample of a patient with prostatic hyperplasia. Plasma samples no. 14, 001, 002 (see Table 1) were tested. All experiments involving the plasma were performed in compliance with the Order no. 1177n (Ministry of Health of Russian Federation, 20 December 2012). Plasma samples were obtained from patients according to the patient examination protocol. This study was approved by independent ethical committees organized on the basis of the organizations, which provided the samples. Written informed consent was obtained from the patients and with diagnosed prostatic hyperplasia authorizing their participation in the study and the use of the biological material. To provide biological safety, all the samples were deactivated prior to their use in the study.
The blood samples were taken before treatment on an empty stomach from the cubital vein, and collected into invacutainers containing 3.8% sodium citrate anticoagulant (S-Monovett®, SARSTEDT, Nümbrecht, Germany); after that, the samples were centrifuged at 3000 rpm for 6 min at room temperature. Each plasma sample (500 μL) was finally collected into two dry Eppendorf-type polypropylene test tubes, frozen, and stored at −70 °C prior to the analysis.
For the isolation of miRNAs from the blood plasma samples, the miRCURY™ RNA Isolation Kit—Biofluids (Exiqon A/S, Vedbaek, Denmark) was employed; the isolation was performed according to the protocol provided by the manufacturer.

3. Results

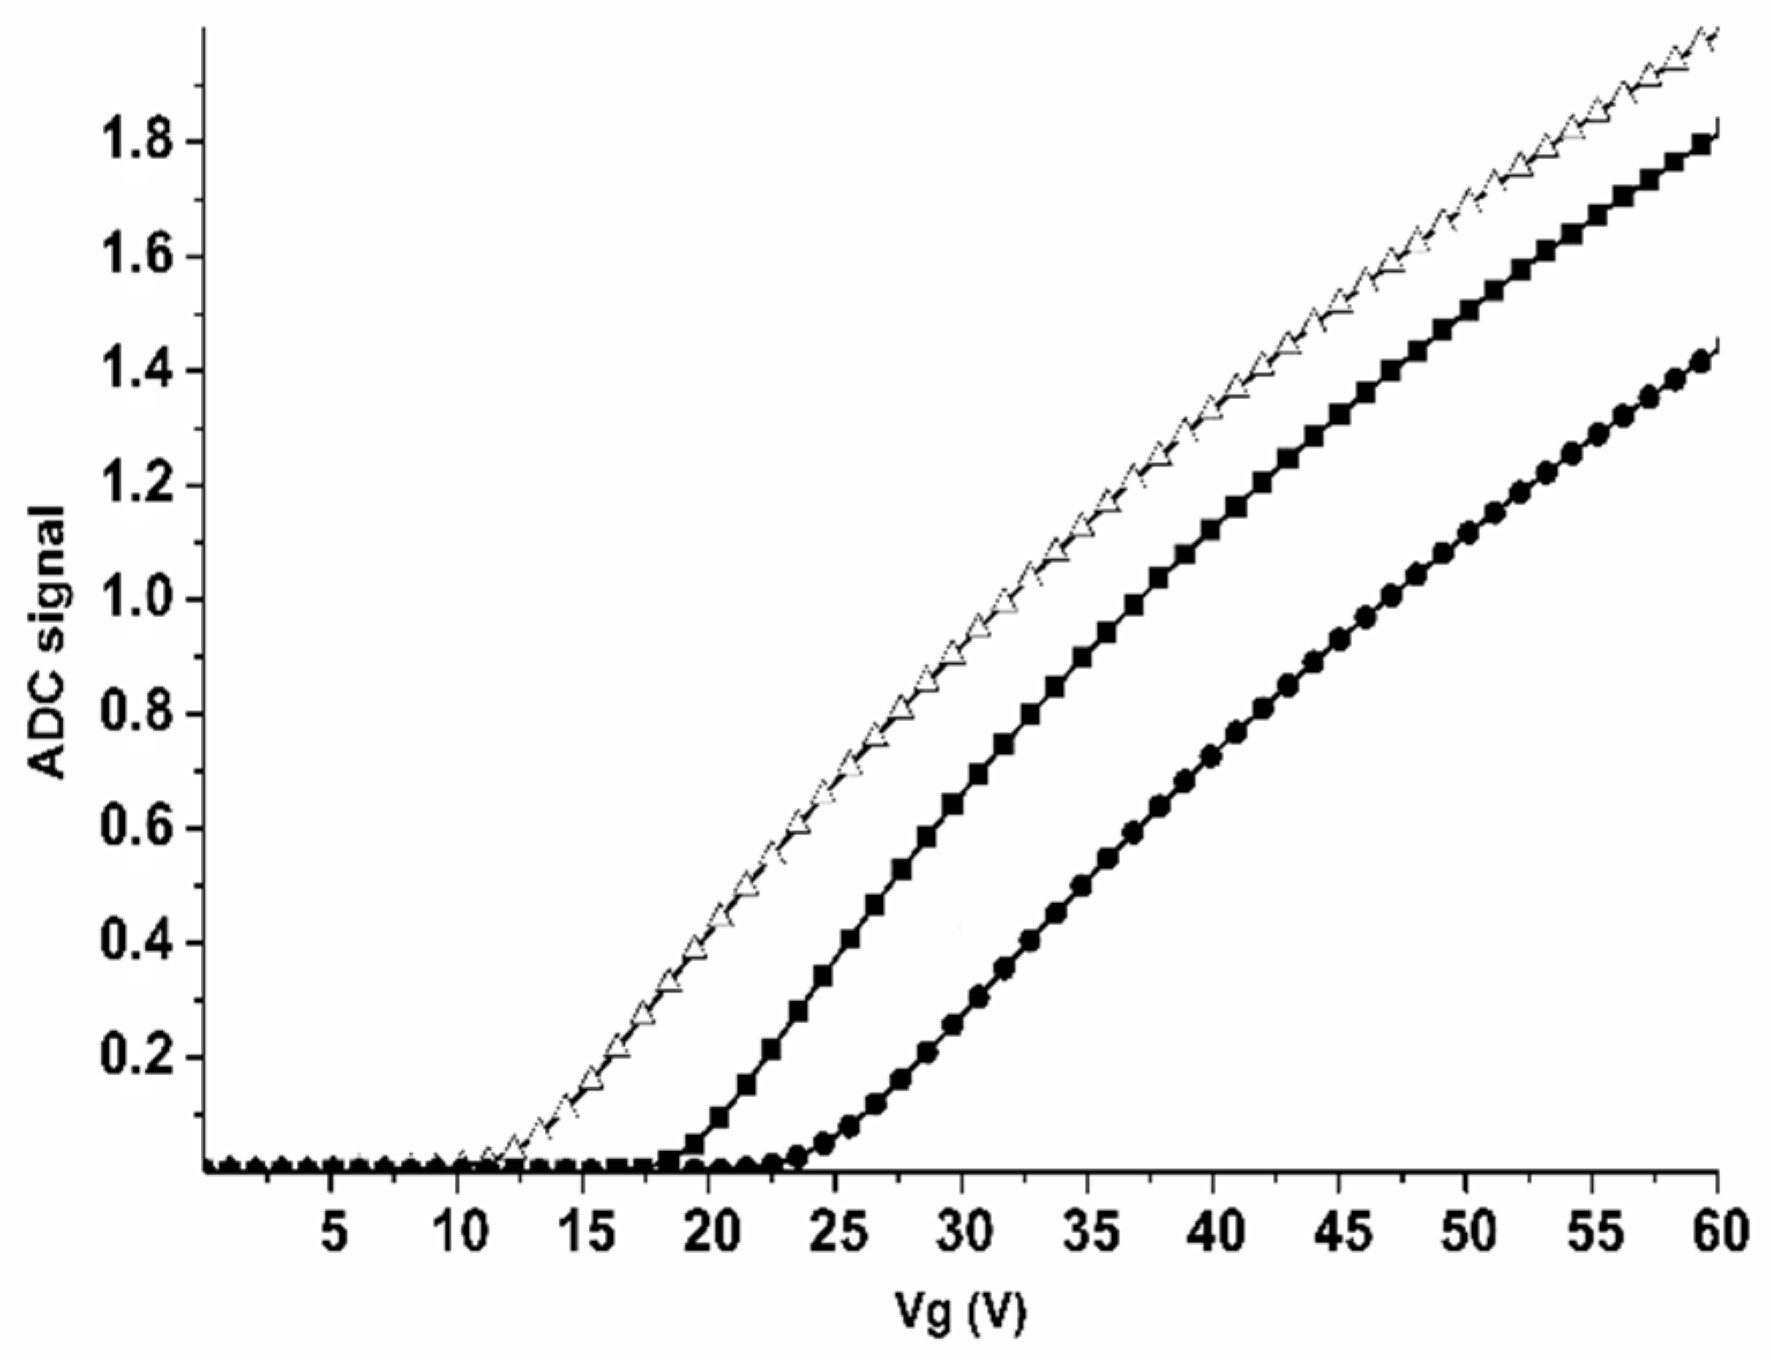
3.1. Sensitization of the Sensor Chip Surface

The functionalization of the sensor chip surface included two steps: (1) Chemical modification of the surface, and (2) its sensitization with oligonucleotide molecular probes.
The modification of the chip surface was performed to form an organic silane layer, bearing terminal primary amine groups, on it. This procedure is necessary to provide further covalent immobilization of the molecular probes onto the sensor surface.
Prior to the immobilization of the molecular probes, the sensor chip surface was activated with DTSSP. The latter represents a homobifunctional crosslinker, whose linear molecule bears NHS-ester functional groups at both ends [36]. DTSSP is a water-soluble analogue of dithiobis (succinimidyl propionate). The solubility of DTSSP in water is provided by the presence of sulfo groups in its structure [36] (Figure 2). Homobifunctional crosslinkers, bearing NHS-ester functionality, are commonly employed for a single-step covalent attachment of proteins via their amine groups [36].
NHS esters primarily react with primary amine groups of the molecules to be immobilized. In the case of immobilization of a protein, the NHS-ester functionality reacts with the available α-NH2 group, located at the N-end of the protein molecule, resulting in the formation of an amide bond. In the case of immobilization of an oligonucleotide, the primary amine group, necessary for the immobilization, is introduced into the oligonucleotide molecule during its synthesis. For this reason, this factor was taken into account upon purchasing the oDNAs from the manufacturer.
The efficiency of the chip surface functionalization was controlled by a comparative analysis of Ids(Vg) curves before and after each functionalization step. Figure 3 displays typical Ids(Vg) curves obtained for the nanowire sensor #1 (with n-type conductance) before and after each functionalization step.
From the curves shown in Figure 3, one can clearly observe that with each functionalization step the Ids(Vg) curve shifts to the right of the curve obtained on the previous step. The change in the nanowire conductance after the chemical modification and after the immobilization of oDNA probes was used as an indicator of the efficiency of the sensor surface functionalization. If such changes were observed, then the sensor chip was used in further experiments.

3.2. Determination of the Concentration Sensitivity of SOI-NW-BS upon oDNA Detection in the Buffer

The SOI-NW-BS sensor chip, sensitized with oDNA probes, was employed for the detection of complimentary target oDNA, which represents a synthetic analogue of miRNA-363 associated with the development of glioma. The solutions of target oDNA were added into the SOI-NW-BS measuring cell containing the working buffer. To provide selective detection of the target oDNA, the nanowire sensors were sensitized with oDNA probes, complementary to the target oDNA molecules. Such oDNA-sensitized nanowires are called working sensors. To account for the non-specific adsorption, the surface of the control sensors (located on the same chip) was not sensitized with any oDNA.
The results obtained in the course of the detection of target oDNA in the buffer are shown in Figure 4. This figure displays typical sensogram curves obtained upon the analysis of solutions with the target oDNA concentrations ranging from 1.0 × 10⁻¹⁸ to 1.0 × 10⁻¹⁵ M.
The curves shown in Figure 4 clearly indicate a decrease in the biosensor signal level. Moreover, from this figure, one can also see that a decrease in the signal level with decreasing the target protein concentration from 10−15 to 10−18 M was observed in these conditions. In the control experiments, when the oDNA-free buffer was added into the measuring cell, either no signal from the nanowire sensors was registered, or the change in the level of the biosensor signal amounted to only 1% to 2% from the baseline level of the current (data not shown). This allows us to draw a conclusion that there is a biospecific interaction between the sensor-immobilized oDNA probes and the target oDNA molecules, captured onto the sensor surface from the analyzed solution. It should be emphasized that replacement of the analyzed oDNA solution with the pure oDNA-free washing buffer (indicated by the arrow in Figure 4) did not lead to an increase in the biosensor signal; this is possibly caused by a very slow dissociation of (probe oDNA)/(target oDNA) complexes.
Thus, from Figure 4, one can see that the minimum concentration of the target oDNA (a synthetic analogue of glioma-associated miRNA-363), detectable with SOI-NW-BS, makes up 10−17 M.

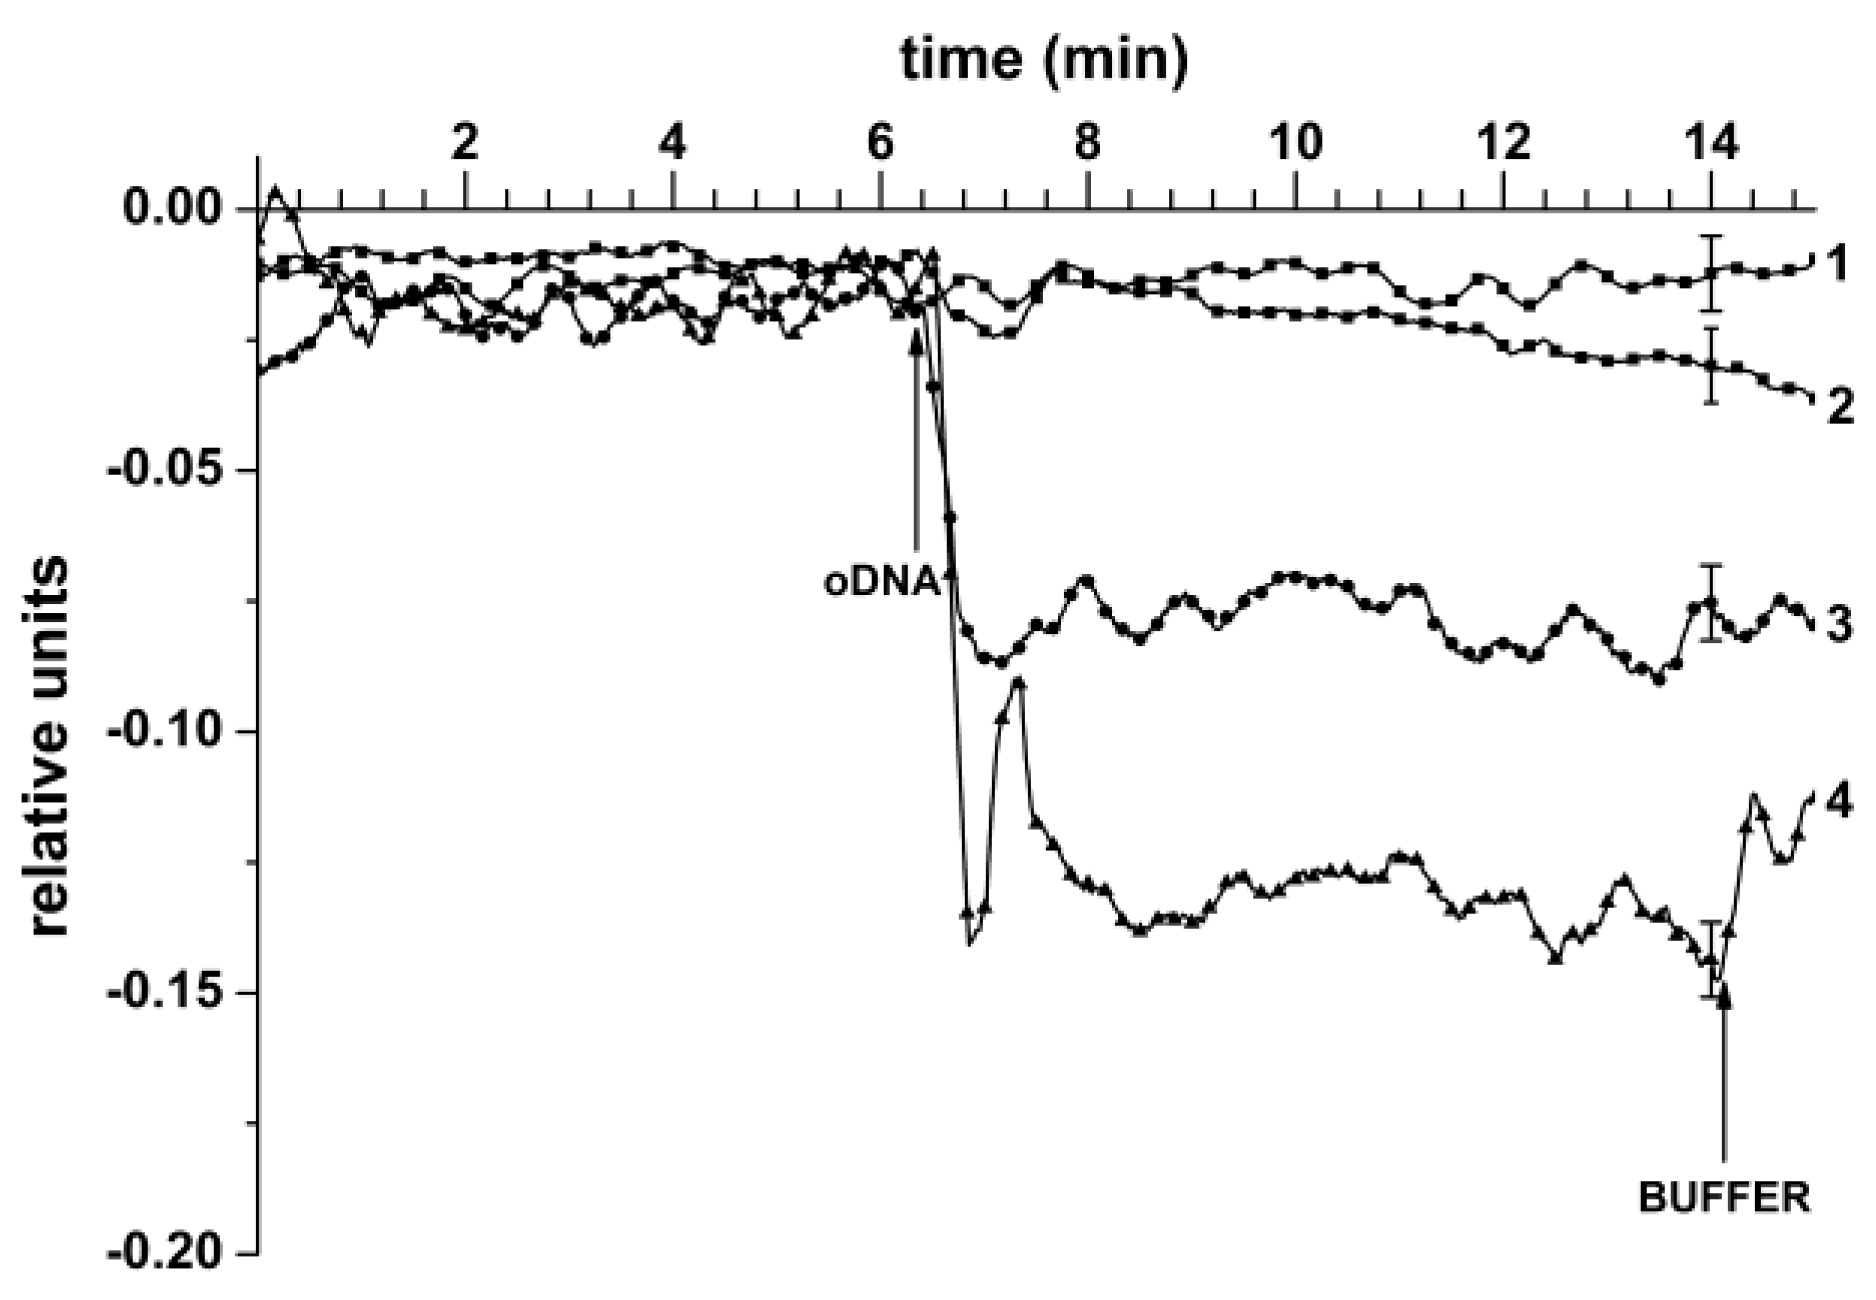
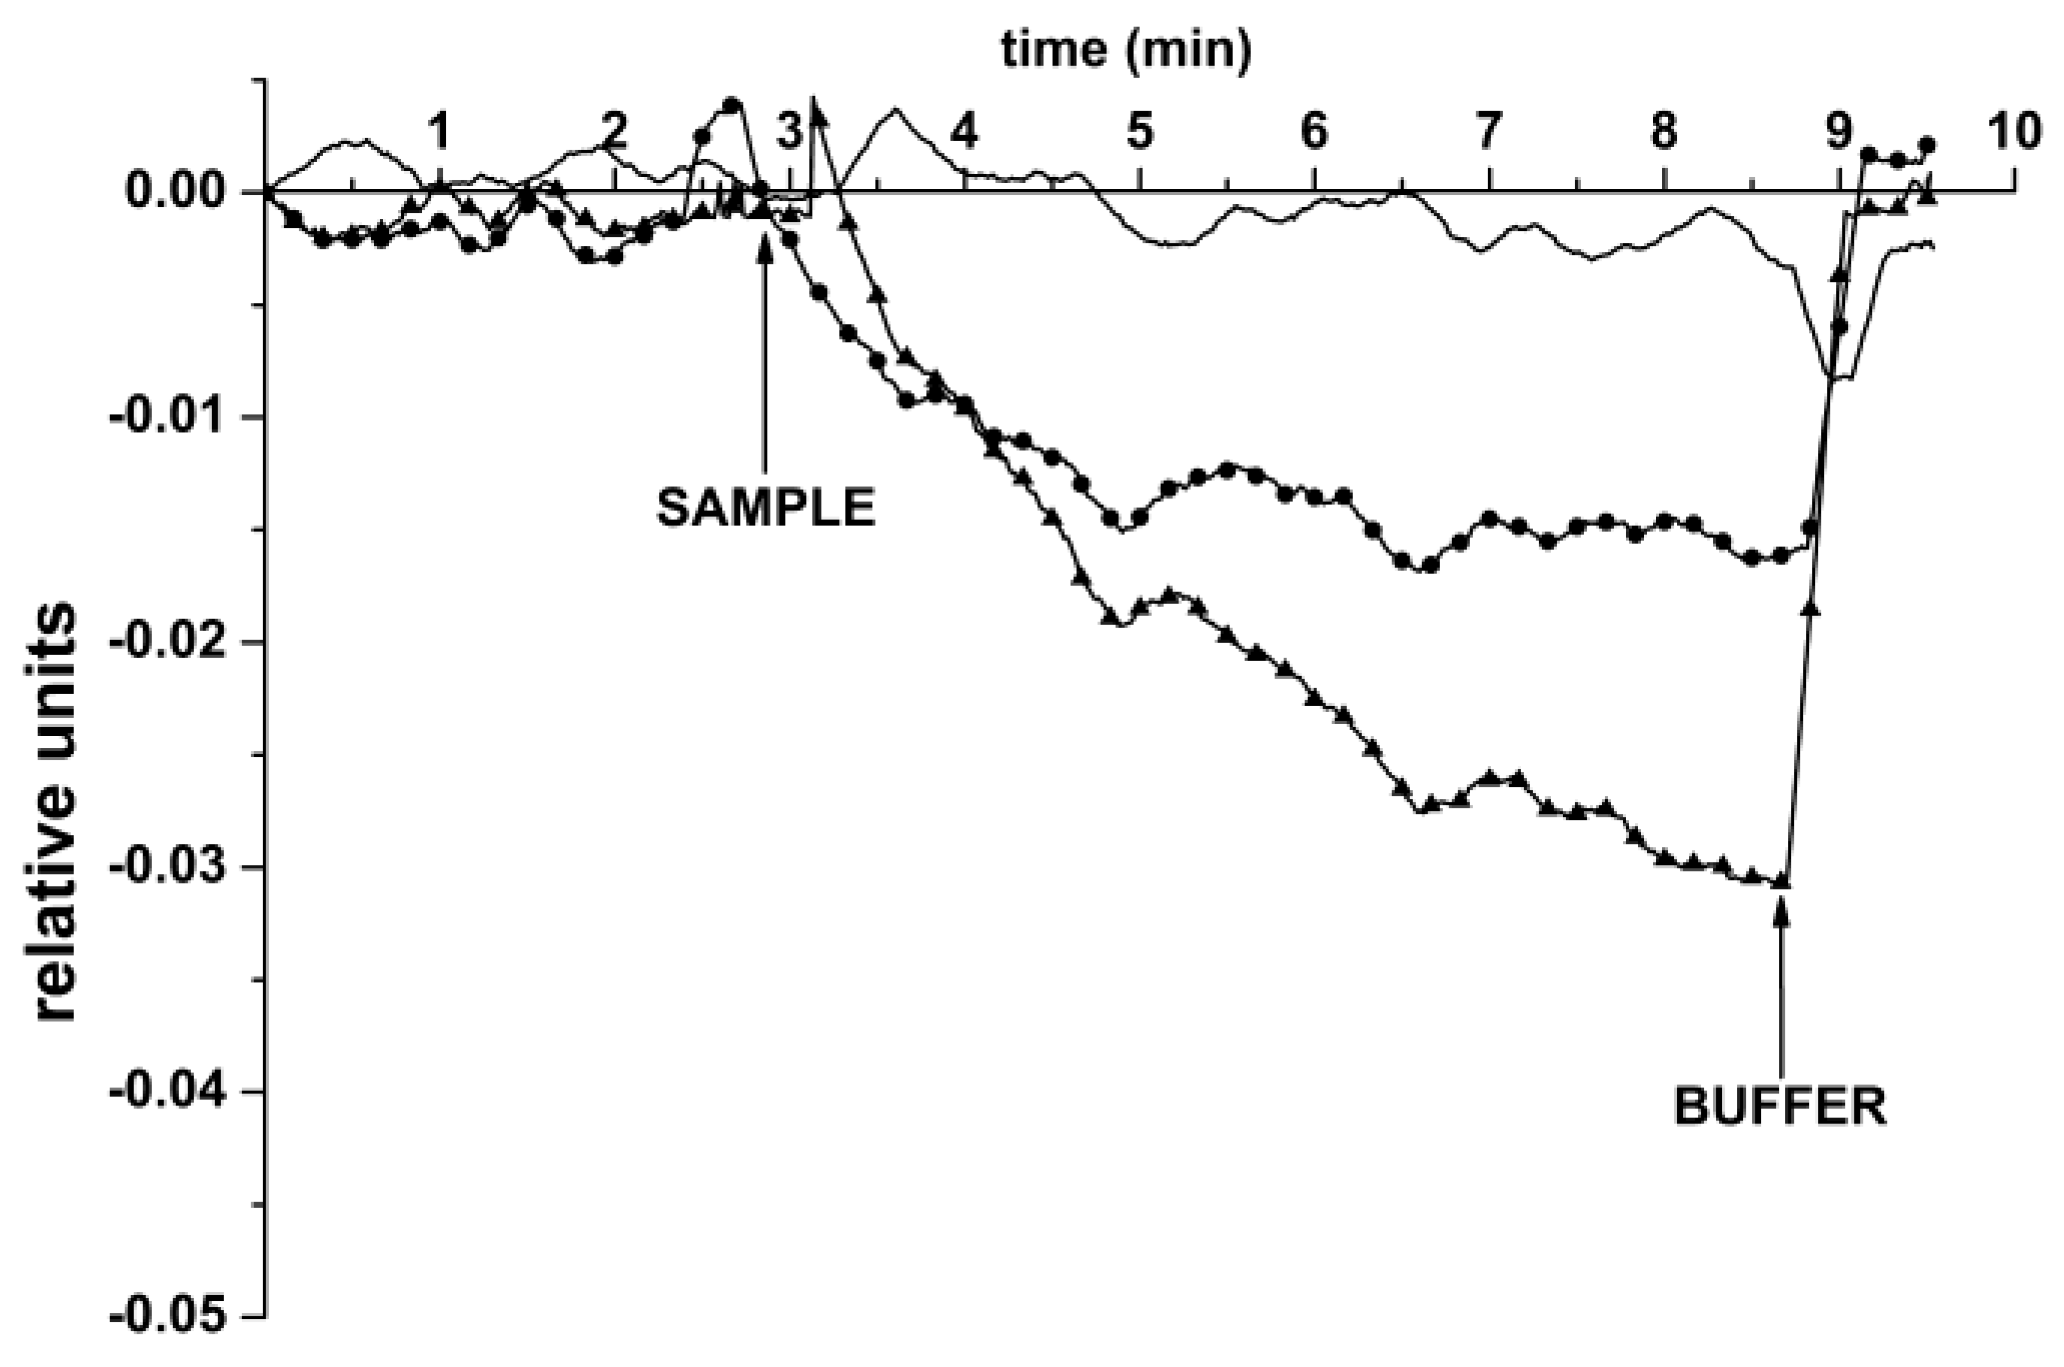
3.3. The Detection of MicroRNAs Isolated from Plasma Samples

At this stage of our study, we aimed at the determination of the possibility of the detection of miRNA, isolated from the plasma of glioblastoma patients, with our SOI-NW-BS. MiRNA, isolated from the plasma of a patient suffering from prostatic hyperplasia, was used as the control sample. The results obtained upon the detection of miRNAs, isolated from plasma samples in this experimental series, are shown in Figure 5.
As seen from Figure 5, a significant change in the level of the biosensor signal was observed upon the addition of samples of miRNAs, isolated from the plasma of patients with diagnosed glioblastoma (sample no. 001, circle markers, ●; sample no. 002, triangle markers, ▲), into the measuring cell of the SOI-NW-BS. In the control experiments with the samples of miRNAs, isolated from the plasma of a patient with diagnosed prostatic hyperplasia (curve without markers), virtually no change in the biosensor signal was registered—in comparison with the sensogram curves recorded in the working experiments. At that, the time required for the target miRNA detection, amounted to only 7 min, while this requires about several hours upon the use of commonly employed classical laboratory methods.

4. Discussion

The present research was aimed at the determination of the conditions, at which electric devices, based on “silicon-on-insulator” semiconductor sensor elements, can be successfully employed for biomedical applications. In our study, we have determined the conditions for the functionalization of the sensor surface of SOI-NW-BS chips.
In our experiments reported herein, we have also demonstrated the label free detection of miRNA-363 in the blood plasma of glioblastoma patients. According to Alfredo Conti A. et al., miRNA-363 is associated with glioblastoma [26]. Two different cases have been investigated. In the first case (case 1), the detection of synthetic oDNA analogues of the target miRNA [26] was performed. In the second (diagnostic) case, we performed the detection of the miRNAs isolated from the plasma of patients with confirmed glioblastoma diagnosis. Buffer solutions, free from synthetic oDNA (case 1), or buffer solutions of miRNAs, isolated from the plasma of a patient with prostatic hyperplasia (case 2), were used as reference ones. The model system (case 1) was studied to determine the minimum oDNA concentration, detectable in the buffer using the SOI-NW-BS.
To provide the biospecific detection of target miRNAs and model oDNAs, the surface of the nanowire sensors was sensitized with oDNA probes, whose sequences were complimentary to those of target oDNA and miRNAs. In our experiments on the detection of the model oDNA (representing a synthetic analogue of miRNA-363) with SOI-NW-BS, we have demonstrated the label-free real-time detection of the model oDNA with high (1.1 × 10⁻¹⁷ M) concentration sensitivity.
The study of the diagnostic case (case 2) was aimed at the demonstration of the possibility of the detection of target miRNAs, isolated from real plasma samples of patients, with SOI-NW-BS. In addition, we have successfully demonstrated that our SOI-NW-BS enables us to register a decrease in the miRNA level in the plasma of glioblastoma patients—in comparison with the plasma sample of a patient with prostatic hyperplasia.

5. Conclusions

The chip for the SOI-NW-BS was fabricated using the CMOS-compatible technology, gas etching, and lithography. In our study, we have demonstrated that such a SOI-NW-BS allows one to perform label-free detection of target oDNA with high (10−17 M) concentration sensitivity in real time. It has also been shown that the SOI-NW-BS can well be used for the diagnostics of oncological diseases, based on the analysis of miRNA content in blood plasma. We have also found that the SOI-NW-BS allows one to register a decrease in the miRNA level in glioblastoma patients—in comparison with that in patients suffering from prostatic hyperplasia.
Thus, the results reported herein indicate that our SOI-NW-BS represents a prototype of a diagnostic device, which can be effectively used for screening applications owing to its ability to perform multiplexed express analysis. The SOI-NW-BS equipped with a chip, bearing an array of 10 individual nanowire sensors, will presumably allow the multiplex analysis of socially important diseases, including not only oncological, but also infection-induced pathologies.

Author Contributions

Conceptualization, Y.D.I. and V.P.P.; methodology, K.A.M. and T.O.P.; software, R.A.G.; validation, K.A.M. and T.S.R.; investigation, K.A.M., T.S.R., and A.F.K.; resources, V.P.P., F.V.T., A.V.G., O.A.G., and B.A.B.; visualization, K.A.M., A.F.K., and I.D.S.; writing—original draft, K.A.M., A.Y.S., and I.D.S.; writing—review and editing, K.A.M., Y.D.I., and V.N.S.; project administration, Y.D.I.; supervision, A.I.A.; funding acquisition, A.I.A. All authors have read and agreed to the published version of the manuscript.

Funding

This study was performed in the framework of the Program for Basic Research of State Academies of Sciences for 2013–2020.

Acknowledgments

The biosensor measurements were performed employing a nanowire detector, which pertains to “Avogadro” large-scale research facilities.

Conflicts of Interest

The authors declare no conflict of interest.

References

  1. Ohgaki, H.; Kleihues, P. Genetic pathways to primary and secondary glioblastoma. Am. J. Pathol. 2007, 170, 1445–1453. [Google Scholar] [CrossRef] [PubMed] [Green Version]
  2. Moller, H.G.; Rasmussen, A.P.; Andersen, H.H.; Johnsen, K.B.; Henriksen, M.; Duroux, M. A systematic review of microRNA in glioblastoma multiforme: Micro-modulators in the mesenchymal mode of migration and invasion. Mol. Neurobiol. 2013, 47, 131–144. [Google Scholar] [CrossRef] [PubMed] [Green Version]
  3. Ohgaki, H.; Dessen, P.; Jourde, B.; Horstmann, S.; Nishikawa, T.; Di Patre, P.-L.; Burkhard, C.; Schüler, D.; Probst-Hensch, N.M.; César Maiorka, P.; et al. Genetic pathways to glioblastoma: A population-based study. Cancer Res. 2004, 64, 6892–6899. [Google Scholar] [CrossRef] [PubMed] [Green Version]
  4. Furnari, F.B.; Fenton, T.; Bachoo, R.M.; Mukasa, A.; Stommel, J.M.; Stegh, A.; Hahn, W.C.; Ligon, K.L.; Louis, D.N.; Brennan, C.; et al. Malignant astrocytic glioma: Genetics, biology, and paths to treatment. Genes Dev. 2007, 21, 2683–2710. [Google Scholar] [CrossRef] [Green Version]
  5. Hong, B.; Wiese, B.; Bremer, M.; Heissler, H.E.; Heidenreich, F.; Krauss, J.K.; Nakamura, M. Multiple microsurgical resections for repeated recurrence of glioblastoma multiforme. Am. J. Clin. Oncol. 2012, 36, 261–268. [Google Scholar] [CrossRef]
  6. Becker, K.P.; Yu, J. Status quo–standard-of-care medical and radiation therapy for glioblastoma. Cancer J. 2012, 18, 12–19. [Google Scholar] [CrossRef]
  7. Zhong, J.; Paul, A.; Kellie, S.J.; O’Neill, G.M. Mesenchymal migration as a therapeutic target in glioblastoma. J. Oncol. 2010, 2010, 430142. [Google Scholar] [CrossRef]
  8. Koo, S.; Martin, G.S.; Schulz, K.J.; Ronck, M.; Toussaint, L.G. Serial selection for invasiveness increases expression of miR-143/miR-145 in glioblastoma cell lines. BMC Cancer 2012, 12, 143. [Google Scholar] [CrossRef] [Green Version]
  9. Lou, W.; Ding, B.; Xu, L.; Fan, W. Construction of Potential Glioblastoma Multiforme-Related miRNA-mRNA Regulatory Network. Front. Mol. Neurosci. 2019, 12, 66. [Google Scholar] [CrossRef] [Green Version]
  10. Mohyeldin, A.; Chiocca, E.A. Gene and viral therapy for glioblastoma: A review of clinical trials and future directions. Cancer J. 2012, 18, 82–88. [Google Scholar] [CrossRef]
  11. Lee, S.-J.; Kim, S.-J.; Seo, H.-H.; Shin, S.-P.; Kim, D.; Park, C.-S.; Kim, K.-T.; Kim, Y.-H.; Jeong, J.-S.; Kim, I.-H. Over-expression of miR-145 enhances the effectiveness of HSVtk gene therapy for malignant glioma. Cancer Lett. 2012, 320, 72–80. [Google Scholar] [CrossRef] [PubMed]
  12. Yanaihara, N.; Caplen, N.; Bowman, E.; Seike, M.; Kumamoto, K.; Yi, M. Unique microRNA molecular profiles in lung cancer diagnosis and prognosis. Cancer Cell 2006, 9, 189–198. [Google Scholar] [CrossRef] [PubMed] [Green Version]
  13. Zhang, B.; Pan, X.; Cobb, G.P.; Anderson, T.A. microRNAs as oncogenes and tumour suppressors. Dev. Biol. 2007, 302, 1–12. [Google Scholar] [CrossRef] [PubMed] [Green Version]
  14. Lou, W.; Liu, J.; Gao, Y.; Zhong, G.; Ding, B.; Xu, L.; Fan, W. MicroRNA regulation of liver cancer stem cells. Am. J. Cancer Res. 2018, 8, 1126–1141. [Google Scholar] [PubMed]
  15. Yan, R.; Yang, T.; Zhai, H.; Zhou, Z.; Gao, L.; Li, Y. MicroRNA-150-5p affects cell proliferation, apoptosis, and EMT by regulation of the BRAF(V600E) mutation in papillary thyroid cancer cells. J. Cell Biochem. 2018, 119, 8763–8772. [Google Scholar] [CrossRef]
  16. Yang, Z.; Zhang, T.; Wang, Q.; Gao, H. Overexpression of microRNA-34a attenuates proliferation and induces apoptosis in pituitary adenoma cells via SOX7. Mol. Ther. Oncolytics 2018, 10, 40–47. [Google Scholar] [CrossRef] [Green Version]
  17. Li, P.; Xie, X.B.; Chen, Q.; Pang, G.L.; Luo, W.; Tu, J.C.; Zheng, F.; Liu, S.-M.; Han, L.; Zhang, J.-K.; et al. MiRNA-15a mediates cell cycle arrest and potentiates apoptosis in breast cancer cells by targeting synuclein-gamma. Asian Pac. J. Cancer Prev. 2014, 15, 6949–6954. [Google Scholar] [CrossRef] [Green Version]
  18. Xiao, R.; Li, C.; Chai, B. miRNA-144 suppresses proliferation and migration of colorectal cancer cells through GSPT1. Biomed. Pharmacother. 2015, 74, 138–144. [Google Scholar] [CrossRef]
  19. Dotto, G.P.; Karine, L. MiR-34a/SIRT6 in squamous differentiation and cancer. Cell Cycle 2014, 13, 1055–1056. [Google Scholar] [CrossRef] [Green Version]
  20. Chandra, V.; Kim, J.-J.; Mittal, B.; Rai, R. MicroRNA aberrations: An emerging field for gallbladder cancer management. World J. Gastroenterol. 2016, 22, 1787–1799. [Google Scholar] [CrossRef]
  21. Tutar, Y. MiRNA and cancer; computational and experimental approaches. Curr. Pharm. Biotechnol. 2014, 15, 429. [Google Scholar] [CrossRef] [PubMed]
  22. Chan, J.A.; Krichevsky, A.M.; Kosik, K.S. MicroRNA-21 is an antiapoptotic factor in human glioblastoma cells. Cancer Res. 2005, 65, 6029–6033. [Google Scholar] [CrossRef] [PubMed] [Green Version]
  23. Hui, X.; Zhang, S.; Wang, Y. MiR-454-3p suppresses cell migration and invasion by targeting CPEB1 in human glioblastoma. Mol. Med. Rep. 2018, 18, 3965–3972. [Google Scholar] [CrossRef] [PubMed]
  24. Mao, Y.; Wei, F.; Wei, C.; Wei, C. microRNA574 inhibits cell proliferation and invasion in glioblastoma multiforme by directly targeting zinc finger Eboxbinding homeobox 1. Mol. Med. Rep. 2018, 18, 1826–1834. [Google Scholar] [CrossRef] [Green Version]
  25. Zhang, G.; Chen, L.; Khan, A.A.; Li, B.; Gu, B.; Lin, F.; Su, X.; Yan, J. MiRNA-124-3p/neuropilin-1(NRP-1) axis plays an important role in mediating glioblastoma growth and angiogenesis. Inter. J. Cancer 2018, 143, 635–644. [Google Scholar] [CrossRef] [Green Version]
  26. Ye, J.; Zhang, W.; Liu, S.; Liu, Y.; Liu, K. MiR-363 inhibits the growth, migration and invasion of hepatocellular carcinoma cells by regulating E2F3. Oncol. Rep. 2017, 38, 3677–3684. [Google Scholar] [CrossRef] [Green Version]
  27. Conti, A.; Romeo, S.G.; Cama, A.; La Torre, D.; Barresi, V.; Pezzino, G.; Tomasello, C.; Cardali, S.; Angileri, F.F.; Polito, F.; et al. MiRNA expression profiling in human gliomas: Upregulated miR-363 increases cell survival and proliferation. Tumour Biol. 2016, 37, 14035–14048. [Google Scholar] [CrossRef]
  28. Ivanov, Y.D.; Pleshakova, T.O.; Kozlov, A.F.; Malsagova, K.A.; Krohin, N.V.; Shumyantseva, V.; Shumov, I.D.; Popov, V.; Naumova, O.V.; Fomin, B.; et al. SOI nanowire for the high-sensitive detection of HBsAg and α-fetoprotein. Lab. Chip 2012, 12, 5104–5111. [Google Scholar] [CrossRef]
  29. Malsagova, K.A.; Pleshakova, T.O.; Galiullin, R.A.; Kaysheva, A.L.; Shumov, I.D.; Ilnitskii, M.A.; Popov, V.P.; Glukhov, A.V.; Archakov, A.I.; Ivanov, Y.D. Ultrasensitive nanowire-based detection of HCVcoreAg in the serum using a microwave generator. Anal. Meth. 2018, 2740–2749. [Google Scholar] [CrossRef]
  30. Malsagova, K.A.; Pleshakova, T.O.; Galiullin, R.A.; Shumov, I.D.; Kozlov, A.F.; Romanova, T.S.; Popov, V.P.; Glukhov, A.V.; Konev, V.A.; Archakov, A.I.; et al. Nanowire Aptamer-Sensitized Biosensor Chips with Gas Plasma-Treated Surface for the Detection of Hepatitis C Virus Core Antigen. Coatings 2020, 10, 753. [Google Scholar] [CrossRef]
  31. Ivanov, Y.D.; Pleshakova, T.; Malsagova, K.; Kozlov, A.L.; Kaysheva, A.; Shumov, I.; Galiullin, R.; Kurbatov, L.; Popov, V.; Naumova, O.; et al. Detection of marker miRNAs in plasma using SOI-NW biosensor. Sens. Actuators B Chem. 2018, 261, 566–571. [Google Scholar] [CrossRef]
  32. Malsagova, K.A.; Ivanov, Y.D.; Pleshakova, T.O.; Kaysheva, A.L.; Shumov, I.D.; Kozlov, A.F.; Archakov, A.I.; Popov, V.P.; Fomin, B.I.; Latyshev, A.V. A SOI-nanowire biosensor for the multiple detection of D-NFATc1 protein in the serum. Anal. Methods 2015, 7, 8078–8085. [Google Scholar] [CrossRef]
  33. Malsagova, K.A.; Pleshakova, T.O.; Kozlov, A.F.; Shumov, I.D.; Ilnitskii, M.A.; Miakonkikh, A.V.; Popov, V.P.; Rudenko, K.V.; Glukhov, A.V.; Kupriyanov, I.N.; et al. Micro-Raman Spectroscopy for Monitoring of Deposition Quality of High-k Stack Protective Layer onto Nanowire FET Chips for Highly Sensitive miRNA Detection. Biosensors 2018, 8, 72. [Google Scholar] [CrossRef] [PubMed] [Green Version]
  34. Stern, E.; Wagner, R.; Sigworth, F.J.; Breaker, R.; Fahmy, T.M.; Reed, M.A. Importance of the Debye screening length on nanowire field effect transistor sensors. Nano Lett. 2007, 7, 3405–3409. [Google Scholar] [CrossRef] [PubMed] [Green Version]
  35. Laborde, C.; Pittino, F.; Verhoeven, H.A.; Lemay, S.G.; Selmi, L.; Jongsma, M.A.; Widdershoven, F.P. Real-time imaging of microparticles and living cells with CMOS nanocapacitor arrays. Nat. Nanotechnol. 2015, 10, 791–795. [Google Scholar] [CrossRef] [PubMed] [Green Version]
  36. Mattson, G.; Conklin, E.; Desai, S.; Nielander, G.; Savage, M.; Morgensen, S. A practical approach to crosslinking. Mol. Biol. Rep. 2004, 17, 167–183. [Google Scholar] [CrossRef]
Figure 1. The chemical structure of miRNA-363 obtained using the RNAfold web server (http://rna.tbi.univie.ac.at/).
Chemosensors 08 00095 g001
Figure 2. Schematic representation of the activation of the sensor chip surface with the DTSSP crosslinker, and the immobilization of the oDNA probes.
Chemosensors 08 00095 g002
Figure 3. Estimation of the efficiency of the sensor surface functionalization. Typical Ids(Vg) curves obtained for the nanowire sensor #1 (with n-type conductance) before and after each functionalization step: For the unmodified nanowire before its silanization (∆); for the silanized nanowire without immobilized oDNA probes (■); for the sensitized nanowire after the immobilization of oDNA probes onto its surface (●). The curves were recorded in the volt-ampere characteristics measurement mode in water. Abbreviations: ADC—analog-to-digital converter.
Chemosensors 08 00095 g003
Figure 4. The results obtained in the course of the detection of target oDNA in the buffer with the use of a sensor chip with n-type conductance, sensitized with covalently immobilized oDNA probes. Typical sensogram curves obtained upon the analysis of solutions with various oDNA concentrations. Experimental conditions: Target oDNA concentration 1.0 × 10⁻¹⁸ M (curve 1); 1.0 × 10⁻¹⁷ M (curve 2); 1.0 × 10⁻¹⁶ M (curve 3); 1.0 × 10⁻¹⁵ M (curve 4); 1 mM potassium phosphate buffer (pH 7.4); Vg = +50 V; Vds = 0.1 V. The total solution volume in the cell was 450 µL. Arrows indicate the addition of target oDNA solution and the wash with a pure potassium phosphate buffer.
Chemosensors 08 00095 g004
Figure 5. Typical sensogram curves obtained upon the detection of miRNAs, isolated from plasma samples of patients, with the SOI-NW-BS: The sample isolated from the plasma of a patient with diagnosed prostatic hyperplasia (control; no marker); the sample isolated from the plasma of a patient with diagnosed glioblastoma (no. 001; circles); the sample isolated from the plasma of a patient with diagnosed glioblastoma (no. 002; triangles). Experimental conditions: 1 mM potassium phosphate buffer; Vg = 50 V, Vds = 0.1 V. The total solution volume in the cell was 107 µL. The sensor surface was sensitized with immobilized oDNA probe. Arrows indicate the addition of miRNA solutions and the wash with the pure 1 mM potassium phosphate buffer.
Chemosensors 08 00095 g005
Table 1. Clinical and morphological characteristics of plasma samples.
Plasma Sample No.AgeSexPathologyWHO Classification
of CNS Tumours
00167maleanaplastic oligodendrogliomaGrade III
00242femaleanaplastic astrocytomaGrade III
1473maleprostatic hyperplasia-
WHO—World Health Organization; CNS—Central Nervous System.

