Article

A Naphthalimide–Sulfonylhydrazine Conjugate as a Fluorescent Chemodosimeter for Hypochlorite

Research Center for Solar Energy Chemistry, and Division of Chemical Engineering, Graduate School of Engineering Science, Osaka University, Toyonaka 560-8531, Japan
*
Author to whom correspondence should be addressed.
Chemosensors 2020, 8(4), 123; https://doi.org/10.3390/chemosensors8040123
Submission received: 15 October 2020 / Revised: 27 November 2020 / Accepted: 28 November 2020 / Published: 1 December 2020
(This article belongs to the Special Issue Organic Fluorescent Materials as Chemical Sensors)

Abstract

:
Hypochlorite anion (ClO) is a widely-used disinfectant and a microbicidal agent in the immune system. Accurate detection of ClO in environmental and biological samples by simply prepared chemosensors/chemodosimeters is important. Herein, we report that a naphthalimide–sulfonylhydrazine conjugate with an imine (C=N) linker, prepared via simple condensation, acts as an effective fluorescent chemodosimeter for ClO. The molecule exhibits a weak emission, but ClO-selective cleavage of its C=N bond creates a strong green emission. Ab initio calculation showed that the emission enhancement by ClO originates from the suppression of intramolecular electron transfer from the photoexcited naphthalimide through the C=N linker. This response enables selective and sensitive detection of ClO at physiological pH range (7–9) and allows fluorometric ClO imaging in the presence of cells.

Graphical Abstract

1. Introduction

Hypochlorous acid (HClO) is one important reactive oxygen species (ROS). HClO is formed in vivo by the enzymatic reaction of hydrogen peroxide (H2O2) with chloride anion (Cl) in some specialized cells such as neutrophils [1]. Deprotonation of HClO at a physiological pH range produces hypochlorite anion (ClO) [2], which acts as an microbicidal agent in immune system [3]. The formed ClO inhibits the invading microbes, but uncontrolled amounts of ClO may result in several diseases such as arthritis [4], atherosclerosis [5], cancer [6], and Parkinson’s disease [7] because ClO reacts with several biomolecules [8]. Considerable amounts of HClO are used industrially or at home for sterilization, although high residual amounts of ClO is hazardous [9]. A simple but inexpensive method to quantitatively detect small amount of ClO is necessary.
One promising method for this purpose is fluorometric analysis using ClO-selective molecular chemosensors/chemodosimeters because they facilitate simple quantification or imaging of ClO with a common fluorescence spectrometer or microscope apparatus [10]. So far, various molecules based on several types of fluorescent dyes such as rhodamine, fluorescein, coumarin, diaminonaphthalene, and BODIPY have been proposed [11,12]. Several excellent molecules have successfully been applied to fluorescence imaging of ClO in biological samples and quantification of very small amounts of ClO in environmental samples. Challenges in the design and development of a new fluorescent chemosensors/chemodosimeters with higher reactivity toward ClO are still ongoing. Among the fluorescent dyes, naphthalimide is one of the popular dyes often used in the synthesis of chemosensors/chemodosimeters because of its high chemical stability, high photostability, a large Stokes shift, and a strong fluorescence quantum yield [13]. There is, however, a few naphthalimide-based molecules for fluorometric detection of ClO [14,15,16]. Therefore, creating a new naphthalimide-based chemosensor/chemodosimeter is an important issue.
Recently, an imine (C=N) moiety has been used as a linker to connect a fluorescent dye unit with an electron accepting unit in the design of chemosensors/chemodosimeters for ClO detection [17,18,19]. This is because the C=N linker (i) facilitates an intramolecular electron transfer between the two units; (ii) behaves as a reaction site for ClO and affects the electron transfer efficiency; and, (iii) can be created by a facile condensation of two reactive groups such as aldehydes and amines. The simple system using a C=N linker may become a versatile design of chemodosimeters for fluorometric detection of ClO.
In the present work, we synthesized a simple naphthalimide–sulfonylhydrazine conjugate (1) through the C=N linker (Scheme 1) and studied the effects of the sulfonylhydrazine moiety on the reactivity of the C=N reaction site towards ClO and the change in the emission/optical properties. This molecule, when dissolved in an aqueous solution, shows a weak fluorescence. Addition of ClO to the solution selectively enhances fluorescence emission via an oxidative cleavage of the C=N moiety. This off-on fluorometric response facilitate rapid, selective, and sensitive detection of ClO in neutral media with pH 7–9 and also allows ClO imaging in the presence of cells.

2. Materials and Methods

2.1. General

All chemicals were used without further purification. Hydroxyl radical (∙OH), peroxynitrile (ONOO), and superoxide radical (∙O2) were generated according to the procedure described [20,21]. Fluorescence spectra were measured on a JASCO FP-6500 fluorescence spectrophotometer (JASCO Corp., Tokyo, Japan) at 298 ± 1 K [22]. Absorption spectra were measured on an UV-visible spectrometer (Shimadzu Corp., Kyoto, Japan; UV-3600 plus) at 298 ± 1 K [23]. 1H and 13C NMR spectra were obtained on a JEOL JNM-ECS400 Spectrometer (JEOL Ltd., Tokyo, Japan). FAB-MS analysis was performed on a JEOL JMS 700 Mass (JEOL Ltd., Tokyo, Japan). ΦF was determined with rhodamine B (in ethanol) as a standard [24], using the refractive indexes for water and ethanol being 1.3334 and 1.3618, respectively [25]. Ab initio calculations were performed within the Gaussian 03 package using the B3LYP/6-3G+(d) basis set for all atoms. Cartesian coordinates of the models are summarized at the end of Supplementary Material.

2.2. Synthesis

4-Hydroxy-N-butyl-1,8-naphthalimide was synthesized according to literature procedure [26]. 3-Formyl-4-hydroxy-N-butyl-1,8-naphthalimide was synthesized according to literature procedure [27] using 4-hydroxy-N-butyl-1,8-naphthalimide. Its purity was confirmed by the 1H, 13C NMR, and FAB(+)-MS charts (Figures S1–S3, Supplementary Material).
The compound 1 was synthesized as follows: 3-formyl-4-hydroxy-N-butyl-1,8-naphthalimide (296 mg, 1.0 mmol) and commercially available p-toluenesulfonyl hydrazide (273 mg, 1.5 mmol) were dissolved in ethanol (20 mL) and refluxed at 80 °C for 21 h. The formed precipitate was recovered by suction filtration with washing using ethanol, affording 1 as a yellow solid. Yield: 402.5 mg (0.865 mmol) (87%). 1H NMR (400 MHz, DMSO-d6, TMS), δ (ppm): 0.87 (t, 3H, J = 10.8 Hz), 1.24–1.33 (m, 2H), 1.50–1.57 (m, 2H), 2.32 (s, 3H), 3.95 (t, 2H, J = 14.8 Hz), 7.42 (d, 2H, J = 8.0 Hz), 7.75 (t, 1H, J = 12.0 Hz), 7.78 (d, 2H, J = 5.2 Hz), 8.41 (d, 1H, J = 6.0 Hz), 8.42 (s, 1H), 8.46 (s, 1H), 8.54 (d, 1H, J = 8.8 Hz), 12.21 (s, 1H). 13C NMR (400 MHz, DMSO-d6, TMS), δ (ppm): 14.22, 20.30, 21.54, 30.20, 114.24, 114.52, 122.60, 123.17, 127.18, 127.64, 129.40, 129.63, 130.53, 132.47, 132.63, 136.09, 144.57, 148.43, 159.72, 163.18, and 163.86. FAB-MS (m/z) calcd for C24H23N3O5S [M + H]+: 466.1358, found (FAB) 466.1443.

2.3. Biological Experiments

Cell culture and fluorescence microscopy observations were carried out as follows. HeLa cells were grown in the Dulbecco’s modified Eagle’s medium (DMEM) supplemented with 10% fetal bovine serum on a cover slip in 100 mm dishes. All of the cells were incubated at 37 °C in humidified air containing 5% CO2. The cells were treated with a phosphate buffered saline (PBS)/MeCN (8/2 v/v) mixture containing 1 (50 μM) followed by different concentrations of ClO for 30 min, respectively. The cells were washed with PBS and subjected for observation on a fluorescence microscopy (BIOREVE BZ-9000, Keyence Corp., Osaka, Japan) [28]. Cell viability tests were performed as follows [29]: Trypsinized HeLa cells were incubated with PBS/MeCN (8/2 v/v) mixture containing 1 (50 μM) for 20 min at 37 °C in humidified air containing 5% CO2. After washing with PBS for three times, a Trypan blue solution was added to the cells. The respective live and dead cells were counted using the Countess II FL Automated Cell Counter.

3. Results and Discussion

3.1. Chemodosimeter Synthesis

The chemodosimeter 1 was successfully synthesized via a condensation of 3-formyl-4-hydroxy-N-butyl-1,8-naphthalimide [27] with p-toluenesulfonyl hydrazide (Scheme 1). An ethanol solution containing these reagents was refluxed at 80 °C for 21 h. Suction filtration of the resultant with simple washing using EtOH afforded yellow powders of 1 with high yield (87%). The purity of 1 was confirmed by 1H NMR, 13C NMR, 1H–1H COSY, and FAB(+)-MS analysis (Figures S4–S7, Supplementary Material). The high yield of 1 by simple reflux and washing with EtOH is a noticeable advantage of this chemodosimeter.

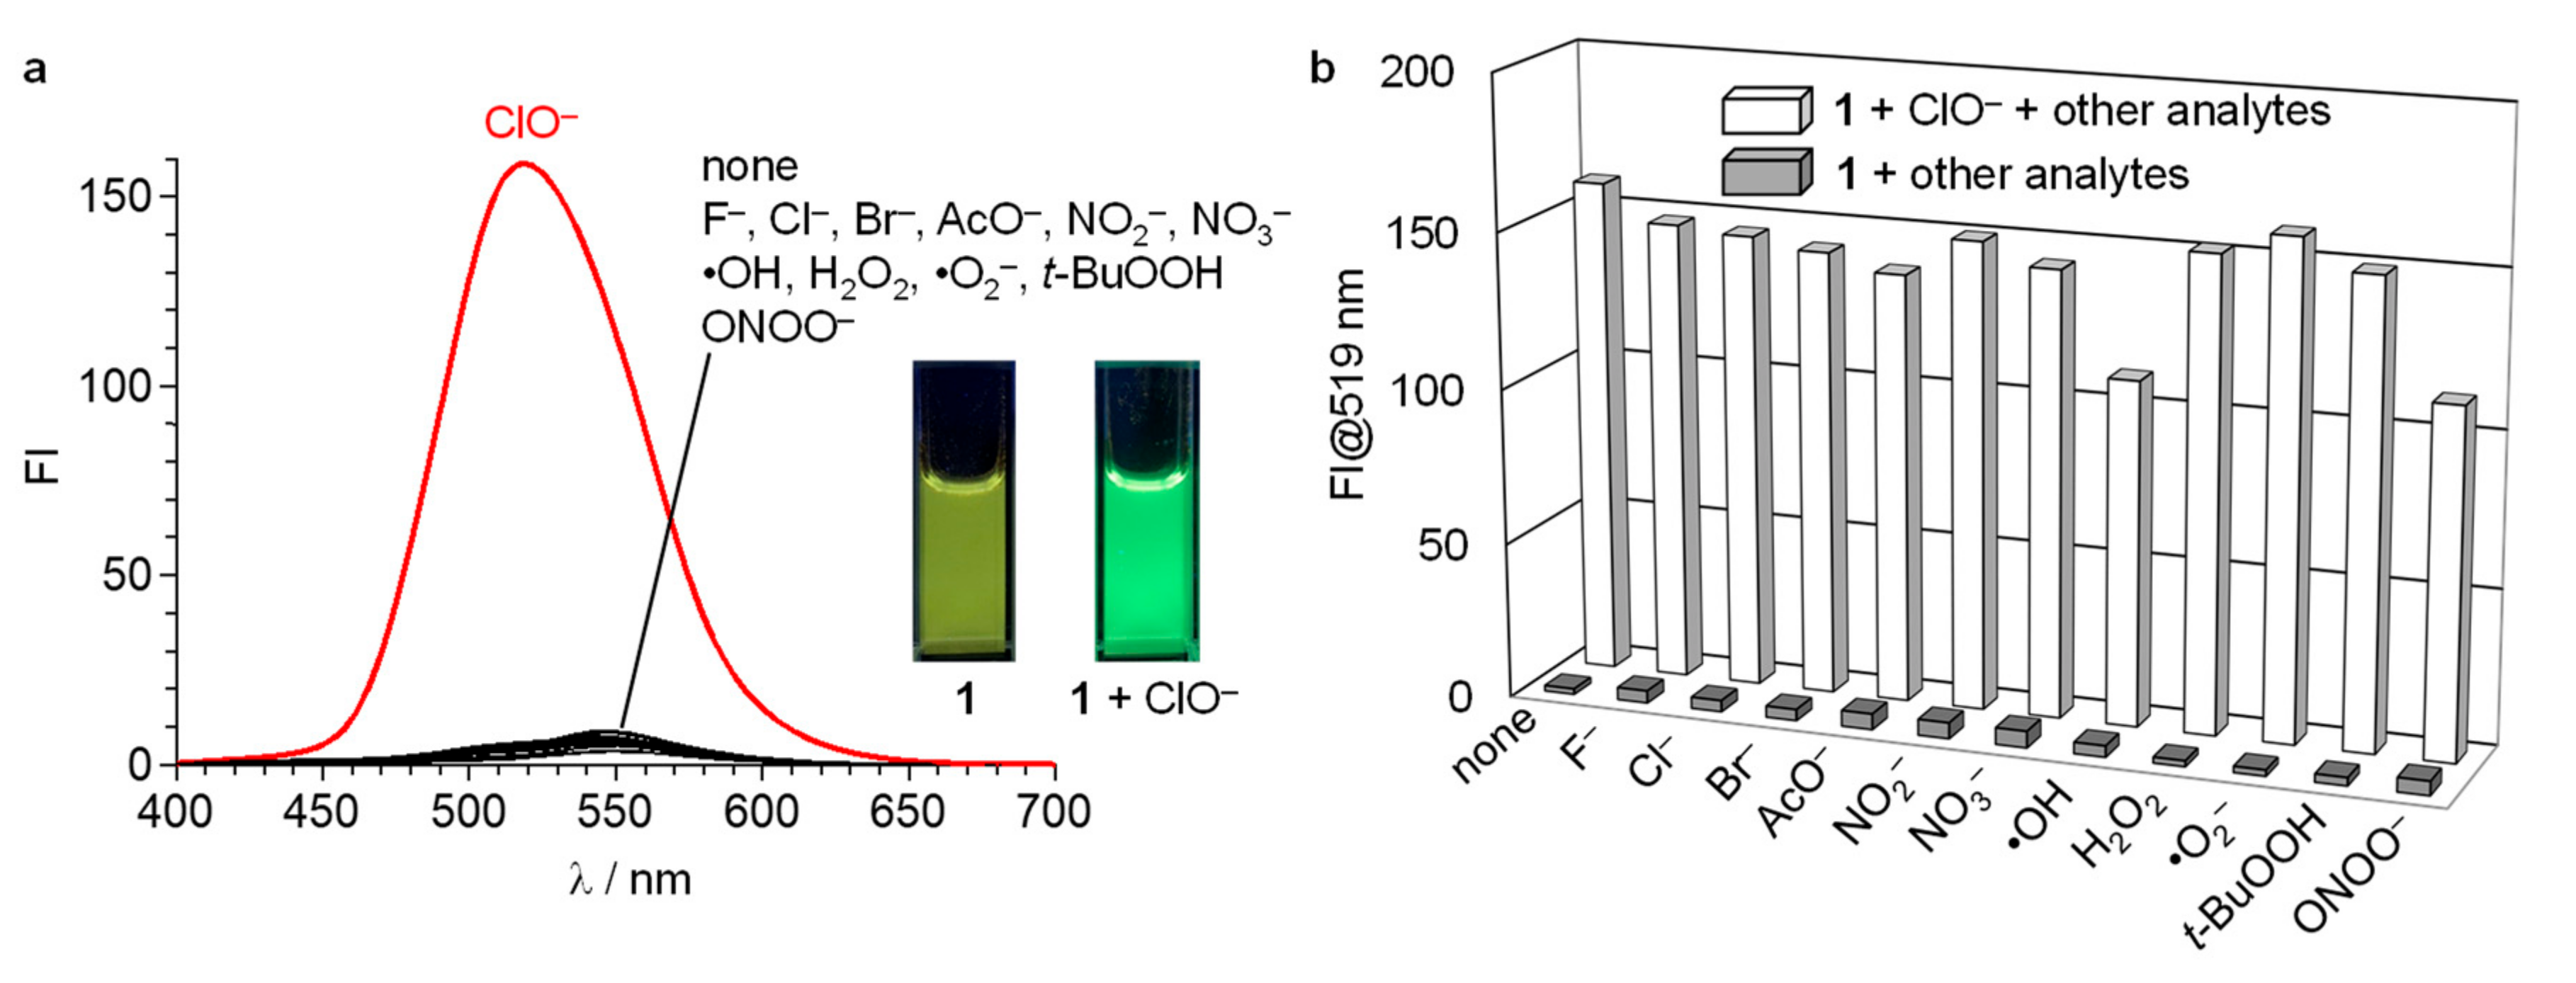
3.2. Fluorescence Properties

Fluorescence spectra were obtained in a buffered water/MeCN mixture (8/2 v/v) with pH 7.0 (HEPES 0.1 M) at 25 °C (λex = 365 nm). As shown in Figure 1a, 1 exhibits only a weak emission (fluorescence quantum yield, ΦF = 0.01). Addition of 50 equiv of ClO to the solution creates a strong green fluorescence centred at 519 nm (ΦF = 0.15). However, addition of other anions (F, Cl, Br, AcO, NO2, NO3), other ROS [∙OH, H2O2, ∙O2, and tert-butyl hydroperoxide (t-BuOOH)], or reactive nitrogen species (RNS) [ONOO] barely change the spectrum of 1, indicating that ClO selectively triggers fluorescence enhancement of 1. It must be noted that, as shown in Figure 1b, the 519 nm fluorescence enhanced by ClO is unaffected by the other contaminants, suggesting that 1 selectively detects ClO even in the presence of these contaminants.
As shown in Figure 2a, the fluorescence titration of 1 with ClO increases the intensity of the 519 nm fluorescence. A linear relationship between the fluorescence intensity and ClO amount (Figure 2b) indicates accurate ClO sensing at ~100 μM. The lower detection limit (DL) was determined based on the signal-to-noise ratio using the equation (DL = 3 × SD/S) [30], where SD is the standard deviation of blank measurement (SD = 0.061, n = 11) and S is the slope of the fluorescence intensity versus the ClO concentration (S = 0.096 μM–1). This DL determined (1.9 μM) is below the physiological ClO concentrations (5–25 μM) in neutrophils [31], suggesting that 1 also facilitates sensitive ClO detection. The chemodosimeter 1, when left in a solution for 1 day, shows absorption and fluorescence spectra similar to those of the fresh molecule. In addition, the solution, when treated with ClO, shows spectral responses similar to those of the fresh sample. This means that 1 is storable in solution and can stably be used for ClO sensing.

3.3. Emitting Species

To identify the green emitting species formed by the reaction of 1 with ClO, we tried to isolate the species from the resulting solution. Concentration of the solution by evaporation followed by a thin-layer chromatography (TLC) analysis (n-hexane/EtOAc = 1/1 v/v) of the resultant (Figure S8, Supplementary Material) shows a single emitting spot (Rf = 0.70), where the Rf of 1 is 0.25. This suggests that the reaction of 1 with ClO produces a single emitting species. 1H NMR analysis (DMSO-d6) of the fraction eluted using a silica gel column containing the green emitting species showed several impurity protons, where strong protons appear at ~2.4 ppm, ~7.2 ppm, and ~7.6 ppm, respectively, with the integration ratio being 3:2:2, which are assigned to the aromatic protons of the p-toluenesulfonic acid moiety. This indicates that the sulfonylhydrazine moiety of 1 is decomposed during the reaction with ClO, and the formed fragments elute with the green emitting species owing to their similar high polarities. As a result of this, the isolation and 1H NMR analysis of the emitting species were unsuccessful.
The crude product was then analyzed by FAB-MS. As shown in Figure S7 (Supplementary Material), 1 exhibits a clear molecular ion at m/z 466.2 (FAB(+) mode), assigned to the [1 + H+]+ species. In contrast, as shown in Figure S9 (Supplementary Material), the crude product does not show a clear molecular ion, but a very strong ion appears at m/z 296.2 (FAB(+)). ClO oxidizes the C=N moieties and produces C=N cleaved aldehydes or carboxylic acids by hydrolysis [17,18,19]. Therefore, as proposed in Scheme 2 (right top), the m/z 296.2 ion (FAB(+)) may be assigned to the species containing an oxetane moiety ([2 − H2O + H+]+), which may be produced by intramolecular dehydration of the compound 2 during the FAB ionization. In addition, as shown in Figure S10 (Supplementary Material), the chart in the FAB(–) mode shows a strong molecular ion at m/z 312.08, which is assigned to the [2 − H+] species formed by deprotonation of 2 during the FAB ionization (Scheme 2, right bottom). This clearly suggests that the C=N cleaved carboxylic acid (2) is the green emitting species. It is reported that some C=N-based chemodosimeters produce aldehyde as the product by the reaction with ClO [17,19]. However, as shown in Figure S3 (Supplementary Material), 3-formyl-4-hydroxy-N-butyl-1,8-naphthalimide (3) [27], the starting material for the synthesis of 1 (Scheme 1, left), shows a molecular ion at m/z 298.2 ([3 + H+]+) in the FAB(+) mode. MS analysis of a solution containing 3, when treated with ClO under the conditions similar to the present sensing, shows a FAB(+) chart similar to that of 3, suggesting that 3 is not oxidized to the carboxylic acid (2) by the reaction with ClO under the present condition. This indicates that, as shown in Scheme 2, the emitting species (2) is formed directly by the C=N cleavage of 1, where the aldehyde (3) is not involved as an intermediate.

3.4. Reaction Mechanism

The proposed sequence (Scheme 2) is confirmed by the fluorescence and absorption spectra of 1 upon reaction with ClO. As shown in Figure 3a, addition of ClO increases the 519 nm fluorescence. As shown in the inset, the intensity increases with time and becomes plateaus after 600 s (10 min). During the measurement, the emission wavelengths barely change, suggesting the formation of a single emitting species (2), which is supported by the single emitting spot observed in TLC analysis (Figure S8, Supplementary Material). As shown in Figure 3b, the ClO addition immediately changes the absorption spectrum of 1 within 1 min (blue → red) with an isosbestic point at 311 nm. The spectrum further changes with a decrease in the absorbance at 327 nm with an isosbestic point at 454 nm, finally exhibiting a peak at 429 nm. As shown by the inset, the time profile for the decrease in the 327 nm absorbance is consistent with the profile for the fluorescence intensity increase (inset of Figure 3a). These findings indicate that, as shown in Scheme 2, the reaction of 1 with ClO produces some C=N cleaved intermediates, and further oxidation by ClO with hydrolysis produces the green emitting species (2).
The hydrolysis is indeed involved in the reaction mechanism (Scheme 2). Figure 4 shows the change in fluorescence intensity of 1 after addition of ClO in the MeCN solutions with different water amounts. Without water, 1 shows only a small fluorescence enhancement by ClO. Increasing the water amount in the solution increases the enhancement by ClO. This indicates that, as shown in Scheme 2, hydrolysis of the intermediates produces the carboxylic acid emitting species (2). It must also be noted that the fluorescence enhancement by ClO is reduced in solution with >90% water. This is probably because the decreased solubility of 1 suppresses the reaction with ClO, suggesting that sufficient dissolution of 1 in solution is necessary for the fluorometric ClO detection.
It must be noted that 1H NMR analysis of the product indicates that the reaction of 1 with ClO produces p-toluenesulfonic acid as a byproduct. This means that 1, when used for biological experiments, leaves p-toluenesulfonic acid in the body or cell systems. It has been clarified that sulfonic acid compounds have a low systemic toxicity and are neither mutagenic nor carcinogenic regardless of the structure and the route or duration of the application [32]. In addition, some sulfonic acid-containing molecules have successfully been used for cell imaging [33,34]. These findings indicate that the p-toluenesulfonic acid byproduct may not have a negative effect on the biological applications.

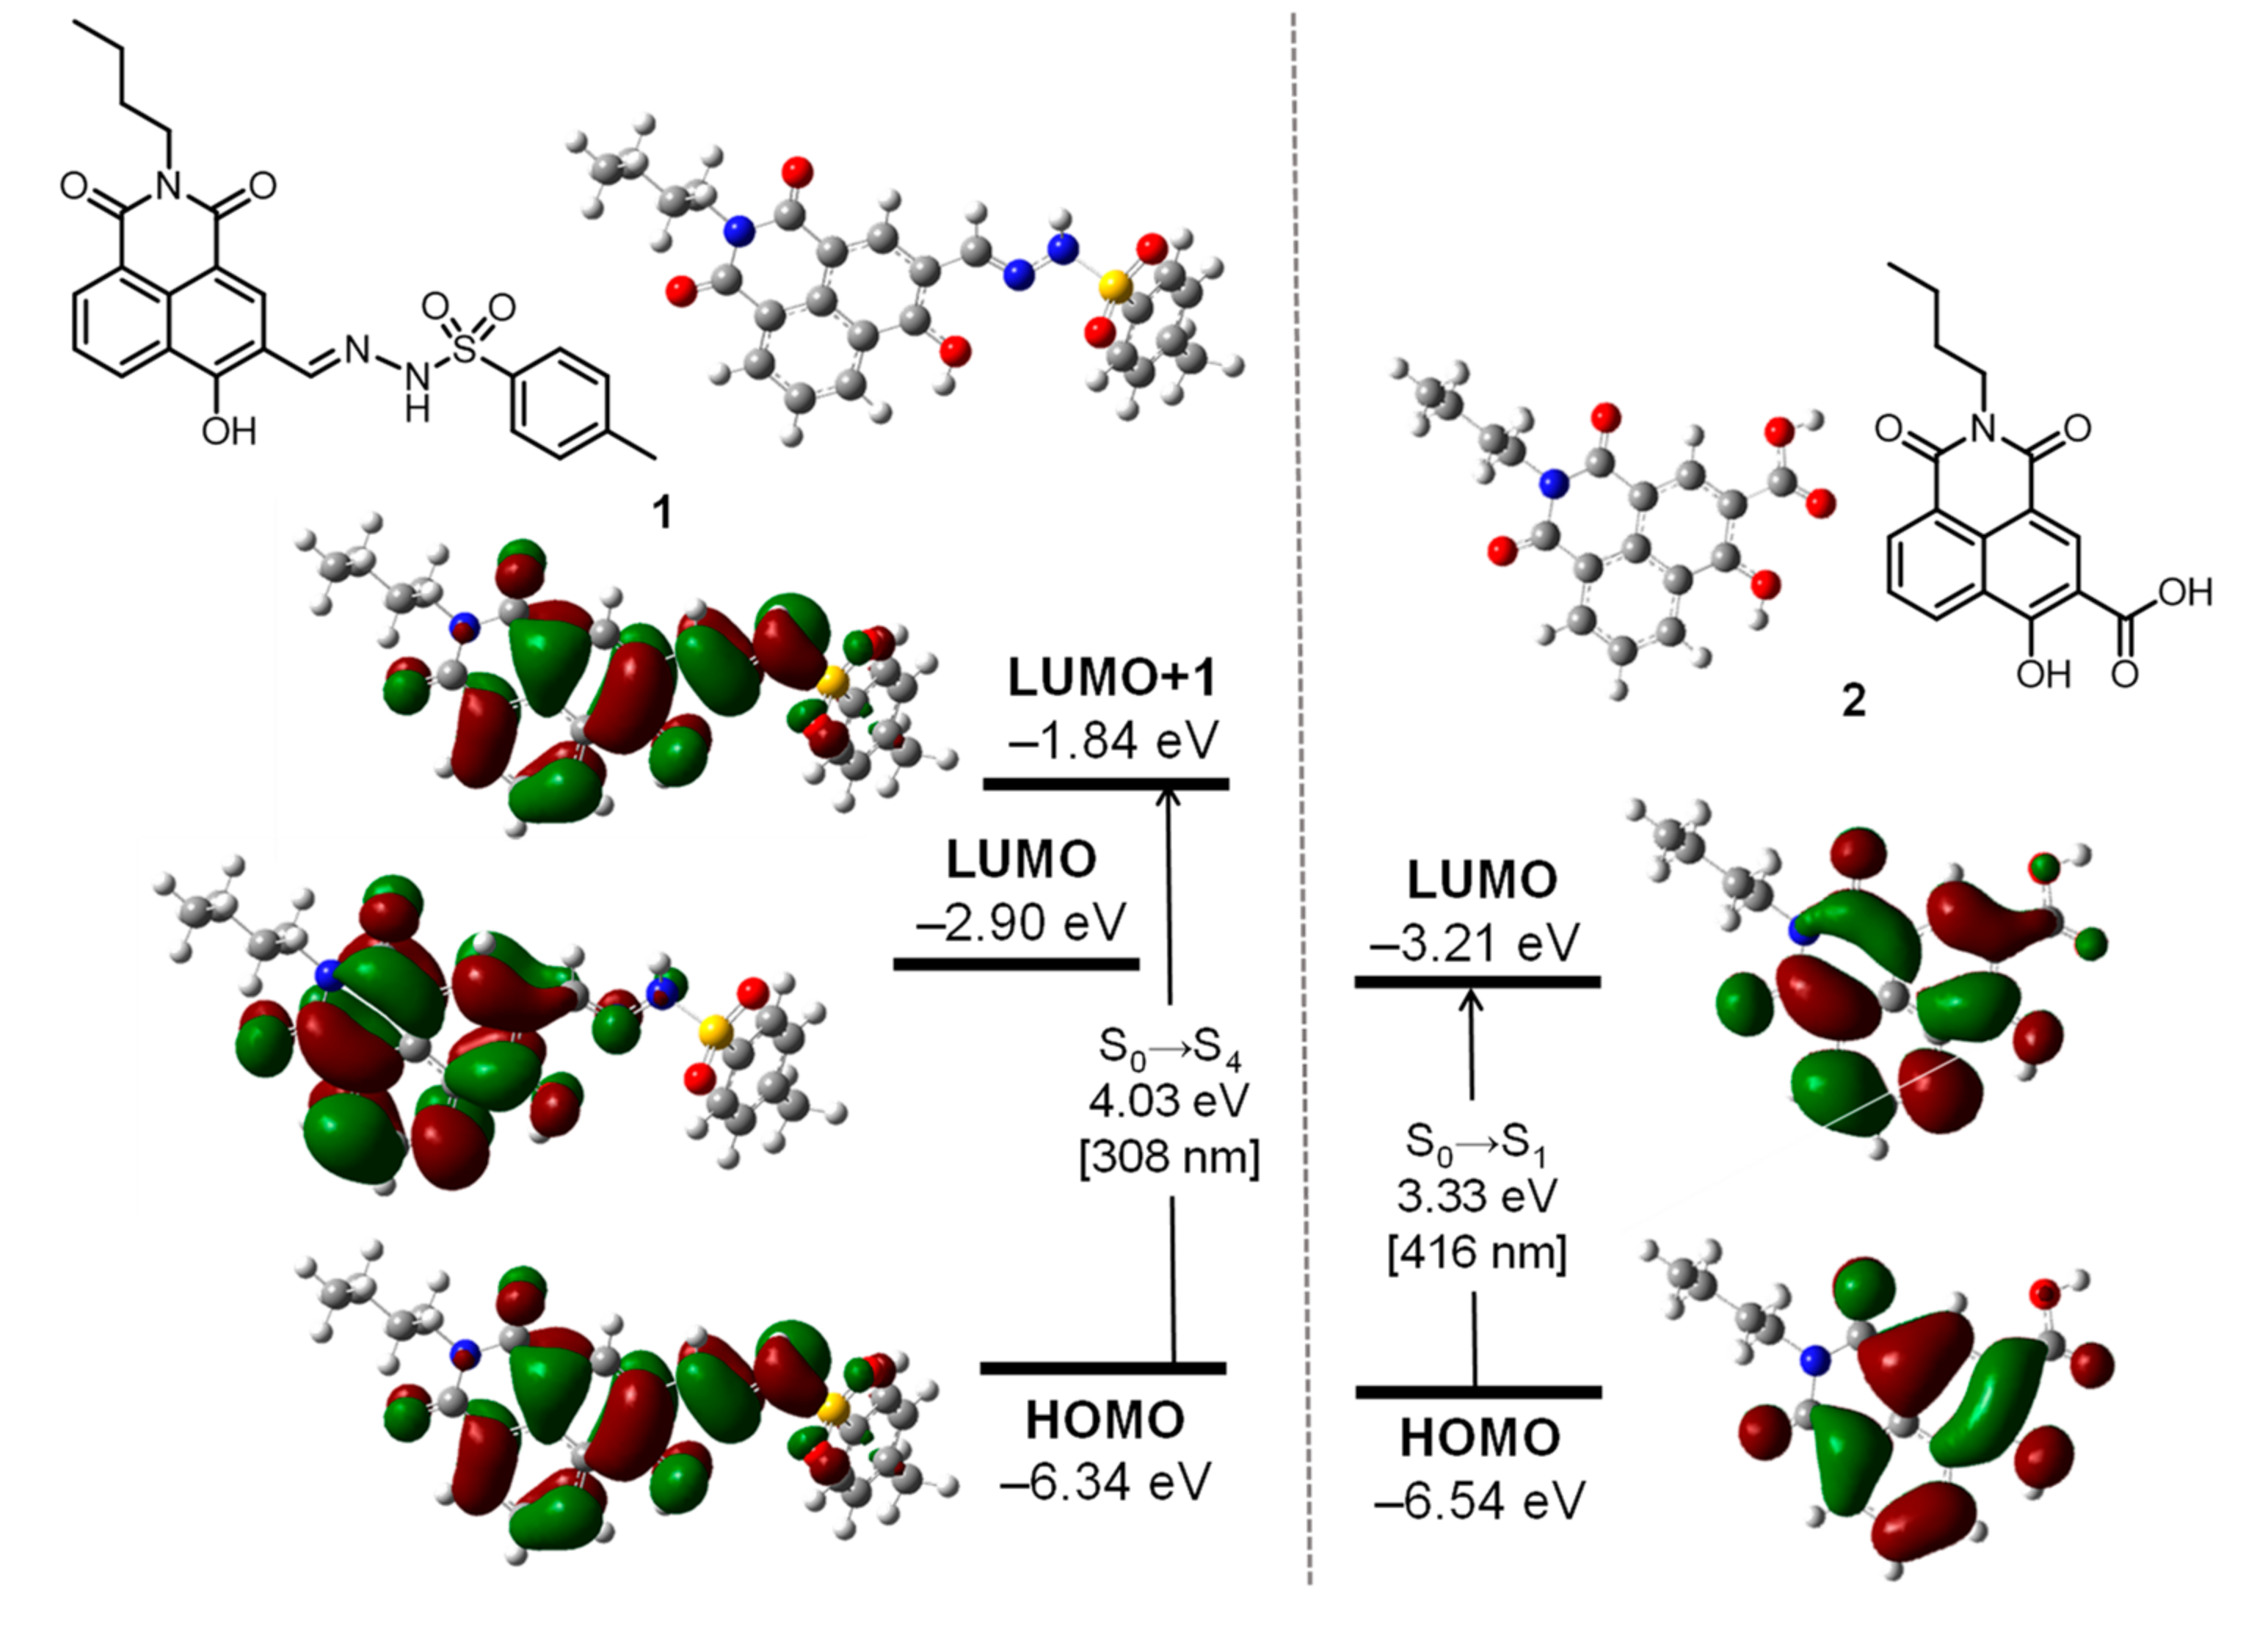
3.5. Ab Initio Calculations
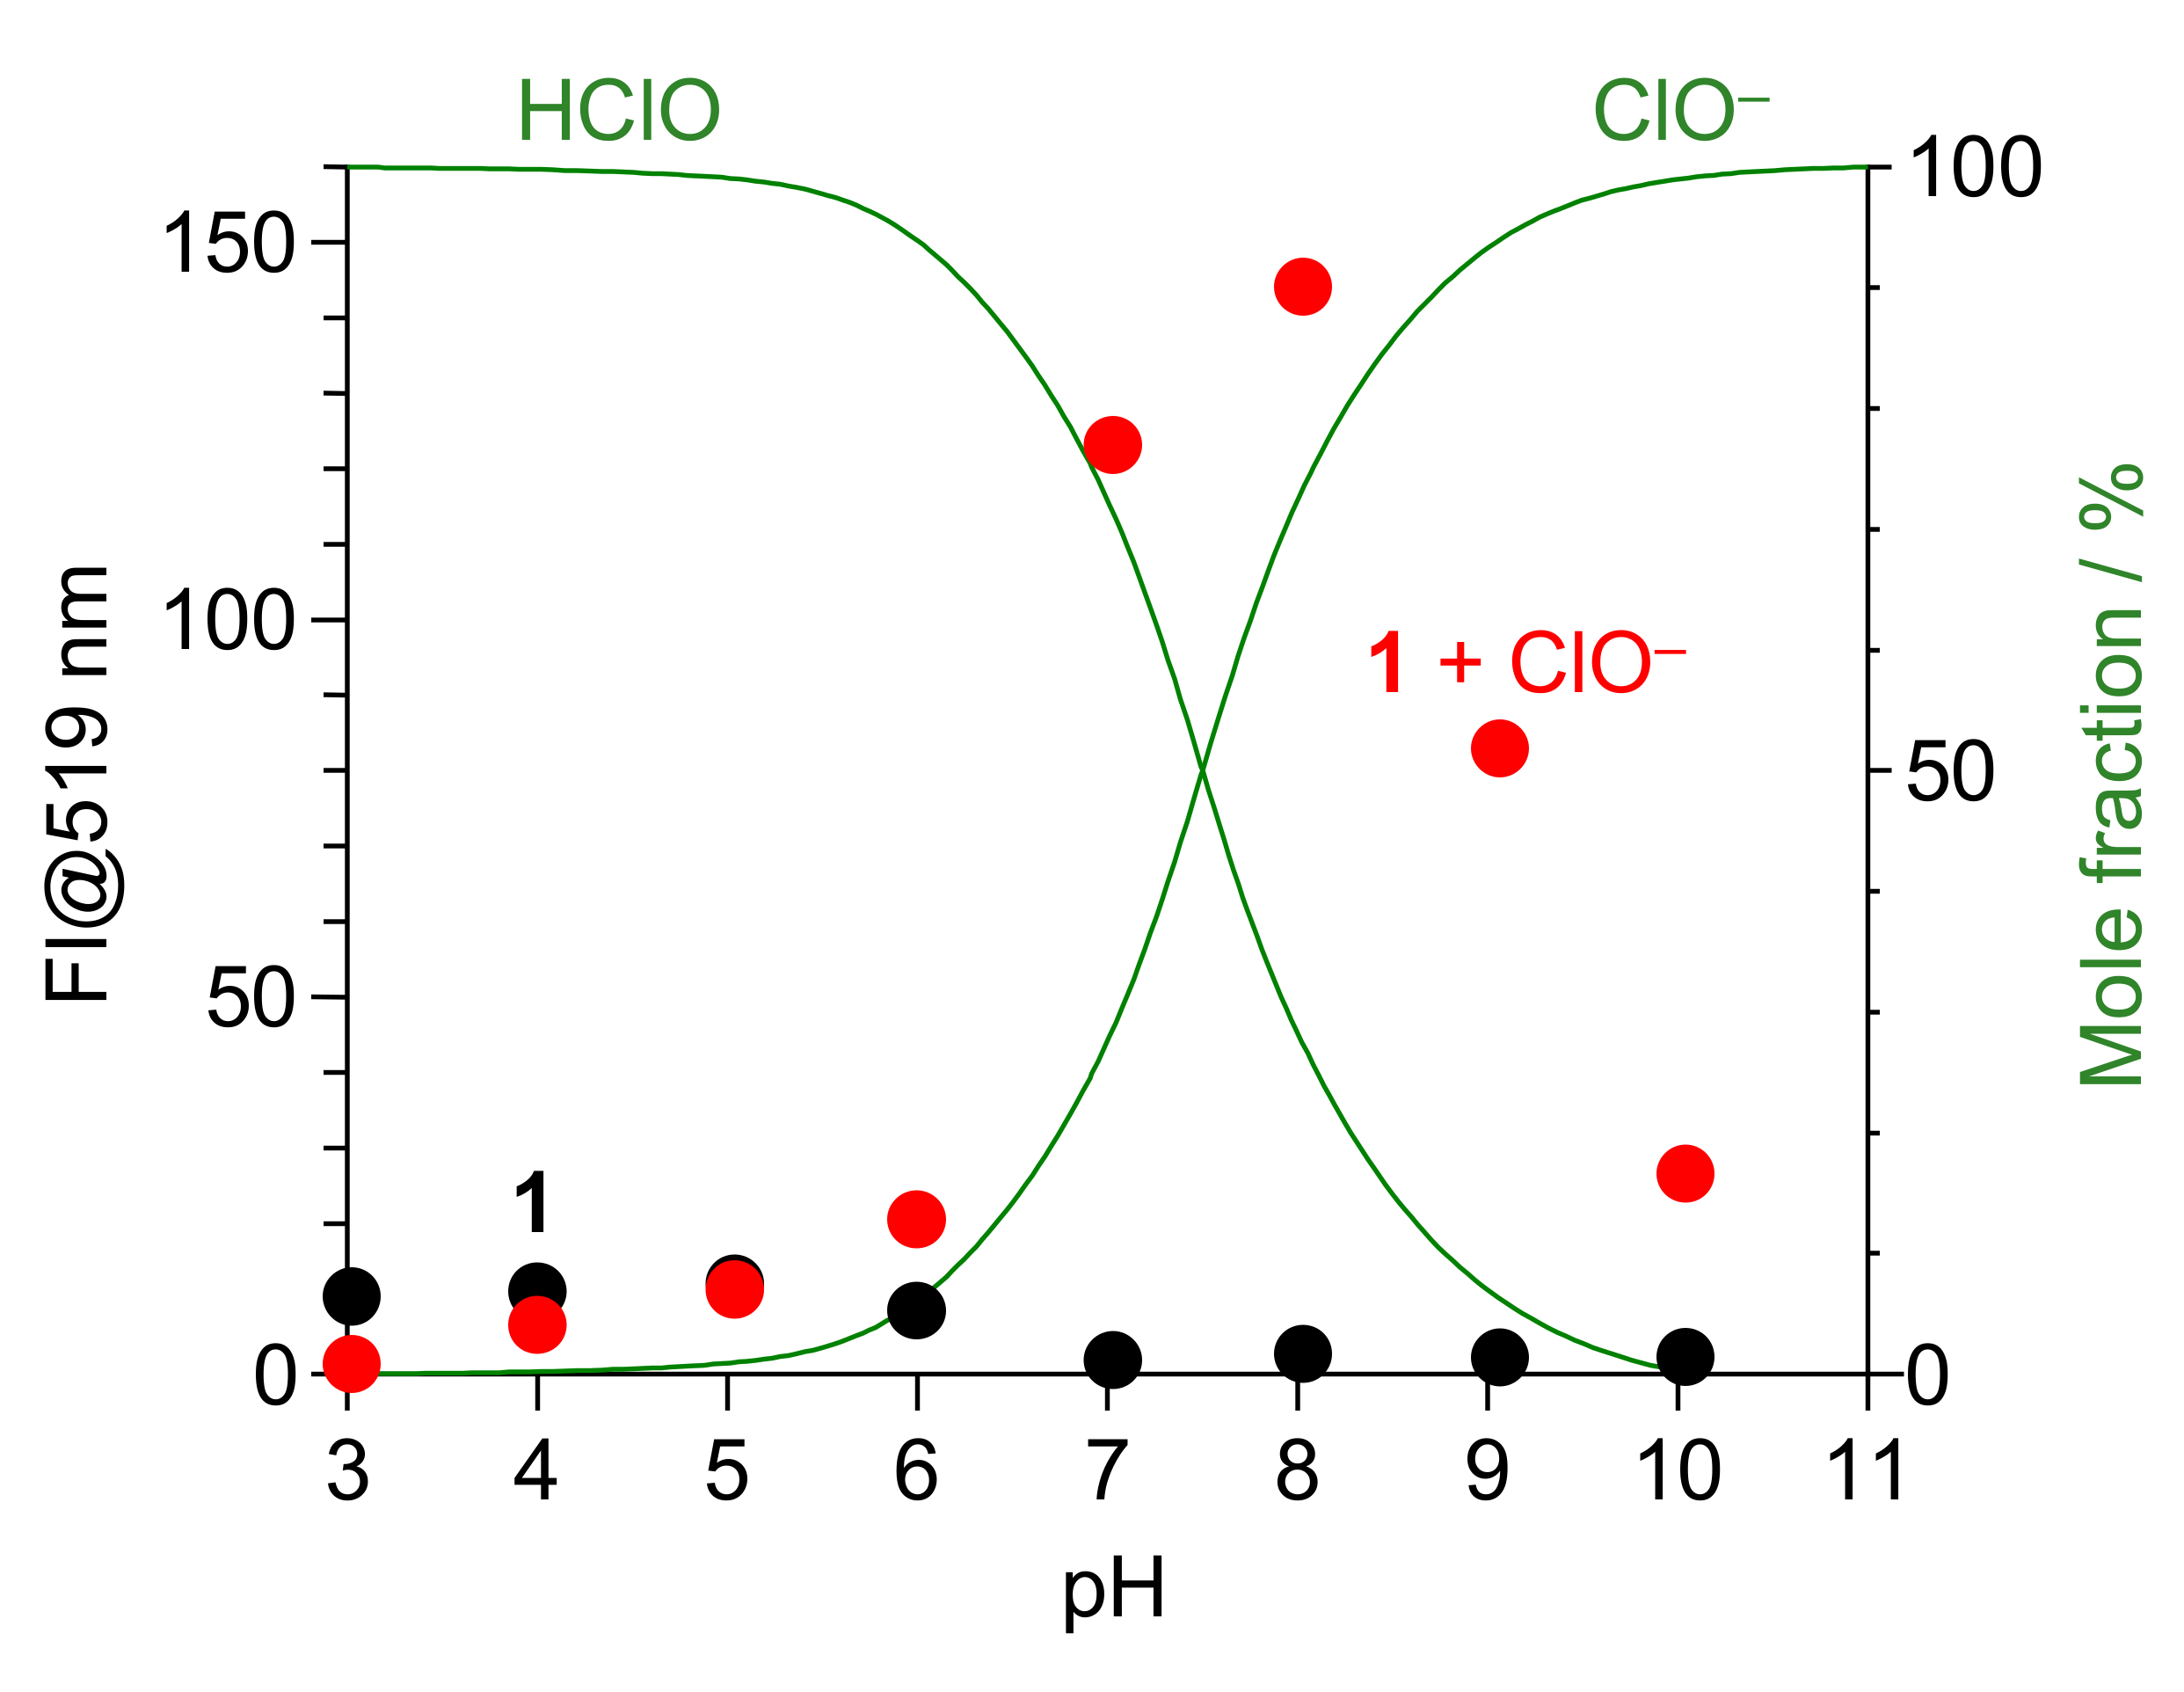
To further confirm 2 as the green emitting species, structures and optical properties of 1 and 2 were calculated by the density functional theory (DFT) and the time-dependent DFT (TD-DFT), respectively [35]. As shown in Table S1 (Supplementary Material), singlet electronic transition of 1 mainly consists of HOMO → LUMO+1 (S0 → S4) transition. Its calculated transition energy (4.03 eV, 308 nm) is close to the absorption maximum (λmax) of 1 at 327 nm (Figure 3b). As shown in Figure 5 (left), π-electrons of the main orbitals of 1 such as HOMO, LUMO, and LUMO+1 are located on the naphthalimide moiety and the C=N moiety. This indicates that photoexcited electrons on the naphthalimide moiety are transferred to the p-toluenesulfonyl moiety via the C=N linker. This may result in almost no fluorescence of 1.
As shown in Table S1 (Supplementary Material), the electronic excitation of 2 consists of HOMO → LUMO (S0 → S1) transition. Its energy (2.98 eV, 416 nm) is consistent with the absorption band of 1 at 429 nm after addition of ClO (Figure 3b). As shown in Figure 5 (right), π-electrons of both HOMO and LUMO are located on the naphthalimide moiety, indicating that the C=N cleavage of 1 suppresses electron transfer from the photoexcited naphthalimide moiety. This may facilitate strong fluorescence from the carboxylic acid (2). These data support the proposed reaction mechanism of 1 with ClO (Scheme 2).

3.6. Effect of pH

The chemodosimeter 1 facilitates ClO sensing at neutral pH (7–9). Figure 6 shows the fluorescence intensity of 1 at different pH, with and without ClO. Also shown are the mole fractions of HClO and ClO, calculated based on their equilibrium in water [36]:
HClO   ClO   +   H +   ( p K a   =   7.6 ) .
ClO enhances the intensity of 1 at a neutral pH (7–9). At pH < 7, protonation of ClO (HClO formation) cancels the basicity of ClO and inhibits the reaction with the C=N moiety of 1. At pH > 9, ClO is stabilized in solution, but the fluorescence enhancement decreases significantly. This is because, as reported for some ClO chemodosimeters [37,38,39], the oxidation ability of ClO decreases in basic media and inhibits the reaction. Therefore, 1 facilitates fluorometric sensing of ClO in physiological pH range (7–9).

3.7. Cell Imaging

Biological experiments were performed with HeLa cells to clarify the cell permeability of 1 and applicability to the fluorescence imaging of ClO in cells. HeLa cells were treated with a PBS/MeCN mixture (8/2 v/v, pH 7.4) containing 1 (50 μM) for 30 min. A PBS solution containing different concentrations of ClO (0–250 μM) was added to the cells and left for 30 min. The cells were then washed with PBS, and monitored by a fluorescence microscopy (λex = 470 nm; λem = 535 nm). As shown in Figure 7b, the cells treated with 1 alone show almost no fluorescence. However, as shown in Figure 7d,f,h, the cells treated with ClO show bright green fluorescence, and the brightness clearly increases with an increase in the ClO concentrations, although the ClO concentrations required for bright emission are much higher than the physiologically relevant ClO concentrations (5–25 μM) [35].
To clarify the toxicity of the cell treatment, viability of the HeLa cells before and after treatment with a PBS/MeCN (8/2/v/v) solution containing 1 was determined. A Trypan blue solution was added to the cells, and the respective live and dead cells were counted. The cell viability after the treatment was only ca. 11%, although the cell viability before the treatment was ca. 96%. This means that the cell treatment with the PBS/MeCN solution containing 1 leads to a loss of the functionality for almost all of the cells. In the present case, the use of MeCN with high cytotoxicity is necessary for permeation of the chemodosimeter into the cells due to its low solubility in water. Living cell imaging is therefore not facilitated by the present chemodosimeter.

4. Conclusions

We demonstrated that a simple naphthalimide–sulfonylhydrazine dye (1) acts as a fluorescent chemodosimeter for ClO. 1 shows almost no fluorescence, but ClO-selective oxidative cleavage of its C=N bond creates a strong green fluorescence owing to the suppression of intramolecular electron transfer from the photoexcited naphthalimide moiety through the C=N bond. 1 facilitates relatively rapid (<10 min), selective, and sensitive ClO detection (detection limit: 1.9 μM) at pH 7–9. The C=N linker may therefore become a versatile design for highly efficient fluorescent chemodosimeters for ClO. However, fluorometric imaging of ClO in living cells was unsuccessful because use of organic solvent is necessary due to the low solubility of 1. In addition, the imaging at physiologically relevant ClO concentrations cannot be performed due to the low reactivity of 1 with ClO. Replacement of p-toluenesulfonyl hydrazine moiety to other moieties may affect the solubility to aqueous solution and the reactivity towards ClO. These improvements are considered essential for the living cell imaging.

Supplementary Materials

Supplementary Materials can be found at https://www.mdpi.com/2227-9040/8/4/123/s1, Table S1: TD-DFT calculation results. Figure S1: 1H NMR chart of 3. Figure S2: 13C NMR chart of 3. Figure S3: FAB(+)-MS chart of 3. Figure S4: 1H NMR chart of 1. Figure S5: 13C NMR chart of 1. Figure S6: 1H–1H COSY chart of 1. Figure S7: FAB(+)-MS chart of 1. Figure S8: TLC results. Figure S9: FAB(+)-MS chart of the product by the reaction of 1 with ClO. Figure S10: FAB(–)-MS chart of the product by the reaction of 1 with ClO. Cartesian Coordinates of 1. Cartesian Coordinates of 2.

Author Contributions

Writing—review and editing, Y.S.; investigation, R.N., S.T., C.Y., and T.H. All authors have read and agreed to the published version of the manuscript.

Funding

This work was partly supported by the Grant-in Aid for Challenging Exploratory Research (no. 20K21109) from the Ministry of Education, Culture, Sports, Science and Technology, Japan (MEXT).

Acknowledgments

We thank M. Nakahata and S. Sakai at the Graduate School of Engineering Science, Osaka University for their help in the cell imaging experiments.

Conflicts of Interest

The authors declare no conflict of interest.

References

  1. Aoki, T.; Munemori, M. Continuous Flow Determination of Free Chlorine in Water. Anal. Chem. 1983, 55, 209–212. [Google Scholar] [CrossRef]
  2. Shepherd, J.; Hilderbrand, S.A.; Waternan, P.; Heinecke, J.W.; Weissleder, R.; Libby, P. A novel fluorescent probe for the detection of myeloperoxidase activity in atherosclerosis-associated macrophages. Chem. Biol. 2007, 14, 1221–1231. [Google Scholar] [CrossRef] [PubMed] [Green Version]
  3. Kettle, A.J.; Winterbourn, C.C. Myeloperoxidase: A key regulator of neutrophil oxidant production. Redox Rep. 1997, 3, 3–15. [Google Scholar] [CrossRef] [Green Version]
  4. Steinbeck, M.J.; Nesti, L.J.; Sharkey, P.F.; Parvizi, J. Myeloperoxidase and chlorinated peptides in osteoarthritis: Potential biomarkers of the disease. J. Orthop. Res. 2007, 25, 1128–1135. [Google Scholar] [CrossRef] [Green Version]
  5. Sugiyama, S.; Okada, Y.; Sukhova, G.K.; Virmani, R.; Heinecke, J.W.; Libby, P. Macrophage myeloperoxidase regulation by granulocyte macrophage colony-stimulating factor in human atherosclerosis and implications in acute coronary syndromes. Am. J. Pathol. 2001, 158, 879–891. [Google Scholar] [CrossRef] [Green Version]
  6. Sugiyama, T.; Fujita, M.; Koide, N.; Mori, I.; Yoshida, T.; Mori, H.; Yokochi, T. 2-Aminopurine inhibits lipopolysaccharide-induced nitric oxide production by preventing IFN-β production. Microbiol. Immunol. 2004, 48, 957–963. [Google Scholar] [CrossRef] [Green Version]
  7. Choi, D.-K.; Pennathur, S.; Perier, C.; Tieu, K.; Teismann, P.; Wu, D.-C.; Lewis, V.J.; Vila, M.; Vonsattel, J.-P.; Heinecke, J.W.; et al. Ablation of the inflammatory enzyme myeloperoxidase mitigates features of parkinson’s disease in mice. J. Neurosci. 2005, 25, 6594–6600. [Google Scholar] [CrossRef]
  8. Hazen, S.L.; Hsu, F.F.; Duffin, K.; Heinecke, J.W. Molecular Chlorine Generated by the Myeloperoxidase-Hydrogen Peroxide-Chloride System of Phagocytes Converts Low Density Lipoprotein Cholesterol into a Family of Chlorinated Sterols. J. Biol. Chem. 1996, 271, 23080–23088. [Google Scholar] [CrossRef] [Green Version]
  9. Adam, L.C.; Gordon, G. Direct and sequential potentiometric determination of hypochlorite, chlorite, and chlorate ions when hypochlorite ion is present in large excess. Anal. Chem. 1995, 67, 535–540. [Google Scholar] [CrossRef]
  10. Xu, Q.; Lee, K.A.; Lee, S.; Lee, K.M.; Lee, W.J.; Yoon, J.A. A Highly Specific Fluorescent Probe for Hypochlorous Acid and Its Application in Imaging Microbe-Induced HOCl Production. J. Am. Chem. Soc. 2013, 135, 9944–9949. [Google Scholar] [CrossRef]
  11. Chen, X.; Tian, X.; Shin, I.; Yoon, J. Fluorescent and luminescent probes for detection of reactive oxygen and nitrogen species. Chem. Soc. Rev. 2011, 40, 4783–4804. [Google Scholar] [CrossRef] [PubMed]
  12. Wu, D.; Chen, L.; Xu, Q.; Chen, X.; Yoon, J. Design Principles, Sensing Mechanisms, and Applications of Highly Specific Fluorescent Probes for HOCl/OCl. Acc. Chem. Res. 2019, 52, 2158–2168. [Google Scholar] [CrossRef] [PubMed]
  13. Grabchev, I.; Petkov, C.; Bojinov, V. 1,8-Naphthalimides as blue emitting fluorophores for polymer materials. Macromol. Mater. Eng. 2002, 287, 904–908. [Google Scholar] [CrossRef]
  14. Xiong, K.; Huo, F.; Yin, C.; Chao, J.; Zhang, Y.; Xu, M. A highly selective fluorescent bioimaging probe for hypochloritebased on 1,8-naphthalimide derivative. Sens. Actuators B 2015, 221, 1508–1514. [Google Scholar] [CrossRef]
  15. Feng, H.; Zhang, Z.; Meng, Q.; Jia, H.; Wang, Y.; Zhang, R. Rapid Response Fluorescence Probe Enabled In Vivo Diagnosis and Assessing Treatment Response of Hypochlorous Acid-Mediated Rheumatoid Arthritis. Adv. Sci. 2018, 5, 1800397. [Google Scholar] [CrossRef]
  16. Lee, S.C.; Kim, C. Naphthalimide-based probe for the detection of hypochlorite in a near-perfect aqueous solution. Anal. Sci. 2019, 35, 1189–1193. [Google Scholar] [CrossRef] [Green Version]
  17. Goswami, S.; Maity, S.; Maity, A.C.; Das, A.K. Chemical Fluorometric and Naked-Eye Detectable Dual Signaling Chemodosimeter for Hypochlorite. Sens. Actuators B 2014, 204, 741–745. [Google Scholar] [CrossRef]
  18. Cho, M.J.; Ryu, H.; Lee, H.J.; Chang, S. Chemical Selective Fluorescence Signaling of Hypochlorite in Tap Water by Oxidative Hydrolysis of Sulfonhydrazone. Sens Actuators B 2017, 241, 285–291. [Google Scholar] [CrossRef]
  19. Qiao, L.; Nie, H.; Wu, Y.; Xin, F.; Gao, C.; Jing, J.; Zhang, X. An ultrafast responsive BODIPY-based fluorescent probe for the detection of endogenous hypochlorite in live cells. J. Mater. Chem. B 2017, 5, 525–530. [Google Scholar] [CrossRef]
  20. Setsukinai, K.; Urano, Y.; Kakinuma, K.; Majima, H.J.; Nagano, T. Development of novel fluorescence probes that can reliably detect reactive oxygen species and distinguish specific species. J. Biol. Chem. 2003, 278, 3170–3175. [Google Scholar] [CrossRef] [Green Version]
  21. Sun, Z.-N.; Liu, F.-Q.; Chen, Y.; Tam, P.K.H.; Yang, D. A Highly Specific BODIPY-Based Fluorescent Probe for the Detection of Hypochlorous Acid. Org. Lett. 2008, 10, 2171–2174. [Google Scholar] [CrossRef] [PubMed]
  22. Shiraishi, Y.; Nakamura, M.; Hayashi, N.; Hirai, T. Coumarin-spyropyran dyad with a hydrogenated pyran moiety for rapid, selective, and sensitive fluorometric detection of cyanide anion. Anal. Chem. 2016, 88, 6805–6811. [Google Scholar] [CrossRef] [PubMed]
  23. Shiraishi, Y.; Hashimoto, M.; Chishiro, K.; Moriyama, K.; Tanaka, S.; Hirai, T. Photocatalytic dinitrogen fixation with water on bismuth oxychloride in chloride solutions for solar-to-chemical energy conversion. J. Am. Chem. Soc. 2020, 142, 7574–7583. [Google Scholar] [CrossRef] [PubMed]
  24. Bag, B.; Bharadwaj, P.K. Perturbation of the PET process in fluorophore-spacer-receptor systems through structural modification: Transition metal induced fluorescence enhancement and selectivity. J. Phys. Chem. B 2005, 109, 4377–4390. [Google Scholar] [CrossRef]
  25. Proutiere, A.; Megnassan, E.; Hucteau, H. Refractive index and density variations in pure liquids: A new theoretical relation. J. Phys. Chem. 1992, 96, 3485–3489. [Google Scholar] [CrossRef]
  26. Song, L.; Yang, Y.; Zhang, Q.; Tian, H.; Zhu, W. Synthesis and photochromism of naphthopyrans bearing naphthalimide chromophore: Predominant thermal reversibility in color-fading and fluorescence switch. J. Phys. Chem. B 2011, 115, 14648–14658. [Google Scholar] [CrossRef]
  27. Guo, B.; Nie, H.; Yang, W.; Tian, Y.; Jing, J.; Zhang, X. A highly sensitive and rapidly responding fluorescent probe with alarge Stokes shift for imaging intracellular hypochlorite. Sens. Actuators B 2016, 236, 459–465. [Google Scholar] [CrossRef]
  28. Liu, Y.; Sakai, S.; Kawa, S.; Taya, M. Identification of Hydrogen Peroxide-Secreting Cells by Cytocompatible Coating with a Hydrogel Membrane. Anal. Chem. 2014, 86, 11592–11598. [Google Scholar] [CrossRef]
  29. Shiraishi, Y.; Hayashi, N.; Nakahata, M.; Sakai, S.; Hirai, T. Naphthalimide-Coumarin Conjugate: Ratiometric Fluorescent Receptor for Self-Calibrating Quantification of Cyanide Anion in Cells. RSC Adv. 2017, 7, 32304–32309. [Google Scholar] [CrossRef] [Green Version]
  30. Sharma, N.; Reja, S.I.; Bhalla, V.; Kumar, M. A new thiacalix[4]arene-fluorescein based probe for detection of CN and Cu2+ ions and construction of a sequential logic circuit. Dalton Trans. 2014, 43, 15929–15936. [Google Scholar] [CrossRef]
  31. Mancini, M.C.; Kairdolf, B.A.; Smith, A.M.; Nie, S. Oxidative Quenching and Degradation of Polymer-Encapsulated Quantum Dots: New Insights into the Long-Term Fate and Toxicity of Nanocrystals In Vivo. J. Am. Chem. Soc. 2008, 130, 10836–10837. [Google Scholar] [CrossRef] [PubMed] [Green Version]
  32. Greim, H.; Ahlers, J.; Bias, R.; Broecker, B.; Hollander, H.; Gelbke, H.P.; Klimisch, H.J.; Mangelsdorf, I.; Paetz, A.; Schön, N.; et al. Toxicity and Ecotoxicity of Sulfonic Acids: Structure-Activity Relationship. Chemosphere 1994, 28, 2203–2236. [Google Scholar]
  33. Ortiz, G.; Liu, P.; Naing, S.H.H.; Muller, V.R.; Miller, E.W. Synthesis of Sulfonated Carbofluoresceins for Voltage Imaging. J. Am. Chem. Soc. 2019, 14, 6631–6638. [Google Scholar] [CrossRef]
  34. Liu, H.; Zhang, H.; Luo, J.; Peng, J.; An, B.; Qiao, Z.; Wei, N.; Zhang, Y.; Zhu, W. Highly Efficient Cell Membrane Tracker Based on a Solvatochromic Dye with Near-Infrared Emission. ACS Omega 2020, 5, 11829–11835. [Google Scholar] [CrossRef]
  35. Stratmann, R.E.; Scuseria, G.E.; Frisch, M.J. An efficient implementation of time-dependent density-functional theory for the calculation of excitation energies of large molecules. J. Chem. Phys. 1998, 109, 8218–8224. [Google Scholar] [CrossRef]
  36. Nakagawara, S.; Goto, T.; Nara, M.; Ozawa, Y.; Hotta, K.; Arata, Y. Spectroscopic characterization and the pH dependence of bactericidal activity of the aqueous chlorine solution. Anal. Sci. 1998, 14, 691–698. [Google Scholar] [CrossRef] [Green Version]
  37. Xu, J.; Yuan, H.; Qin, C.; Zeng, L.; Bao, G.-M. A mitochondria-targeted near-infrared probe for colorimetric and ratiometric fluorescence detection of hypochlorite in living cells. RSC Adv. 2016, 6, 107525–107532. [Google Scholar] [CrossRef]
  38. Huang, Y.; Zhang, Y.; Huo, F.; Chao, J.; Yin, C. A near-infrared ratiometric fluorescent probe with large stokes based on isophorone for rapid detection of ClO and its bioimaging in cell and mice. Sens. Actuators B 2019, 287, 453–458. [Google Scholar] [CrossRef]
  39. Zha, J.; Fu, B.; Qin, C.; Zeng, L.; Hu, X. A ratiometric fluorescent probe for rapid and sensitive visualization of hypochlorite in living cells. RSC Adv. 2014, 4, 43110–43113. [Google Scholar] [CrossRef]
Scheme 1. Synthesis of the chemodosimeter 1.
Chemosensors 08 00123 sch001
Figure 1. (a) Fluorescence spectra of 1 (10 μM) in a buffered water/MeCN mixture (8/2 v/v, pH 7.0) at 25 °C with 50 equiv of each analyte. (b) Intensity obtained (grey) with 50 equiv of each analyte and (white) 50 equiv of ClO and analytes. All spectra were measured after stirring the solution for 10 min. The salts used are: NaF, KCl, NaBr, AcONa, NaNO2, and KNO3.
Chemosensors 08 00123 g001
Figure 2. (a) Fluorescence spectra of 1 (10 μM) upon titration with ClO. (b) Plots of the intensity ratio at 519 nm versus the ClO concentrations.
Chemosensors 08 00123 g002
Scheme 2. Proposed mechanism for the reaction of 1 with ClO.
Chemosensors 08 00123 sch002
Figure 3. (a) Change in fluorescence spectra of 1 in a buffered water/MeCN mixture (8/2 v/v, pH 7.0) after addition of 50 equiv of ClO. (b) Change in absorption spectra of 1 after addition of ClO.
Chemosensors 08 00123 g003
Figure 4. Effect of water content on the fluorescence intensity of 1 (10 μM) in the absence or presence of 50 equiv of ClO in a buffered water/MeCN mixture (8/2 v/v; HEPES 0.1 M, pH 7.0) at 25 °C. The respective data were obtained after stirring the solution for 10 min.
Chemosensors 08 00123 g004
Figure 5. Calculated energy diagrams and interfaces of main molecular orbitals of (left) 1 and (right) 2 (TD-DFT/B3LYP/6-31G+(d)).
Chemosensors 08 00123 g005
Figure 6. Fluorescence intensity of 1 at 519 nm in water/MeCN mixtures (8/2 v/v) with different pH, (red) with and (black) without ClO (50 equiv). The mole fraction of HClO and ClO calculated based on Equation 1 are also shown.
Chemosensors 08 00123 g006
Figure 7. Fluorescence images (λex = 470 nm, λem = 535 nm) of HeLa cells treated with 50 μM of 1 without or with different concentrations of ClO. (a,c,e,g) Bright field images and (b,d,f,h) fluorescence images, respectively.
Chemosensors 08 00123 g007
Publisher’s Note: MDPI stays neutral with regard to jurisdictional claims in published maps and institutional affiliations.

