Facile Synthesis of Silver-Doped Zinc Oxide Nanostructures as Efficient Scaffolds for Detection of p-Nitrophenol

 ,
,  , ,
, ,  ,
,  and
and
Abstract
1. Introduction
2. Experimental
2.1. Materials
2.2. Synthesis of ZnO Nanoparticles
2.3. Synthesis of Ag-Doped ZnO Nanostructures
2.4. Characterization
2.5. Luminescent Sensor Evaluation of ZnO and Ag-ZnO Nanoparticles
3. Results and Discussion
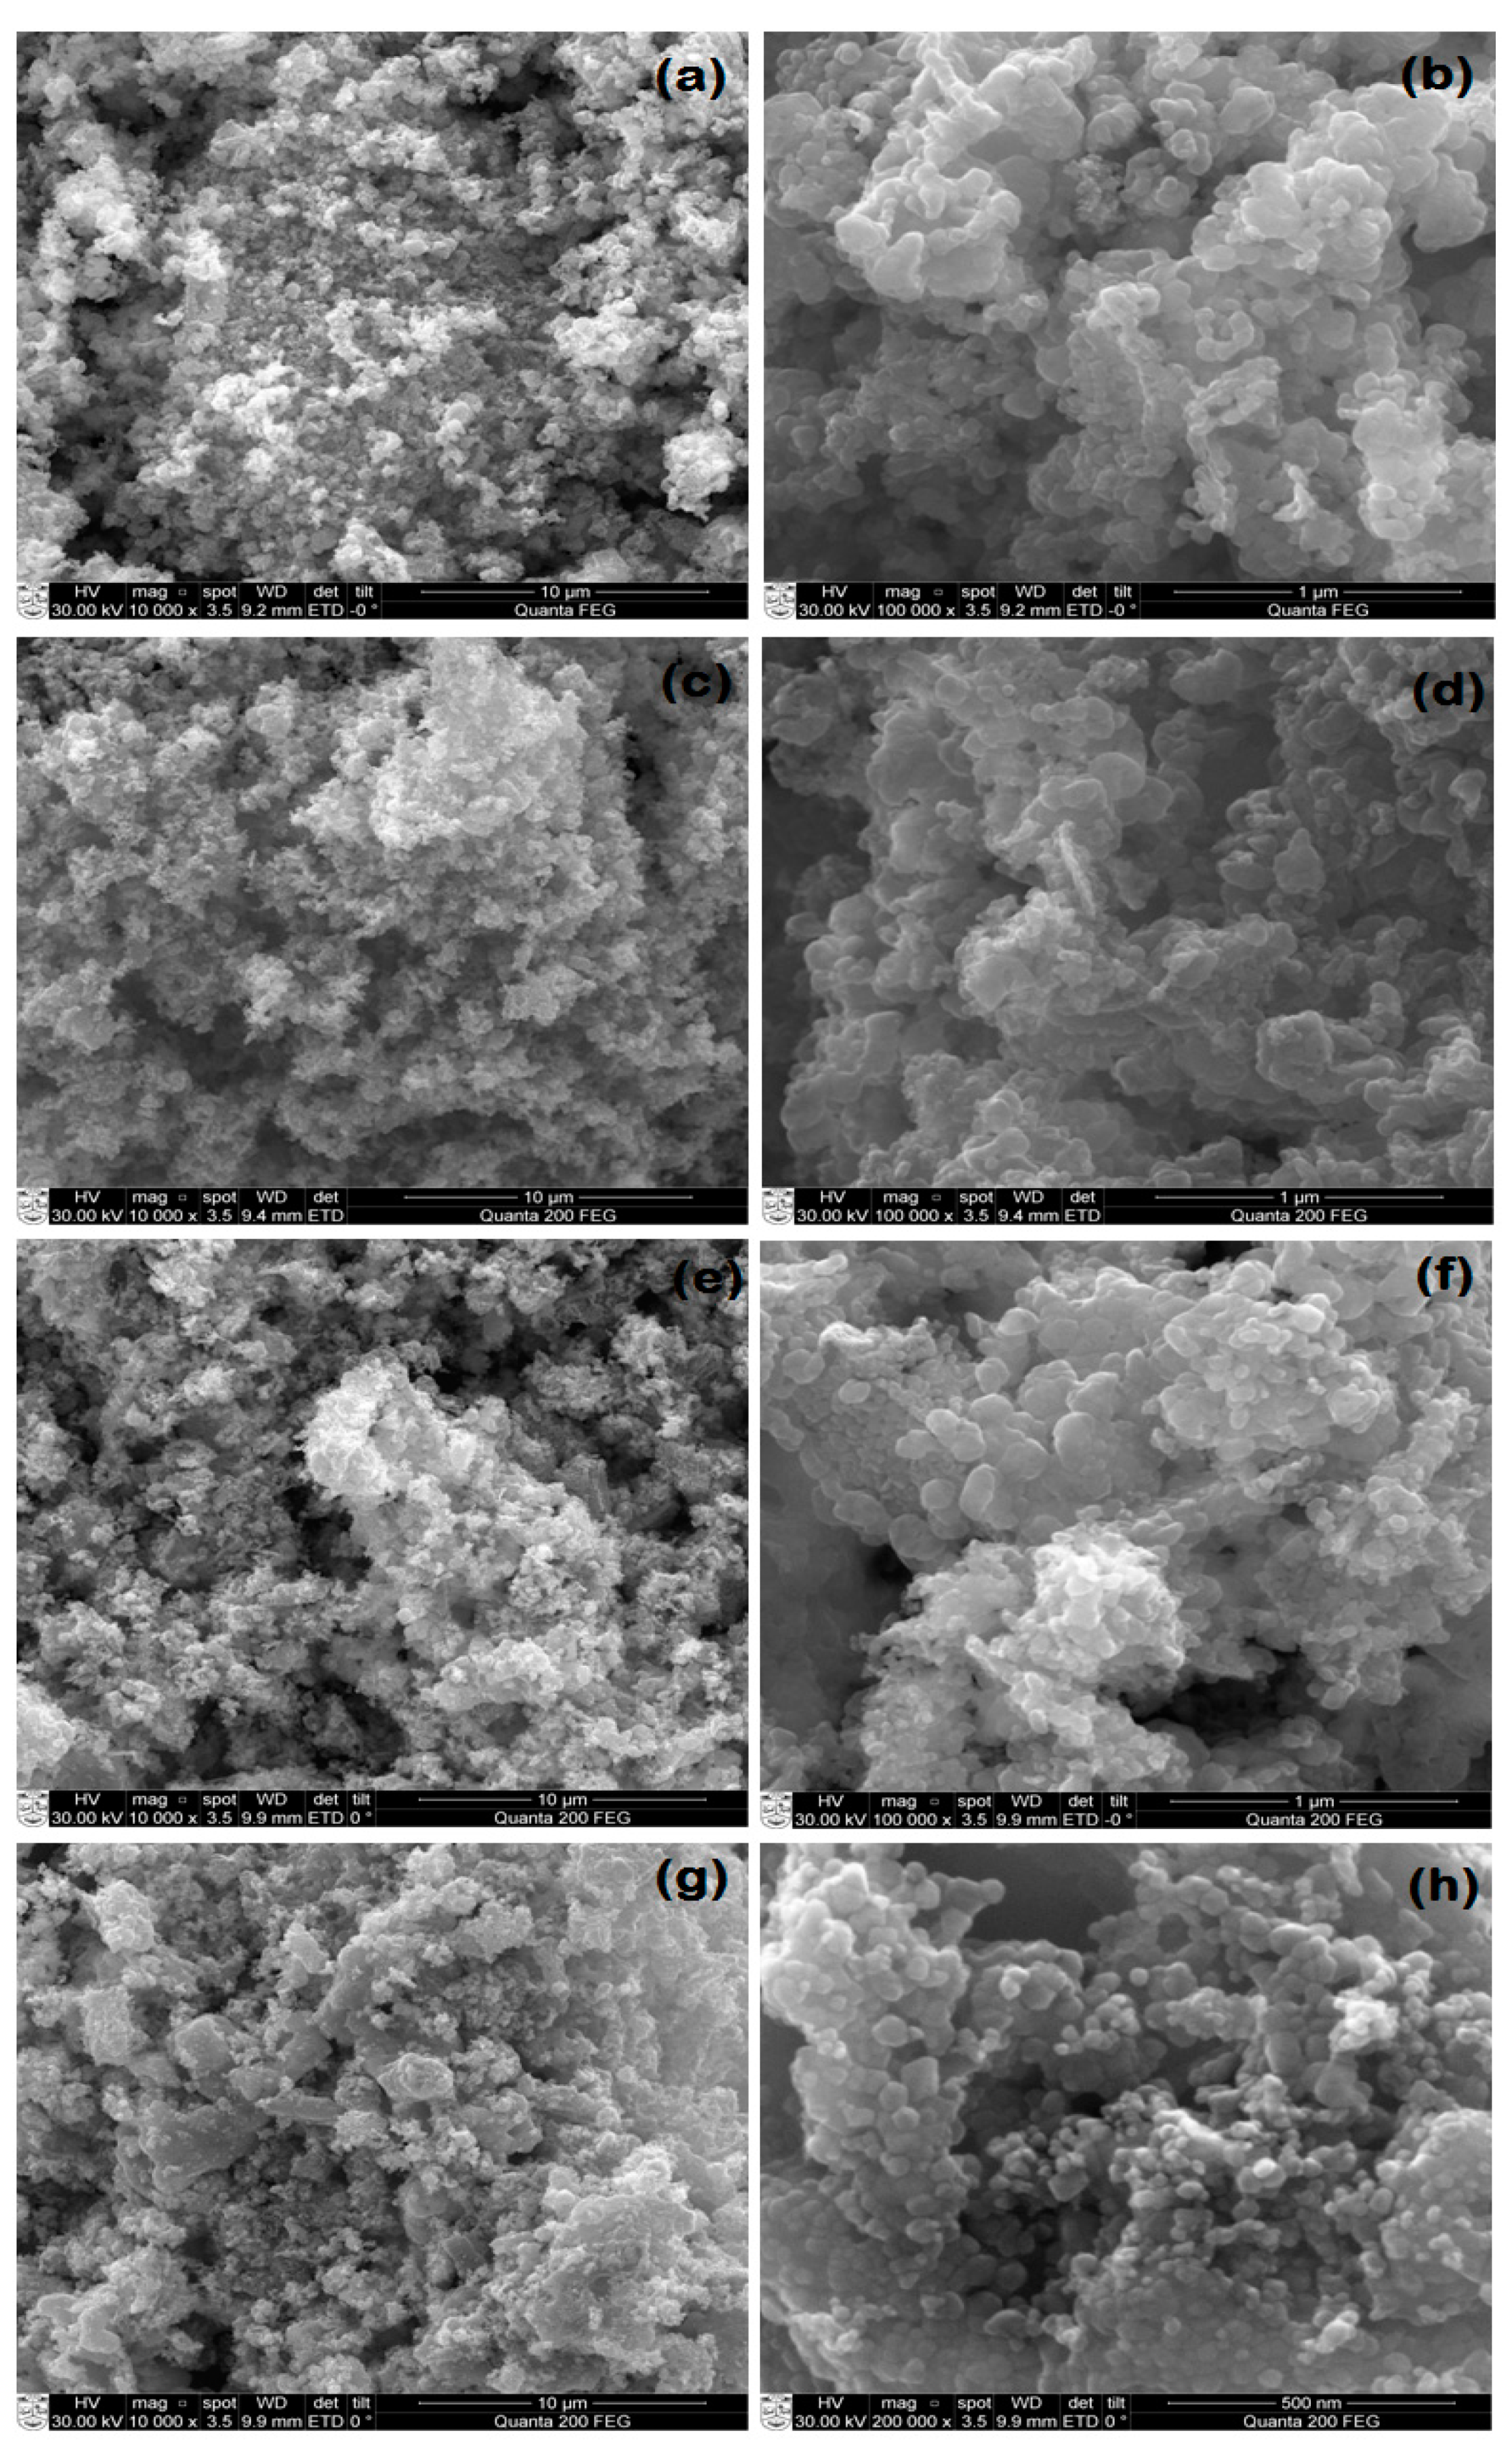
3.1. FESEM of AgxZn1−xO Nanostructure
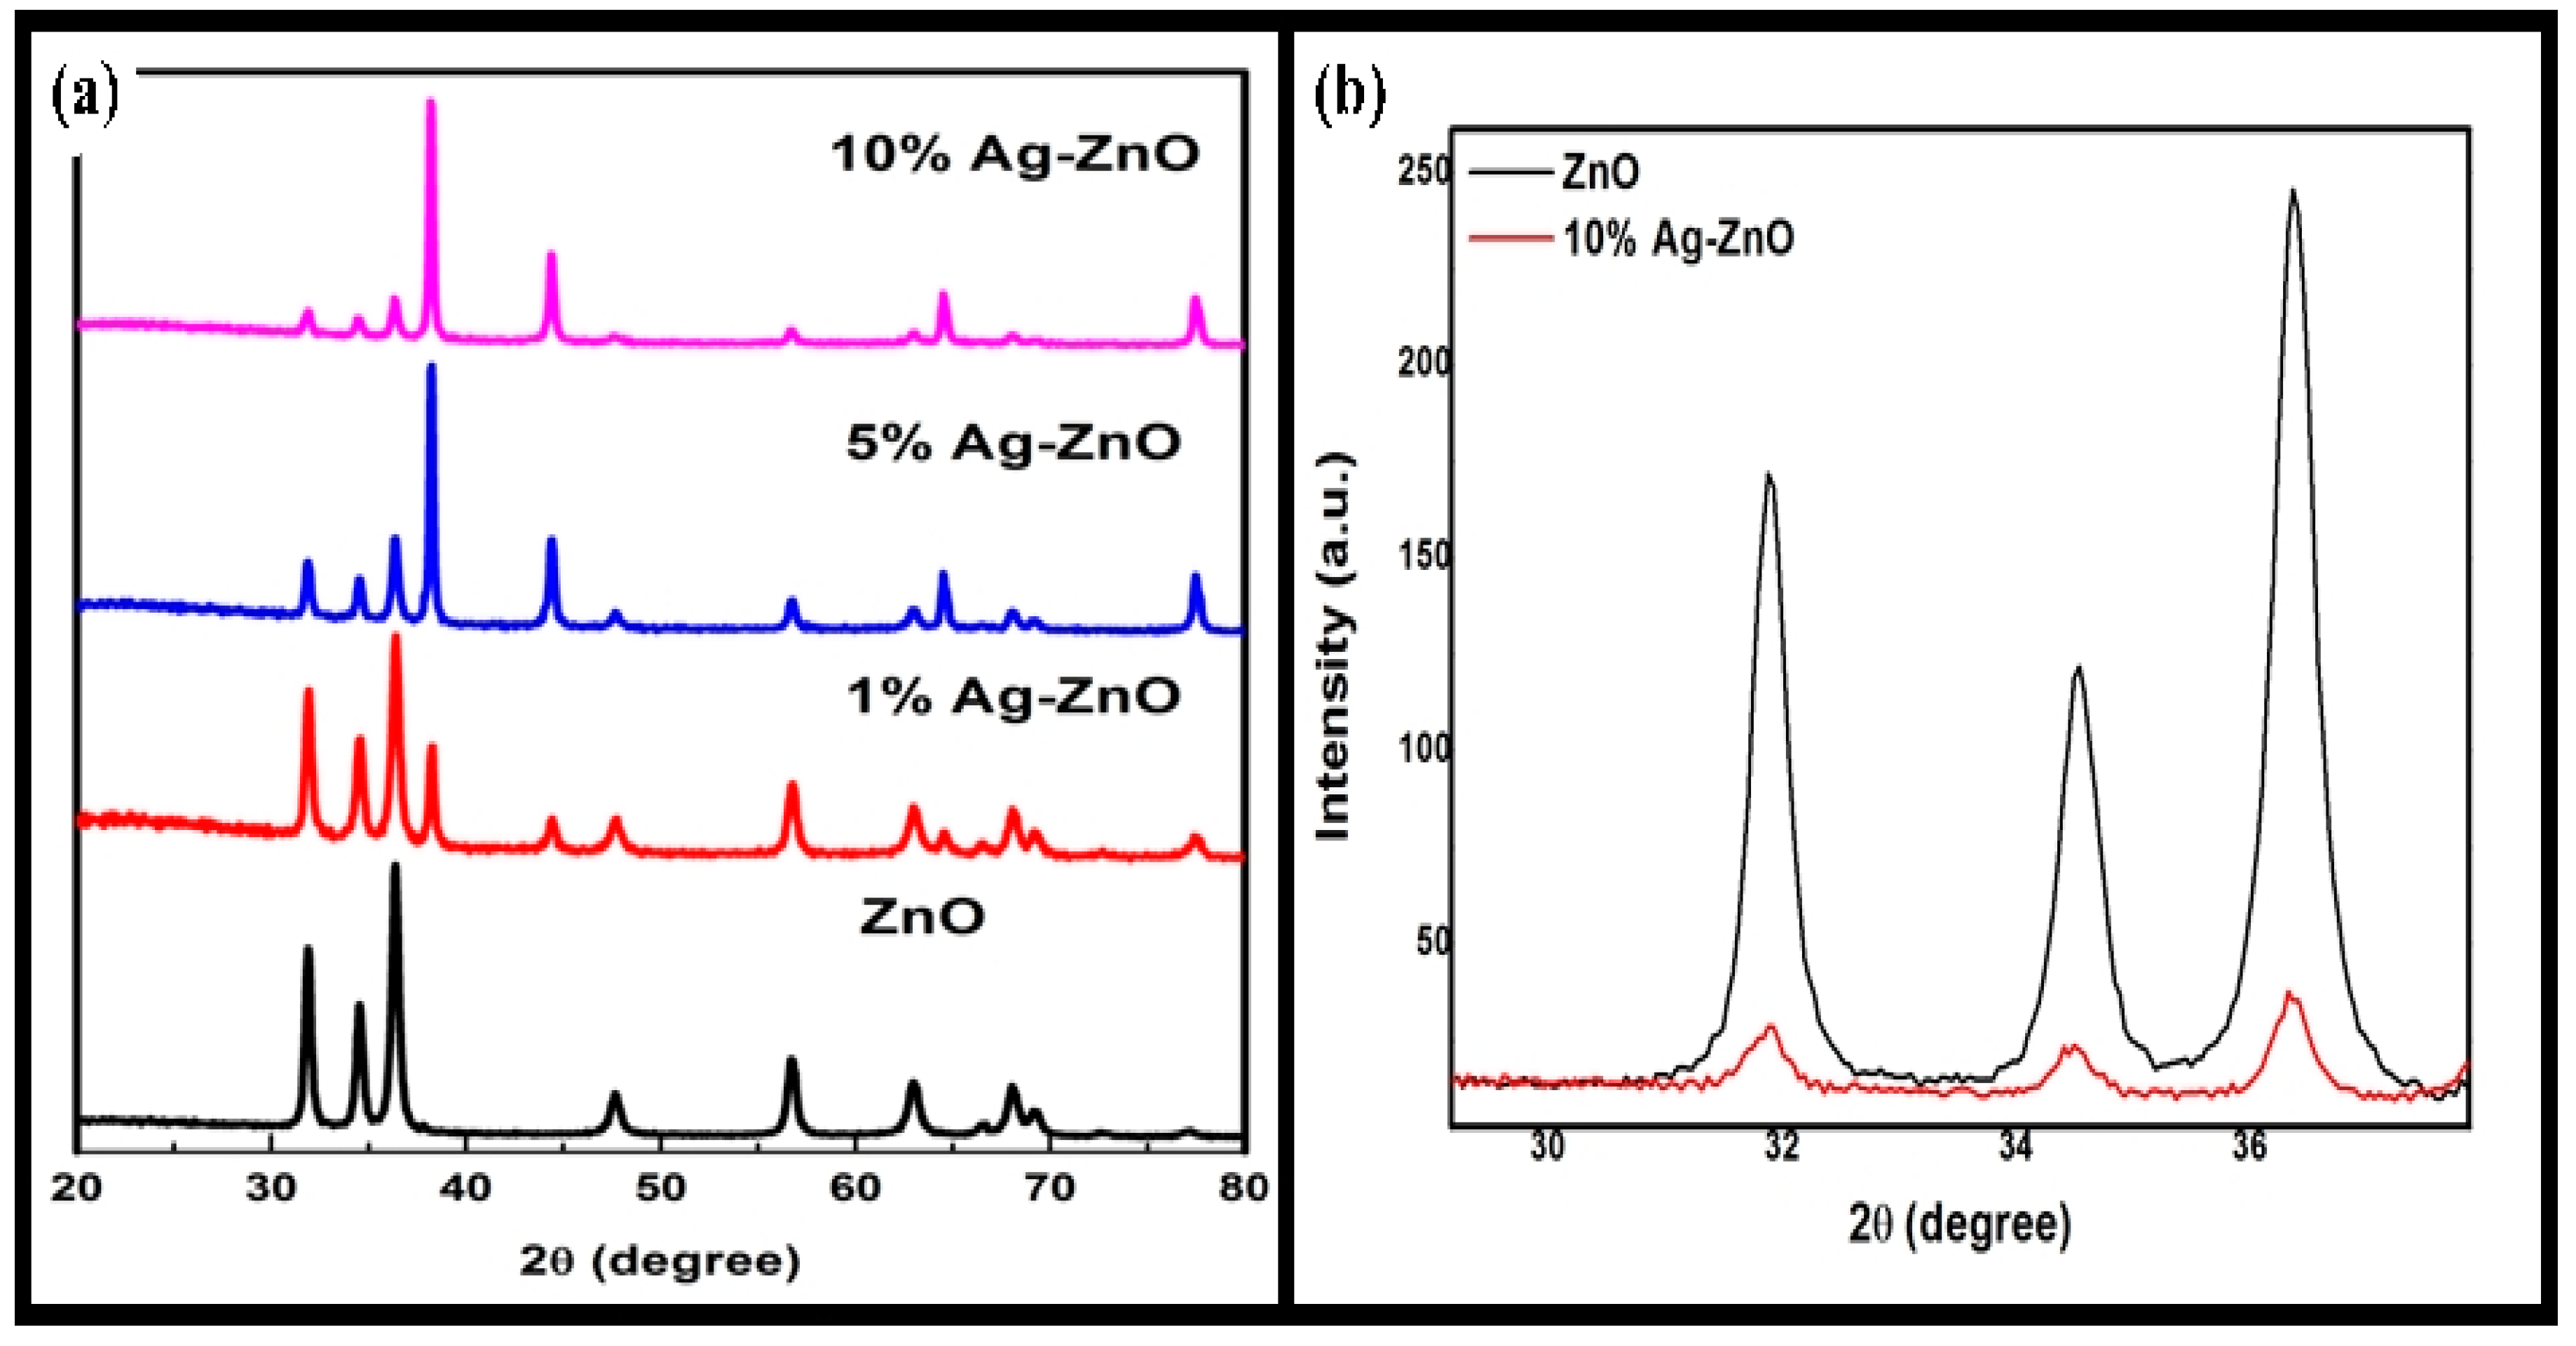
3.2. PXRD
3.3. EDS
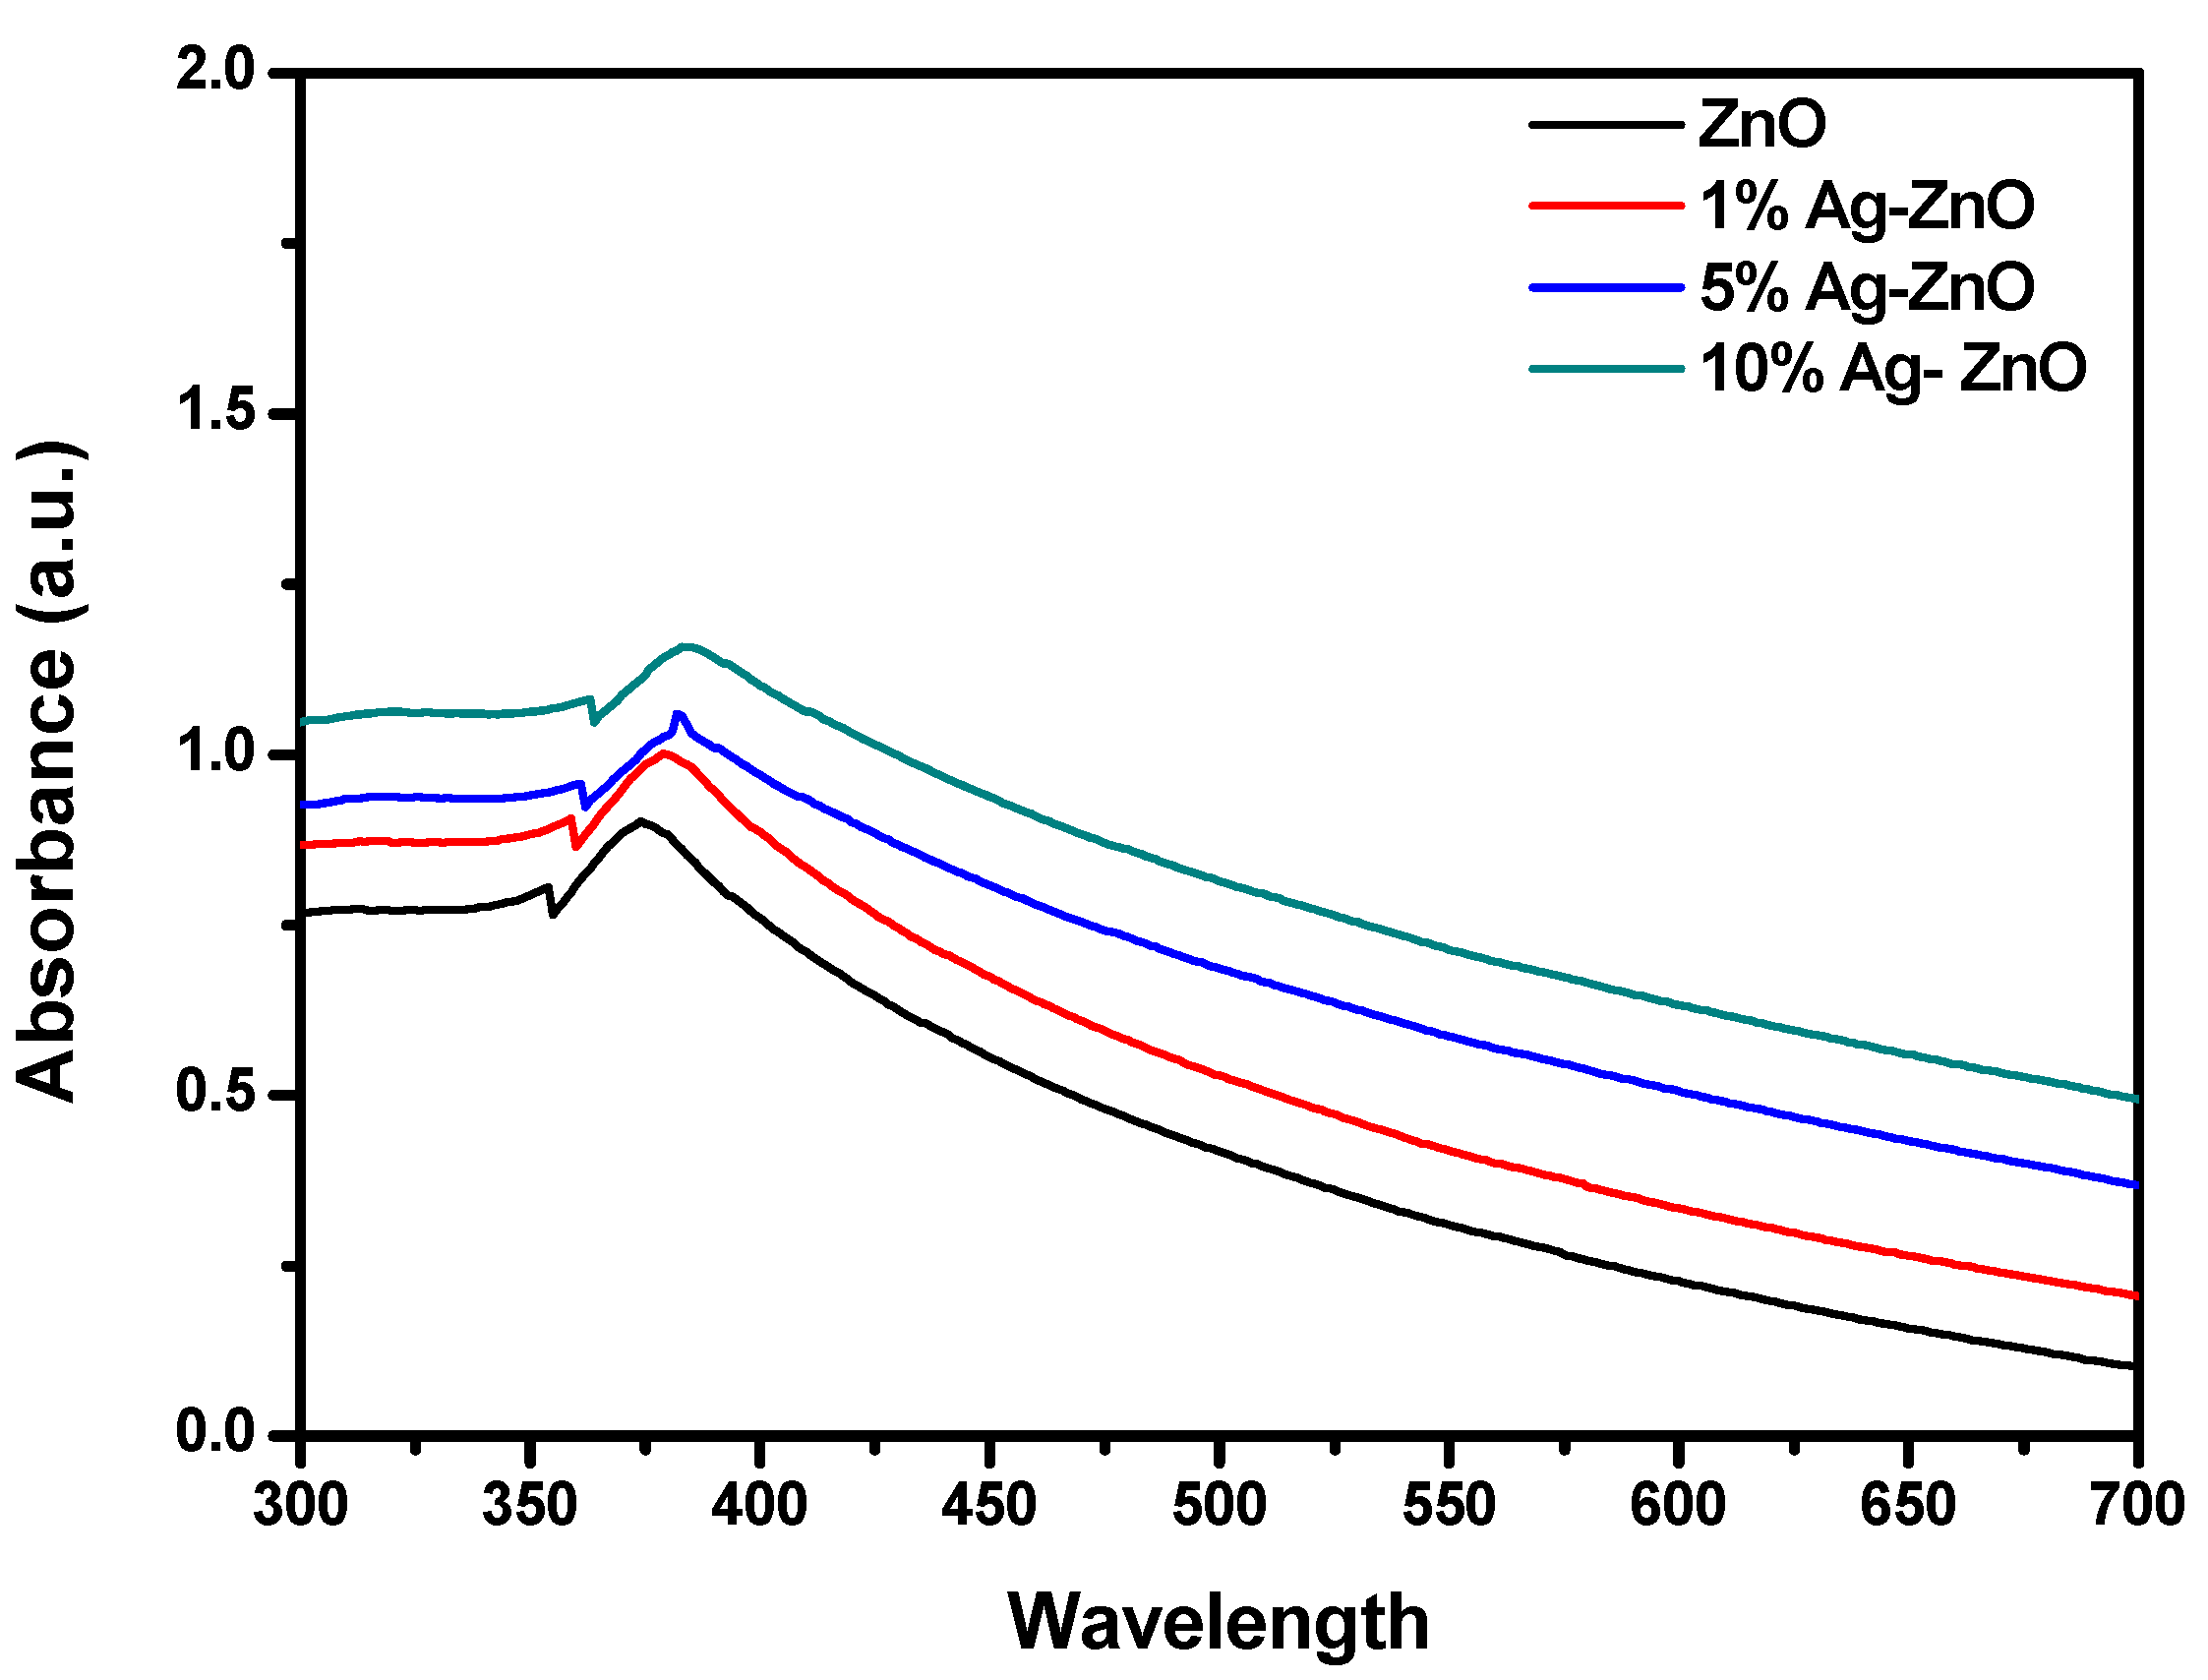
3.4. UV–Visible
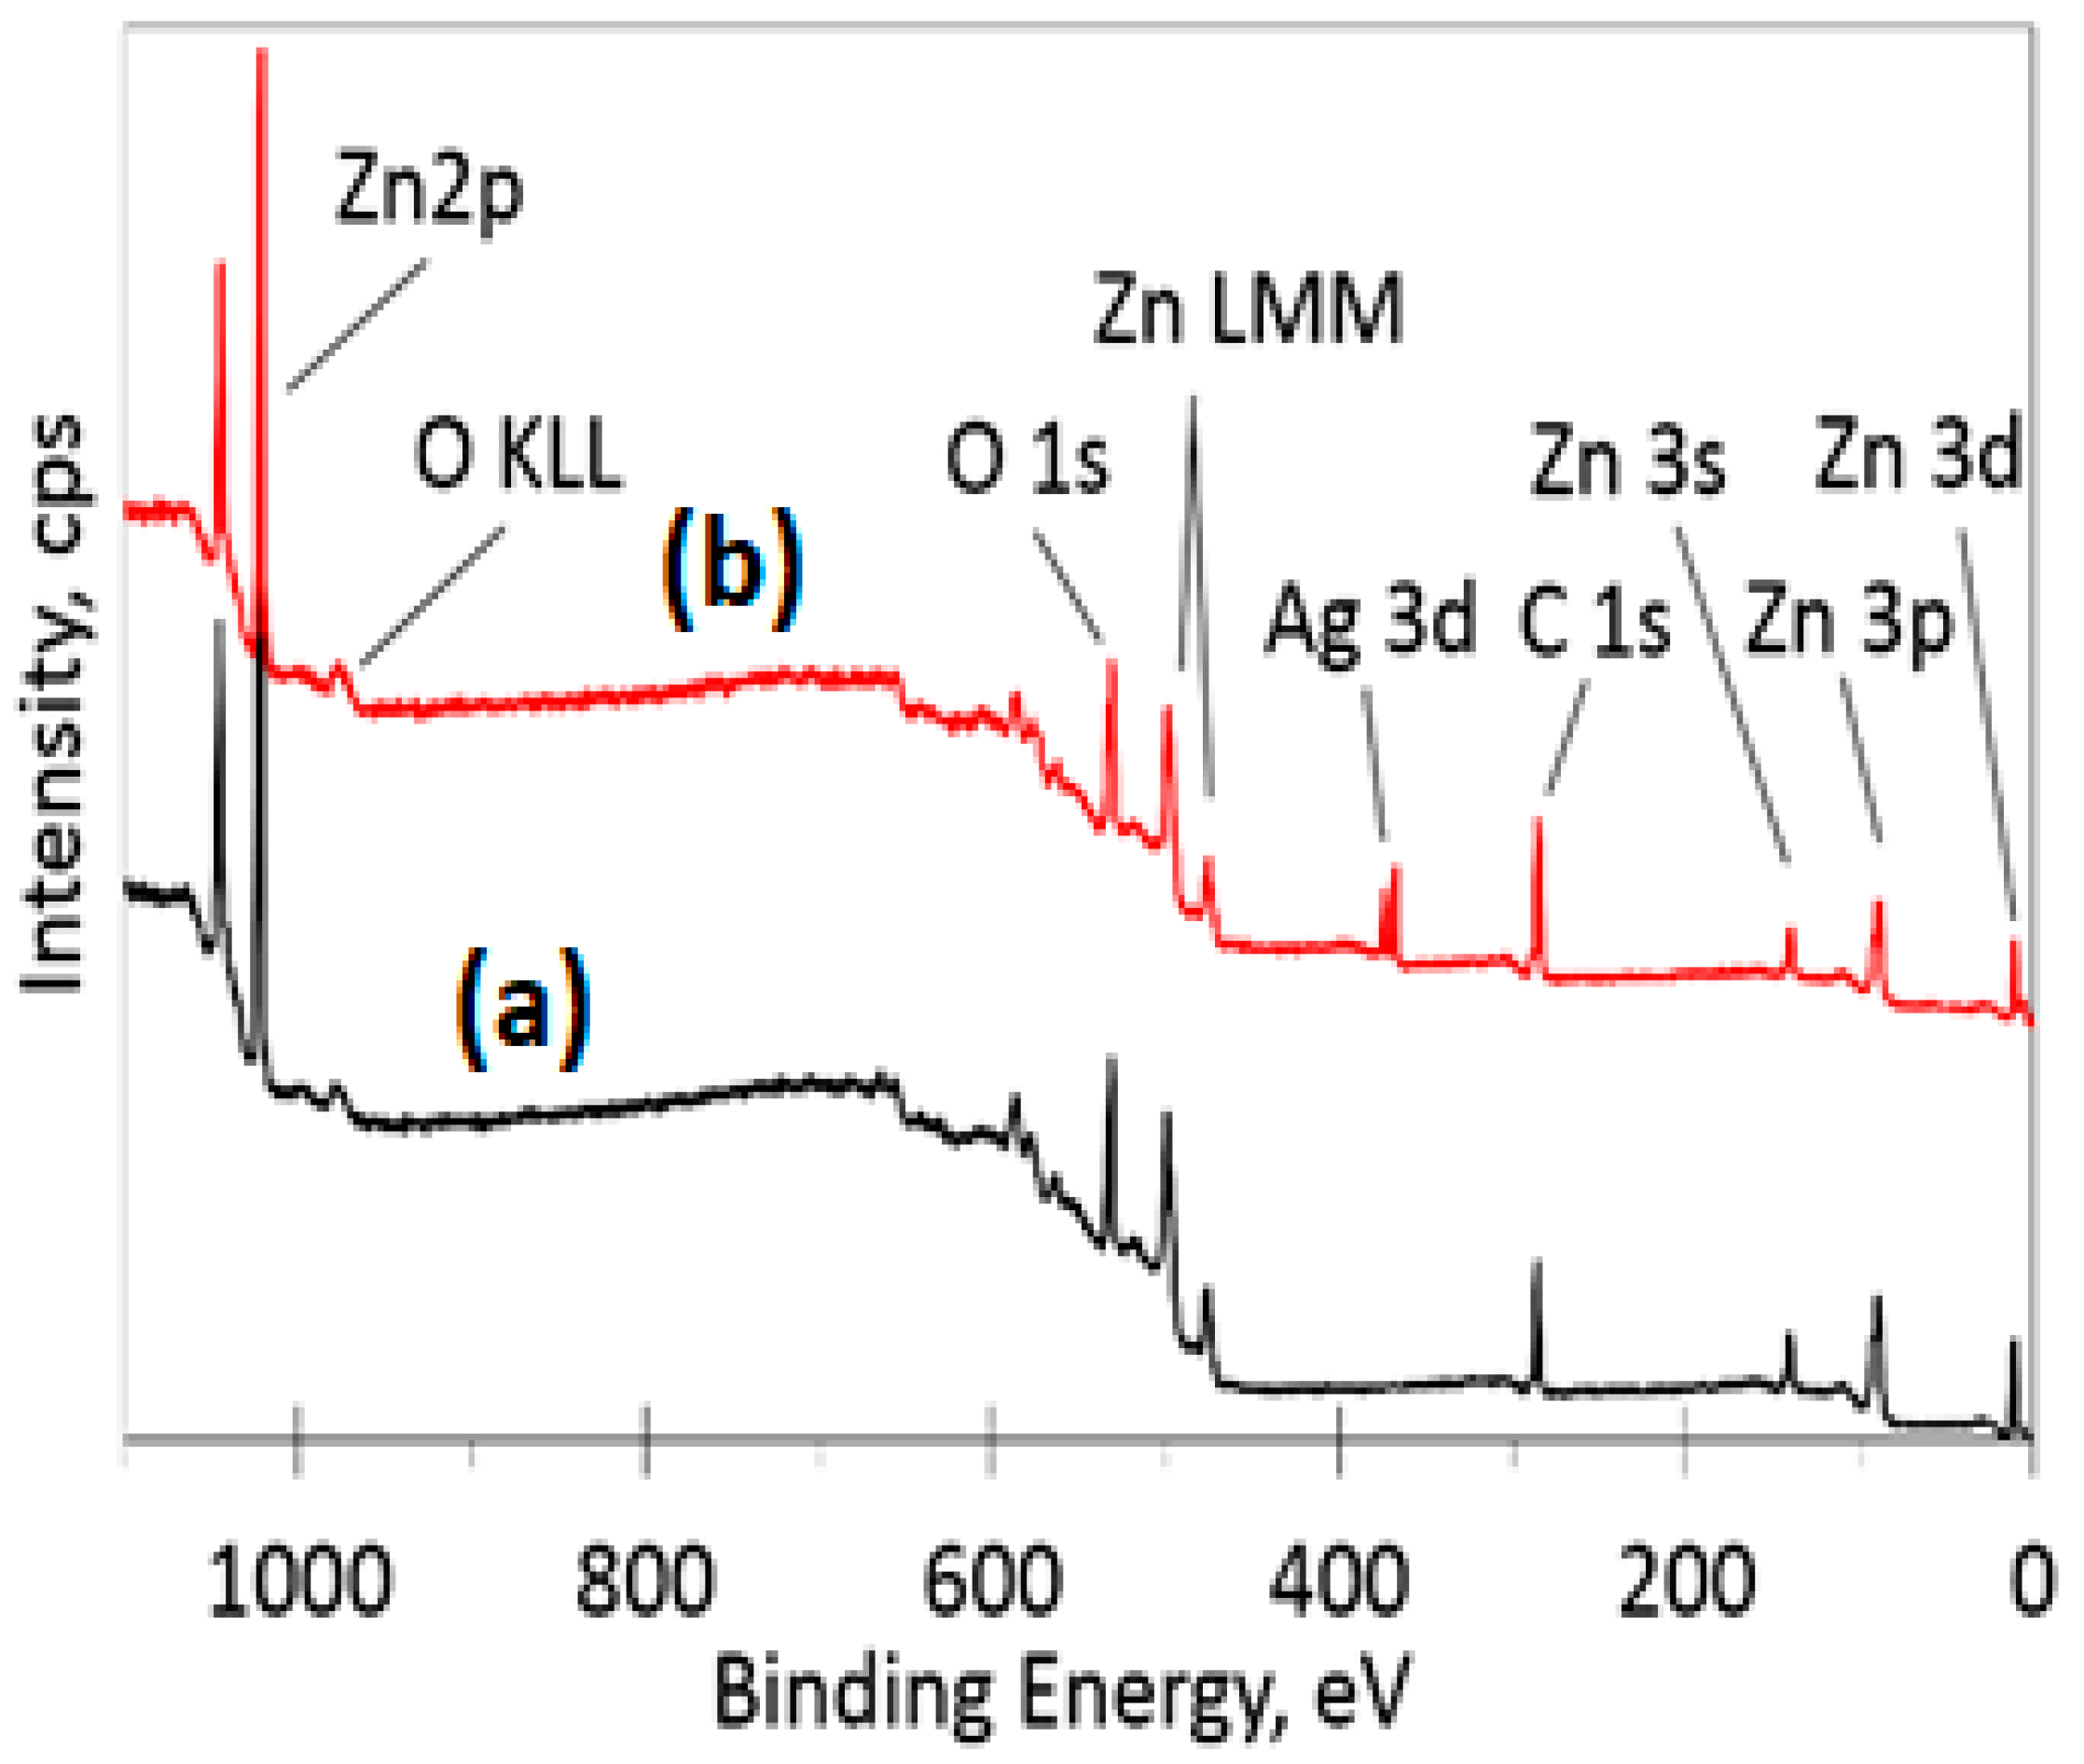
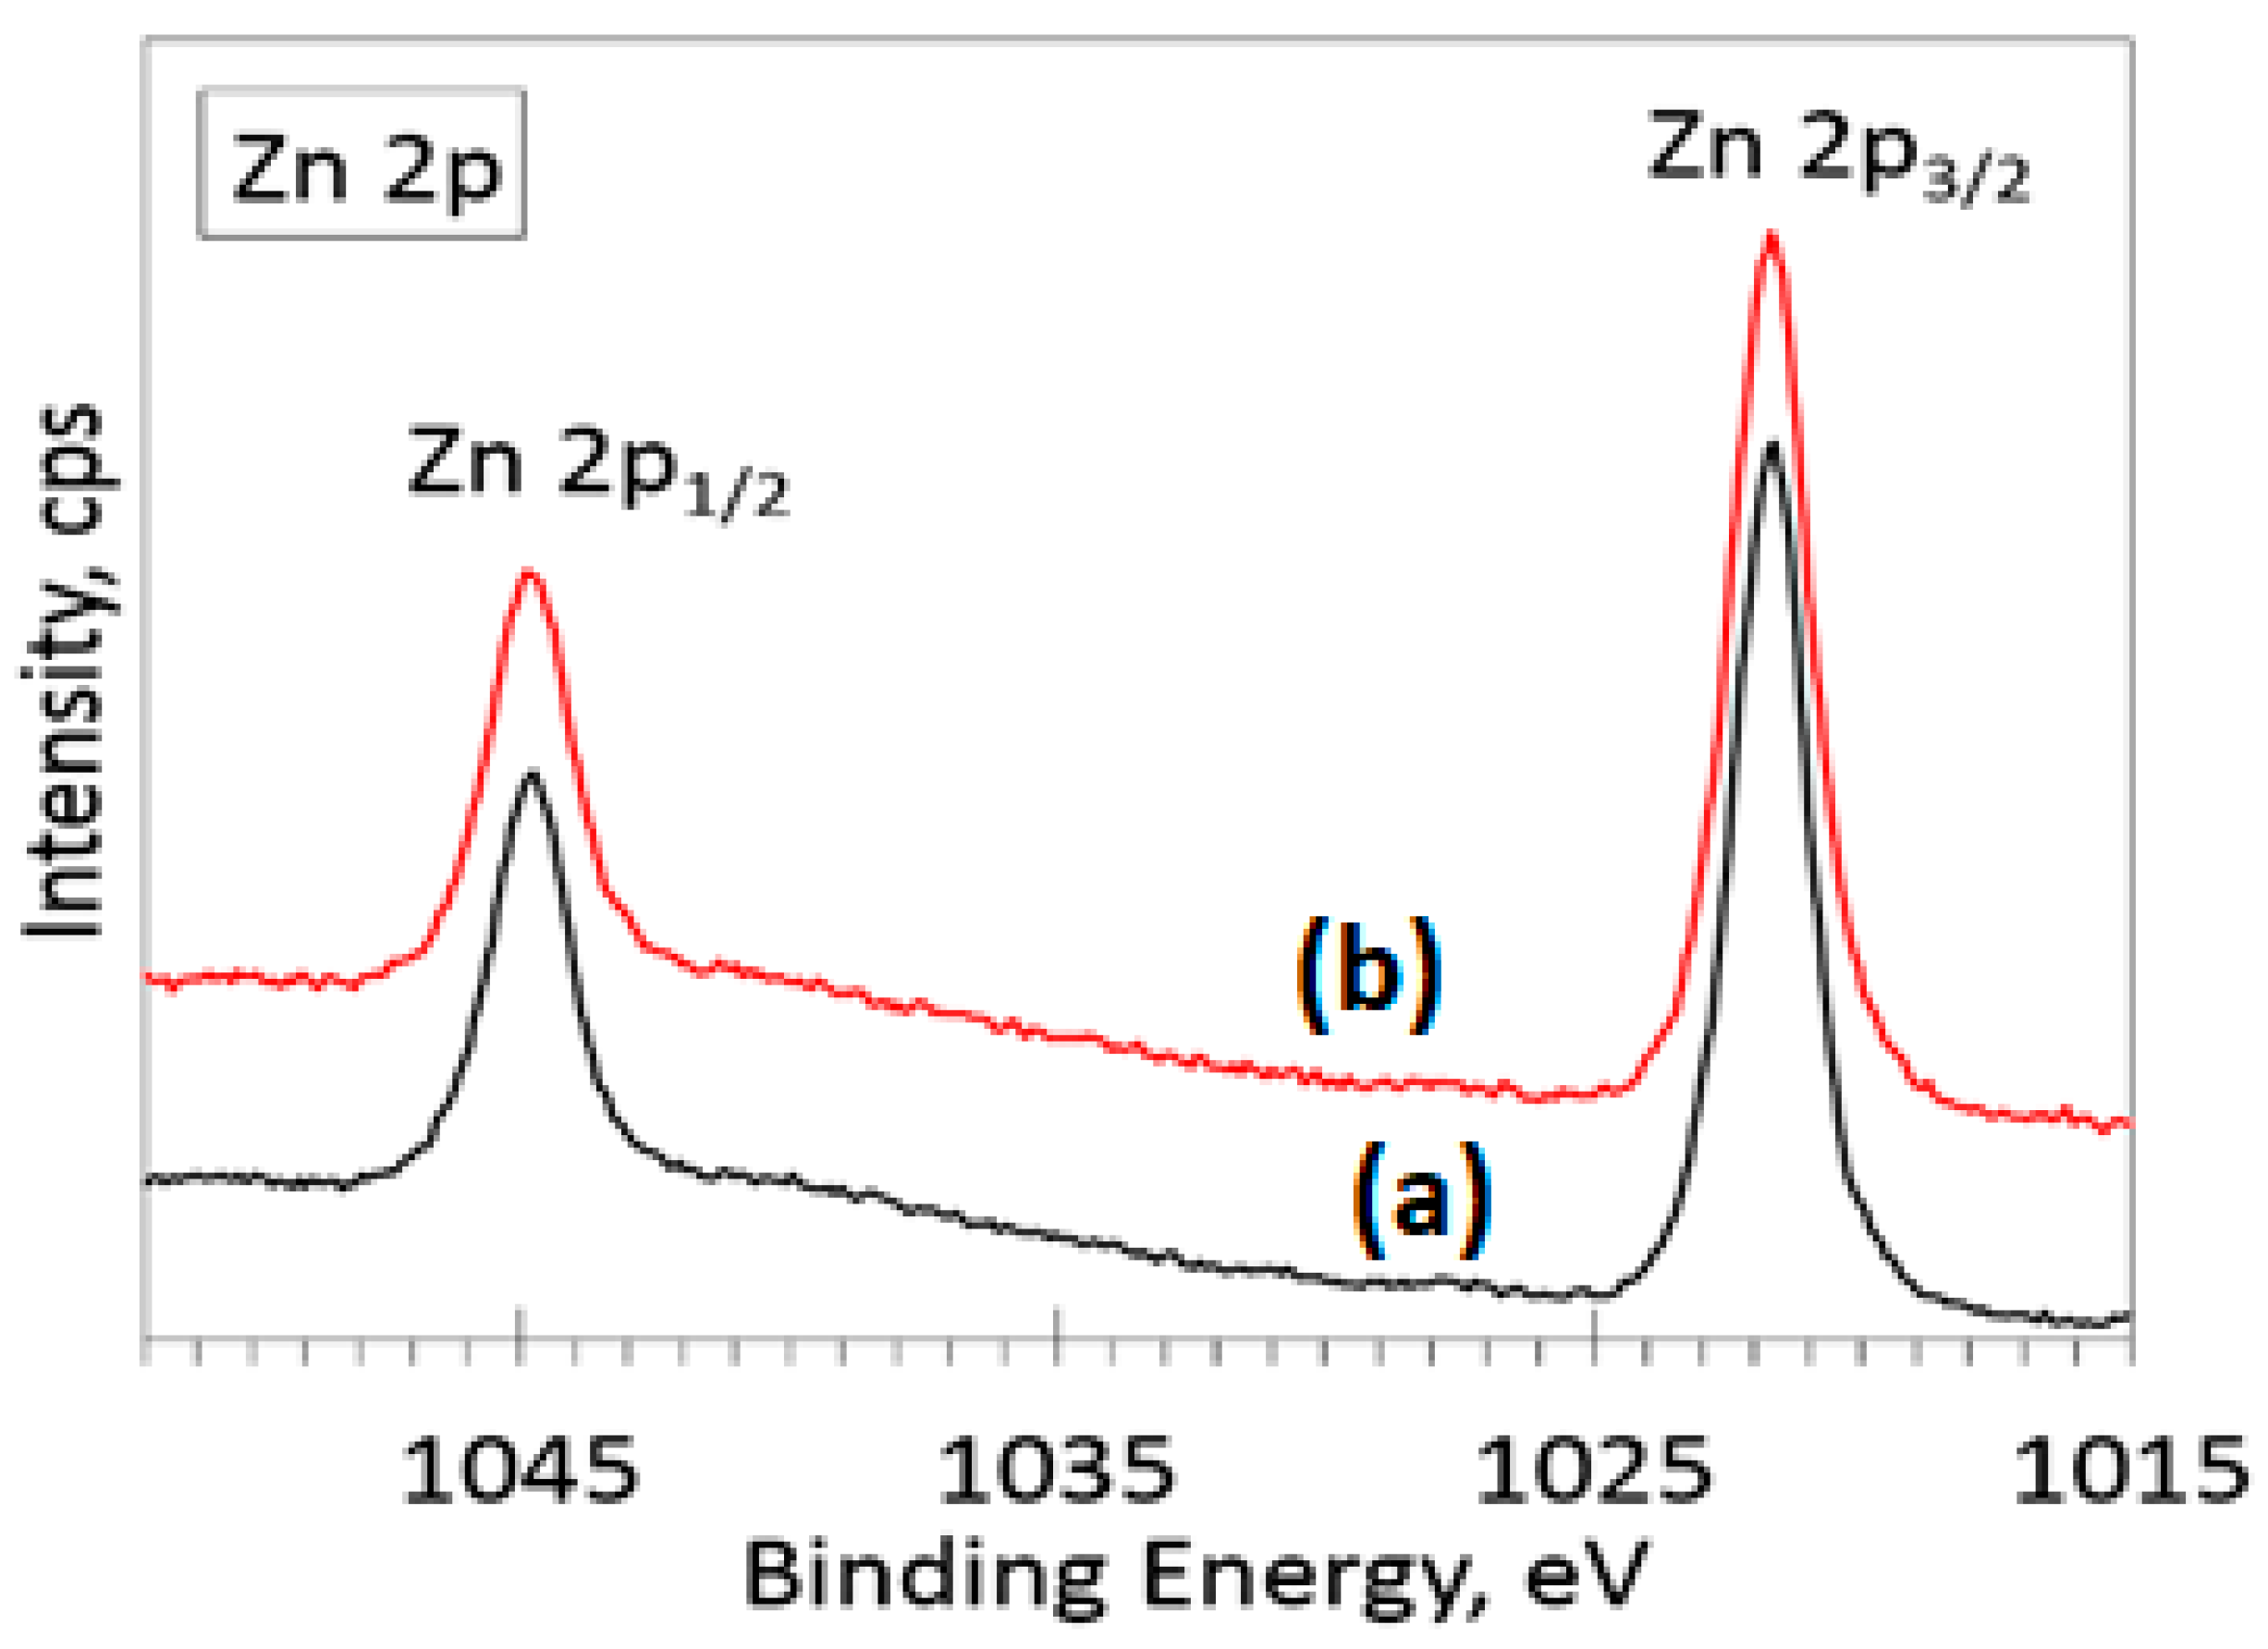
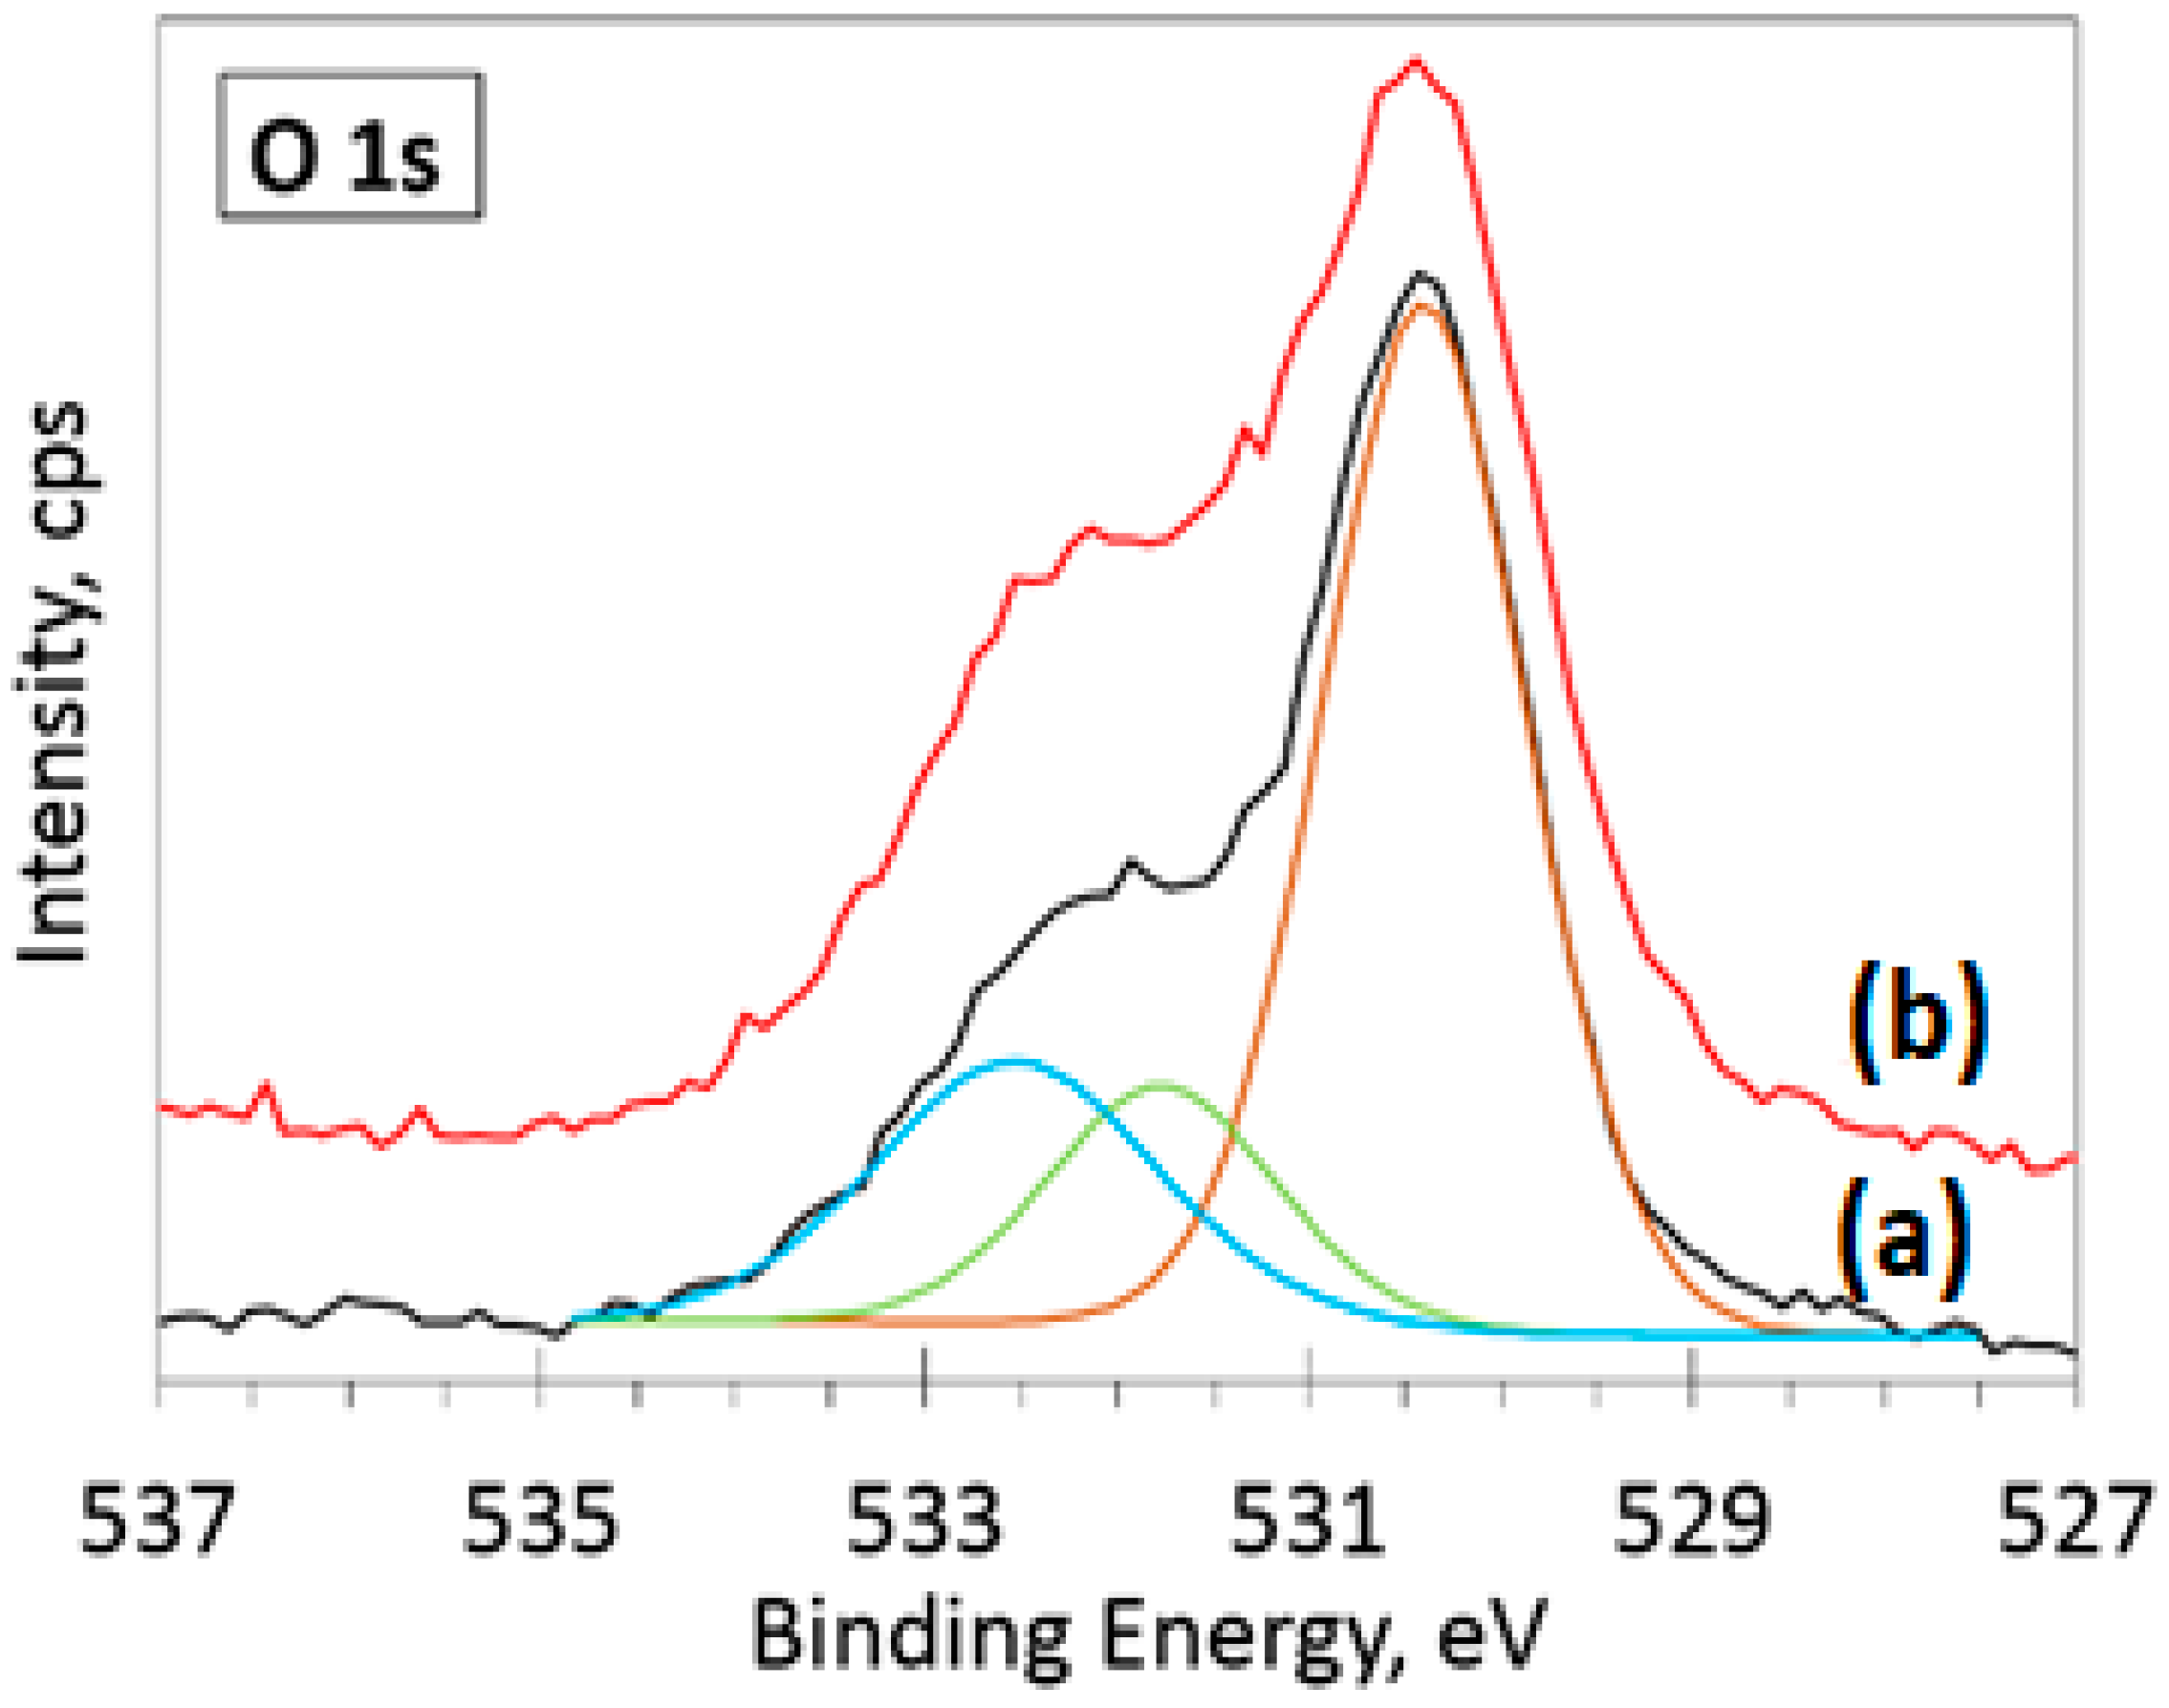
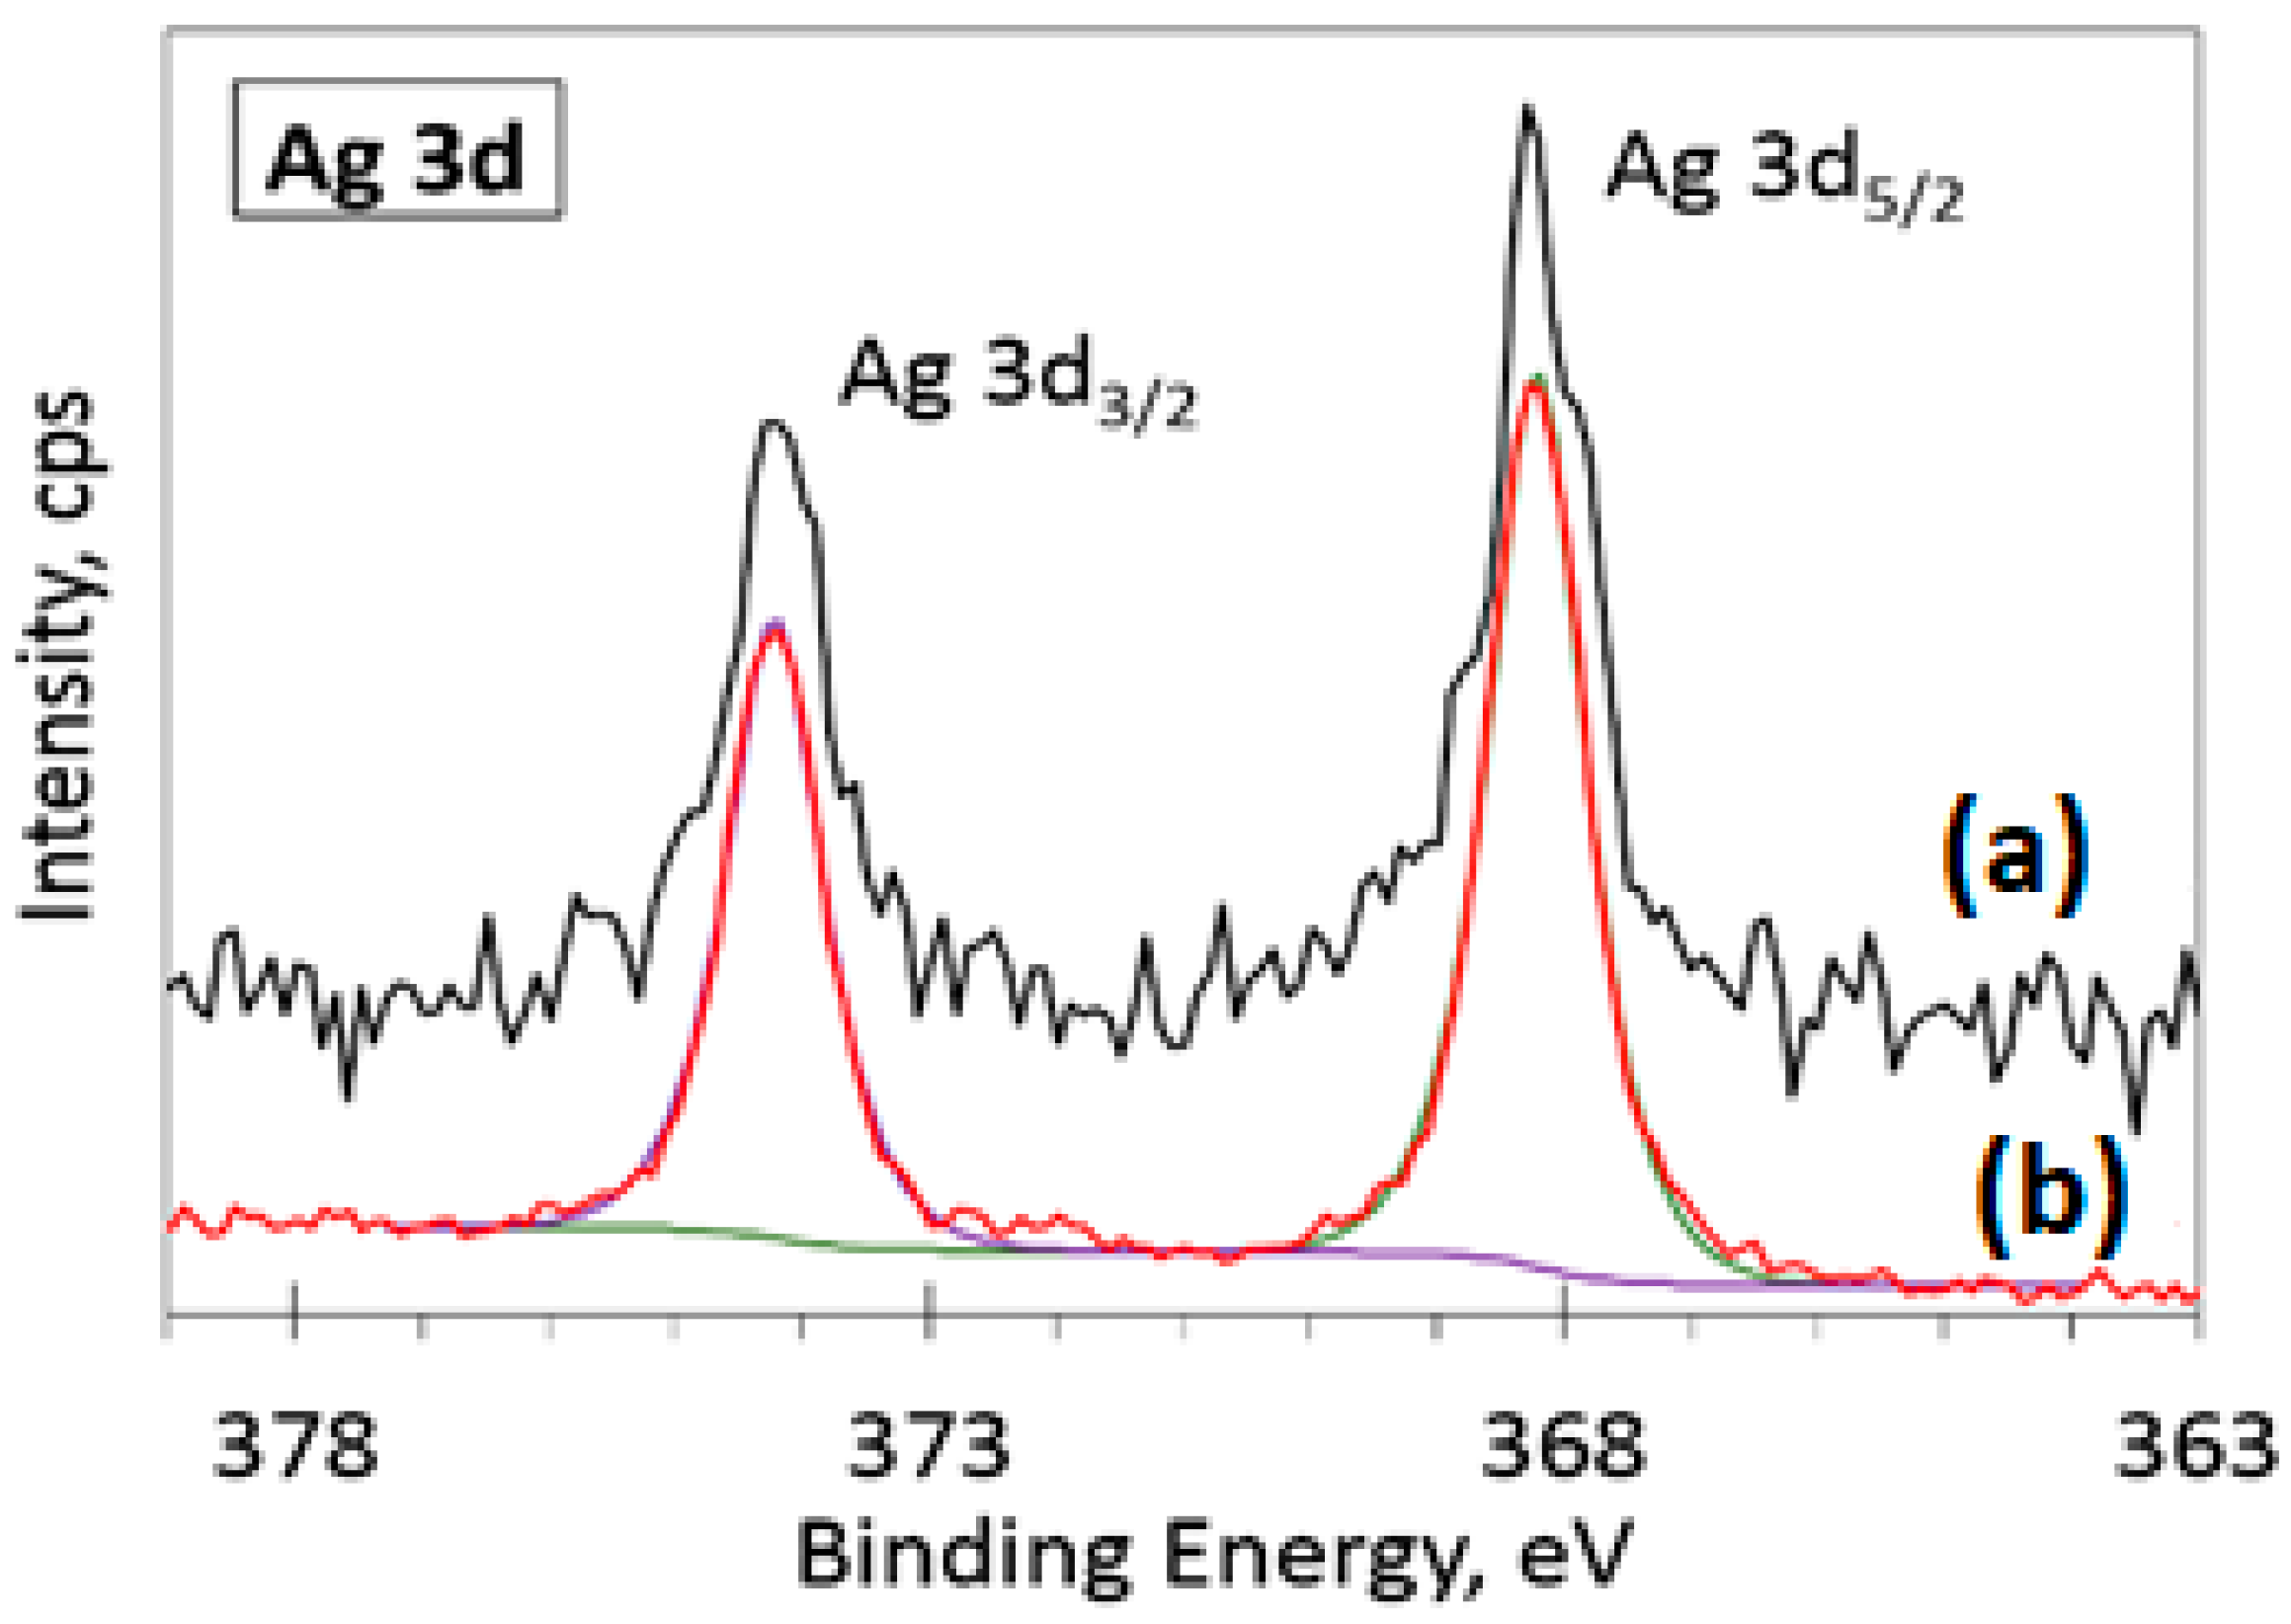
3.5. XPS
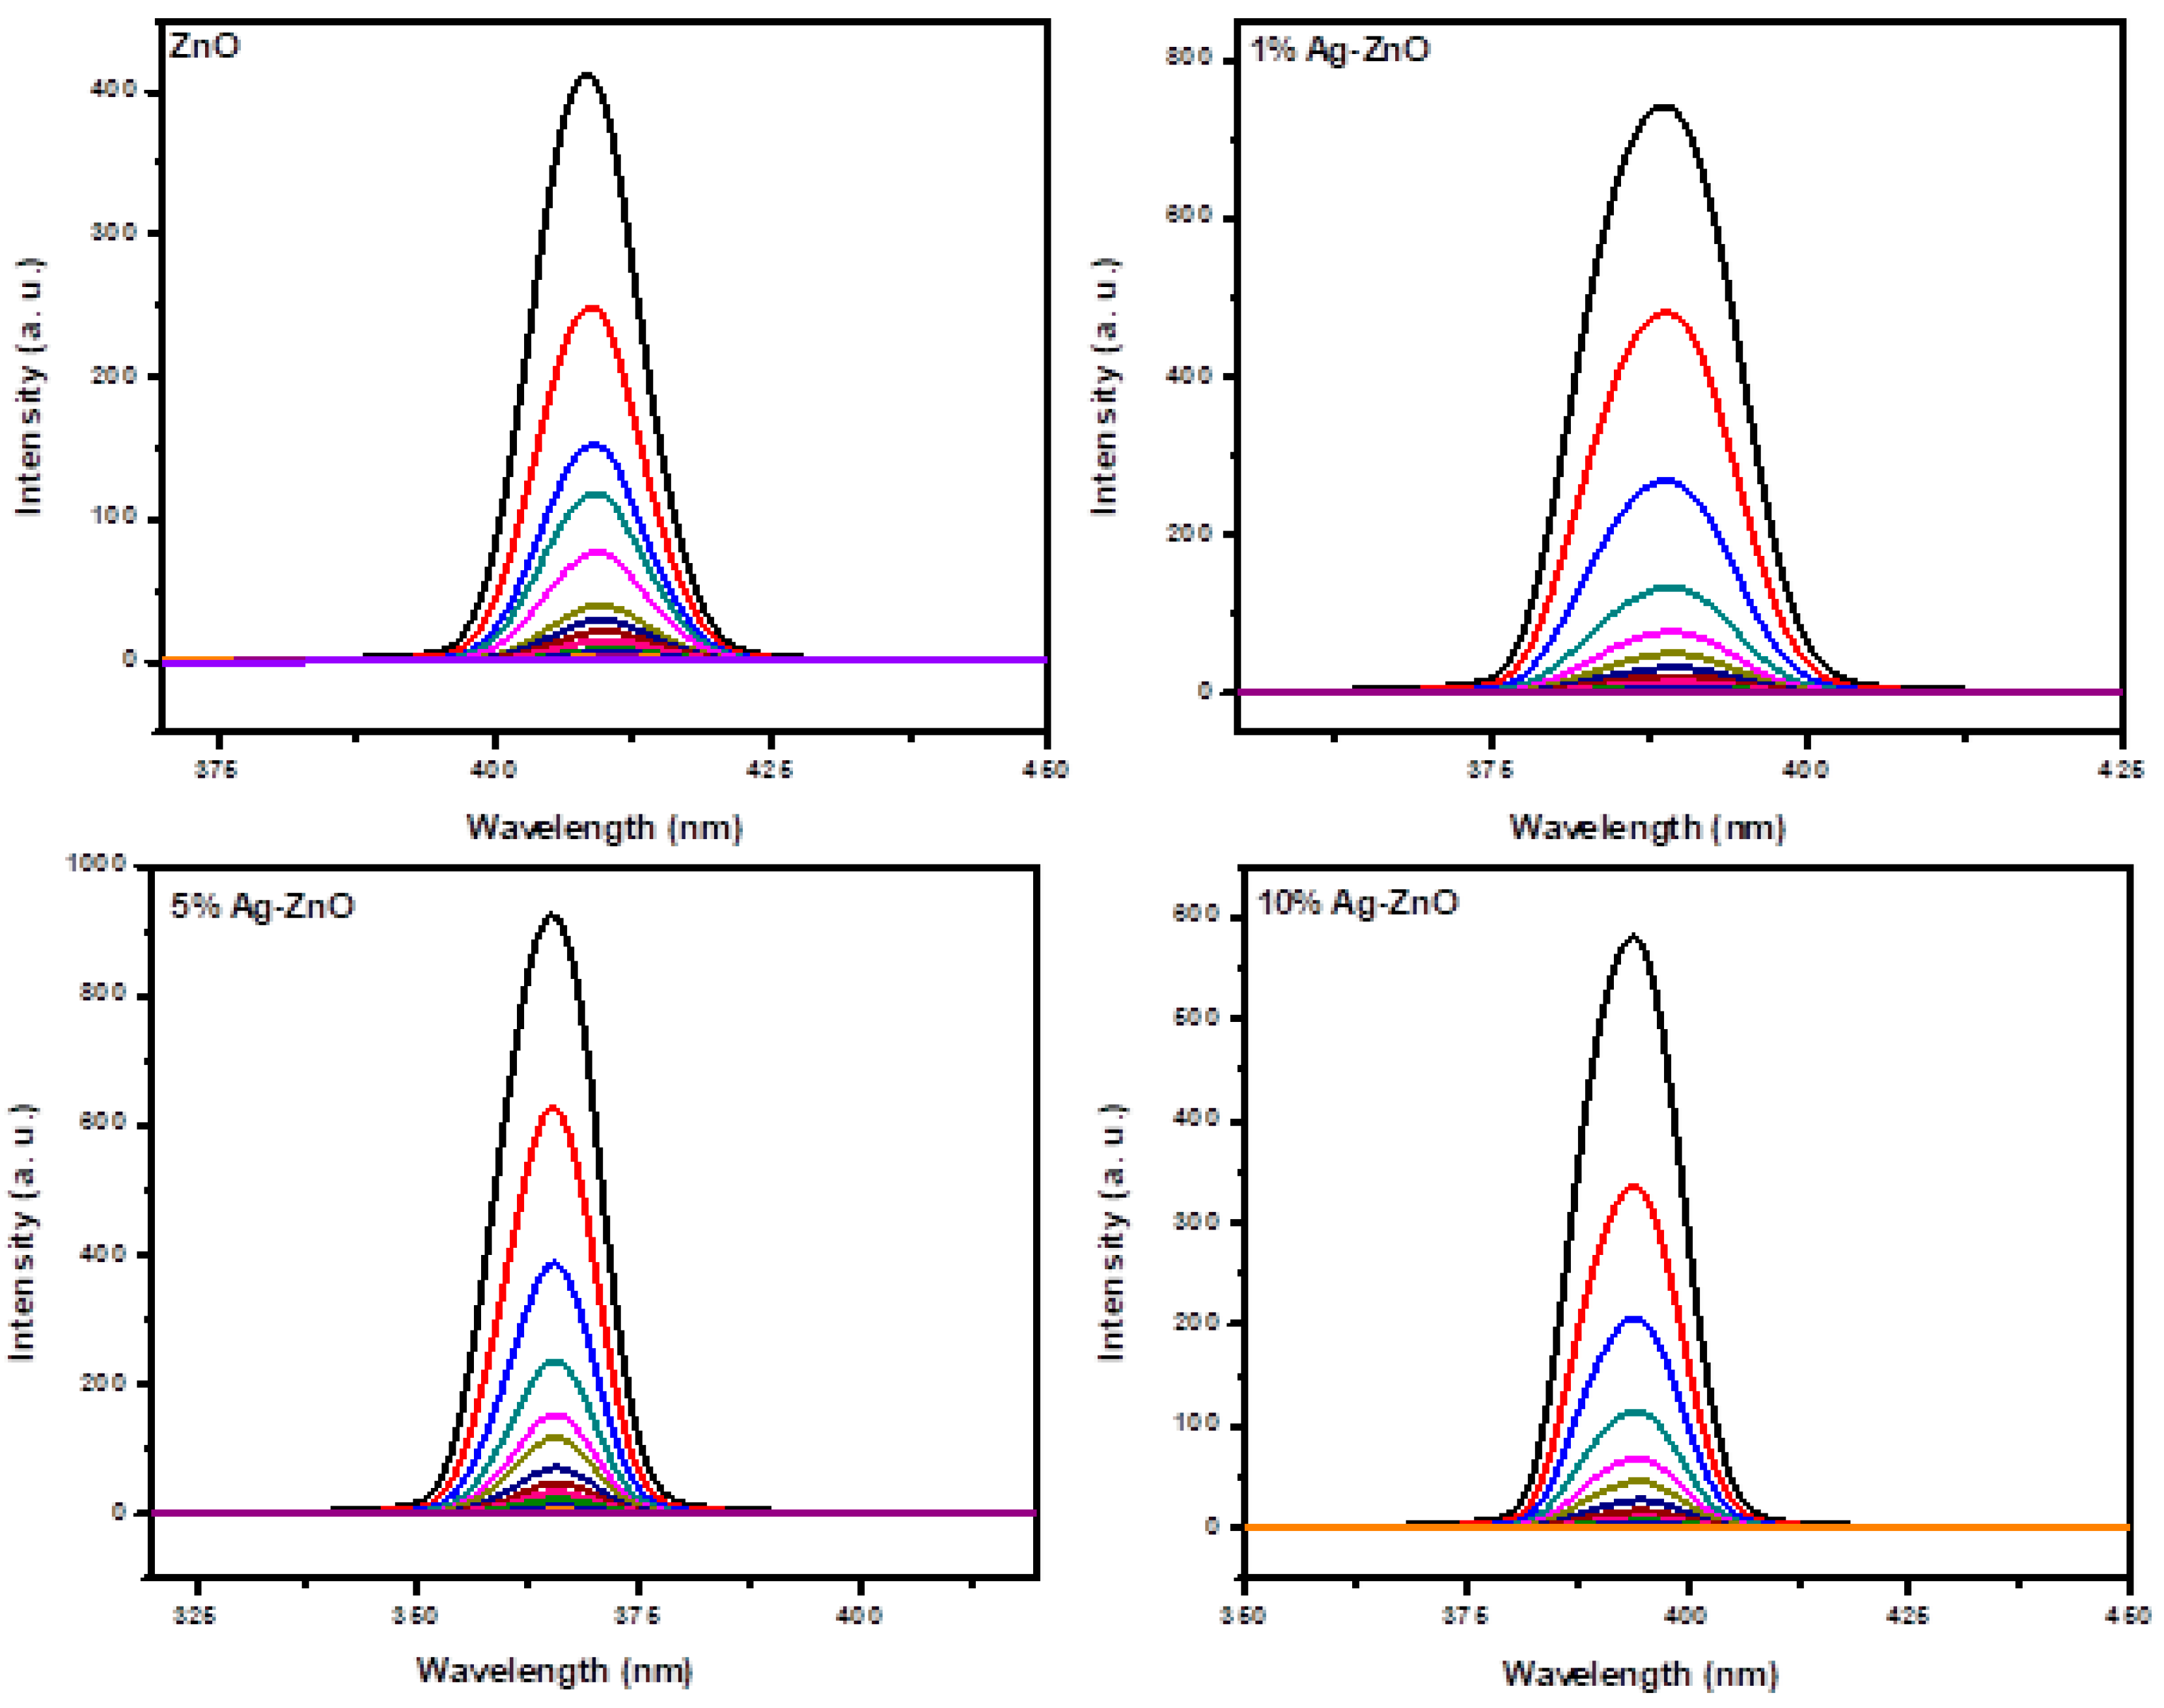
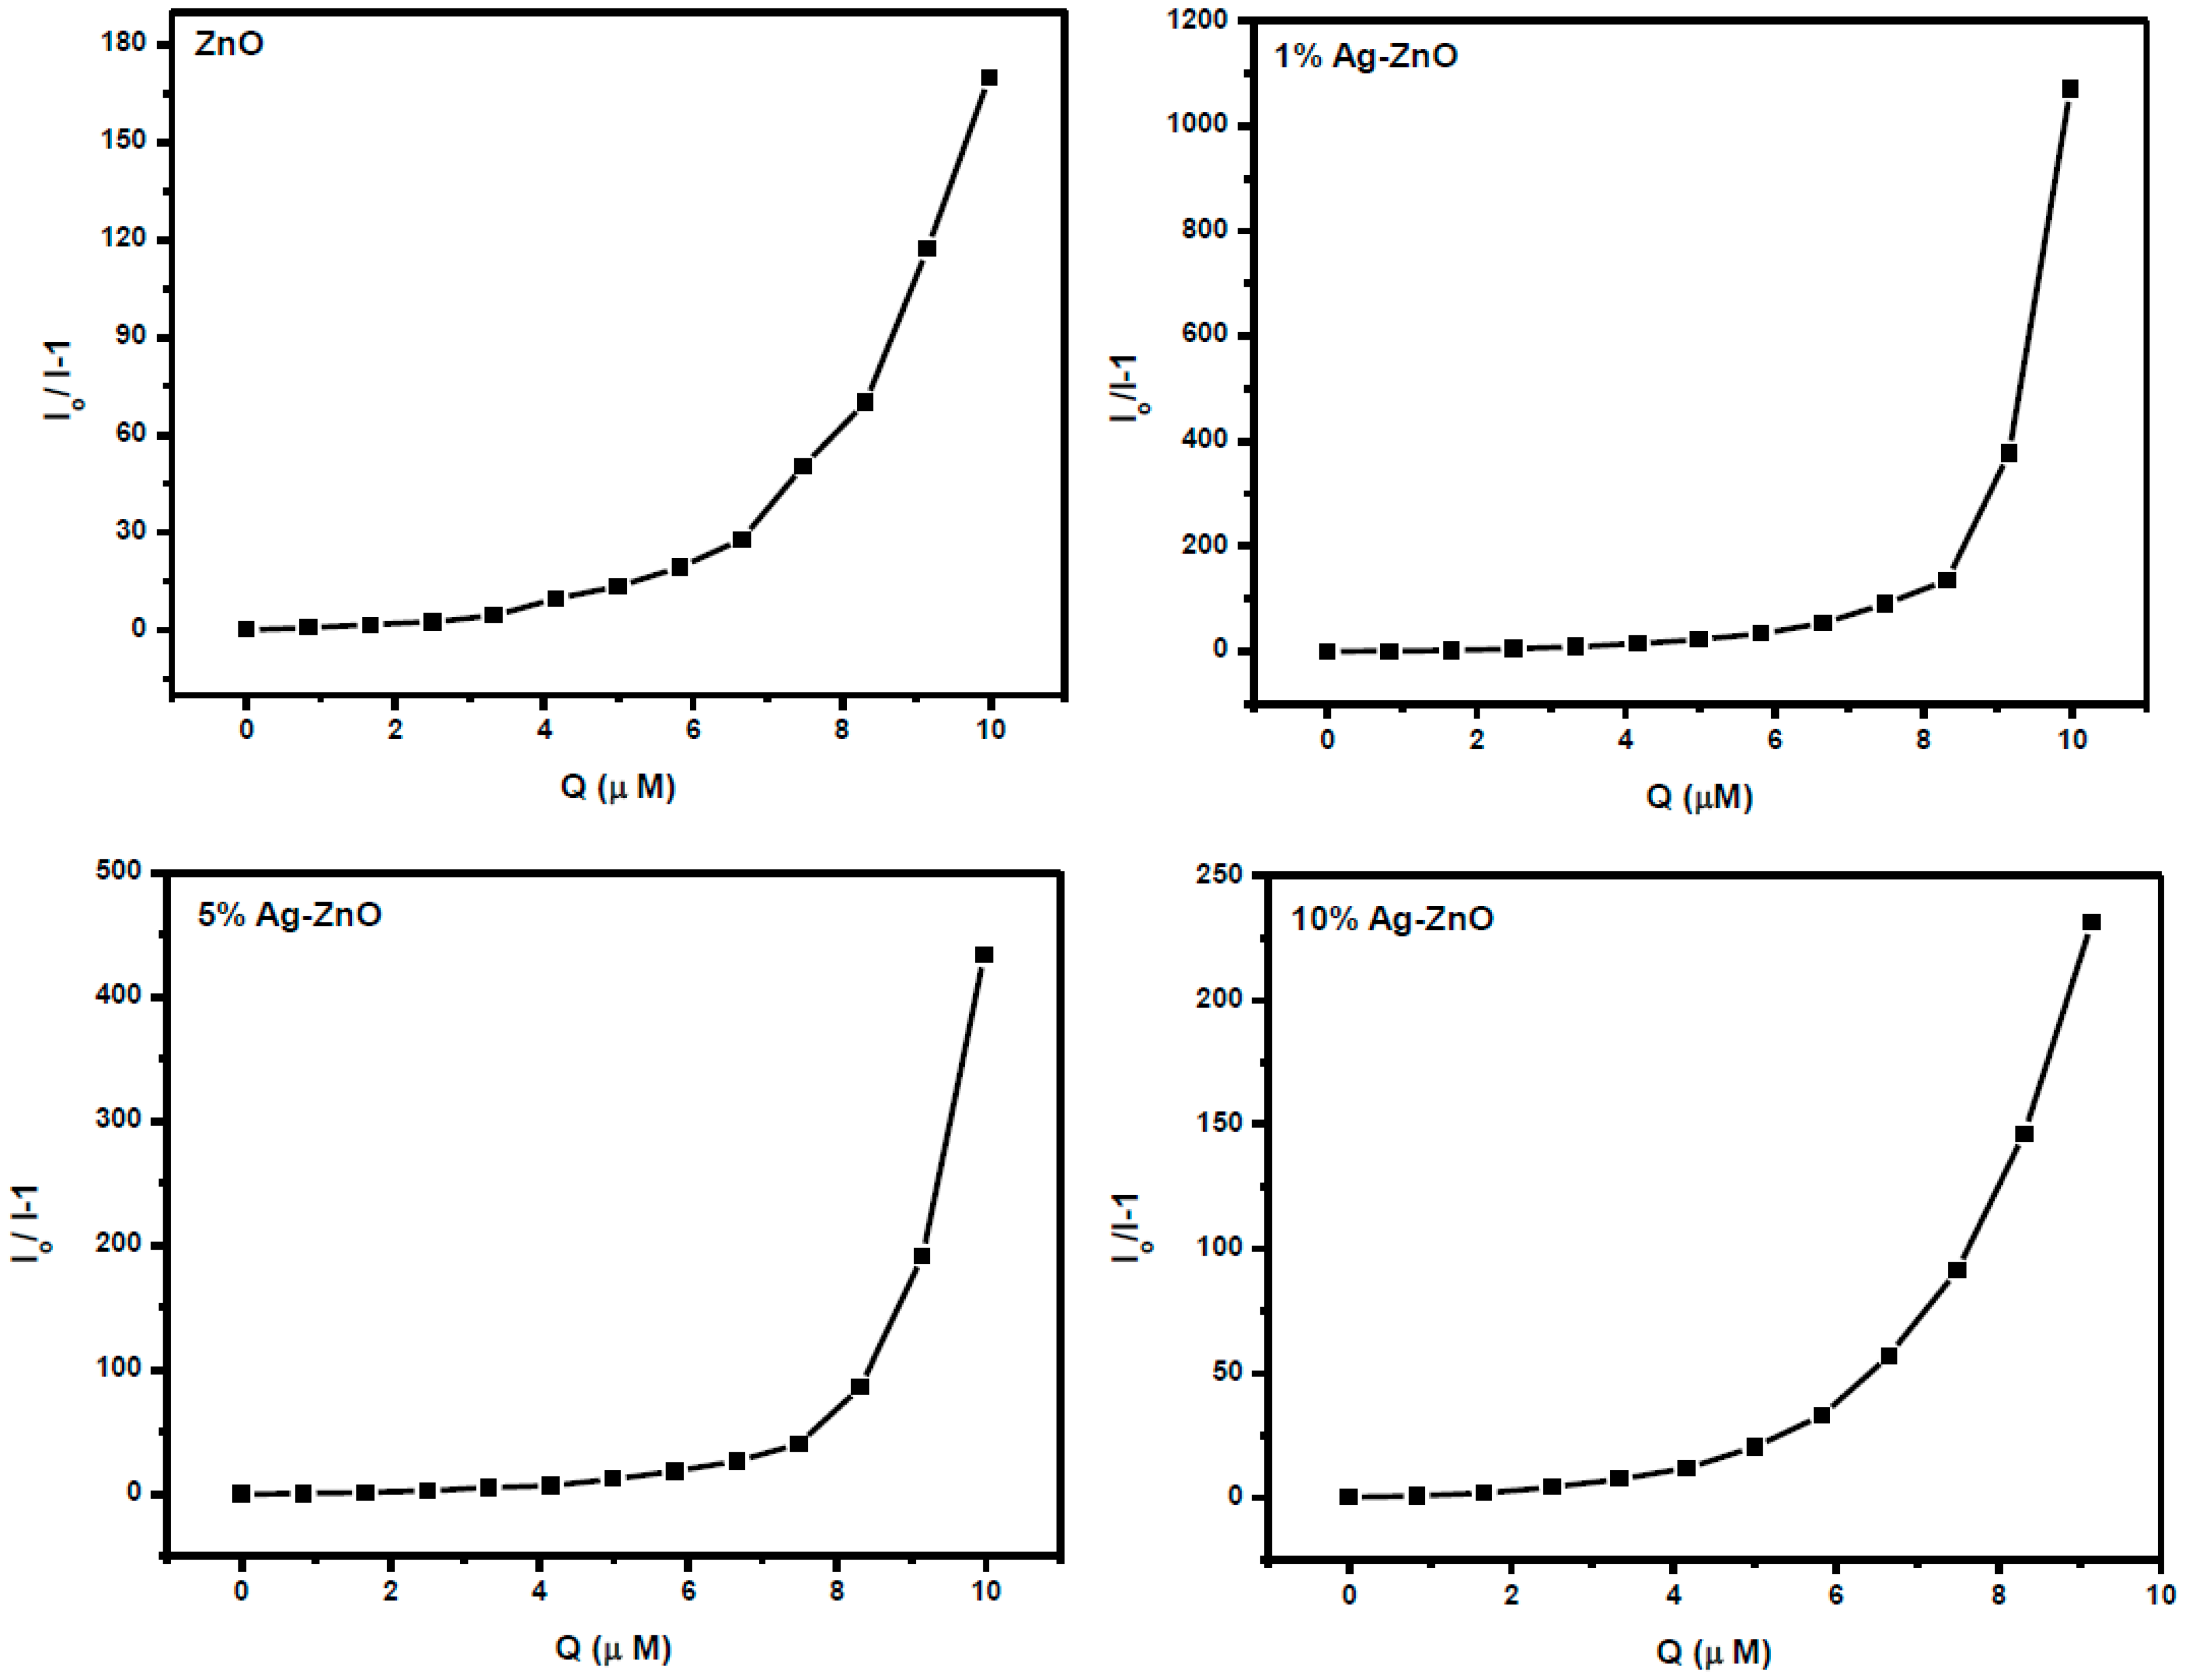
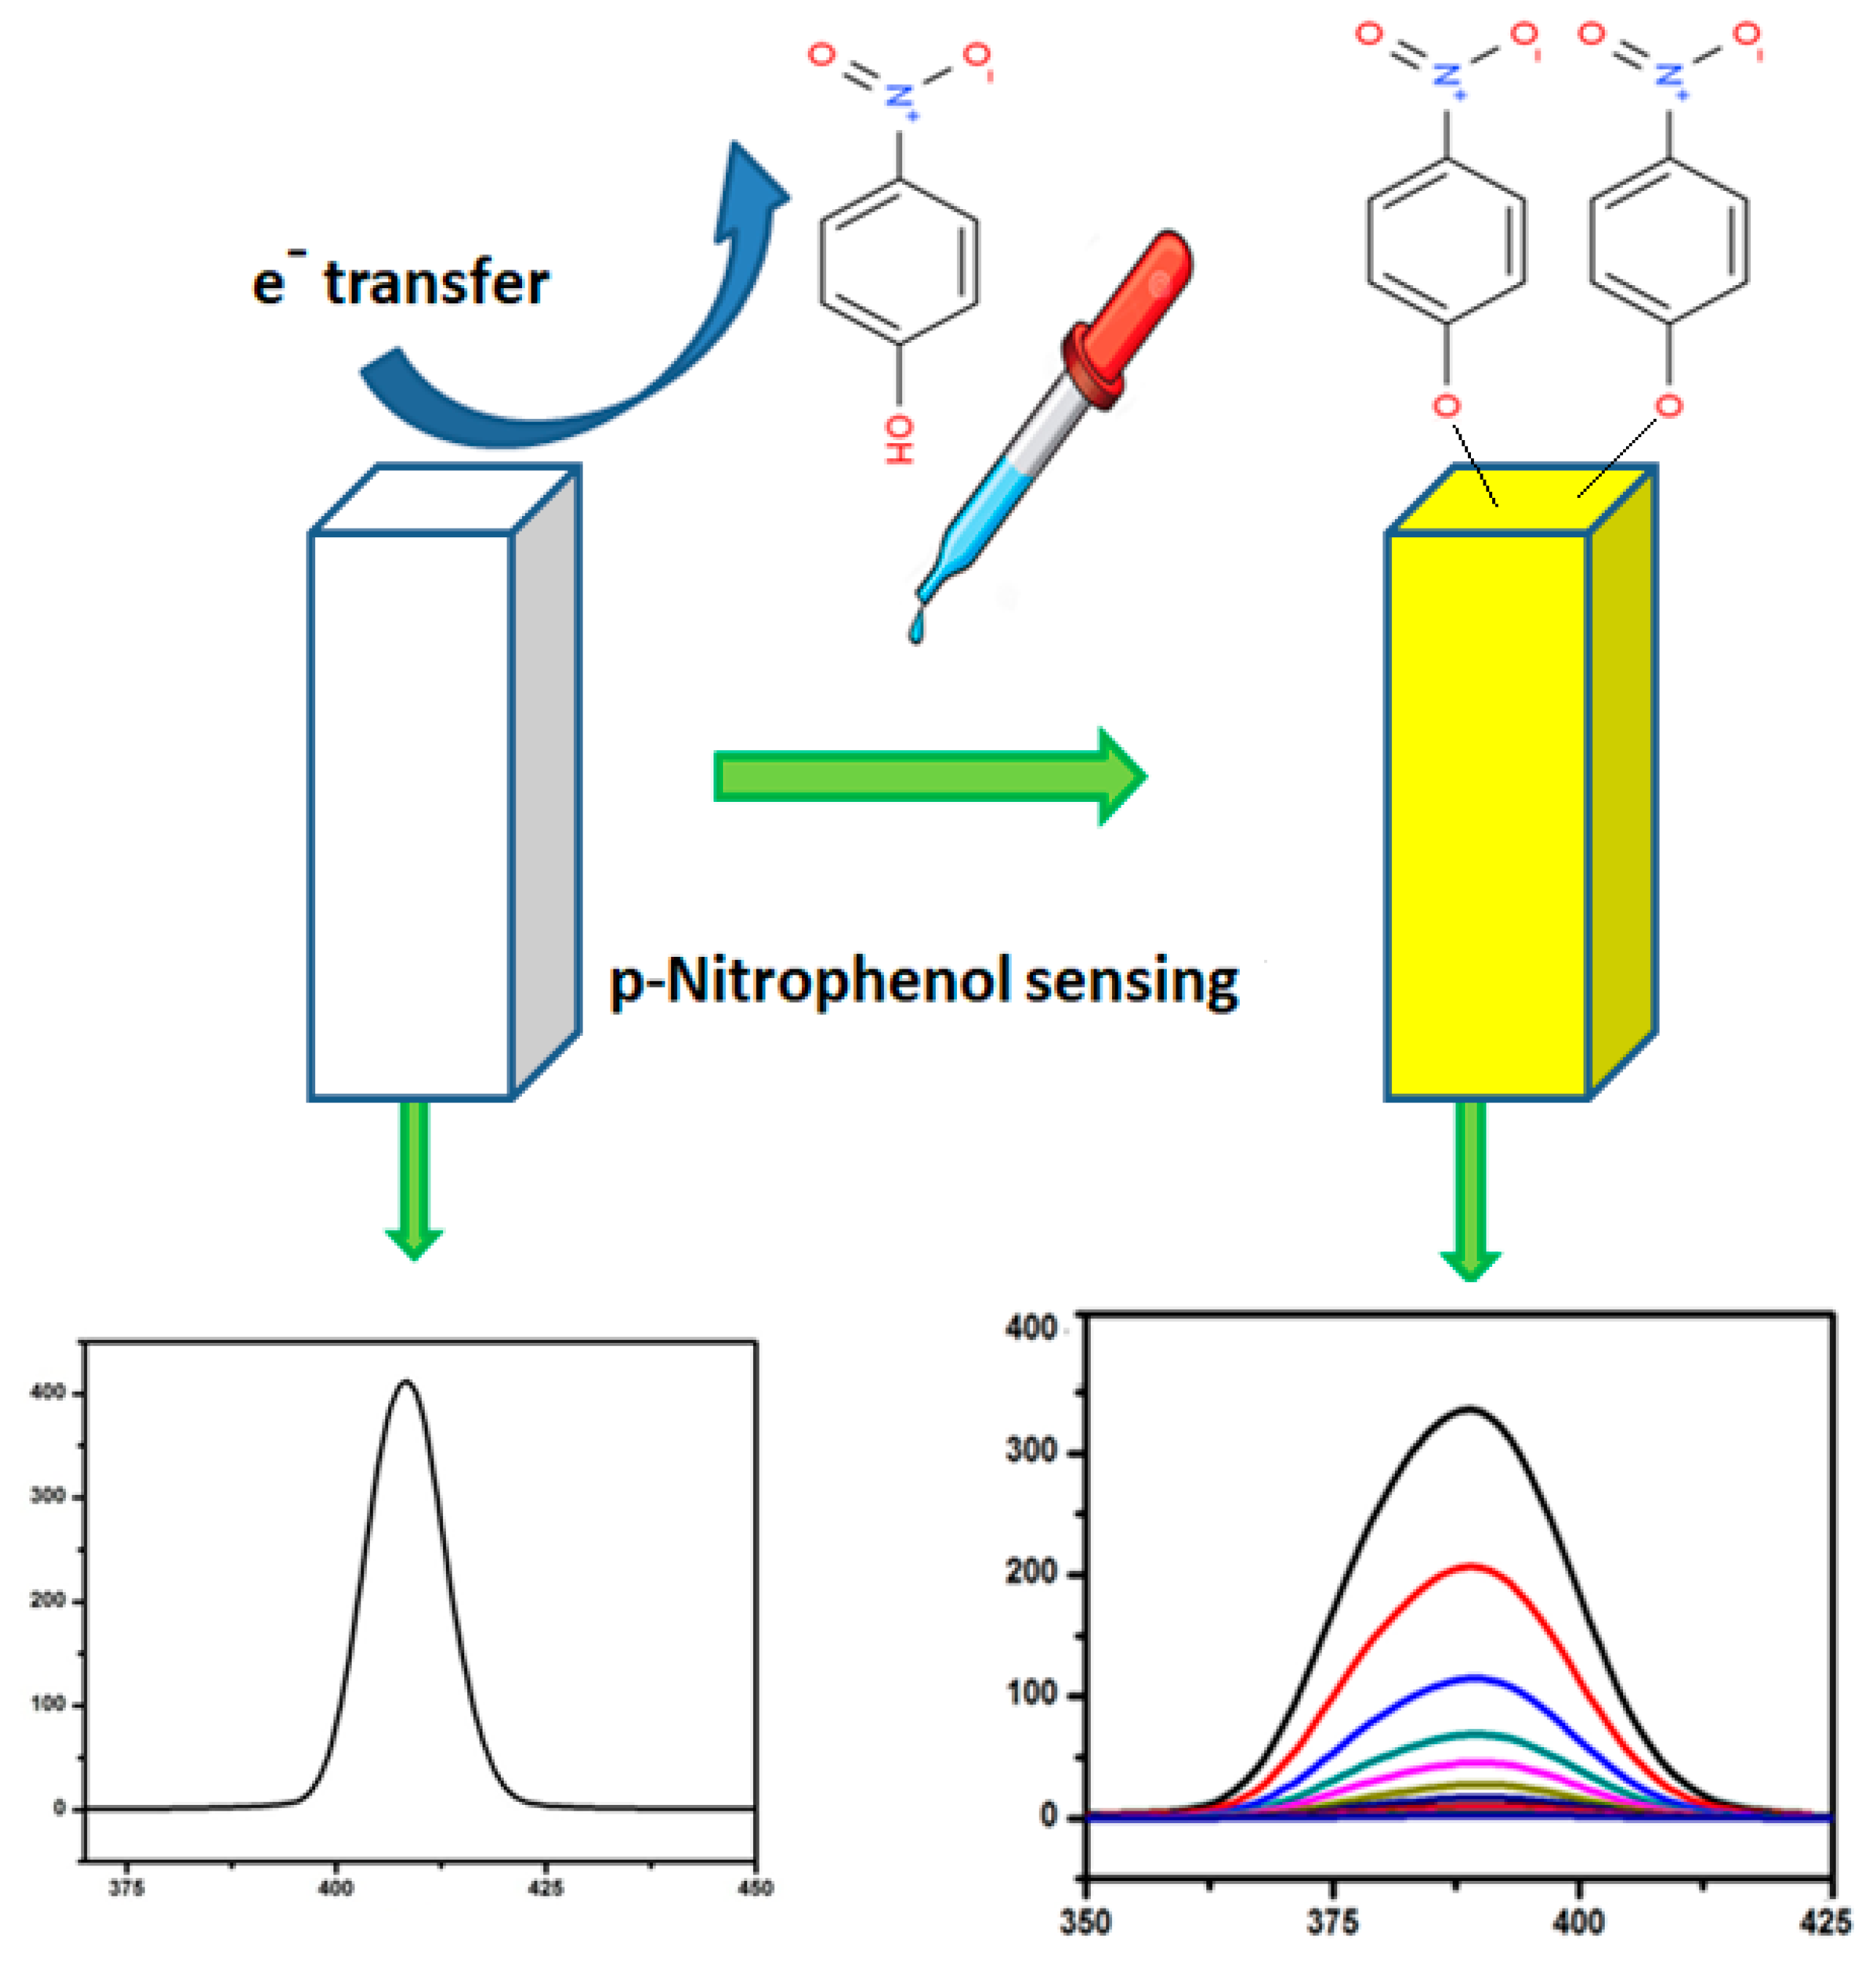
3.6. Ag-ZnO Nanoparticles as Fluorescent Sensor for p-Nitrophenol
4. Conclusions
Supplementary Materials
Author Contributions
Funding
Conflicts of Interest
References
- Li, J.; Kuang, D.; Feng, Y.; Zhang, F.; Xu, Z.; Liu, M. A graphene oxide-based electrochemical sensor for sensitive determination of 4-nitrophenol. J. Hazard. Mater. 2012, 201, 250–259. [Google Scholar] [CrossRef] [PubMed]
- Yin, H.; Zhou, Y.; Ai, S.; Liu, X.; Zhu, L.; Lu, L. Electrochemical oxidative determination of 4-nitrophenol based on a glassy carbon electrode modified with a hydroxyapatite nanopowder. Microchim. Acta 2010, 169, 87–92. [Google Scholar] [CrossRef]
- Castillo, M.; Domingues, R.; Alpendurada, M.F.; Barcelo, D. Persistence of selected pesticides and their phenolic transformation products in natural waters using off-line liquid solid extraction followed by liquid chromatographic techniques. Anal. Chim. Acta 1997, 353, 133–142. [Google Scholar] [CrossRef]
- Liu, W.-J.; Tian, K.; Jiang, H.; Yu, H.-Q. Harvest of Cu NP anchored magnetic carbon materials from Fe/Cu preloaded biomass: Their pyrolysis, characterization, and catalytic activity on aqueous reduction of 4-nitrophenol. Green Chem. 2014, 16, 4198–4205. [Google Scholar] [CrossRef]
- Mulchandani, P.; Hangarter, C.M.; Lei, Y.; Chen, W.; Mulchandani, A. Amperometric microbial biosensor for p-nitrophenol using Moraxella sp.-modified carbon paste electrode. Biosens. Bioelectron. 2005, 21, 523–527. [Google Scholar] [CrossRef] [PubMed]
- Li, S.; Du, D.; Huang, J.; Tu, H.; Yang, Y.; Zhang, A. One-step electrodeposition of a molecularly imprinting chitosan/phenyltrimethoxysilane/AuNPs hybrid film and its application in the selective determination of p-nitrophenol. Analyst 2013, 138, 2761–2768. [Google Scholar] [CrossRef]
- Rawajfih, Z.; Nsour, N. Characteristics of phenol and chlorinated phenols sorption onto surfactant-modified bentonite. J. Colloid Interface Sci. 2006, 298, 39–49. [Google Scholar] [CrossRef] [PubMed]
- Schultz, B. Determination of 4-aminophenol in water by high-performance liquid chromatography with fluorescence detection. J. Chromatogr. A 1984, 299, 484–486. [Google Scholar] [CrossRef]
- Niazi, A.; Yazdanipour, A. Spectrophotometric simultaneous determination of nitrophenol isomers by orthogonal signal correction and partial least squares. J. Hazard. Mater. 2007, 146, 421–427. [Google Scholar] [CrossRef]
- Nistor, C.; Oubiña, A.; Marco, M.-P.; Barceló, D.; Emnéus, J. Competitive flow immunoassay with fluorescence detection for determination of 4-nitrophenol. Anal. Chim. Acta 2001, 426, 185–195. [Google Scholar] [CrossRef]
- Fischer, J.; Barek, J.; Wang, J. Separation and detection of nitrophenols at capillary electrophoresis microchips with amperometric detection. Electroanal. Int. J. Devoted Fundam. Pract. Asp. Electroanal. 2006, 18, 195–199. [Google Scholar] [CrossRef]
- Kuban, P.; Berg, M.; Garcıía, C.; Karlberg, B. On-line flow sample stacking in a flow injection analysis–capillary electrophoresis system: 2000-fold enhancement of detection sensitivity for priority phenol pollutants. J. Chromatogr. A 2001, 912, 163–170. [Google Scholar] [CrossRef]
- Singh, S.; Kumar, N.; Kumar, M.; Agarwal, A.; Mizaikoff, B. Electrochemical sensing and remediation of 4-nitrophenol using bio-synthesized copper oxide nanoparticles. Chem. Eng. J. 2017, 313, 283–292. [Google Scholar] [CrossRef]
- Tang, Y.; Huang, R.; Liu, C.; Yang, S.; Lu, Z.; Luo, S. Electrochemical detection of 4-nitrophenol based on a glassy carbon electrode modified with a reduced graphene oxide/Au nanoparticle composite. Anal. Methods 2013, 5, 5508–5514. [Google Scholar] [CrossRef]
- Ghazizadeh, A.J.; Afkhami, A.; Bagheri, H. Voltammetric determination of 4-nitrophenol using a glassy carbon electrode modified with a gold-ZnO-SiO2 nanostructure. Microchim. Acta 2018, 185, 296. [Google Scholar] [CrossRef]
- Negi, K.; Kumar, M.; Chauhan, M.S. Solution combustion synthesis of CeO2/ZnO nano-composite as a potential scaffold for detection and degradation of p-nitrophenol. Mater. Chem. Phys. 2019, 226, 59–65. [Google Scholar] [CrossRef]
- Rahman, M.M.; Wahid, A.; Alam, M.M.; Asiri, A.M. Efficient 4-Nitrophenol sensor development based on facile Ag@Nd2O3 nanoparticles. Mater. Today Commun. 2018, 16, 307–313. [Google Scholar] [CrossRef]
- Singh, K.; Ibrahim, A.A.; Umar, A.; Kumar, A.; Chaudhary, G.R.; Singh, S.; Mehta, S.K. Synthesis of CeO2–ZnO nanoellipsoids as potential scaffold for the efficient detection of 4-nitrophenol. Sens. Actuators B Chem. 2014, 202, 1044–1050. [Google Scholar] [CrossRef]
- Umar, A.; Chauhan, M.S.; Chauhan, S.; Kumar, R.; Sharma, P.; Tomar, K.J.; Wahab, R.; Al-Hajry, A.D. Singh, Applications of ZnO nanoflowers as antimicrobial agents for Escherichia coli and enzyme-free glucose sensor. J. Biomed. Nanotechnol. 2013, 9, 1794–1802. [Google Scholar] [CrossRef] [PubMed]
- Fangli, Y.; Peng, H.; Chunlei, Y.; Shulan, H.; Jinlin, L. Preparation and properties of zinc oxide nanoparticles coated with zinc aluminate. J. Mater. Chem. 2003, 13, 634–637. [Google Scholar] [CrossRef]
- Wang, L.; Muhammed, M. Synthesis of zinc oxide nanoparticles with controlled morphology. J. Mater. Chem. 1999, 9, 2871–2878. [Google Scholar] [CrossRef]
- Singh, K.; Mehta, S.K. Luminescent ZnO quantum dots as an efficient sensor for free chlorine detection in water. Analyst 2016, 141, 2487–2492. [Google Scholar] [CrossRef] [PubMed]
- Singh, K.; Mehta, S.K. Utilization of ZnO Nanoflowers as Efficient Electrochemical Catalyst for the Oxidation of Hydrazine. Sens. Lett. 2015, 13, 1002–1006. [Google Scholar] [CrossRef]
- Kumar, R.; Umar, A.; Rana, D.S.; Sharma, P.; Chauhan, M.S.; Chauhan, S. Fe-doped ZnO nanoellipsoids for enhanced photocatalytic and highly sensitive and selective picric acid sensor. Mater. Res. Bull. 2018, 102, 282–288. [Google Scholar] [CrossRef]
- Kumar, R.; Rana, D.; Umar, A.; Sharma, P.; Chauhan, S.; Chauhan, M.S. Ag-doped ZnO nanoellipsoids: Potential scaffold for photocatalytic and sensing applications. Talanta 2015, 137, 204–213. [Google Scholar] [CrossRef]
- Ahmed, S.A. Structural, optical, and magnetic properties of Mn-doped ZnO samples. Results Phys. 2017, 7, 604–610. [Google Scholar] [CrossRef]
- Lupan, O.; Chow, L.; Ono, L.K.; Cuenya, B.R.; Chai, G.; Khallaf, H.; Park, S.; Schulte, A. Synthesis and characterization of Ag-or Sb-doped ZnO nanorods by a facile hydrothermal route. J. Phys. Chem. C 2010, 114, 12401–12408. [Google Scholar] [CrossRef]
- Macias-Montero, M.; Borras, A.; Saghi, Z.; Romero-Gomez, P.; Sanchez-Valencia, J.R.; Gonzalez, J.C.; Barranco, A.; Midgley, P.; Cotrino, J.; Gonzalez-Elipe, A.R. Superhydrophobic supported Ag-NPs@ZnO-nanorods with photoactivity in the visible range. J. Mater. Chem. 2012, 22, 1341–1346. [Google Scholar] [CrossRef]
- Liu, H.R.; Shao, G.X.; Zhao, J.F.; Zhang, Z.X.; Zhang, Y.; Liang, J.; Liu, X.G.; Jia, H.S.; Xu, B.S. Worm-like Ag/ZnO core–shell heterostructural composites: Fabrication, characterization, and photocatalysis. J. Phys. Chem. C 2012, 116, 16182–16190. [Google Scholar] [CrossRef]
- Sangpour, P.; Hashemi, F.; Moshfegh, A.Z. Photoenhanced degradation of methylene blue on cosputtered M: TiO2 (M= Au, Ag, Cu) nanocomposite systems: A comparative study. J. Phys. Chem. C 2010, 114, 13955–13961. [Google Scholar] [CrossRef]
- Tarwal, N.L.; Patil, P.S. Enhanced photoelectrochemical performance of Ag–ZnO thin films synthesized by spray pyrolysis technique. Electrochim. Acta 2011, 56, 6510–6516. [Google Scholar] [CrossRef]
- Ahmad, K.S.; Jaffri, S.B. Phytosynthetic Ag doped ZnO nanoparticles: Semiconducting green remediators. Open Chem. 2018, 16, 556–570. [Google Scholar] [CrossRef]
- Kumar, R.; Rana, D.; Umar, A.; Sharma, P.; Chauhan, S.; Chauhan, M.S. Iron-doped ZnO nanoparticles as potential scaffold for hydrazine chemical sensor. Sens. Lett. 2014, 12, 1273–1278. [Google Scholar] [CrossRef]
- Wöll, C. The chemistry and physics of zinc oxide surfaces. Prog. Surf. Sci. 2007, 82, 55–120. [Google Scholar] [CrossRef]
- Kunat, M.; Becker, T.; Burghaus, U.; Wöll, C. Stability of the polar surfaces of ZnO: A reinvestigation using He-atom scattering. Phys. Rev. B 2002, 66, 081402. [Google Scholar] [CrossRef]
- Alenezi, M.R.; Alshammari, A.S.; Jayawardena, K.I.; Beliatis, M.J.; Henley, S.J.; Silva, S.R.P. Role of the exposed polar facets in the performance of thermally and UV activated ZnO nanostructured gas sensors. J. Phys. Chem. C 2013, 117, 17850–17858. [Google Scholar] [CrossRef]
- Hanagodimath, S.M.; Evale, B.G.; Manohara, S.R. Nonlinear fluorescence quenching of newly synthesized coumarin derivative by aniline in binary mixtures. Spectrochim. Acta A Mol. Biomol. Spectrosc. 2009, 74, 943–948. [Google Scholar] [CrossRef]
- Marinoiu, A.; Raceanu, M.; Andrulevicius, M.; Tamuleviciene, A.; Tamulevicius, T.; Nica, S.; Bala, D.; Varlam, M. Low-cost preparation method of well dispersed gold nanoparticles on reduced graphene oxide and electrocatalytic stability in PEM fuel cell. Arab. J. Chem. 2020, 13, 3585–3600. [Google Scholar] [CrossRef]
- Ratautas, K.; Andrulevičius, M.; Jagminienė, A.; Stankevičienė, I.; Norkus, E.; Račiukaitis, G. Laser-assisted selective copper deposition on commercial PA6 by catalytic electroless plating–Process and activation mechanism. Appl. Surf. Sci. 2019, 470, 405–410. [Google Scholar] [CrossRef]
- Sharma, P.; Rana, D.S.; Umar, A.; Kumar, R.; Chauhan, M.S.; Chauhan, S. Synthesis of cadmium sulfide nanosheets for smart photocatalytic and sensing applications. Ceram. Int. 2016, 42, 6601–6609. [Google Scholar] [CrossRef]
- Sharma, P.; Rana, D.S.; Umar, A.; Kumar, R.; Chauhan, M.S.; Chauhan, S. Hexagonal cadmium oxide nanodisks: Efficient scaffold for cyanide ion sensing and photo-catalytic applications. Talanta 2016, 153, 57–65. [Google Scholar] [CrossRef]
- Othman, A.; Hayat, A.; Andreescu, S. Eu-Doped Ceria Nanocrystals as Nanoenzyme Fluorescent Probes for Biosensing. ACS Appl. Nano Mater. 2018, 1, 5722–5735. [Google Scholar] [CrossRef]
- Chu, L.; Han, L.; Zhang, X. Electrochemical simultaneous determination of nitrophenol isomers at nano-gold modified glassy carbon electrode. J. Appl. Electrochem. 2011, 41, 687–694. [Google Scholar] [CrossRef]
- Ahmad, N.; Alam, M.; Wahab, R.; Ahmad, J.; Ubaidullah, M.; Ansari, A.A.; Alotaibi, N.M. Synthesis of NiO–CeO2 nanocomposite for electrochemical sensing of perilous 4-nitrophenol. J. Mater. Sci. Mater. Electron. 2019, 30, 17643–17653. [Google Scholar] [CrossRef]
- Arvinte, A.; Mahosenaho, M.; Pinteala, M.; Sesay, A.-M.; Virtanen, V. Electrochemical oxidation of p-nitrophenol using graphene-modified electrodes, and a comparison to the performance of MWNT-based electrodes. Microchim. Acta 2011, 174, 337–343. [Google Scholar] [CrossRef]
- Kumar, V.; Singh, K.; Panwar, S.; Mehta, S.K. Green synthesis of manganese oxide nanoparticles for the electrochemical sensing of p-nitrophenol. Int. Nano Lett. 2017, 7, 123–131. [Google Scholar] [CrossRef]


| Element | Atomic Concentrations (%) | |||
|---|---|---|---|---|
| ZnO | 1% Ag-ZnO | 5% Ag-ZnO | 10% Ag-ZnO | |
| Zn 2p | 17.06 | 13.7 | 23.7 | 12.56 |
| O 1s | 28.09 | 26.35 | 31.01 | 26.04 |
| C 1s | 54.85 | 59.62 | 43.49 | 59.35 |
| Ag 3d | 0 | 0.33 | 1.8 | 2.05 |
| Material | LOD (μM) | Technique | Ref. |
|---|---|---|---|
| CeO2/ZnO | 3.05 | Photoluminescence | [16] |
| Nano gold/glassy carbon electrode | 8.0 | Amperometric | [43] |
| NiO/CeO2 nanocomposite | 2.48 | Amperometric | [44] |
| GO/screen printed electrode | 0.9918 | Amperometric | [45] |
| Manganese oxide nanoparticles | 15.65 | Amperometric | [46] |
| Zinc oxide | 2.17 | Luminescence | Present Work |
| 1% Ag-ZnO | 1.60 | Luminescence | Present Work |
| 5% Ag-ZnO | 1.18 | Luminescence | Present Work |
| 10% Ag-ZnO | 0.66 | Luminescence | Present Work |
Publisher’s Note: MDPI stays neutral with regard to jurisdictional claims in published maps and institutional affiliations. |
© 2020 by the authors. Licensee MDPI, Basel, Switzerland. This article is an open access article distributed under the terms and conditions of the Creative Commons Attribution (CC BY) license (http://creativecommons.org/licenses/by/4.0/).
Share and Cite
Thakur, D.; Sharma, A.; Rana, D.S.; Thakur, N.; Singh, D.; Tamulevicius, T.; Andrulevicius, M.; Tamulevicius, S.; Shukla, S.K.; Thakur, S. Facile Synthesis of Silver-Doped Zinc Oxide Nanostructures as Efficient Scaffolds for Detection of p-Nitrophenol. Chemosensors 2020, 8, 108. https://doi.org/10.3390/chemosensors8040108
Thakur D, Sharma A, Rana DS, Thakur N, Singh D, Tamulevicius T, Andrulevicius M, Tamulevicius S, Shukla SK, Thakur S. Facile Synthesis of Silver-Doped Zinc Oxide Nanostructures as Efficient Scaffolds for Detection of p-Nitrophenol. Chemosensors. 2020; 8(4):108. https://doi.org/10.3390/chemosensors8040108
Chicago/Turabian StyleThakur, Deepika, Anshu Sharma, Dharmender Singh Rana, Nagesh Thakur, Dilbag Singh, Tomas Tamulevicius, Mindaugas Andrulevicius, Sigitas Tamulevicius, Sudheesh K. Shukla, and Sourbh Thakur. 2020. "Facile Synthesis of Silver-Doped Zinc Oxide Nanostructures as Efficient Scaffolds for Detection of p-Nitrophenol" Chemosensors 8, no. 4: 108. https://doi.org/10.3390/chemosensors8040108
APA StyleThakur, D., Sharma, A., Rana, D. S., Thakur, N., Singh, D., Tamulevicius, T., Andrulevicius, M., Tamulevicius, S., Shukla, S. K., & Thakur, S. (2020). Facile Synthesis of Silver-Doped Zinc Oxide Nanostructures as Efficient Scaffolds for Detection of p-Nitrophenol. Chemosensors, 8(4), 108. https://doi.org/10.3390/chemosensors8040108