Abstract
An electronic tongue (e-tongue) is a multisensory system usually applied to complex liquid media that uses computational/statistical tools to group information generated by sensing units into recognition patterns, which allow the identification/distinction of samples. Different types of e-tongues have been previously reported, including microfluidic devices. In this context, the integration of passive mixers inside microchannels is of great interest for the study of suppression/enhancement of sensorial/chemical effects in the pharmaceutical, food, and beverage industries. In this study, we present developments using a stereolithography technique to fabricate microfluidic devices using 3D-printed molds for elastomers exploring the staggered herringbone passive mixer geometry. The fabricated devices (microchannels plus mixer) are then integrated into an e-tongue system composed of four sensing units assembled on a single printed circuit board (PCB). Gold-plated electrodes are designed as an integral part of the PCB electronic circuitry for a highly automated platform by enabling faster analysis and increasing the potential for future use in commercial applications. Following previous work, the e-tongue sensing units are built functionalizing gold electrodes with layer-by-layer (LbL) films. Our results show that the system is capable of (i) covering basic tastes below the human gustative perception and (ii) distinguishing different suppression effects coming from the mixture of both strong and weak electrolytes. This setup allows for triplicate measurements in 12 electrodes, which represents four complete sensing units, by automatically switching all electrodes without any physical interaction with the sensor. The result is a fast and reliable data acquisition system, which comprises a suitable solution for monitoring, sequential measurements, and database formation, being less susceptible to human errors.
1. Introduction
An electronic tongue (e-tongue) is a multisensorial system usually applied to liquid samples that uses computational/statistical tools to transform raw data into recognition patterns [1,2]. Different types of e-tongues have been reported in the literature [3] for numerous applications [4,5,6,7]. E-tongues have also been integrated into microfluidic devices [8,9,10,11,12], which offer many advantages including the use of continuous flow for faster analysis, reliable purge cycles with pure water, reduction in size, and volumes for sampling and discharge, which, in turn, reduces waste and cost in the analysis. A challenge in using such microfluidic devices is that mixing is not always effective due to laminar flow conditions, which can adversely affect the study of sensorial/gustative effects.
Due to the small length scales, usually in the tens or hundreds of micrometers, the flow of liquids in microfluidic devices is governed by low Reynolds number hydrodynamics [13]. Under such conditions, the mixing of fluids can be challenging since linear viscous forces dominate over nonlinear forces [13,14]. To overcome this challenge, researchers have explored different types of novel methods [15], but the main idea is the same: induce Lagrangian chaos to achieve effective mixing. Then, the different types of mixers or strategies can be broadly classified into two categories, which include active and passive mixers. Active mixers such as the use of magnetic parts or externally actuators have proven to be effective, but fabrication and implementation of such mixers can be complicated since they often rely on movable parts and require an external power source [14,16]. Passive mixers, on the other hand, work by manipulating the flow streamlines by altering the structure of configuration of the microchannels [17]. Once fabricated, passive mixers rely on flow conditions (e.g., flow rates) as the primary control parameter for mixing [14,18]. Passive mixers are usually designed by altering the channel dimension or placing ridges/grooves on the floor of the microchannel [17]. In this way, a staggered herringbone mixer (SHM) [19,20] is a simplified form of patterned grooves that allows for the enhancement in fluid mixing in microchannels. The concept is analogous to the use of static mixers in larger pipes. Through conventional microfabrication methods, the SHM structure requires two photolithography steps [19], which adds to the fabrication complexity.
One way to circumvent some of the complexities in microfluidic fabrication is to use 3D printing, which is an emergent, fast additive manufacturing technology that has been applied lately to develop microfluidic devices with passive mixers. For example, Knowlton et al. used an Objet 30 Prime polyjet machine to fabricate 3D-printed channels with SHM and evaluated the mixing enhancement when compared to simple diffusion in a chamber [21]. The microchannels were built without one of the walls to allow residual cleaning and removal of the supports. The open face was bonded to a glass slide using polydimethylsiloxane (PDMS) as the adhesion layer. Recently, Wiese et al. fabricated an SHM device using an Objet EDEN printer to study fluid dynamics by 3D flow magnetic resonance imaging [22]. The channel, which featured a 2-mm width and 500-µm groove height, was printed with an open face and sealed with an O-ring onto a glass slide. Goh et al. fabricated molds for PDMS channels with SHM using a fused deposition modeling (FDM) 3D printer [23]. They printed the SHM using polyvinyl alcohol (PVA) water-soluble filament that produced stable 3D-printed structures for elastomer molding. After curing, the PVA mold was removed in water, which revealed the channel profile in PDMS. The water-soluble sacrificial mold featured a 1.2-mm channel width, a 600-µm channel height, and a 200-µm groove height. The above examples show that there are advantages (as well as challenges) of using 3D printing techniques to fabricate the SHM.
The field of sensing analysis has also benefited from the advances in additive manufacturing. For example, the 3D-printed microchannel is fabricated for electrochemical investigation [24], in which the devices are made with a threaded port over the microchannel and allows the integration of electrodes in sensors after the printing process. More recently, researchers used poly(lactic acid) (PLA) filament doped with carbon nanotubes to print electrodes, and an acrylonitrile butadiene styrene (ABS) filament to fabricate microchannels via FDM printing [25]. In the same year, an e-tongue setup used 3D-printed channels fabricated by FDM [26]. The bottom part of this device was fabricated first, with the printing process paused to integrate microelectrodes previously fabricated by photolithography onto transparency sheets. Despite these recent advances, none of the 3D-printed microchannels applied in sensors have included microfluidic mixers or automated switching between electrodes.
In this scenario, we present sensor developments comprising 3D printing, microfluidics, passive mixers, and automated data acquisition in an e-tongue setup. We use stereolithography (SLA) to fabricate 3D-printed SHM geometries for elastomer molding that is further integrated into a printed circuit board (PCB) with electrodes embodied into a single PCB as part of the circuit. The idea is to integrate passive mixers in a microfluidic e-tongue setup, which allows automated electrode switching commanded by software. As a proof of concept, the automated microfluidic e-tongue is tested in basic tastes relevant to human gustative perception (sweetness, saltiness, sourness, bitterness, and umami) at 1 mM. The human threshold for sweetness and saltiness is at 10 mM, and the device can distinguish suppression effects at low molar concentrations from mixing strong, weak, and non-electrolytes inside the microchannels without evidence of cross-contamination.
2. Experimental Development
2.1. 3D-Printed Molds for Microchannel Fabrication
The SHM geometry consists mainly of grooves in the form of asymmetric herringbones inside a microchannel. More information about the mixer can be found in References [19,20]. Groove shapes varying upon the axial position in the channel will generate a chaotic flow from the repeated sequence of rotational and extensional local flows [19,20]. In the SHM design, one mixing cycle comprises two sequential groove sections and the asymmetrical direction of the herringbone that switches regarding the central symmetry line of the channel at every half cycle. The sequence of local flows in the SHM is achieved by varying the shape of the grooves as a function of the axial position inside the microchannel. The idea is to create non-periodic perturbations to the flow. A change in orientation of the herringbones between half-cycles changes the positions of the centers of rotation and the upwelling and downwelling in the transverse flow [19]. A subsequent study found that the SHM achieves effective mixing within a short distance due to the formation of two helical flows with alternating large and small vortices that rotate in opposite directions [20].
In this case, the microchannel mold is sketched using Autodesk Inventor software and consists of a rectangular microchannel (500 µm wide) with three cycles of SHM, as shown in Figure 1a. Since some factors strongly affect the mixing efficiency in SHM structures, especially the groove depth [27], the SHM features for the mold sketched in this scenario (Figure 1b) are chosen based on the geometry proportions obtained from the literature [20,27,28,29]. A Y-shaped microchannel is designed to accommodate two electrodes before the mixer and one electrode after that. The 3D solid data is translated to a faceted mesh representation consisting of a set of triangles that is converted to an stereolithography (STL) file compatible with 3D printers. The Y-shaped microchannel mold is printed using the ProJet 6000 from 3D Systems (Rock Hill, South Carolina, United States) based on SLA printing technology. It consists of a vat of liquid photopolymer resin that is cured by an Ultra-Violet (UV) laser, which solidifies the desired pattern to create a solid part from the 3D computer-aided design (CAD) file. The process is repeated layer-by-layer until all the data is processed, and then the solid object is removed from the ProJet 6000 for post-processing. In this case, we use clear polycarbonate resin and isopropyl alcohol for post-processing. Figure 1c shows a picture of the 3D-printed microchannel mold with a close-up at the SHM pattern, while Figure 1d shows its optical image with printed dimensions obtained at the Axio Imager 2 microscope from ZEISS (Oberkochen, Germany).
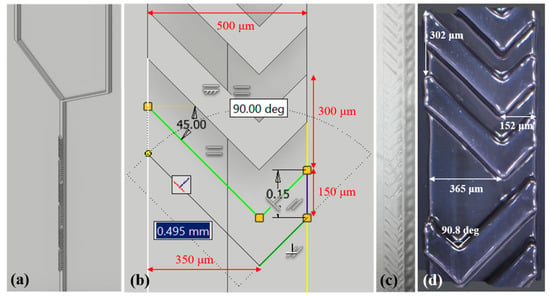
Figure 1.
(a) Computer-aided design CAD model of the molds for polydimethylsiloxane (PDMS) with three cycles of staggered herringbone mixer (SHM) and (b) SHM geometry sketch details (c,d) optical images of the 3D-printed Y-channel mold for PDMS with a close-up at the SHM pattern.
Once the microchannel mold is ready, PDMS is prepared using the base and curing agents (10:1) of a Sylgard® 184 kit from Sigma-Aldrich (St. Louis, MO, USA). The viscous liquid is kept 1 h in low vacuum pressure to remove air bubbles and is then poured into the 3D-printed mold. During the curing process, PDMS takes the shape of the mold with both the microchannel and SHM patterns. Microchannels having SHM 3D-printed molds for PDMS offer a few advantages compared to soft lithography on a silicon wafer: (i) 3D mold printing is faster, cheaper, and does not require cleanroom facilities; (ii) mitigation of human error since soft lithography requires at least two processing steps to fabricate an SHM mold [19], which often leads to alignment problems; (iii) 3D printing enables the fabrication of single molds with frames, considerably reducing the amount of PDMS when compared with molds using a silicon wafer. To facilitate the removal of the PDMS channel from the 3D-printed mold, it is also possible to print a base separately with the channel mold and a frame and then bind them with a clip before pouring the liquid PDMS with a curing agent.
2.2. Automated Electrode Switching
The core of the sensing setup is based on gold-plated interdigitated electrodes (IDEs) embedded on printed circuit boards (PCB). This technology is chosen due to low unit cost and high commercial availability. The e-tongue setup is comprised of an array of four sensing units. Therefore, the PCB is designed to have 12 electrodes (see Figure 2) since three electrodes are required for each sensing unit to integrate the Y-shaped microchannel with SHM. Three IDEs (1 sensing unit) are used as received, and the others are functionalized with materials having distinct electric nature to facilitate the formation of a fingerprint of the samples analyzed [30]. In the same layout, a digitally controlled analog switching system is accommodated to route independently of the signal of each IDE to a pair of coaxial connectors.
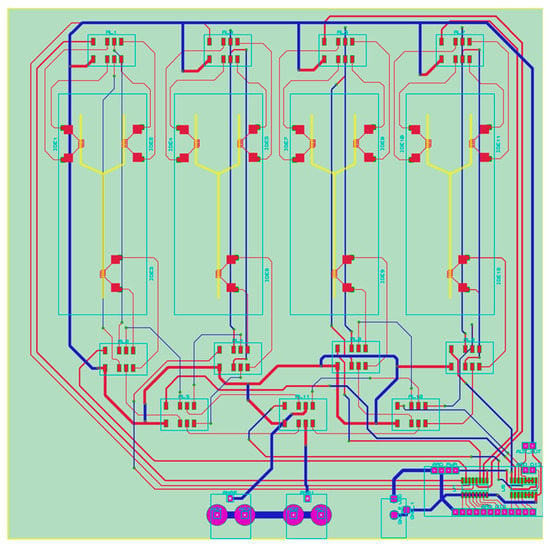
Figure 2.
Printed circuit layout in two copper layers containing four sets of interdigitated electrodes (IDE) electrodes (12 total). The yellow lines represent the four Y-shaped microchannels to illustrate their position on the final device. The red, blue, and pink lines are the copper tracks on either side or both sides of the printed circuit boards (PCB). Exposed pads and interdigitated electrodes were gold-plated.
Overall, e-tongue systems require highly sensitive measurements to identify slight variations between distinct analytes. Therefore, micro-relays are chosen to perform the analog switching between IDEs instead of solid-state integrated circuits to minimize noise, impedance matching, and parasitic capacitance side-effects in data acquisition. The electric signal is routed to a single pair of Bayonet Neill–Concelman (BNC) terminals, which are straightforwardly connected to an impedance analyzer. The micro-relays are triggered by an Arduino Nano [31] aided by ULN2003 Darlington drivers, which are all accommodated in a region dedicated to the digital part of the board, far from the analog signals of the IDEs. The Arduino microprocessor receives commands from computer software that can simultaneously control the commutation of the IDEs, trigger measurements at the impedance analyzer, and record data into ASCII files for post-processing. Depending on the application, the setup can also be adapted to a highly automated platform with high potential for commercial and industrial applications.
2.3. Printed Circuit Boards (PCB) and Microchannel Assembling
The PCB is fabricated by TEC-CI Circuitos Impressos (São Paulo, SP, Brazil). PDMS microchannels are reversibly sealed onto the PCB by mechanical pressure using acrylic plates and stainless-steel screws, which is illustrated in Figure 3. This procedure ensures a leak-tight operation and allows further evaluation of the sensing units if required. Figure 3a shows the PCB containing four Y-shaped microchannels with each of them as a different sensing unit in the e-tongue setup. Figure 3b illustrates the flow and mixing in one Y-shaped microchannel. To better visualize mixing, blue and red food colorants are injected at the inlets of the Y-shaped microchannel (flow rate at 1 mL/h, each). The evidence of adequate mixing is noted by the purple liquid flowing out of the device through the third IDE, as shown in the lower part of Figure 3b. The IDEs are selected during the electrical measurements using computer software written by the authors without any physical interaction with the PCB.
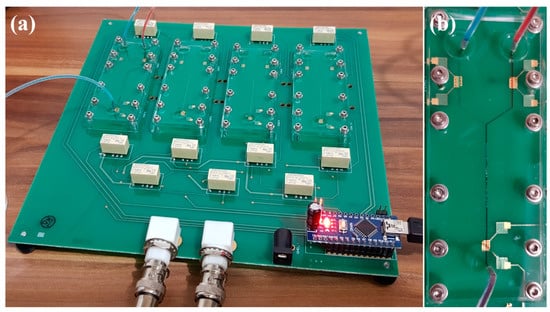
Figure 3.
(a) Printed circuit boards (PCB) embedding four sensing units (three electrodes for each Y-shaped microchannel = 12 electrodes) in a single automated platform. (b) Zoom at one Y-shaped microchannel with a staggered herringbone mixer (SHM) incorporating interdigitated electrodes (IDEs) at the device inputs (before mixing: blue/red dyes) and output (after mixing: purple mixture).
3. Materials and Methods
3.1. Layer-by-Layer Films
Copper phthalocyanine-3,4′,4′’,4′’’-tetrasulfonic acid tetrasodium salt (CuTsPc), montmorillonite clay (MMt-K), poly (3,4-ethylenedioxythiophene)-poly (styrenesulfonate) (PEDOT:PSS), and poly(diallyldimethylammonium chloride) solution (PDDA) were purchased from Sigma-Aldrich and used as received. All materials were dispersed in deionized water obtained from an Arium comfort Sartorius system. Layer-by-layer (LbL) films were fabricated similarly to what is described in References [11,30] by simply alternating aqueous solutions of the materials inside the microchannels for 15 min. Therefore, the four distinct sensing units comprising the e-tongue system were composed by 12 IDEs (three IDEs for each sensing unit): three bare IDEs and nine others covered with 10 bilayers of (PDDA/CuTsPc), (PDDA/MMt-K), and (PDDA/PEDOT:PSS). The choice of the materials was based on the idea of mimicking the biological system of grouping distinct electrical signals sent from the papillae to the brain into specific patterns that are easily classified as tastes. We have chosen materials with different electrical responses to enable a fingerprint of the solutions to be analyzed [1], which can be further processed with statistical and computational techniques. Impedance spectra were obtained for the four sensing units (bare, PDDA/CuTsPc, PDDA/MMt-K, and PDDA/PEDOT:PSS onto gold IDEs) in distilled water (Figure S1).
3.2. E-Tongue Analysis
The e-tongue device is tested to distinguish electrolytes from non-electrolytes covering the basic tastes relevant to human gustative perception (sweet, salty, sour, bitter, and umami), and their mixtures. For this purpose, aqueous solutions of sucrose (C12H22O11), NaCl, HCl, caffeine (C8H10N4O2), and L-glutamic acid are prepared at 1 mM. Impedance measurements are performed at 25 mV amplitude in the frequency range 1–106 Hz using a Solartron 1260A impedance/gain-phase analyzer and a 1296A dielectric interface. Data acquisition is taken with the solutions flowing through the microchannels using a New Era NE-1000 syringe pump (Farmingdale, NY, USA) at a 1 mL/h flow rate. Triplicate measurements are automatically acquired, which result in faster data acquisition. Fewer susceptible errors originated from manipulation, wiring of individual electrodes, or contact problems. The raw data (electrical impedance measurements) are dimensionally reduced using Principal Component Analysis (PCA), which aids in data interpretation and visualization. In general, liquid systems evaluated using e-tongue devices with a capacitive behavior, characterized by negative values of the impedance phase. In this study, we use capacitance, C, and the PCA plots are obtained from C at a fixed frequency (1 kHz) [32] for each sensing unit.
4. Results and Discussion
The Y-shaped PDMS microchannel is sealed onto glass slides (no fluid leakage is observed). The channels are then tested using food colorants dissolved in water at different flow rates of 1, 5, 10, 15, and 20 mL/h. We observed that fluid mixing improved significantly by decreasing the flow rate from 20 to 1 mL/h (Figure S2), likely due to diffusion effects at lower flow rates or Peclet numbers. Therefore, all measurements presented in this case are performed at 1 mL/h flow rate.
Figure 4 shows the PCA score plot obtained for the microfluidic e-tongue device with the SHM mixer. The e-tongue device is assembled onto a PCB to evaluate basic tastes (sweetness, saltiness, sourness, bitterness, and umami) as a proof of concept. The device can distinguish all basic tastes at low molar concentrations, below the human threshold for saltiness and sweetness [33,34]. The most distant clusters observed in Figure 4 are attributed to the strongest electrolytes (NaCl and HCl). The data also shows that the device is very sensitive to non-electrolytes (sucrose) and weak electrolytes (caffeine and glutamic acid), clearly seen in the zoomed area of Figure 4. These results are in good agreement with those found previously in the literature [9,26].
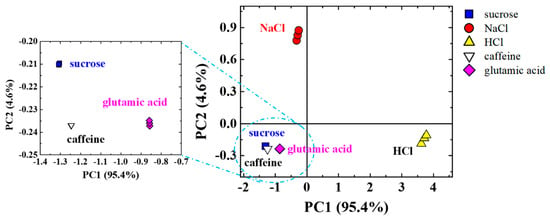
Figure 4.
Principal Component Analysis (PCA) score plot of the capacitance data at 1 kHz in three independent sets of measurements obtained with the microfluidic e-tongue mixer used to evaluate basic tastes relevant to human gustative perception (sweet, salty, sour, bitter, and umami) at 1 mL/h flow.
Since the sugar addition commonly suppresses salty, sour, and bitter tastes, we investigate that by mixing sucrose with salt, HCl, and caffeine. Experiments are performed by flowing sucrose in one arm of the Y-shaped microchannels and flowing NaCl, HCl, or caffeine in the other arm. The SHM structure is used to mix the two flowing streams, and the resulting mixture is evaluated by IDEs placed in the e-tongue setup. Figure 5 shows the PCA score plot of the capacitance data obtained for the four sensing units to evaluate NaCl, HCl, and caffeine suppression effects by sucrose. The use of only two Principal Components led to high correlation (PC1 + PC2~99.9%) of the total information collected by the sensor array for the basic tastes and their mixtures with higher information concentrated in PC1 (95.7%). From the visual analysis, all mixtures are approximately halfway between the neat solutions that generated them. The mixtures of sucrose with NaCl and HCl are easy to visualize in Figure 5, while the mixture of sucrose with caffeine is better distinguished in the zoomed area.
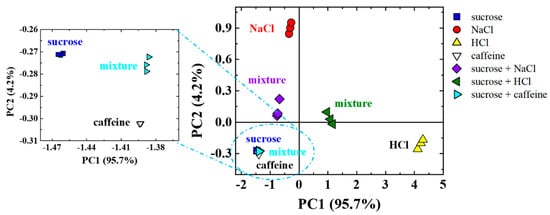
Figure 5.
PCA score plots of the capacitance data at 1 kHz in three independent sets of measurements obtained using a microfluidic e-tongue to evaluate sucrose and their mixtures with NaCl, HCl, and caffeine obtained under flow (1 mL/h) inside a Y-shaped polydimethylsiloxane (PDMS) microchannel with a passive mixer.
In addition to the tests with sucrose, we investigate mixtures of strongest electrolytes (NaCl and HCl) in the e-tongue device. Similar to the sucrose tests, NaCl and HCl are introduced at the inlets. One inlet contains NaCl, while the other contains HCl. Figure 6 shows the PCA score plots obtained for this analysis, comparing the results obtained for neat solutions of sucrose, NaCl, and HCl and their mixtures. The use of two principal components led to 97.1% (PC1 + PC2) of the total information collected by the sensor array. Similarly, most of the information comes from PC1 (86.7%). However, slightly lower than those presented in Figure 4 and Figure 5 (95.4% and 95.7%, respectively). In Figure 6, PC2 plays a more important role than those shown in Figure 4 and Figure 5, as PC2 now comprises 10.4% of the total information. This result may be due to the mixing effect of two strong electrolytes when compared to the mixtures presented previously. Despite the differences observed, the visual analysis once again shows that the mixtures are halfway from their respective neat solutions, which indicates a proper mixing of the tastants inside the microchannels.
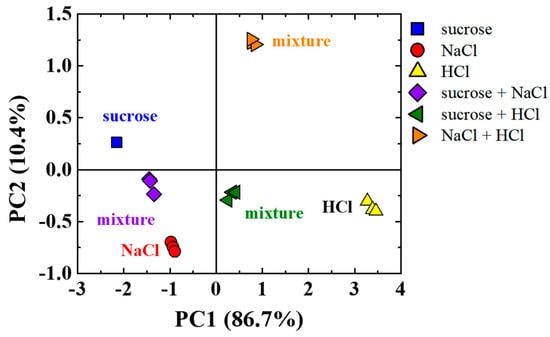
Figure 6.
PCA score plots of the capacitance data at 1 kHz in three independent sets of measurements obtained using a microfluidic e-tongue to evaluate sucrose, NaCl, HCl, and their mixtures obtained under flow (1 mL/h) inside a Y-shaped PDMS microchannel with a passive mixer.
Compared with other e-tongues in the literature, our microfluidic e-tongue setup was integrated with a passive mixer demonstrating high potential for food, beverage, and pharmaceutical applications. Moreover, the electrodes were designed as an integral part of the electronic circuit in a highly automated platform performing rapid multiplexing between all sensing units, diminishing physical interaction with the setup for faster and simplified experiments in a more systematic way. The designed setup is a robust, portable, and flexible platform to be easily adapted in distinct uses, which paves the way for future commercial applications.
5. Conclusions
Molds of Y-shaped microchannels with passive mixers for PDMS were successfully prepared using the SLA 3D-printing technique. The channels were sealed onto a PCB with electrodes coated by LbL films forming distinct sensing units. It is possible to build and test an e-tongue setup capable of evaluating basic tastes and suppression effects in one single automated platform by integrating Y-shaped microchannels with the sensing units, which aims for high potential applications in food, beverages, and pharmaceutical industries. The e-tongue is able to distinguish electrolytes from non-electrolytes and their mixtures inside microchannels, which efficiently responds to basic tastes and suppression effects relevant to human gustative perception. Moreover, the platform is designed to be manufactured using standard industrial processes, which are easily adapted to be commercially available as a fast, robust, and portable instrument.
Supplementary Materials
The following are available online at https://www.mdpi.com/2227-9040/8/1/13/s1. Figure S1: Capacitance spectra for the bare interdigitated electrode (IDE), PDDA/CuTsPc, PDDA/MMt-K, and PDDA/PEDOT:PSS sensing units in distilled water. Figure S2: Y-shaped channel with SHM under flow conditions from 20 to 1 mL/h.
Author Contributions
Conceptualization, M.L.B., P.E.A. and A.R.J. Methodology, M.L.B., P.E.A. and A.R.J. Software, I.F. Validation, M.L.B. Formal analysis, M.L.B. Investigation, M.L.B. and I.F. Resources, M.L.B., V.R., P.E.A. and A.R.J. Data curation, M.L.B. and I.F. Writing—original draft preparation, M.L.B. Writing—review and editing, I.F., V.R., P.E.A. and A.R.J. Visualization, M.L.B. Supervision, A.R.J. Project administration, M.L.B. Funding acquisition, M.L.B., V.R., P.E.A. and A.R.J. All authors have read and agreed to the published version of the manuscript.
Funding
The Brazilian agencies São Paulo Research Foundation (FAPESP, grant number 2014/50869-6, 2015/14836-9 and 2017/06985-0), Coordenação de Aperfeiçoamento de Pessoal de Nível Superior (CAPES), and National Council for Scientific and Technological Development (CNPq) funded this research.
Acknowledgments
We would like to thank all the staff from Additive Manufacturing Laboratory (AddLab), especially to Peter Bruno and Peter Szczesniak (MEAM/SEAS/UPenn) for all the help and support during the year that Maria L. Braunger spent as a visiting scholar at UPenn.
Conflicts of Interest
The authors declare no conflict of interest.
References
- Toko, K. Taste sensor with global selectivity. Mater. Sci. Eng. C 1996, 4, 69–82. [Google Scholar] [CrossRef]
- Vlasov, Y.; Legin, A.; Rudnitskaya, A.; Di Natale, C.; D’Amico, A. Nonspecific sensor arrays (“electronic tongue”) for chemical analysis of liquids. Pure Appl. Chem. 2005, 77, 1965–1983. [Google Scholar] [CrossRef]
- Riul, A., Jr.; Dantas, C.A.R.; Miyazaki, C.M.; Oliveira, O.N., Jr. Recent advances in electronic tongues. Analyst 2010, 135, 2481–2495. [Google Scholar] [CrossRef] [PubMed]
- Chaibun, T.; La-Ovorakiat, C.; O’Mullane, A.P.; Lertanantawong, B.; Surareungchai, W. Fingerprinting green curry: An electrochemical approach to food quality control. ACS Sensors 2018, 3, 1149–1155. [Google Scholar] [CrossRef] [PubMed]
- Banerjee (Roy), R.; Tudu, B.; Bandyopadhyay, R.; Bhattacharyya, N. Application of Electronic Nose and Tongue for Beverage Quality Evaluation. In Engineering Tools in the Beverage Industry; Elsevier Inc.: Amsterdam, The Netherlands, 2019; pp. 229–254. [Google Scholar]
- Shimizu, F.M.; Braunger, M.L.; Riul, A., Jr. Heavy Metal/Toxins Detection Using Electronic Tongues. Chemosensors 2019, 7, 36. [Google Scholar] [CrossRef]
- Kirsanov, D.; Correa, D.; Gaal, G.; Riul, A.; Braunger, M.; Shimizu, F.; Oliveira, O.; Liang, T.; Wan, H.; Wang, P.; et al. Electronic Tongues for Inedible Media. Sensors 2019, 19, 5113. [Google Scholar] [CrossRef] [PubMed]
- Jacesko, S.; Abraham, J.K.; Ji, T.; Varadan, V.K.; Cole, M.; Gardner, J.W. Investigations on an electronic tongue with polymer microfluidic cell for liquid sensing and identification. Smart Mater. Struct. 2005, 14, 1010–1016. [Google Scholar] [CrossRef]
- Daikuzono, C.M.; Dantas, C.A.R.; Volpati, D.; Constantino, C.J.L.; Piazzetta, M.H.O.; Gobbi, A.L.; Taylor, D.M.; Oliveira, O.N., Jr.; Riul, A., Jr. Microfluidic electronic tongue. Sensors Actuators B Chem. 2015, 207, 1129–1135. [Google Scholar] [CrossRef]
- Daikuzono, C.M.; Shimizu, F.M.; Manzoli, A.; Riul, A., Jr.; Oliveira Piazzetta, M.H.; Gobbi, A.L.; Correa, D.S.; Paulovich, F.V.; Oliveira, O.N., Jr. Information Visualization and Feature Selection Methods Applied to Detect Gliadin in Gluten-Containing Foodstuff with a Microfluidic Electronic Tongue. ACS Appl. Mater. Interfaces 2017, 9, 19646–19652. [Google Scholar] [CrossRef]
- Braunger, M.L.; Shimizu, F.M.; Jimenez, M.J.M.; Amaral, L.R.; Piazzetta, M.H.d.O.; Gobbi, Â.L.; Magalhães, P.S.G.; Rodrigues, V.; Oliveira, O.N., Jr.; Riul, A., Jr. Microfluidic electronic tongue applied to soil analysis. Chemosensors 2017, 5, 14. [Google Scholar] [CrossRef]
- Shimizu, F.M.; Pasqualeti, A.M.; Todão, F.R.; De Oliveira, J.F.A.; Vieira, L.C.S.; Gonçalves, S.P.C.; Da Silva, G.H.; Cardoso, M.B.; Gobbi, A.L.; Martinez, D.S.T.; et al. Monitoring the Surface Chemistry of Functionalized Nanomaterials with a Microfluidic Electronic Tongue. ACS Sensors 2018, 3, 716–726. [Google Scholar] [CrossRef] [PubMed]
- Squires, T.M.; Quake, S.R. Microfluidics: Fluid physics at the nanoliter scale. Rev. Mod. Phys. 2005, 77, 977–1026. [Google Scholar] [CrossRef]
- Ward, K.; Fan, Z.H. Mixing in microfluidic devices and enhancement methods. J. Micromechanics Microengineering 2015, 25, 094001. [Google Scholar] [CrossRef] [PubMed]
- Ottino, J.M.; Wiggins, S. Introduction: Mixing in microfluidics. Philos. Trans. R. Soc. A Math. Phys. Eng. Sci. 2004, 362, 923–935. [Google Scholar] [CrossRef] [PubMed]
- Salieb-Beugelaar, G.B.; Gonçalves, D.; Wolf, M.P.; Hunziker, P. Microfluidic 3D helix mixers. Micromachines 2016, 7, 189. [Google Scholar] [CrossRef] [PubMed]
- Das, S.S.; Tilekar, S.D.; Wangikar, S.S.; Patowari, P.K. Numerical and experimental study of passive fluids mixing in micro-channels of different configurations. Microsyst. Technol. 2017, 23, 5977–5988. [Google Scholar] [CrossRef]
- Zhu, J.M.; Shi, Y.; Zhu, X.Q.; Yang, Y.; Jiang, F.H.; Sun, C.J.; Zhao, W.H.; Han, X.T. Optofluidic marine phosphate detection with enhanced absorption using a Fabry-Pérot resonator. Lab Chip 2017, 17, 4025–4030. [Google Scholar] [CrossRef]
- Stroock, A.D.; Dertinger, S.K.W.; Ajdari, A.; Mezić, I.; Stone, H.A.; Whitesides, G.M. Chaotic mixer for microchannels. Science 2002, 295, 647–651. [Google Scholar] [CrossRef]
- Aubin, J.; Fletcher, D.F.; Bertrand, J.; Xuereb, C. Characterization of the mixing quality in micromixers. Chem. Eng. Technol. 2003, 26, 1262–1270. [Google Scholar] [CrossRef]
- Knowlton, S.; Yu, C.H.; Ersoy, F.; Emadi, S.; Khademhosseini, A.; Tasoglu, S. 3D-printed microfluidic chips with patterned, cell-laden hydrogel constructs. Biofabrication 2016, 8, 025019. [Google Scholar] [CrossRef]
- Wiese, M.; Benders, S.; Blümich, B.; Wessling, M. 3D MRI velocimetry of non-transparent 3D-printed staggered herringbone mixers. Chem. Eng. J. 2018, 343, 54–60. [Google Scholar] [CrossRef]
- Goh, W.H.; Hashimoto, M. Fabrication of 3D Microfluidic Channels and In-Channel Features Using 3D Printed, Water-Soluble Sacrificial Mold. Macromol. Mater. Eng. 2018, 303, 1700484. [Google Scholar] [CrossRef]
- Erkal, J.L.; Selimovic, A.; Gross, B.C.; Lockwood, S.Y.; Walton, E.L.; McNamara, S.; Martin, R.S.; Spence, D.M. 3D printed microfluidic devices with integrated versatile and reusable electrodes. Lab Chip 2014, 14, 2023–2032. [Google Scholar] [CrossRef]
- Duarte, L.C.; Chagas, C.L.S.; Ribeiro, L.E.B.; Coltro, W.K.T. 3D printing of microfluidic devices with embedded sensing electrodes for generating and measuring the size of microdroplets based on contactless conductivity detection. Sensors Actuators, B Chem. 2017, 251, 427–432. [Google Scholar] [CrossRef]
- Gaal, G.; Mendes, M.; de Almeida, T.P.; Piazzetta, M.H.O.; Gobbi, Â.L.; Riul, A., Jr.; Rodrigues, V. Simplified fabrication of integrated microfluidic devices using fused deposition modeling 3D printing. Sensors Actuators B Chem. 2017, 242, 35–40. [Google Scholar] [CrossRef]
- Kwak, T.J.; Nam, Y.G.; Najera, M.A.; Lee, S.W.; Strickler, J.R.; Chang, W.-J. Convex grooves in staggered herringbone mixer improve mixing efficiency of laminar flow in microchannel. PLoS ONE 2016, 11, e0166068. [Google Scholar] [CrossRef] [PubMed]
- Wang, D.; Ba, D.; Liu, K.; Hao, M.; Gao, Y.; Wu, Z.; Mei, Q. A numerical research of herringbone passive mixer at low Reynold number regime. Micromachines 2017, 8, 325. [Google Scholar] [CrossRef]
- Forbes, T.P.; Kralj, J.G. Engineering and analysis of surface interactions in a microfluidic herringbone micromixer. Lab Chip 2012, 12, 2634–2637. [Google Scholar] [CrossRef]
- Braunger, M.L.; Daikuzono, C.M.; Riul, A., Jr. A Microfluidic E-Tongue System Using Layer-by-Layer Films Deposited onto Interdigitated Electrodes Inside a Polydimethylsiloxane Microchannel. In Biomimetic Sensing: Methods and Protocols; Fitzgerald, J., Fenniri, H., Eds.; Springer Nature: New York, NY, USA, 2019; pp. 141–150. [Google Scholar]
- Arduino. Available online: www.arduino.cc (accessed on 23 January 2020).
- Riul, A., Jr.; dos Santos, D.S., Jr.; Wohnrath, K.; Di Tommazo, R.; Carvalho, A.C.P.L.F.; Fonseca, F.J.; Oliveira, O.N., Jr.; Taylor, D.M.; Mattoso, L.H.C. Artificial taste sensor: Efficient combination of sensors made from Langmuir-Blodgett films of conducting polymers and a ruthenium complex and self-assembled films of an azobenzene-containing polymer. Langmuir 2002, 18, 239–245. [Google Scholar] [CrossRef]
- Schiffman, S.S.; Crumbliss, A.L.; Warwick, Z.S.; Graham, B.G. Thresholds for sodium salts in young and elderly human subjects: Correlation with molar conductivity of anion. Chem. Senses 1990, 15, 671–678. [Google Scholar] [CrossRef]
- Mouillot, T.; Barthet, S.; Janin, L.; Creteau, C.; Devilliers, H.; Brindisi, M.C.; Penicaud, L.; Leloup, C.; Brondel, L.; Jacquin-Piques, A. Taste perception and cerebral activity in the human gustatory cortex induced by glucose, fructose, and sucrose solutions. Chem. Senses 2019, 44, 435–447. [Google Scholar] [CrossRef] [PubMed]
© 2020 by the authors. Licensee MDPI, Basel, Switzerland. This article is an open access article distributed under the terms and conditions of the Creative Commons Attribution (CC BY) license (http://creativecommons.org/licenses/by/4.0/).