Article

Optical Detection of Bromide Ions Using Pt(II)-5,10,15,20-Tetra-(4-methoxy-phenyl)-porphyrin

1
Institute of Chemistry “Coriolan Dragulescu”, Mihai Viteazu Ave. No. 24, 300223 Timisoara, Romania
2
National Institute for Research and Development in Electrochemistry and Condensed Matter, P. Andronescu Street, No. 1, 300224 Timisoara, Romania
3
Faculty of Chemistry, Biology, Geography, West University of Timisoara, 4 V. Parvan Ave, 300223 Timisoara, Timis, Romania
*
Author to whom correspondence should be addressed.
Chemosensors 2019, 7(2), 21; https://doi.org/10.3390/chemosensors7020021
Submission received: 29 March 2019 / Revised: 23 April 2019 / Accepted: 23 April 2019 / Published: 27 April 2019

Abstract

:
Bromide ions are present in many environments, such as sedative drugs, methyl-bromide-treated vegetables and seawater. Excess bromide in humans interferes with iodide metabolism and is considered toxic. The need for fast and inexpensive methods for bromide detection is of interest. Spectrophotometric detection methods provide accurate and sensitive results. The well-known ability of metalloporphyrins to bind anionic ligands to the central metal ion has been exploited. The changes in the optical properties of Pt(II) 5,10,15,20-tetra(4-methoxy-phenyl)-porphyrin (PtTMeOPP) under the influence of bromide ions allowed us to achieve a fast, simple and reliable UV-vis spectrophotometric method of detection with a detection limit of 2.5 × 10⁻⁸ M and a good confidence coefficient: 99.05%. The potential interfering ions, such as Cl, I, NO2, NO3, SCN, SO32−, SO42− and PO43− of 100-fold higher and Cl and R-S of 1000-fold higher concentrations in the mixture as compared to the determined concentration of bromide ions (c = 10−5 M), were tested and did not influence the results. The behavior of the sensitive porphyrin in various pH media was investigated in order to determine their influence upon the bromide detection capacity.

Graphical Abstract

1. Introduction

Bromide is an essential element for animals; its deficiency leads to dysfunctions of physiology as it is involved in collagen synthesis [1]. The concentration of bromide in human blood (5.3 ± 1.4 mg/dL) varies with age, gender and the diet of the investigated patient [2]. It was established that high levels of bromide lead to growth retardation and insomnia as well as iodide accumulation in thyroid and skin and finally produces an increase in iodide excretion by the kidneys [3].
The detection of bromide ion in human biological samples (blood, saliva or urine) is important because the bromide ions might exceed the normal concentration due to the ingestion of sedative-hypnotic drugs [4,5] or foods treated with pesticides [6]. For example, bromide used as a sedative drug [4] was detected in concentrations of 10 mM in the blood serum of patients.
Intoxication with another sedative known as calcium bromo-galactogluconate (Calcibronat@—Novartis Pharma SA France, each tablet containing 2 g calcium bromogalactogluconate or 301 mg of elemental bromide) leads to headache, agitation, weakness, slurred speech, confusion, ideations, hallucinations, stupor and even coma [5]. The high serum bromide concentration of 1717 mg/L (21.5 mEq/L), represents severe intoxication and was measured from blood serum by inductively coupled plasma mass spectrometry.
On the other hand, a pesticide gas, methyl bromide (efficient against insects, mites, molds, nematodes, weeds, viruses and bacteria) with a high rate of penetration, used for food conservation, can lead to unconsciousness and finally death of the handling personnel due to prolonged exposure [6]. For example, the colorimetric detection of bromide from rice samples treated with methyl bromide, based on gold nanoparticles in the presence of Cr3+ to prevent Au aggregation, proved to be a sensitive and robust method.
Although there are commercially available Bromide Ion-Selective Electrodes (ELIT 8271, from NICO2000 Ltd, 62 Pebworth Road, Harrow, Middlesex, HA1 3UE, UK) designed for the detection of bromide ions in aqueous solutions, a more efficient potentiometric solid-contact ion-selective electrode was developed based on meso-tetraphenylporphyrin manganese(III)-chloride [7] that is able to detect bromide ions in a lower concentration range from 0.010 to 1.0 μM.
Different methods were performed over a specific time period to improve the accuracy, the limit of detection, the time of detection, the stability, the robustness and to limit the cost of bromide detection—the most important are summarized and presented together with their advantages and drawbacks in Table 1.
Our previous experience regarding the detection of bromide ions by means of ion-selective potentiometric sensors, using the Pt(II) 5,10,15,20-tetra(4-methoxy-phenyl)-porphyrin (PtTMeOPP) as an ionophore, polyvinylchloride (DOP) as a plasticizer, polyvinylchloride (PVC) as a support and tridodeocylmethylammonium chloride (TDMACl) as an additive, provided a detection limit of 8 × 10⁻⁶ M [20]. The changes in optical properties of the AuNPs/PtTMeOPP hybrid material under the influence of triiodide ions were also investigated [23]. It was concluded that the AuNPs/PtTMeOPP hybrid material can optically detect triiodide ions up to a concentration limit of 1.5 × 10⁻⁹ M in media mimicking human physiology.
The present study is focused on the investigation of the capacity of Pt(II) 5,10,15,20-tetra(4-methoxy-phenyl)-porphyrin (PtTMeOPP) alone (structure in Figure 1), which is a hydrophobic compound, to optically detect bromide ions from both synthetic and especially biological samples, with the main aim of improving the already known detection limits.

2. Materials and Methods

2.1. Materials

Pt(II) 5,10,15,20-tetra(4-methoxy-phenyl)-porphyrin (PtTMeOPP) was obtained as previously reported [20,23] by a metallation reaction of the corresponding porphyrin base using 50% excess of the water-soluble complex PtCl2(PhCN)2 and a large excess (six times more) of CH3COONa × 3H2O. The purpose of using sodium acetate is to prevent major acidification of the reaction medium and consequently the decomposition of the complex, by capturing the resulting chloride ions. In only one hour, this simple change [24] offers better yields (>90%) and reduces the time of synthesis.
Tetrahydrofuran (THF), dichloromethane (CH2Cl2), chloroform (CHCl3), KBr salt, NaOH pellets and HCl solution 0.5 N were aquired from Merck (Darmstadt, Germany) and used without further purification. Potasium chloride (KCl) was obtained from Acros (Morris Plains, NJ, USA), and all the other inorganic salts, KI, Na2SO3 × 7H2O, K2SO4, NaNO2, NaNO3, Na3PO4 × 12H2O and NaSCN, were purchased from Reactivul Bucuresti (București, Romania). Buffer solution HI 70007 (pH = 7.01) was provided by Hanna Instruments Inc. (Highland Industrial Park Woonsocket, Cumberland, RI, USA).

2.2. UV-Visible Spectral Studies

A V-650-JASCO spectrometer (Pfungstadt, Germany) was used for the UV-visible investigation, using 1 cm wide quartz cuvettes.
The values of pH were measured with a pH-meter HI 98,100 Checker Plus, from Hanna Instruments, Woonsocket, Rhode Island, 02895, USA.

2.3. Atomic Force Microscopy (AFM) Imaging

A Nanosurf® EasyScan 2 Advanced Research AFM microscope (Liestal, Switzerland) was used to obtain atomic force microscopy (AFM) images in the non-contact mode. Pure silica plates were used for the deposition of samples from different solvent systems (chloroform, dichloromethane, THF, THF/water).

3. Results and Discussion

3.1. Investigation of the Stability of PtTMeOPP Solution in THF in Different pH Media

3.1.1. Acidic Media

In order to inspect the optical changes produced by acidic media on the PtTMeOPP in THF solution, the following experiment was conducted: to 5 mL PtTMeOPP solution in THF (pH = 6.5), portions of 0.2 mL HCl solution (c = 0.5 N) were successively added. The pH of the solution was measured using a pH-meter and the UV-vis spectra were recorded and are presented in Figure S1.
It can be concluded that the platinum porphyrin is stable up to pH = 2 despite the increase in the acidity of the medium. By further increasing the acidity (pH = 1), a bathochromic shift of the Soret band takes place, from 405 nm to 416 nm, accompanied by a very significant decrease in intensity (Figure S1). This is an indication of the demetallation of the Pt-porphyrin that belongs to class III metalloporphyrins based on its resistance to acid [25]. The demetallation is associated with the appearance of the third Q band (QIII band) located around 550 nm, a characteristic feature of free-porphyrins.

3.1.2. Basic Media

In order to inspect the changes in optical behavior of the PtTMeOPP solution in THF in basic media, the experiment was performed as follows: to 5 mL PtTMeOPP solution in THF (pH = 6.5), portions of 0.1 mL NaOH solution (c = 5 M) were successively added. The pH of the solution was measured and the UV-vis spectra were recorded and are presented in Figure S2.
It can be concluded that the platinum porphyrin is stable with the increase in basicity of the medium in the entire basic domain. The only unexpected changes that occur in the UV-vis spectra concern the increase in intensity of the Soret and Q bands with the increase in the basicity of the medium.

3.1.3. Phosphate Buffered Solution

The initial pH of the PtTMeOPP solution was measured (pH = 6.5) and the UV-vis spectrum was recorded. Then, to 4 mL PtTMeOPP of this solution in THF, 12 drops of HI 70007 buffer solution from Hanna Instruments were added and the pH was measured again, reaching pH = 7.15. The two spectra are overlapped in Figure S3. The buffer solution has no significant influence upon the shape, position or intensity of the absorption of the Soret band other than a slight increase of the Q band at 511 nm.

3.2. AFM Studies Concerning the Aggregation Properties of PtTMeOPP at the Interface of Different Solvents/Air on Silica Plates

The AFM images (Figure S4) show that the aggregation behavior of the platinum porphyrin deposited from different solvents by drop-casting varies. Thus, from chlorinated solvents the tendency of the particles is to aggregate both in H-and J-type aggregates, which ultimately form rings. The average dimensions of particles in the case of CHCl3 solvent are around 200 nm, but in the case of the CH2Cl2 solvent the size is larger, around 400 nm. The aggregates generated from CHCl3 are larger and more diverse in organization, so that rings and wheatear-shaped aggregates are simultaneously present. More polar solvents, such as THF, lead to the formation of pyramids of smaller dimensions that are more evenly distributed on the surface and uniformly oriented. The dimensions of particles sides in the case of THF are averaged at 230 nm.

3.3. Detection of Bromide Ions

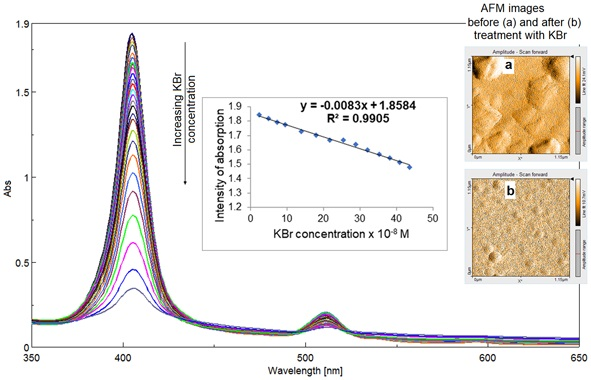
3.3.1. UV-Vis Spectrophotometric Investigations

To a volume of 3 mL PtTMeOPP in THF (c = 1.28 × 10⁻⁵ M), 0.05 mL KBr solution in water having different concentrations, varying from 1.527 × 10⁻⁶ M to 2.7 × 10⁻⁵ M, were added, so that the final corrected concentrations in bromide spanned from c = 2.50 × 10⁻⁸M to 4.36 × 10⁻⁷ M. The mixtures were stirred for 30 seconds in a sonication bath and then the UV-vis spectra were recorded (Figure 2) and overlapped.
From the overlapped UV-vis spectra, it can be concluded that the detection of bromide ions is achieved by a decrease in the intensity of the Soret band without changes in the position of the bands. Three isosbestic points, one located on the descending branch of the Soret band, at 446 nm, and two located on both sides of the Q band, at 495 nm and 528 nm, respectively, indicate the formation of porphyrin-halide intermediates during the recognition process, as bromide anions are capable of coordinating with the platinum central atom. Porphyrin bases are also capable of coordinating halogen anions, but only in their protonated state [26].
The relation between the intensity of the absorption of the Soret band read at 405 nm and the concentration of bromide ions is linear, having a correlation coefficient of 99.05%. The bromide concentration domain, for which the dependence is linear, ranges from 2.5 × 10⁻⁸ M to 4.36 × 10⁻⁷ M (Figure 3).

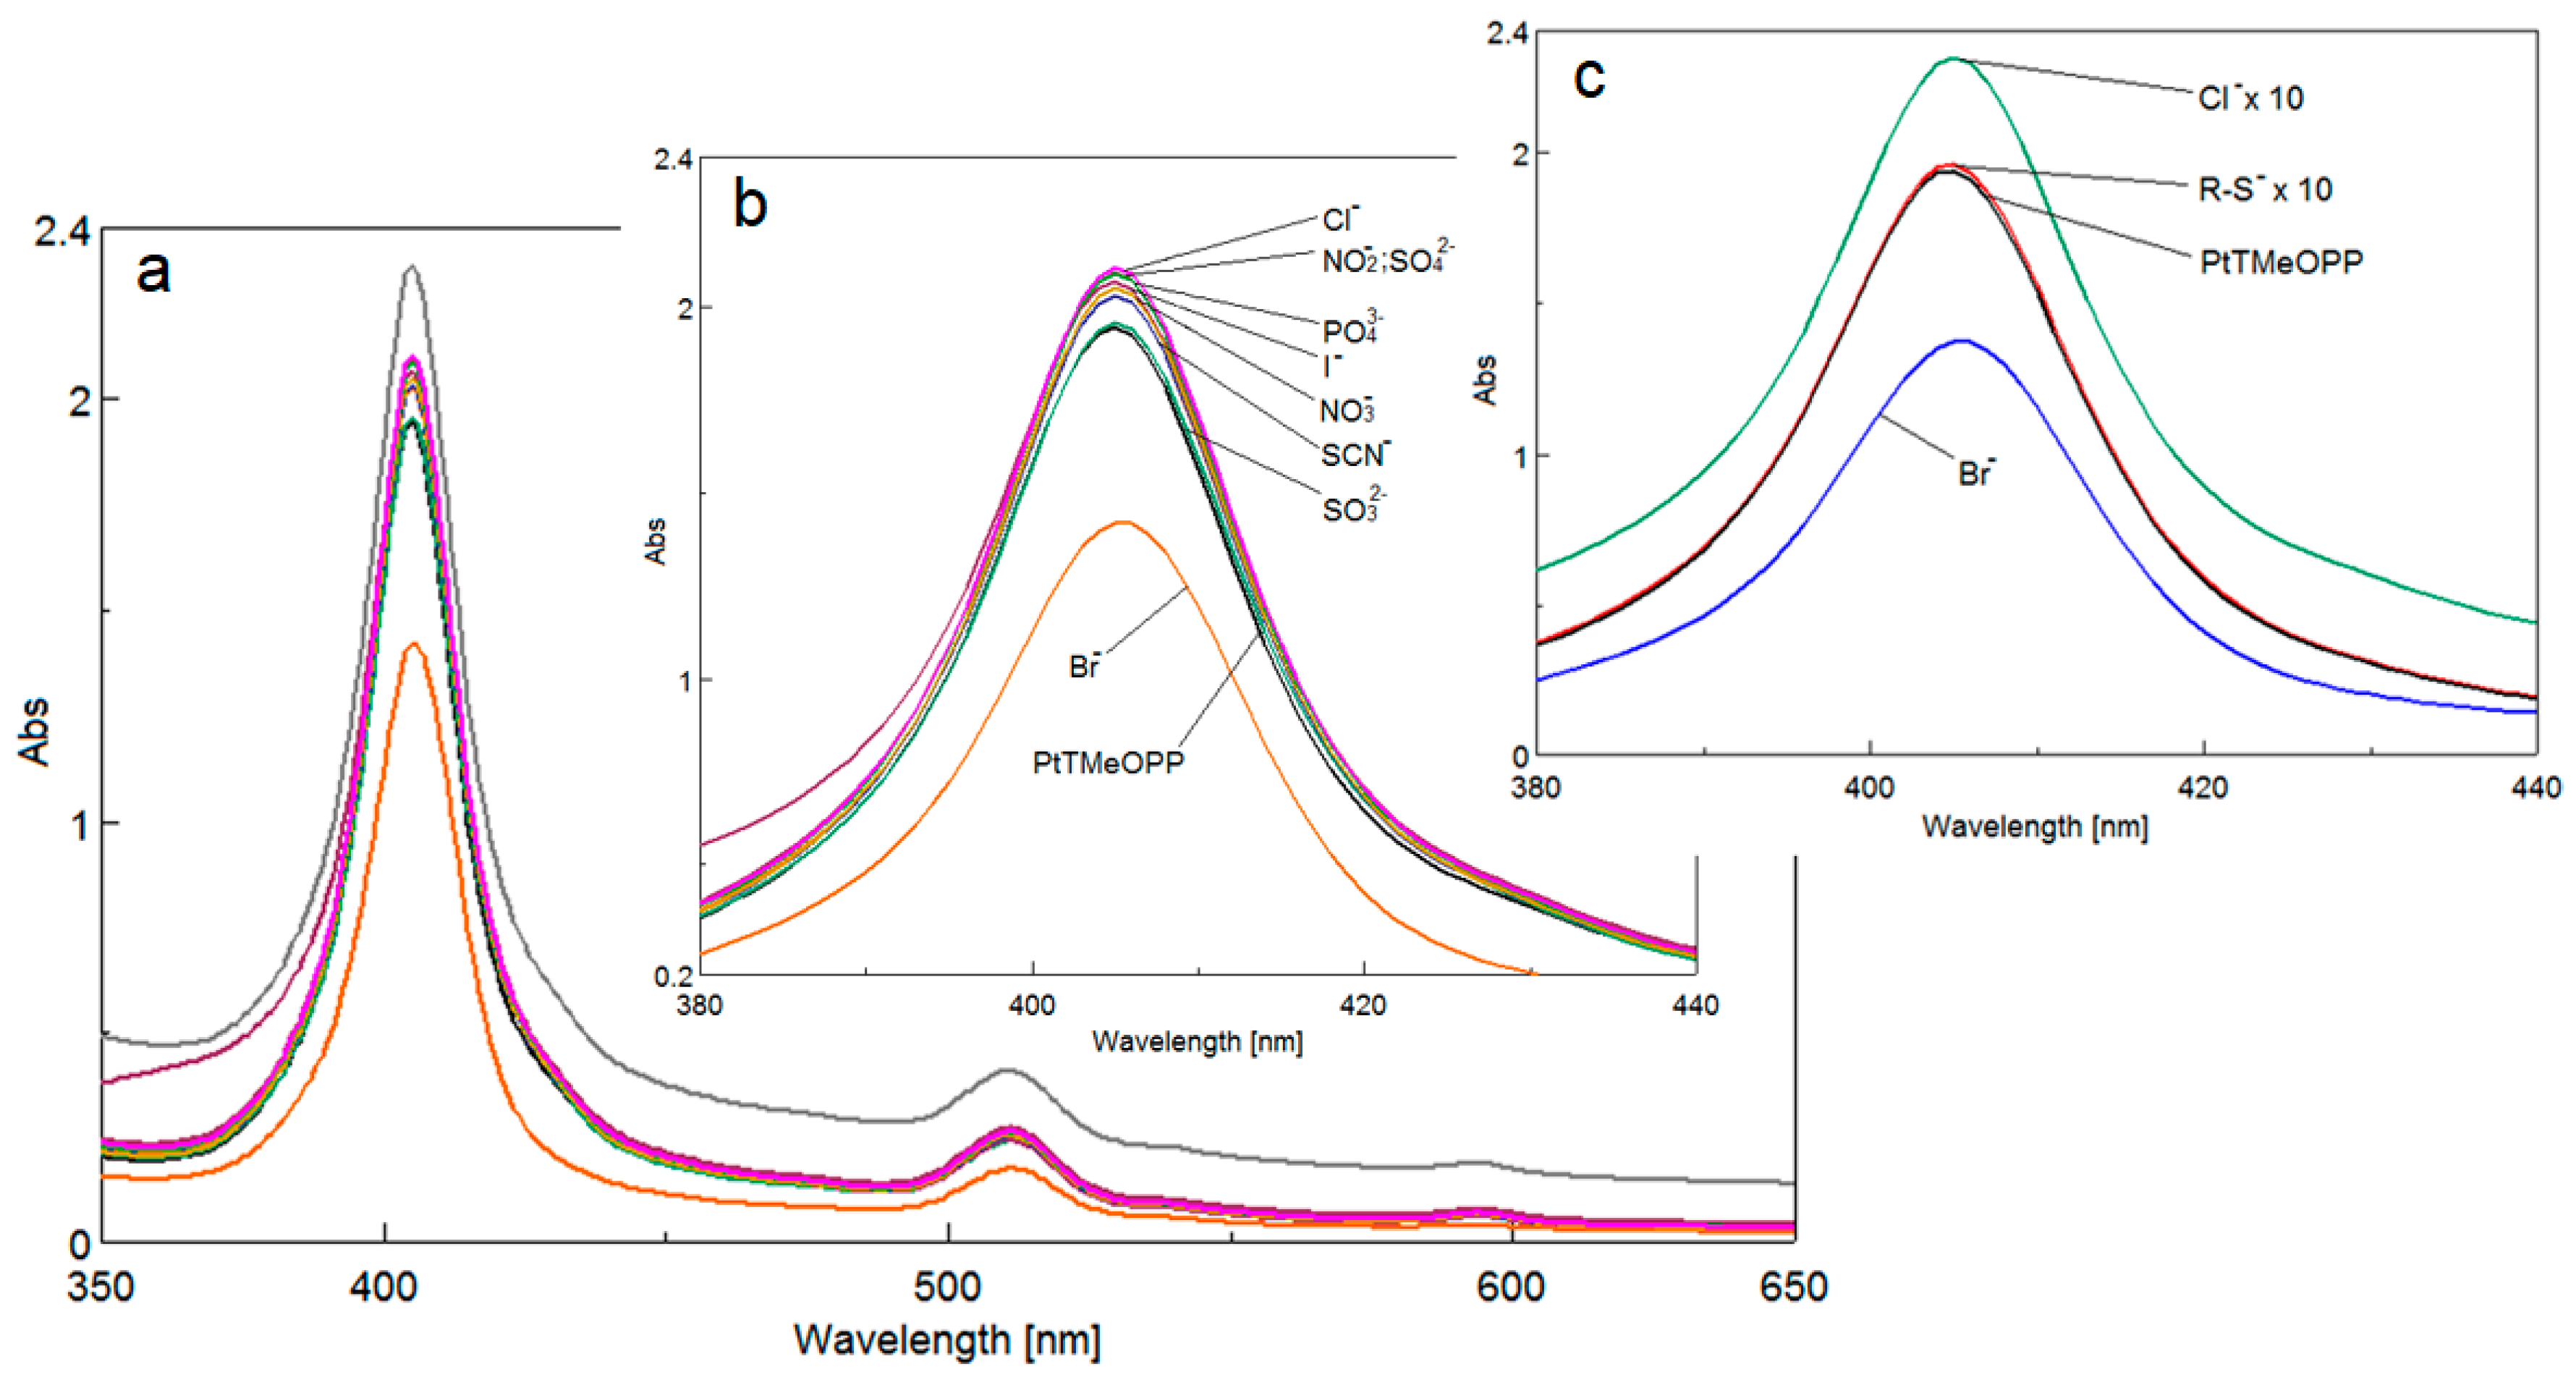
3.3.2. The Study of Interfering Ions

Since bromide ions were not present alone in any real samples, neither water nor biological materials, an interference study was performed. To each portion of 3.5 mL PtTMeOPP in THF solution (c = 1.67 × 10⁻⁵ M), 0.1 mL portions of the interferent ion solutions (Cl, I, NO2, NO3, SCN, SO32−, SO42−, PO43−) in water (c = 1 × 10⁻³ M) were added. Each of the potential interfering ions had a 100-fold higher concentration in the mixture than the determined concentration of bromide ions (c = 10−5 M). Due to the fact that chloride [17,27] and thiols [28,29] were present in large amounts in the biological samples, the chloride and the thioglycolic acid ions were investigated in a higher exceeding concentration, labeled in Figure 4 as Cl × 10 and R-S × 10, representing a 1000 fold higher concentration than the Br concentration.
The UV-vis spectrum for each mixture was recorded after 30 s of intense stirring and all spectra were overlapped and are presented in Figure 4. It can be seen in Figure 4 and Figure 5 that the selectivity of the proposed UV-vis spectrophotometric method for bromide detection is very good, as all the potential interfering anions have an opposite effect, increasing the intensity of absorption, after their adding to the sensitive material (Figure 5).

3.3.3. Mechanism of Detection

The recognition mechanism is explained by the axial coordination of the bromide anion to the platinum ion in the center of the porphyrin. This binding process is accompanied by changes in optical properties [30] due to associated modifications regarding the conformation of the molecule or due to loss or gain in its symmetry [31].
Pt-metalloporphyrins (used alone as sensing materials) can be considered Lewis acidic dyes that are capable of reacting with analytes. The basicity of the bromide ion is higher than the basicity of the iodide ion, so this is the main factor enabling the recognition of bromide. During the performed experiments, the shape of the UV-vis spectra did not change the position of the bands, confirming that the interaction with bromide ions occurs with Pt at the porphyrin macrocycle center (Figure 6) [32].
In the previous reported studies concerning the use of the same Pt-metalloporphyrin for iodide/bromide [20] or triiodide ion detection [23], the mechanism of detection was different, because in the first case the Pt-metalloporphyrin was incorporated into a PVC membrane and used as a potentiometric sensor, and in the second case it was part of a hybrid material with AuNPs.

3.3.4. The Influence of the Ionic Strength

An additional test regarding the influence of the ionic strength on PtTMeOPP porphyrin was performed using NaCl, because this is the main factor present in biological samples and it is able to destabilize the material. If the process of porphyrin aggregation occurs, a constant increase of the hydrodynamic diameter over time should be observed because the particles are destabilized and they might aggregate to the point of sedimentation. As a general rule, when the ionic strength is varied, large bathochromic shifts of the Soret maximum with significant hypochromicity are characteristic for porphyrin intercalation [33]. This phenomenon was not observed in our UV-vis experiment at ionic strengths of 0.5 M, 0.25 M, 0.1 M and 0.025 M, with all the spectra preserving the shape and the position of their bands (Figure S5).

3.3.5. Morphological Modifications after Bromide Exposure

The AFM images obtained in the non-contact mode of the PtTMeOPP porphyrin deposited from THF (Figure 7a–d) reveal a self-aggregation process, mostly in H-type aggregates generating oriented triangular geometries of around 220 nm in size. The height distribution of the particles is in the range of 6–15 nm. After treatment with bromide ions, the morphology dramatically changes and the shape of the particles becomes round and smaller, around 95 nm in diameter. The H-type aggregation is less pronounced (Figure 7e–h) and the surface is more evenly covered. As a consequence, the height distribution of the aggregates also decreases to 1–4 nm.

3.3.6. Real Sample Testing

For real sample measurements, onions (Allium cepa) were chosen due to their higher content in bromide as compared to other vegetables (tomatoes, garden eggs, peppers and carrots). For example, the reported content of bromide for onions from the market in Ghana is 70.20–142.60 mg/kg [34].
In our case, selected onions were acquired from normal and bio private garden cultures (different regions of Romania) that are widely use in European cuisine and have rich content in microelements (a large variety of minerals, such as P, Na, K, Ca, Mg, Fe, Cu, Zn, Mn and Se) [35]. An early study regarding the content of bromide in onions originated from the United States of America [36,37], and indicated the presence of bromide in the quantity of 61 mg bromide/kg onion.

3.3.7. Sample Preparations of Onion Extracts and Bromide Ions Detection and Validation by Potentiometric Titration

We acquired onions from Romanians’ private gardens (Cenad and Malovat) and the workup procedure was applied as described in a previously published paper [22]. The onions were acquired in March and were harvested in the previous autumn. Portions of 5 g from four different onions were thoroughly mixed with 6.033 g sodium carbonate in a ceramic crucible. Then, the yellow mixture was heated gradually in a furnace to 850 °C and kept there for 20 min. After cooling, the content of the crucible was successively disintegrated from the crucible with 20 mL hot water three times and transferred into a beaker. The obtained solution was filtered, the filtrate was transferred to a volumetric flask and doubly distilled water was added to a final volume of 200.10 mL.
For each sample, to 3 mL of PtTMeOPP in THF solution (c = 1.28 × 10⁻⁵M), 0.1 mL of 100-fold diluted onion solution was added and the UV-vis spectra were registered. The calculated results are presented in Table 2.
The intensity of absorption was compared with the calibration curve (equation from Figure 6), and bromide concentrations of 97.27 mg Br/kg onion in the investigated onion from Cenad (Banat county) and 82.17 mg Br/kg in the bio onion from Malovat (Oltenia county) were obtained, yielding results that are within the limits of the literature data [34].

3.3.8. The Validation of Results

The potentiometric method was chosen for validation because it is fast, sensitive and capable of detecting both Cl and Br in a one-step titration. The potentiometric titration [38,39] of Garden Bio Onion (Romania, Malovat) was performed as follows: to 50 mL sample (onion) solution, 0.5 mL HNO3 2 mol L−1 and 1 g barium acetate were added. The solution was titrated with AgNO3 0.01 mol L−1 using Ag coated with Ag2S as a working electrode, a steel electrode as a contraelectrode and Ag/AgCl as a reference electrode, all immersed in an undivided cell. The potentiometric titration curve shows two slopes, with the first occurring at very low volumes being associated with bromine titration. So, the first equivalence point corresponds to the bromide content reported in Table 1. The method was initially tested for solutions with known KBr content. Then, the method was used for the onion solution with an unknown bromide content. The results were also verified for the onion solution with a supplementary addition of known KBr. The experimental results represent the average of five determinations. The determination error is less than 2.2%.
The recovery data obtained by UV-vis spectrometry were also measured with an external addition of a known amount of Br in order to verify the results.
Due to the use of treatments containing growth regulators and pesticides that are required for the cultivation and long-term deposition of harvested onion in normal conditions, it is understandable that the bio sample onion has a lower content in bromide than the onion from large-scale production.

4. Conclusions

This study represents the pioneering use of the hydrophobic compound Pt(II) 5,10,15,20-tetra(4-methoxy-phenyl)-porphyrin (PtTMeOPP) for achieving a sensitive and selective optical sensor for the UV-vis detection of trace amounts of Br anions. A detection limit of 2.5 × 10⁻⁸ M concentration for bromide anions and a confidence coefficient of 99.05% make it one of the best candidates for the development of an unexplored, simple, accurate and fast UV-vis spectrophotometric methodology for bromide detection in biological samples (since the only known similar method is based on fluorescence). The ability of metalloporphyrins to bind anionic ligands to the central metal ion offers a good explanation for the detection mechanism, which was proven by the multiple isosbestic points from the UV-vis spectra. The behavior of the sensitive porphyrin in various pH media was also investigated in order to determine its stability. It can be concluded that PtTMeOPP is stable in a wide pH range (2–14) and its optical properties are not influenced by the presence of buffers in the solution. It worth noting that the chloride and thiol anions that are the main interferents of bromide do not influence this determination in any way.

Supplementary Materials

The following are available online at https://www.mdpi.com/2227-9040/7/2/21/s1, Figure S1. Overlapped UV-vis spectra after successive adding of 0.5 N HCl solution to PtTMeOPP solution in THF. Detail: Spectrum for the solution at pH = 1; Figure S2. Overlapped UV-vis spectra after increasing the basicity of the PtTMeOPP solution in THF; Figure S3. The influence of phosphate buffer solution on the shape and intensity of the PtTMeOPP UV-vis spectrum; Figure S4. AFM images of PtTMeOPP deposited from different solvents by drop-casting; Figure S5. Influence of the ionic strength upon the UV-vis spectrum of PtTMeOPP in THF solution.

Author Contributions

Conceptualization, writing and review E.F.-C.; methodology, E.F.-C., A.L.; software, A.L., D.A.; validation, N.P. and D.V.; formal analysis and investigation, A.L., D.A. and M.B.; writing and original draft preparation, A.L. and E.F.-C.

Funding

This research was funded by UEFISCDI–Romania through PCCDI Project ECOTECH-GMP, Contract No. 76/2018, belonging to PNIII-Future and Emerging Technologies and partially by Programme 3—2019 from the Institute of Chemistry “Coriolan Dragulescu”, formerly the Institute of Chemistry Timisoara of the Romanian Academy.

Conflicts of Interest

The authors declare no conflict of interest.

References

  1. McCall, A.S.; Cummings, C.F.; Bhave, G.; Vanacore, R.; Page-McCaw, A.; Hudson, B.G. Bromine is an essential trace element for assembly of collagen IV scaffolds in tissue development and architecture. Cell 2014, 157, 1380–1392. [Google Scholar] [CrossRef] [Green Version]
  2. Olszowy, H.A.; Rossiter, J.; Hegarty, J.; Geoghegan, P.; Haswell-Elkins, M. Background levels of bromide in human blood. J. Anal. Toxicol. 1998, 22, 225–230. [Google Scholar] [CrossRef] [PubMed]
  3. Pavelka, S. Metabolism of bromide and its interference with the metabolism of iodine. Physiol. Res. 2004, 53, 81–90. [Google Scholar]
  4. Baker, C.; Kahn, S.E.; Bermes, E.W. Effect of bromide and iodide on chloride methodologies in plasma or serum. Ann. Clin. Lab. Sci. 1980, 10, 523–528. [Google Scholar] [PubMed]
  5. Frances, C.; Hoizey, G.; Lamiable, D.; Millart, H.; Trenque, T. Bromism from daily over intake of bromide salt. J. Toxicol. Clin. Toxicol. 2003, 41, 181–183. [Google Scholar] [CrossRef]
  6. Plaisen, S.; Cheewasedtham, W.; Rujiralai, T. Robust colorimetric detection based on the anti-aggregation of gold nanoparticles for bromide in rice samples. RSC Adv. 2018, 8, 21566–21576. [Google Scholar] [CrossRef]
  7. Kou, L.; Liang, R. Detection of bromide ions in water samples with a nanomolar detection limit using a potentiometric ion-selective electrode. Int. J. Electrochem. Sci. 2019, 14, 1601–1609. [Google Scholar] [CrossRef]
  8. Nguyen, T.K.D.; Ludwig, R. Quantitative determination of bromine and iodine in food samples using ICP-MS. Anal. Sci. 2014, 30, 1089–1092. [Google Scholar] [CrossRef]
  9. La Rosa Novo, D.; Eisenhardt Mello, J.; Soares Rondan, F.; Schneider Henn, A.; Azevedo Mello, P.; Foster Mesko, M. Bromine and iodine determination in human saliva: Challenges in the development of an accurate method. Talanta 2019, 191, 415–421. [Google Scholar] [CrossRef]
  10. McCullough, T.; Allaire, P.N.; Boettcher, B.R. Detection of chloride, bromide, and iodide following sodium fusion. J. Chem. Educ. 1970, 4, 217. [Google Scholar] [CrossRef]
  11. Koga, M.; Hara, K.; Hori, H.; Kodama, Y.; Okubo, T. Determination of bromide ion concentration in urine using a head-space gas chromatography and an ion chromatography. J. UOEH 1991, 13, 19–24. [Google Scholar] [CrossRef]
  12. Li, M.; Yu, H.; Zheng, X. Simultaneous analysis of iodate, iodide, bromate and bromide by ion chromatography with ultraviolet detection. Chin. J. Chromatogr. 2014, 32, 299–303. [Google Scholar] [CrossRef]
  13. ISO 10304-1:2007. Water Quality-Determination of Dissolved Anions by Liquid Chromatography of Ions—Part 1: Determination of Bromide, Chloride, Fluoride, Nitrate, Nitrite, Phosphate and Sulfate, 2nd ed.; ISO: Geneva, Switzerland, 2007. [Google Scholar]
  14. Sakai, H.; Fujiwara, T.; Kumamaru, T. Determination of inorganic anions in water samples by ion-exchange chromatography with chemiluminescence detection based on the neutralization reaction of nitric acid and potassium hydroxide. Anal. Chim. Acta 1996, 331, 239–244. [Google Scholar] [CrossRef]
  15. Borges, E.P.; Reis, B.F. Automatic flow analysis procedure for the determination of bromide in L-alanine by chemiluminescence detection. J. Braz. Chem. Soc. 2007, 18, 1336–1341. [Google Scholar] [CrossRef] [Green Version]
  16. Sheinin, V.B.; Ratkova, E.L.; Mamardashvili, N.Z. pH-Dependent porphyrin-based receptor for bromide-ions selective binding. J. Porphyr. Phthalocyanines 2008, 12, 1211–1219. [Google Scholar] [CrossRef]
  17. Qu, F.; Li, N.B.; Luo, H.Q. Polyethyleneimine-Templated Ag Nanoclusters: A New Fluorescent and Colorimetric Platform for Sensitive and Selective Sensing Halide Ions and High Disturbance-Tolerant Recognitions of Iodide and Bromide in Coexistence with Chloride under Condition of High Ionic Strength. Anal. Chem. 2012, 84, 10373–10379. [Google Scholar] [CrossRef]
  18. Takahashi, M.; Kinoshita, H.; Nishiguchi, M.; Nishio, H. Bromide detection in blood using energy dispersive X-ray fluorescence; a chemical marker supportive of drowning in seawater. Leg. Med. 2010, 12, 132–136. [Google Scholar] [CrossRef]
  19. Mutic, J.J.; Nikolic-Mandic, S.D.; Lolic, A.D.; Manojlovic, D.D. Determination of iodide and bromide by flow methods with amperometric detection. J. Anal. Chem. 2008, 63, 907–913. [Google Scholar] [CrossRef]
  20. Vlascici, D.; Fagadar-Cosma, G.; Plesu, N.; Lascu, A.; Petric, M.; Crisan, M.; Belean, A.; Fagadar-Cosma, E. Potentiometric sensors for iodide and bromide based on Pt(II)-porphyrin. Sensors 2018, 18, 2297. [Google Scholar] [CrossRef] [PubMed]
  21. Basel, C.L.; Defreese, J.D.; Whittemore, D.O. Interferences in automated phenol red method for determination of bromide in water. Anal. Chim. 1982, 54, 2090–2094. [Google Scholar] [CrossRef]
  22. Baso-Cejas, E.; Brito, G.; Dıaz, C.; Pena-Mendez, E.M. Determination of inorganic bromide content in several vegetable foods. Bull. Environ. Contam Toxicol. 2007, 78, 417–420. [Google Scholar] [CrossRef] [PubMed]
  23. Fagadar-Cosma, E.; Lascu, A.; Shova, S.; Zaltariov, M.F.; Birdeanu, M.; Croitor, L.; Balan, A.; Anghel, D.; Stamatin, S. X-Ray structure elucidation of a Pt-metalloporphyrin and its application for obtaining sensitive AuNPs-plasmonic hybrids capable to detect triiodide anions. Int. J. Mol. Sci. 2019, 20, 710. [Google Scholar] [CrossRef] [PubMed]
  24. Umezawa, Y.; Buhlmann, P.; Umezawa, K.; Tohda, K.; Amemiya, S. Potentiometric selectivity coefficients of ion-selective electrodes. Part I. Inorganic cations. Pure Appl. Chem. 2002, 74, 923–994. [Google Scholar] [CrossRef]
  25. Sanders, J.K.M.; Bampos, N.; Clyde-Watson, Z.; Garling, S.L.; Hawley, J.C.; Kim, H.J.; Mak, C.C.; Webb, S.J. Axial Coordination Chemistry of Metalloporphyrins. In The Porphyrin Handbook; Inorganic, Organometallic and Coordination Chemistry; Kadis, K., Smith, K.M., Guilard, R., Eds.; Academic Press: San Diego, CA, USA, 2000; Volume 3, Chapter 15; p. 4. ISBN 0-12-393200-3. [Google Scholar]
  26. Kruk, M.M.; Starukhin, A.S.; Mamardashvili, N.Z.; Mamardashvili, G.M.; Ivanova, Y.B.; Maltseva, O.V. Tetrapyrrolic Compounds as Hosts for Binding of Halides and Alkali Metal Cations. J. Porphyr. Phthalocyanines 2009, 13, 1148–1158. [Google Scholar] [CrossRef]
  27. Coury, L.A.; McGeoch, J.E.M.; Guidotti, G.; Brodsky, J.L. The yeast Saccharomyces cerevisiae does not sequester chloride but can express a functional mammalian chloride channel. FEMS Microbiol. Lett. 1999, 179, 327–332. [Google Scholar] [CrossRef]
  28. Lippert, A.R.; New, E.J.; Chang, C.J. Reaction-Based Fluorescent Probes for Selective Imaging of Hydrogen Sulfide in Living Cells. J. Am. Chem. Soc. 2011, 133, 10078–10080. [Google Scholar] [CrossRef]
  29. Jiang, X.; Chen, J.; Bajić, A.; Zhang, C.; Song, X.; Carroll, S.L.; Cai, Z.L.; Tang, M.; Xue, M.; Cheng, N.; et al. Quantitative real-time imaging of glutathione. Nat. Commun. 2017, 8, 16087. [Google Scholar] [CrossRef] [PubMed] [Green Version]
  30. Monti, D.; Nardis, S.; Stefanelli, M.; Paolesse, R.; Di Natale, C.; D’Amico, A. Porphyrin-Based Nanostructures for Sensing Applications. J. Sens. 2009, 2009, 856053. [Google Scholar] [CrossRef]
  31. Kielmann, M.; Prior, C.; Senge, M.O. Porphyrins in troubled times: A spotlight on porphyrins and their metal complexes for explosives testing and CBRN defense. New J. Chem. 2018, 42, 7529–7550. [Google Scholar] [CrossRef]
  32. Masih, D.; Aly, S.M.; Alarousu, E.; Mohammed, O.F. Photoinduced triplet-state electron transfer of platinum porphyrin: A one-step direct method for sensing iodide with an unprecedented detection limit. J. Mater. Chem. A 2015, 3, 6733–6738. [Google Scholar] [CrossRef]
  33. Pasternack, R.F.; Garrity, P.; Ehrlich, B.; Davis, C.B.; Gibbs, E.J.; Orloff, G.; Giartosio, A.; Turano, C. The influence of ionic strength on the binding of a water-soluble porphyrin to nucleic acids. Nucleic Acids Res. 1986, 14, 5919–5931. [Google Scholar] [CrossRef]
  34. Adotey, D.K.; Serfor-Armah, Y.; Fianko, J.R.; Yeboah, P.O. Essential elements content in core vegetables grown and consumed in Ghana by instrumental neutron activation analysis. Afr. J. Food Sci. 2009, 3, 243–249. [Google Scholar]
  35. Galdon, B.R.; Gonzalez, R.O.; Rodrıguez, E.R.; Romero, C.D. Comparison of mineral and trace element contents in onion cultivars (Allium cepa L.). J. Sci. Food Agric. 2008, 88, 1554–1561. [Google Scholar] [CrossRef]
  36. Dudley, H.C. Bromide content of fruits and vegetables. Ind. Eng. Chem. Anal. Ed. 1939, 11, 259–261. [Google Scholar] [CrossRef]
  37. Dudley, H.C.; Miller, J.W.; Neal, P.A.; Sayers, R.R. Studies on Foodstuffs Fumigated with Methyl Bromide. Publ. Health Rep. (1896–1970) 1940, 55, 2251. [Google Scholar] [CrossRef]
  38. Pflaum, R.T.; Frohliger, J.O.; Berge, D.G. The Direct Potentiometric Determination of Bromide Ion. Anal. Chem. 1962, 34, 1812–1814. [Google Scholar] [CrossRef]
  39. Agarwal, S. Potentiometric Titration of Chloride and Bromide in the Presence of Each Other. Metrohm Application Bulletin. No. 27/2e. Available online: https://www.metrohm.com/en-sg/applications/AB-027 (accessed on 2 April 2019).
Figure 1. Structure of Pt(II) 5,10,15,20-tetra(4-methoxy-phenyl)-porphyrin (PtTMeOPP).
Chemosensors 07 00021 g001
Figure 2. Superposed UV-vis spectra for the spectrometric detection of bromide ions. The inset shows the isosbestic points on the Q band (495 nm; 528 nm).
Chemosensors 07 00021 g002
Figure 3. Linear dependence between the intensity of the absorption read at 405 nm and the Br concentration.
Chemosensors 07 00021 g003
Figure 4. Overlapped UV-Vis spectra showing the effect of potential interfering anions on PtTMeOPP solution. (a) Detail of the Soret bands with 100-fold (b) and 1000-fold (c) higher concentration of interferences than the Br concentration.
Chemosensors 07 00021 g004
Figure 5. Graphical representation of the differences in absorption intensity produced by several interfering ions upon PtTMeOPP, at concentrations 100-fold or 1000-fold higher than that of Br.
Chemosensors 07 00021 g005
Figure 6. Sensing of bromide ions by their axial coordination to platinum metal in the center of porphyrin above and below the plane of the molecule by a Lewis acid–base reaction.
Chemosensors 07 00021 g006
Figure 7. Atomic force microscopy (AFM) images (color and shadow map), topography and size distribution for PtTMeOPP from tetrahydrofuran (THF) solution (ad) and after treatment with bromide (eh).
Chemosensors 07 00021 g007
Table 1. Summary of bromide detection methods.
Detection MethodSensitive Compound/Sample PreparationsDetection Limit/SampleAdvantagesDraw-BacksReference
Inductively coupled plasma mass spectrometry 1717 mg/L/from blood serum Very expensive[5]
Inductively
coupled plasma mass spectrometry
0.68 ng/g/from different vegetablesAccurateVery expensive[8]
Inductively coupled plasma mass spectrometryMicrowave-induced combustion and microwave-assisted alkaline dissolution were considered suitable for sample preparations of Br and I in saliva by ICP-MS0.052 μg mL−1/from human salivaMicrowave-assisted alkaline dissolution is more efficient for sample preparation [9]
Colorimetric detectionAuNPs aggregation capacity in the presence of Br prevented by Cr3+3.12−5.21 mg kg−1/from riceRobust, selective, precise [6]
Thin layer chromatographyMetallic sodium for sodium fusion with halide ionsUnprecise/from synthetic
solutions
Obsolete and dangerous[10]
Head-space gas chromatography (GC) and ion chromatography coupled with a conductive detector 7.7 mg/L/from human urineAccurateExpensive[11]
Ion chromatography with ultraviolet detectionExtraction in ionic liquids0.16 mg/L/from underground waterNo influence of other halide ions [12]
Liquid chromatography of ions 0.05 mg/l/from tap waterIt represents the standard method last reviewed and confirmed in 2016 [13]
Ion exchange coupled with chemo-luminescence 100 ng/mL/from river water, ground waterRapid, inexpensive and simple [14]
Automatic flow analysis, chemo-luminescenceLuminol, T-chromate8.9 μg L−1/from L-alaninePreciseExpensive[15]
SpectrophotometryDeprotonated form of 2, 8, 12, 18-tetramethyl-3,7,13,17-tetrabutyl-H21, H23-porphine3 × 10−8 M/from synthetic
solutions
Sensitive,
inexpensive
[16]
SpectrophotometryPolyethyleneimine-capped Ag nanoclusters as fluorescent and colorimetric platform0.1−14 μM/from waterSimple, rapid, reliable, inexpensive [17]
Energy dispersive X-ray fluorescence spectrometry 19.7 μg/mL/from
drowned bodies
Indicator for drowning in seawaterLow sensitivity, long time, tedious[18]
Flow injection analysis coupled with amperometric detectionPlatinum electrode50.0 nM/from water, pharmaceutical preparations and biological materialFast, accurate [19]
PotentiometryMeso-tetraphenylporphyrin manganese(III)-chloride0.010–1.0 μM/from water, synthetic solutionsEfficient [7]
PotentiometryPt(II) 5,10,15,20-tetra(4-methoxy-phenyl)-porphyrin as ionophore, dioctylphtalate (DOP) as plasticizer, polyvinylchloride (PVC) as support and tridodeocylmethylammonium chloride (TDMACl) as additive8 × 10−6 M/from synthetic solutions and pharmaceuticalsFast, sensitive and reliable [20]
Segmented flow analysis in automated Phenol red methodOxidation of bromide to bromine by chloramine-T, followed by electrophilic substitution of the bromine on phenol red (PR) to produce bromophenol blue (BPB)10 μg/L/from waterNo interference from chloride [21]
Phenol red spectrophotometry 3.63–19.02 mg kg–1/from capsicum, potatoes and fungiFast, suitable for routine determinations [22]
Table 2. Determination of bromide in garden onion samples.
SampleUV-Vis Detection (mg/Kg)Found by Potentiometry (mg/Kg)
Garden onion (Romania, Cenad)97.27 ± 0.6
Garden Bio Onion (Romania, Malovat)82.17 ± 0.977.95 ± 1.7

