Abstract
Biomolecule immobilization on bulk silicon dioxide (SiO2) is an important aspect in the field of Si-based interfaces for biosensing. The approach used for surface preparation should guarantee not only the stable anchoring of biomolecules but also their structural integrity and biological functioning. In this paper, we review our findings on the SiO2 functionalization process to immobilize a variety of biomolecules, including glucose oxidase, horseradish peroxide, metallothionein, and DNA molecules. Morphological and chemical characterization of SiO2 surfaces after biomolecule immobilization using techniques already employed in the microelectronic industry are presented and discussed. Optical and spectrophotometric analysis revealed the preservation of biomolecules’ activity once they are anchored on the biointerface.
Keywords:
biointerface; silicon; ssDNA; glucose oxidase; horseradish peroxide; metallothionein; TEM; XPS 1. Introduction
The biointerface is the region in which the biological element (biomolecule, cell, tissue or living organism) interacts with an inorganic/organic material to generate a bioactive smart surface, suitable for different applications such as neural interfaces, engineered microenvironments, regenerative medicine, nanotube/nanoparticle drug delivery, and, especially, biosensing [1,2,3,4,5]. The biointerface plays a key role in the transduction process of a biosensor; it is the gate by which a biological event, coming from a reaction between the sensing element and the target, is converted into a qualitative and quantitative signal.
Biomolecules, such as DNA and proteins (especially enzymes), are widely used as sensing probes in biosensors. DNA chips, glucose sensors, and immunochips are some of the countless sensors based on biomolecules, in which the probe activity is critical for triggering the sensing reaction [6,7]. For example, DNA sensors are based on the hybridization between a ssDNA probe, anchored on the surface, and the complementary ssDNA target. The signal of the recognition event can be detected with optical, electrical, or electrochemical transduction mechanisms [8,9,10,11,12].
The bioactivity of the sensing element at the biointerface, however, is quite sensitive to both the surface physical‒chemical properties and the immobilization method used for the biointerface development. In this sense, several materials have been fully tested and characterized and, among them, silicon dioxide (SiO2) was found to be a very appealing material [13,14,15,16]. Silicon dioxide is widely diffused in nature, where it can be found in both amorphous and crystalline forms and in a variety of living organisms. Many natural and synthetic compounds such as sandstone, silica sand, quartzite, and aerogels are made of SiO2 and it is also suitable for silicate glasses and ceramics production, and as a component in the pharmaceutical industries and microelectronics, as an electrical insulator [17,18]. Compared to more conventional plastic materials, SiO2 properties perfectly match with the derivatization process required for biointerface development, providing the possibility of miniaturization and integration for the so-called “intelligence on board”.
The other big challenge in biosensor development is the biomolecule immobilization process. Actually, the immobilization protocol must not affect the surface and the anchoring of biomolecules must prevent their denaturation or loss of activity. Additionally, the probe orientation should be well-defined and readily accessible to the target. A crucial point to be addressed is the approach used to covalently bind the molecule to the solid surface. The approach used and the strategy applied are finalized to obtain the maximum surface coverage, avoiding the loss of biomolecule activity [19,20,21,22,23,24,25] and preventing inorganic material deterioration due either to the immobilization reagents used or to the biomolecule net charge (as in the case of DNA), which may affect the SiO2 integrity. This is especially true for porous Si, where material corrosion has been reported [26].
Over the years, many different biomolecules have been covalently anchored on SiO2 [27]: DNA strands [28,29], enzymes [14,30], and even whole cells [31].
Methods for covalent immobilization share a common procedure and are generally composed of three steps: modification of the surface to add specific functional groups, covalent attachment of a cross-linker through one of its reactive moieties, and covalent linking of the biomolecule.
The two mostly used approaches in this field are based on the use of 3-aminopropyltriethoxysilane (APTES) and 3-glycidoxypropyltrimethoxysilane (GOPS). The APTES approach, widely used [25] and fully described elsewhere [21,22,23,24], is in four steps: (i) oxide surface cleaning and activation; (ii) silanization, carried out using APTES solution or vapors to obtain an amino finished surface; (iii) glutaraldehyde (GA) derivatization, used as a linker molecule, in order to anchor the biomolecules by amino groups. The GOPS protocol, instead, consists of: (i) surface cleaning by oxidation and hydroxyl activation; (ii) silanization; (iii) deposition and anchoring of biomolecule; and (iv) blocking of the active surface.
In this paper, we report our findings using APTES and GOPS bio-derivatization of the bulk SiO2 surface, showing a series of results obtained with the most representative molecules in biosensing: glucose oxidase, horseradish peroxide, metallothionein, and ssDNA. The idea was to use techniques commonly employed in the microelectronics field in order to reduce the gap in the technological transfer toward the industry. To this end, we focused our work on Transmission Electron Microscopy (TEM) and X-ray Photoelectron Spectroscopy (XPS) analysis of the SiO2 surface after the immobilization process and spectrophotometric and optical analysis of biomolecule activity once they are immobilized, proving high performance of SiO2 as a surface for biointerfaces.
2. Biomolecule Immobilization
2.1. SiO2 Preparation
For all functionalizations, a bulk SiO2 surface was prepared by thermal growth at 850 °C for 70 min in an oxygen environment on a silicon wafer (20 µm epitaxial Si layers with a resistivity of ~2 Ω cm, 7 µm thick, grown on heavily doped CZ substrates, ~1 mΩ cm, B doped). The final sample was cut into 25 mm × 75 mm slides. They were washed in deionized water for 20 min and then used for the immobilization step.
2.2. Quality Check of Immobilization Process
Transmission Electron Microscopy (TEM) and X-ray Photoelectron Spectroscopy (XPS) are two useful analysis tools to characterize the SiO2 surface after the immobilization process.
In this work, TEM analysis was performed by using Jeol (Akishima, Tokyo, Japan) Jem 2010 F and Jeol Jem 2010 microscopes. The first exploits a thermionic source of lanthanum hexaboride (LaB6), while the second has a thermionic tungsten filament and is assisted in the electric field by a GIF (Gatan Imaging Filter) that allows us to obtain TEM images and related chemical maps’ filtering energy; this was obtained by using the three-window method on the k edges of the element. Samples were observed in cross section, prepared by mechanical thinning and argon ion milling. To avoid mixing between the epoxy glue and the surface organic layer, each sample was covered with a thin aluminum layer (~50 nm).
XPS characterizations were performed using a Kratos (Manchester, UK) AXIS-HS spectrometer. The Mg Kα1,2 of 1253.6 eV was used at the conditions of 10 mA and 15 keV with a pass energy of 40 eV. During the analysis, the residual pressure in the chamber was 10−7 Pa.
2.3. SiO2 Biointerfaces
2.3.1. Protein Immobilization
We performed a series of immobilizations using both APTES- and GOPS-based methods with three types of proteins that are widely used as probes in biosensing, glucose oxidase, horseradish peroxide, and metallothionein, as reported in [32]. The complete protocols and schemes are reported in Appendix A.
Glucose oxidase is a 160 kDa homodimer globular enzyme that catalyzes the oxidation of β-d-glucose to α-gluconolactone in order to regulate the glucose concentration in blood, and is typically used in glucose biomedical sensors. Horseradish peroxide is a 44 kDa enzyme that catalyzes the oxidation of various organic substrates, including luminol in forensic applications. Metallothionein is a 7 kDa cysteine-rich protein that binds heavy metals such as silver (Ag), cadmium (Cd), zinc (Zn), copper (Cu), and mercury (Hg), useful in environmental contamination sensing.
We employed different types of proteins, in terms of biological activity (catalysis vs. homeostasis) and dimensions, proving the versatility of SiO2 towards the biological functionalization.
Moreover, the two approaches we used furnished information that will help us find the best compromise between procedural complexity and immobilization yield. Both methods, in fact, have some common steps but, also, some differences such as the silane group used for the surface derivatization. The APTES leaves an amino-terminated surface, which is not suitable for the direct binding of the biomolecules’ amino groups. For this reason, the introduction of the GA bridging molecule is needed. The second protocol, instead, uses the GOPS silane, which leaves the epoxide terminal functional group ready to open and react directly with the amines of the biomolecules, leading to a savings in time and cost.
The success of protein immobilization has been fully characterized.
The XPS analysis of both APTES- and GOPS-based derivatization is reported in Figure 1 and Figure 2, focusing on C1s and N1s peaks, respectively. The study of these peaks provides information on the presence of organic and biological molecules on the SiO2 surface. The atomic relative abundance of the observed atoms is reported in Table 1. The elements reported are those detected in a suitable concentration compared to the overall composition of biomolecules.
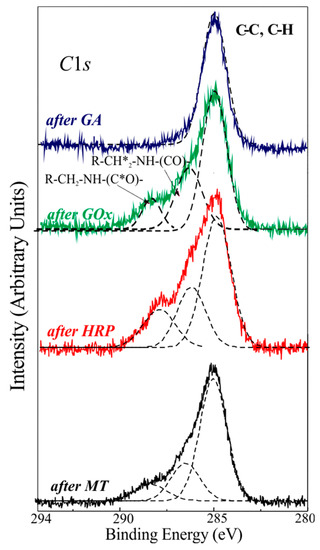
Figure 1.
XPS C1s spectral regions of the samples after the various protocol steps: after GA anchoring (blue line); after binding of GOx (green line), HRP (red line) and MT (black line) proteins. Simulation of C1s components (black dashed line).
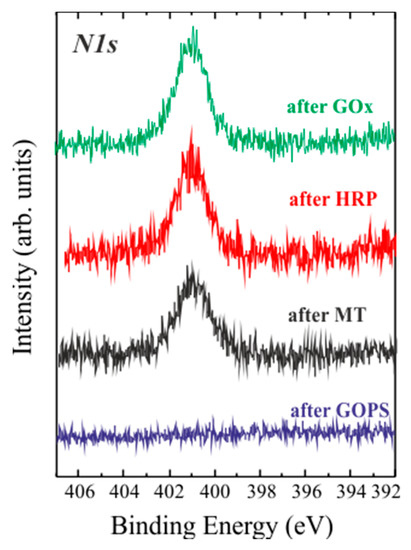
Figure 2.
XPS N1s spectral regions of the samples after the various GOPS derivatization steps: after GOPS (blue line) addition; after binding of GOx (green line); HRP (red line) and MT (black line).

Table 1.
Relative abundance (% of atoms) of the measured elements (C, O, N, Si) after each step of the immobilization protocol.
XPS high-resolution C1s spectrum from APTES derivatization, in Figure 1, on the surface after GA addition (blue line), exhibits a peak centered at 284.8 eV, assigned to C–C and C–H bonds, which is assumed as a reference for the binding energy scale. Quite different is the C1s spectrum shape for samples fully processed with biological molecules. Samples after GOx, HRP, and MT anchoring (green, red, and black lines) exhibit a C1s spectrum with more features, with a component centered at 284.8–285 eV, assigned to C–C and C–H bonds far from functional groups. Moreover, two additional components can be observed at 286.3–286.5 eV and 288.3–288.6 eV, assigned to R–CH2*–NH–(CO)– and R–CH2–NH–(C*=O)-chemical groups, respectively, which are typical of the immobilized proteins [22]. The three different components were simulated for all spectra and the results are plotted as black dashed lines in the same figure.
The relative atomic concentrations for the measured samples are reported in Table 1.
In Figure 2 the data after GOPS polymerization and GOx/HRP/MT binding are reported. In this case, the N1s peak is detected only in fully processed surfaces, as expected if proteins were present on SiO2, while a surface without biomolecules does not exhibit any signal due to nitrogen.
2.3.2. DNA Immobilization
The SiO2 surface must be properly functionalized to anchor a pool of ssDNA oligonucleotide probes for microarray preparation [33]. A different approach considers the possibility to “grow” the DNA strand directly on the surface by a base-by-base immobilization [25]. This last method has the advantage of having a DNA strand immobilized for each silane molecule. The results shown in [25] indicate enhancement in the DNA-strand presence of a factor 5.
To perform DNA immobilization, we adopted the GOPS derivatization protocol and a specific spotting layout reported in Appendix A.2 and Appendix A.3, respectively. Also in this case, the effectiveness of DNA immobilization was investigated by TEM and XPS analysis.
For the TEM observations of DNA-coated SiO2, cross sections were prepared as described in Section 2.2 and the results are reported in Figure 3. In more detail, in Figure 3a the bright field image of the sample cross section is shown, while in Figure 3b we observed a clear thin C layer through the filtered energy map, which further confirmed the ssDNA successful immobilization.
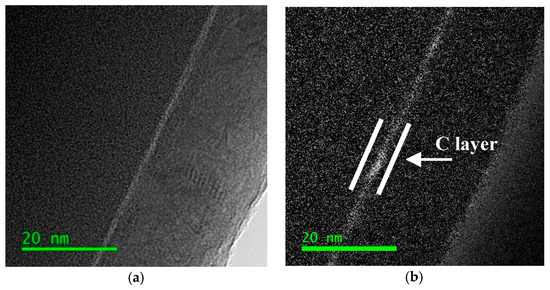
Figure 3.
DNA-coated SiO2 cross section (a) in bright field, (b) carbon map. Detail of carbon signal from immobilized ssDNA (white lines).
The C map of the reference sample (not shown) revealed no carbon signal, since no DNA molecule was fixed on the surface.
The XPS high-resolution C1s spectra of SiO2 surface before and after ssDNA immobilization are reported in Figure 4. The ssDNA-coated silicon sample (Figure 4b) showed an increase of C1s spectra components 2 and 3 with respect to the reference SiO2 sample (Figure 4a), while component 1 did not change. The spectral features are attributed to the presence of ssDNA, since component 2 is associated with a C=OH–N type structure, related to the hydrogen interactions of GC bases and AT. The component 3 with N–(CO)–N type structures of G, C, and T bases. Component 1, instead, is related to the C=C and C–C bond, and thus a common feature to both DNA and BSA-passivated SiO2.
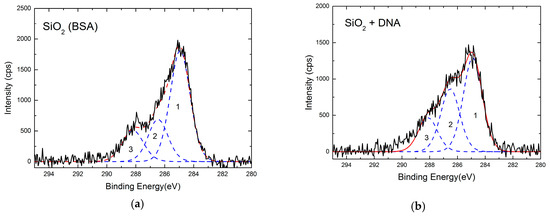
Figure 4.
XPS high-resolution C1s spectra of SiO2 surface before (a) and after (b) ssDNA immobilization (black line). Details of C1s peak components (blue dashed lines) and their convolution (red dashed line) are also shown.
The relative atom concentrations for the measured samples are reported in Table 2.
Table 2.
Relative abundance (% of atoms) of the measured elements (C, O, N, Si) after each step of the immobilization protocol.
The effectiveness of covalent anchoring is clearly visible by TEM inspection. In fact, the later immobilization using van der Waals forces caused a rapid deterioration of the biological layer during TEM analysis. It is clearly visible by inspecting a bacteriorhodopsin membrane anchored on a SiO2 surface (Figure 5a). Even if the TEM plan view shows a nice ordinated structure, clearly visible by the selected area electron diffraction (SAED) pattern (Figure 5b), after 2 min the long-range order is lost (Figure 6b) and the bright-field (BF) image (Figure 6a) shows the membrane is wrapped up on itself.
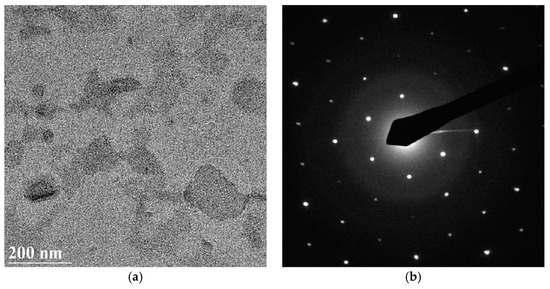
Figure 5.
BF (a) and SAED pattern (b) of a bacteriorhodopsin membrane.
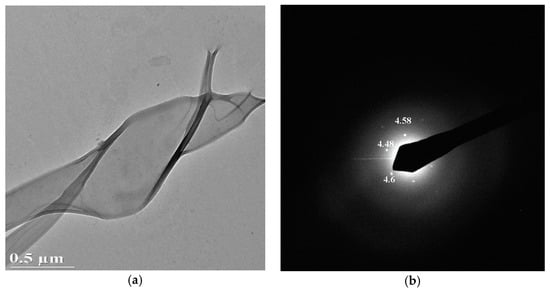
Figure 6.
BF (a) and SAED pattern (b) of bacteriorhodopsin membrane after 2 min of observation.
3. Bioactivity Test
Once immobilized, the biomolecules’ activities were tested using different approaches. This phase is essential since the derivatization protocol must ensure the structural and functional preservation of molecules and, at the same time, the functioning of the final biointerface.
An example of validation was performed for the glucose oxidase activity [32]; this was determined by analyzing the concentration of H2O2 released in presence of glucose, using a commercial spectrophotometric glucose assay kit, available from Megazyme (Bray, County Wicklow, Ireland). In the presence of peroxidase, H2O2 trigs a reaction involving p-hydroxybenzoic acid and 4-aminoantipyrine resulting in the production of a quinoneimine dye complex, measured at 510 nm. This spectrophotometric analysis was performed for both an APTES-immobilized (red triangles) and a 0.002 U/mL aqueous solution of GOx (blue diamonds) as shown in Figure 7a.
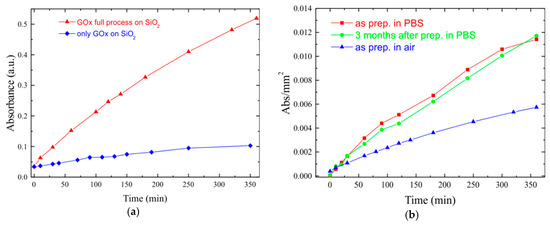
Figure 7.
(a) GOx activity as a function of time for a SiO2 sample fully processed (red triangles) and in solution (blue diamonds). (b) Effect of storage conditions on enzymatic activity of GOx coated SiO2 samples stored (2 days) in air (blue triangles) or in PBS (red squares) and stored in PBS for 3 months (green circles).
The immobilized GOx perfectly reproduces the behavior of GOx solution, thus proving that the molecule preserved its biological activity during the immobilization process and that the biointerface with SiO2 is fully functioning.
Moreover, the immobilized GOx bioactivity was characterized by changing both the time and the conditions of storage. Figure 7b reports the monitoring of enzymatic activity for up to three months of GOx-coated SiO2 samples stored in PBS at 4 °C (red squares) and in air (blue triangles) at room temperature and then measured by spectrophotometry analysis.
Results show that samples stored in air exhibit an enzymatic activity much lower than that of the samples stored in PBS at 4 °C. More interesting is the comparison with samples stored for three months (green circles in Figure 7), which clearly show the long-term stability of the sensing element.
The results above reported were obtained after an optimization of the protocol, performed by adding a first step of oxide activation; modifying the sample exposure to APTES and changing the immobilization times from 1 h up to 24 h. The protocol effectiveness was tested with respect to the application, i.e., the immobilized biomolecule activity. As an example in Figure 8 we summarize some of the results obtained by monitoring the immobilized GOx activity as a function of the various protocol modification. The importance of oxide activation (the first immobilization step reported above) was evaluated by comparing the same immobilization procedure with and without this step (all the other steps were identical and performed at the same time). The results, summarized in Figure 8, clearly indicate that the oxide activation step (black squares) has an influence in the final number of bioactive molecules. In fact, an increase in activity of more than 20% is observed if the oxide is activated (optimized process green triangles). This is due to the fact the SiO2 growth takes place in a dry ambient (O2) hence a higher percentage of bonds on the surface is passivated with respect to a SiO2 grown in a wet ambient (H2O). In addition, the biomolecule immobilization time was changed and the results varied from 2 h (red dots) up to 24 h. The bioactive molecules on the surface increases by increasing the immobilization time reaching a maximum at 12 h (time used in the optimized process). A longer exposure to the GOx solution does not produce any increase in the bioactivity per square millimeter. Finally, we also tested the unspecific bonds to the SiO2 surface by dipping an unfunctionalized sample in the GOx solution for 12 h (blue triangles). Part of the GOx bind to the surface with unspecific bonds but, after a prolonged washing procedure, introduced at the end of the optimized protocol, no activity is observed (data not shown). Moreover, we tested different approaches to derivatize the surface with APTES. We started with a 1% APTES solution in an ethylene solution [25,26] but we found diffused silane polymerization and a reduced biomolecule activity (quite close to the only GOx sample of Figure 8). A better result was obtained by immersing the sample in an undiluted APTES solution, with a reduction of about 30% in the GOx activity with respect to the optimized immobilization protocol (data not shown). The best result (reported in Figure 8) was obtained by exposing the sample to APTES vapors in a homemade chamber. APTES was evaporated on the sample surface placed directly on top of the APTES dish.
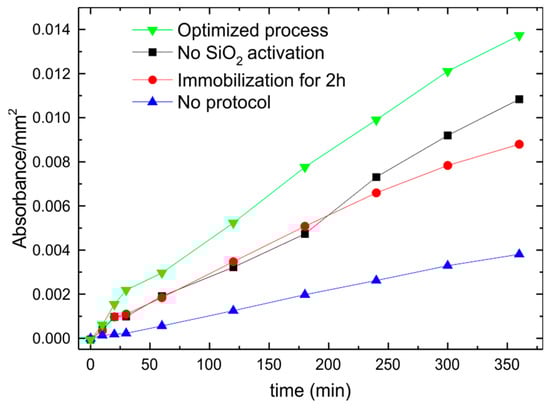
Figure 8.
GOx activity as a function of time for a SiO2 samples fully processed with a protocol: optimized (green triangles); not including the oxide activation (black squares); with a GOx immobilization time of 2 h (red dots). The comparison with a sample that underwent only to the GOx immobilization step (blue triangles) is also shown for comparison.
MT activity on immobilized SiO2 was also tested. In this case, we performed XPS measurements (Figure 9) of a clean and MT-coated SiO2 sample after soaking in 100 µg/mL Ag salts solution.
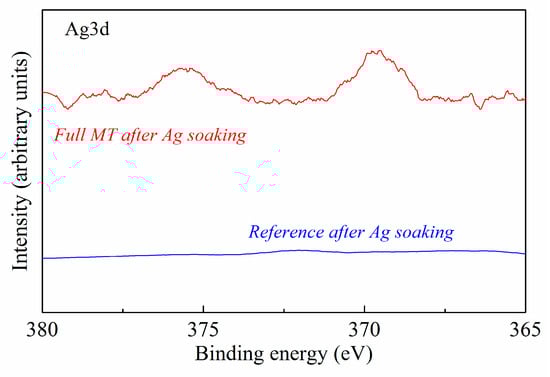
Figure 9.
XPS spectra of Ag3d peak of the MT-coated SiO2 after Ag soaking (red line) compared to the clean SiO2 reference sample (blue line).
XPS analyses revealed the presence of silver on the MT-coated surface, while the reference sample does not exhibit traces of Ag after soaking in the same solution. This proves that the protein maintained its typical structure and biological activity after the immobilization process, binding and keeping a heavy metal trace in solution.
Further functioning tests were performed on ssDNA-immobilized molecules. In this case, the molecule bioactivity consists of the ability of ssDNA to hybridize the complementary strand in a typical microarray system. To verify the process, a standard microarray hybridization experiment was executed on SiO2 using a DNA perfect match as the target (the procedure is fully described in Appendix A.3). Subsequently, we performed an optical characterization of the sensitive layer before and after hybridization. The images of the printed array were collected by an In-check® optical reader, developed by STMicroelectronics (Geneva, Switzerland), using 60 ms as exposure time [34]. Data of fluorescence images and the related intensities are reported in Figure 10.
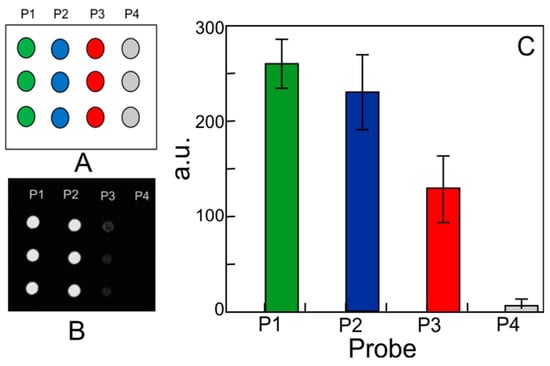
Figure 10.
Microarray hybridization experiment: (A) microarray layout; (B) SiO2 fluorescence images after hybridization with Cy5-labed DNA PM targets; (C) fluorescence intensity analysis for P1, P2, P3, and P4 probes for the SiO2 surface.
It can be noticed that DNA-coated SiO2 exhibits for all probes a specific trend of fluorescence intensities, as expected considering the types of probes anchored on the surface (CV% values are 10% for P1, 17% for P2 and 27% for P3). These results prove that DNA molecules maintained their hybridization ability, so the immobilization procedure does not affect the biointerface functioning.
We also proved DNA bioactivity preservation by an electrical characterization in a MOS-like device (data not shown).
4. Discussion
We reported some advancements in SiO2-based biointerface preparation and characterization using techniques typically employed in microelectronic device characterization. In particular, we focused on: (i) SiO2 functionalization, (ii) quality of biomolecule immobilization, (iii) biomolecule activity. In biointerfaces it is essential that the sensing element maintain its specific activity in order to guarantee the transduction process in biosensing. In this sense, the binding must be controlled, since if the biomolecule is anchored too tightly its flexibility may be reduced, thus reducing the functionality. Moreover, the biomolecule must be correctly oriented and not too crowded, so that the active site can be exposed, allowing biological interactions with targets.
Silicon dioxide surface and covalent immobilization are the best compromise to solve all of the above issues. Other types of material and interactions could cause a possible gradual deterioration of the biological layer once fixed. For example, the van der Waals forces immobilization we used for the deposition of bacteriorhodopsin caused its wrapping after only 2 min of exposure to the TEM electron beam, for the observation.
In this sense, we performed a complete and exhaustive series of functionalizations of SiO2 with glucose oxidase, horseradish peroxide, metallothionein, and ssDNA using both APTES and GOPS covalent immobilization. These protocols differ mainly for the residual group exposed before the immobilization. The APTES leaves an amino-terminated surface, which is not suitable for the direct binding of the biological molecules’ amino groups. The introduction of a bridging molecule, GA, is needed. The second protocol uses the GOPS silane, which leaves the epoxide terminal functional group ready to open and react directly with the amines of the biomolecules [35,36,37,38]. This methodological divergence allowed us to prove the versatility of SiO2 as a surface material for covalent immobilization. For DNA immobilization, we would like to point out that the use of previously prepared sequences reduces the possibility of errors in the final gene, more frequent if an in situ growth procedure for DNA probe formation is used, and is time-saving with respect to other methods.
The XPS high-resolution C1s and N1s spectra, coming from the chemical bonds of biomolecules and TEM characterization, allowed us to confirm the persistence of sensing elements on SiO2 at the end of the immobilization protocols.
Once we proved their fixing, we tested the functionality of biomolecules by spectrophotometric measurements for GOx enzymatic activity, XPS for MT ability of interaction with heavy ions, and optical microarray measurements for DNA hybridization.
GOx fixed on SiO2 reproduces well the behavior of GOx in solution. The quinoneimine dye absorbance at 510 nm, triggered by the GOx activity in the presence of glucose, increases as a function of time in the same way for both samples, confirming that the enzyme did not lose its activity during the immobilization process.
MT bioactivity was also confirmed. In this case, we tested the protein ability to bind heavy metals by submerging samples of MT-coated SiO2 and clean SiO2 (as a reference) in an Ag solution. The XPS Ag 3d spectrum of the MT-coated surface and the negative signal from the reference sample proved that MT maintained its typical structure and biological activity after the immobilization process, binding and keeping the Ag in solution.
DNA-coated SiO2 samples exhibit unchanged bioactivity of immobilized ssDNA. The P2 and P3 probes in microarray, in fact, showed a fluorescent signal that only the hybridization with the specific labeled targets could provide. Moreover, fluorescence intensity perfectly reproduced the expected trend, which was a decrease passing from the P1 positive control to the P4 negative.
5. Conclusions
A complete study of SiO2 functionalization for biointerface development has been reported by using techniques normally employed in the microelectronics industry. The results confirm the effectiveness of using SiO2 to accomplish the assembly and preserve the functionality of biointerfaces. All issues in biofunctionalization in terms of probes’ flexibility, orientation, and integrity have been solved so that the immobilization strategy, together with the physical and chemical properties of SiO2, could extend the range of applications of Si-based biointerfaces into new frontiers of biosensing, paving the way for future integrations in smart devices and mobile systems.
Author Contributions
Conceptualization, S.L. and E.L.S.; formal analysis, investigation and data curation, E.L.S., T.C., S.L., C.B. and A.S.; writing—original draft preparation, E.L.S.; writing—review and editing, E.L.S. and S.L.; supervision, S.P., S.C., F.S. and S.L.; project administration, S.L.
Funding
This research received no external funding.
Acknowledgments
E.L.S. acknowledges the regional project “Sviluppo ed applicazione di tecnologie biosensoristiche in genomica” [CIP 2014.IT.05.SFOP.014/3/10.4/9.2.10/0008, CUP G67B17000170009] for funding the time spent on this activity.
Conflicts of Interest
The authors declare no conflict of interest.
Appendix A
Appendix A.1. APTES Protocol for Biomolecule Immobilization
APTES immobilization protocol consists of four steps [21,22,23,24]; the complete protocol is schematized in Figure A1. The first is an oxide activation through a process in SSC solution (H2O:H2O2:NH4OH with the ratio 10:1:1), which cleans it of any contaminants and leaves the surface with OH-terminated groups. The second step is silanization, carried out using 3-aminopropyltriethoxysilane (APTES), which terminates the surface with ‒NH2 groups. It can be performed in two ways: either by dipping the sample in an undiluted APTES solution for 20 min, or exposing the sample to APTES vapors for the same amount of time. We found the second method to be the best for SiO2 functionalization. In fact, silane polymerization was completely avoided by using APTES vapors. The third step is the anchoring of the linker molecule glutaraldehyde (GA) 2.5% in phosphate buffer solution (PBS), which is used to bind the biomolecule amino groups, allowing interaction and immobilization on the SiO2 surface. Finally, the last step is performed by keeping the substrate overnight (from 10 to 12 h) in a solution at room temperature containing the biomolecule to a concentration in the range 500 µg–2 mg/mL and 0.1 M of PBS (pH 6.5–RT). The same active biomolecule concentration per square millimeter was found in the range indicated. The functionalized biointerface is then washed three times in water and stored in PBS solution at 4 °C if not immediately used.
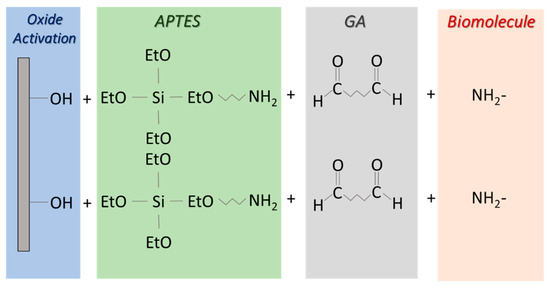
Figure A1.
Schematic view of APTES protocol for biomolecule immobilization.
Appendix A.2. GOPS Protocol for Biomolecule Immobilization
The process, schematized in Figure A2, starts with a surface cleaning step (SC1), performed using an oxidizing solution (H2O:H2O2:NH4OH, 5:1:1) at 80 °C for 5 min. After that, the surface is rinsed with deionized water and activated by treatment in an acid solution (HCl:H2O, 1:7.5) at room temperature for 10 min (SC2). After a drying step, a silanization reaction (SIL) is carried out by immersion for 4 h in toluene and 1% GOPS, under a nitrogen atmosphere. This step is performed using Glovebox equipment (MBraun, Garching, Germany) under controlled humidity and oxygen levels. The substrate is then rinsed with toluene and dried. A final curing process is performed at 120 °C for 30 min. Subsequently, biomolecules are fixed on the surface by an anchoring step (4 h at 30 °C, 90% RH) followed by a passivation process in BSA 1%, SDS 0.1%, and SSC 20× (15 h at 55 °C). Then, the functionalized biointerface is rinsed in deionized water, dried, and stored.
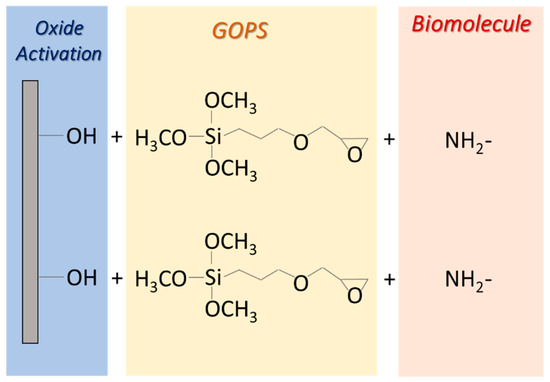
Figure A2.
Schematic view of GOPS protocol optimized for biomolecule immobilization.
Appendix A.3. Microarray Preparation
The microarray was prepared using 25 bp 5′-amino-derivatized single-strand DNA (ssDNA) designed as follows: (P1) NH2-C6-5′-CACAACACAGTACCTGACATGGCG-3′-CY5 (printing control), (P2) NH2-C6-5′-AGTGAGGGAGGAGATGGAACCATCT-3′ (hybridization control), (P3) NH2-C6-5′-GCAGAGCCATCTATTGCTTAC-3′ (PCR product), (P4) NH2-C6-5′-AAAAAAAAAAAAAAAAAAAC-3′ (negative control) and (T1) 3′-Cy5 labeled-TCACTCCCTCCTCTACCTTGGTAGA-5′ (complementary to P2). These probes were spotted on the SiO2 surface following the layout reported in Figure A3. After the immobilization, a hybridization reaction was performed using Cy5-labeled perfect-match oligonucleotides, complementary to the P2 and P3 probes, at concentrations of 15 nM at 55 °C for 50 min, spotted as specified in Figure A3. The DNA hybridization temperature used (55 °C) is the optimum annealing temperature to guarantee the minimum value of free energy (ΔG) for the hybridized double-strand product, considering also the effect of the surface, as determined by free simulation software [39].
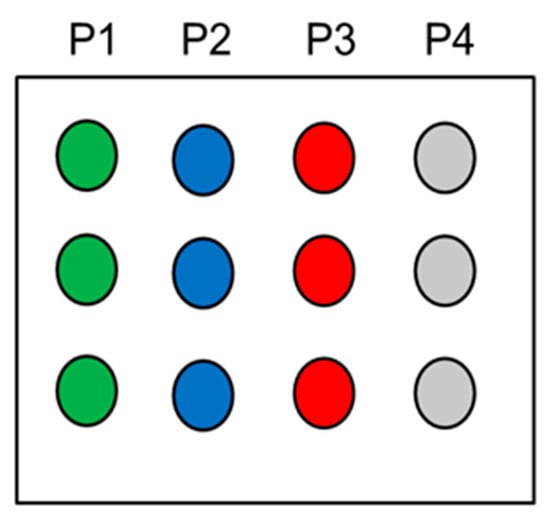
Figure A3.
Spotting layout of DNA microarray: Cy5-labeled P1 probe, positive control (green circles); P2 probe + Cy5-labeled P2 target, hybridization control (blue circles); P3 probe + Cy5-labeled P3 target, PCR product (red circles); P4 probe, negative control (grey circles).
References
- Chen, D.; Wang, G.; Li, J. Interfacial Bioelectrochemistry: Fabrication, Properties and Applications of Functional Nanostructured Biointerfaces. J. Phys. Chem. C 2007, 111, 2351–2367. [Google Scholar] [CrossRef]
- Xu, X.; Kratz, K.; Wang, W.; Li, Z.; Roch, T.; Jung, F.; Lendlein, A.; Ma, N. Cultivation and spontaneous differentiation of rat bone marrow-derived mesenchymal stem cells on polymeric surfaces. Clin. Hemorheol. Microcirc. 2013, 55, 143–156. [Google Scholar] [CrossRef] [PubMed]
- Dreaden, E.C.; Austin, L.A.; Mackey, M.A.; El-Sayed, M.A. Size Matters: Gold Nanoparticles in Targeted Cancer Drug Delivery. Ther. Deliv. 2017, 3, 457–478. [Google Scholar] [CrossRef]
- Coffer, J.L. Overview of Semiconducting Silicon Nanowires for Biomedical Applications; Woodhead Publishing Series in Biomaterials; Elsevier: New York, NY, USA, 2014; pp. 3–7. [Google Scholar] [CrossRef]
- Zhang, G.J.; Ning, Y. Silicon nanowire biosensor and its applications in disease diagnostics: A review. Anal. Chim. Acta 2012, 749, 1–15. [Google Scholar] [CrossRef]
- Schena, M.; Shalon, D.; Davis, R.W.; Brown, P.O. Quantitative monitoring of gene expression patterns with a complementary DNA microarray. Science 1995, 270, 467–470. [Google Scholar] [CrossRef]
- Zhu, H.; Sneider, M. Protein arrays and microarrays. Curr. Opin. Chern. Biol. 2001, 5, 40–50. [Google Scholar] [CrossRef]
- Freeman, W.M.; Robertson, D.J.; Vrana, K.E. Fundamentals of DNA hybridization arrays for gene expression analysis. Biotechniques 2000, 29, 1042–1055. [Google Scholar] [CrossRef]
- Santangelo, M.F.; Sciuto, E.L.; Lombardo, S.; Busacca, A.C.; Petralia, S.; Conoci, S.; Libertino, S. Si photomultipliers for bio-sensing applications. J. Sel. Top. Quant. Electr. 2016, 22. [Google Scholar] [CrossRef]
- Favetta, M.; Valletta, A.; Fortunato, G.; Castagna, M.E.; Conoci, S.; Sciuto, E.L.; Cosentino, T.; Sinatra, F.; Libertino, S. Development of Si-based Electrical Biosensors: Simulations and first experimental results. Sens. Bio-Sens. Res. 2015, 6, 72–78. [Google Scholar] [CrossRef]
- Petralia, S.; Sciuto, E.L.; Mirabella, S.; Di Pietro, M.L.; Zimbone, M.; Conoci, S. An Innovative Chemical Strategy for PCR-free Genetic Detection of Pathogens by an Integrated Electrochemical Biosensor. Analyst 2017, 142, 2090–2093. [Google Scholar] [CrossRef]
- Messina, M.A.; Meli, C.; Conoci, S.; Petralia, S. A facile method for urinary phenylalanine measurement on paper-based lab-on-chip for PKU therapy monitoring. Analyst 2017, 142, 4629. [Google Scholar] [CrossRef] [PubMed]
- Saby, C.; Jaffrezic-Renault, N.; Martelet, C.; Colin, B.; Charles, M.H.; Dehair, T.; Mandrand, B. Immobilization of antibodies onto a capacitance silicon-based transducer. Sens. Actuators B 1993, 15–16, 458–463. [Google Scholar] [CrossRef]
- Subramanian, A.; Kennel, S.J.; Oden, P.I.; Jacobson, K.B.; Woodward, J.; Doktycz, M.J. Comparison of techniques for enzyme immobilization on silicon supports. Enzyme Microb. Technol. 1999, 24, 26–34. [Google Scholar] [CrossRef]
- Lobert, P.E.; Bourgeois, D.; Pampin, R.; Akheyar, A.; Hagelsieb, L.M.; Flandre, D.; Remacle, J. Immobilization of DNA on CMOS compatible materials. Sens. Actuators B 2003, 92, 90–97. [Google Scholar] [CrossRef]
- Cai, W.; Peck, J.R.; van der Weide, D.W.; Hamers, R.J. Direct electrical detection of hybridization at DNA-modified silicon surfaces. Biosens. Bioelectr. 2004, 19, 1013–1019. [Google Scholar] [CrossRef] [PubMed]
- Iler, R.K. The Chemistry of Silica; Plenum Press: New York, NY, USA, 1979; ISBN 0-471-02404-X. [Google Scholar]
- Jutzi, P.; Schubert, U. Silicon Chemistry: From the Atom to Extended Systems; Wiley-VCH: Hoboken, NJ, USA, 2003; ISBN 3-527-30647-1. [Google Scholar]
- Herne, T.M.; Tarlov, M.J. Characterization of DNA probes immobilized on gold surfaces. J. Am. Chem. Soc. 1997, 119, 8916–8920. [Google Scholar] [CrossRef]
- Piunno, P.A.E.; Krull, U.J. Fiber-optic DNA sensor for fluorimetric nucleic acid determination. Analyt. Chem. 1995, 67, 2635–2643. [Google Scholar] [CrossRef]
- Libertino, S.; Fichera, M.; Aiello, V.; Statello, G.; Fiorenza, P.; Sinatra, F. Experimental characterization of proteins immobilized on Si-based materials. Microelectr. Eng. 2007, 84, 468–473. [Google Scholar] [CrossRef]
- Libertino, S.; Scandurra, A.; Aiello, V.; Giannazzo, F.; Sinatra, F.; Renis, M.; Fichera, M. Layer uniformity in glucose oxidase immobilization on SiO2 surfaces. Applied Surface. Science 2007, 253, 9116–9123. [Google Scholar]
- Libertino, S.; Giannazzo, F.; Aiello, V.; Scandurra, A.; Sinatra, F.; Renis, M.; Fichera, M. XPS and AFM characterization of the enzyme glucose oxidase immobilized on SiO2 surfaces. Langmuir 2008, 24, 1965–1972. [Google Scholar] [CrossRef]
- Libertino, S.; Fichera, M.; Aiello, V.; Lombardo, S.; Scandurra, A.; Renis, M.; Sinatra, F. Electrical characterization of biological molecules deposition in MOS capacitors. Sens. Lett. 2008, 6, 531–536. [Google Scholar] [CrossRef]
- Hu, S.; Zhao, Y.; Qin, K.; Retterer, S.T.; Kravchenko, I.I.; Weiss, S.M. Enhancing the sensitivity of label-free silicon photonic biosensors through increased probe molecule density. ACS Phot. 2014, 1, 590–597. [Google Scholar] [CrossRef]
- Zhao, Y.; Lawrie, J.L.; Beavers, K.R.; Laibinis, P.E.; and Weiss, S.M. Effect of DNA-induced corrosion on passivated porous silicon biosensors. ACS Appl. Mat. Interface 2014, 6, 13510–13519. [Google Scholar] [CrossRef]
- Chen, E.Y.; Liu, W.F. Biomolecule immobilization and delivery strategies for controlling immune response. Nanotechnol. Prev. Regen. Med. 2018, 207–225. [Google Scholar] [CrossRef]
- Davidsson, R.; Genin, F.; Bengtsson, M.; Laurell, T.; Emneus, J. Microfluidic biosensing systems Part I. Development and optimisation of enzymatic chemiluminescent µ-biosensors based on silicon microchips. Lab Chip 2004, 4, 481–487. [Google Scholar] [CrossRef] [PubMed]
- Shen, M.-Y.; Li, B.-R.; Li, Y.-K. Silicon nanowire field-effect-transistor based biosensors: From sensitive to ultra-sensitive. Biosens. Bioelectron. 2014, 60, 101–111. [Google Scholar] [CrossRef] [PubMed]
- Beniwal, A.; Saini, P.; Kokkiligadda, A.; Vij, S. Use of silicon dioxide nanoparticles for b-galactosidase immobilization and modulated ethanol production by co-immobilized K. marxianus and S. cerevisiae in deproteinized cheese whey. Food Sci. Technol. 2018, 87, 553–561. [Google Scholar] [CrossRef]
- Arreola, J.; Oberländer, J.; Mätzkow, M.; Keusgen, M.; Schöning, M.J. Surface functionalization for spore-based biosensors with organosilanes. Electroch. Acta 2017, 241, 237–243. [Google Scholar] [CrossRef]
- Libertino, S.; Conoci, S.; Scandurra, A.; Spinella, C. Biosensor integration on Si-based devices: Feasibility studies and examples. Sens. Actuators B 2013, 179, 240–251. [Google Scholar] [CrossRef]
- Petralia, S.; Cosentino, T.; Sinatra, F.; Favetta, M.; Fiorenza, P.; Bongiorno, C.; Sciuto, E.L.; Conoci, S.; Libertino, S. Silicon nitride surfaces as active substrate for electrical DNAbiosensors. Sens. Actuators B 2017, 252, 492–502. [Google Scholar] [CrossRef]
- Foglieni, B.; Brisci, A.; San Biagio, F.; Di Pietro, P.; Petralia, S.; Conoci, S.; Ferrari, M.; Cremonesi, L. Integrated PCR amplification and detection processes on a Lab-on-Chip platform: A new advanced solution for molecular diagnostics. Clin. Chem. Lab. Med. 2010, 48, 329–336. [Google Scholar] [CrossRef] [PubMed]
- Taylor, S.; Smith, S.; Windle, B.; Guiseppi-Elie, A. Impact of surface chemistry and blocking strategies on DNA microarrays. Nucleic Acids Res. 2003, 31, e87. [Google Scholar] [CrossRef] [PubMed]
- Daniels, M.W.; Sefcik, J.; Francis, L.F.; McCormick, A.V. Reactions of a trifunctional silane coupling agent in the presence of colloidal silica sols in polar media. J. Colloid Interface Sci. 1999, 219, 351–356. [Google Scholar] [CrossRef] [PubMed]
- Park, O.-H.; Eo, Y.-J.; Choi, Y.-K.; Bae, B.-S. Preparation and optical properties of silica-poly(ethylene oxide) hybrid materials. J. Sol Gel Sci. Technol. 1999, 16, 235–241. [Google Scholar] [CrossRef]
- Mittal, K.L. (Ed.) Contact Angle, Wettability and Adhesion; VSP International Science Publishers: Leiden, The Netherlands, 1993. [Google Scholar]
- Integrated DNA Technologies, Inc. Available online: https://eu.idtdna.com/site/account/login?returnurl=//calc/analyzer (accessed on 15 March 2017).
© 2018 by the authors. Licensee MDPI, Basel, Switzerland. This article is an open access article distributed under the terms and conditions of the Creative Commons Attribution (CC BY) license (http://creativecommons.org/licenses/by/4.0/).