Abstract
Metal oxides (MOx) are a well-established material for gas sensing. MOx-based gas sensors are sensitive to a wide variety of gases. Furthermore, these materials can be applied for the fabrication of low-cost and -power consumption devices in mass production. The market of carbon dioxide (CO) gas sensors is mainly dominated by infra-red (IR)-based gas sensors. Only a few MOx materials show a sensitivity to CO and so far, none of these materials have been integrated on CMOS platforms suitable for mass production. In this work, we report a cupric oxide (CuO) thin film-based gas sensor functionalized with gold (Au) nanoparticles, which exhibits exceptional sensitivity to CO. The CuO-based gas sensors are fabricated by electron beam lithography, thermal evaporation and lift-off process to form patterned copper (Cu) structures. These structures are thermally oxidized to form a continuous CuO film. Gold nanoparticles are drop-coated on the CuO thin films to enhance their sensitivity towards CO. The CuO thin films fabricated by this method are already sensitive to CO; however, the functionalization of the CuO film strongly increases the sensitivity of the base material. Compared to the pristine CuO thin film the Au functionalized CuO film shows at equal operation temperatures (300 C) an increase of sensitivity towards the same gas concentration (e.g., 2000 ppm CO) by a factor of 13. The process flow used to fabricate Au functionalized CuO gas sensors can be applied on CMOS platforms in specific post processing steps.
1. Introduction
Natural emissions of carbon dioxide CO in Earth’s atmosphere can be referenced to the carbon cycle. Man-made or anthropogenic CO emissions can be mainly attributed to the combustion of fossil fuels in transport, industry, and electricity [1]. Over the last two centuries the carbon dioxide concentration has risen from an average value of approximately 280 ppm [2] (pp. 4–6) to a value about 411 ppm [3]. Apart from this alarming trend, CO has a significant direct impact to human health and thus plays an important role for indoor air quality monitoring. The main source of the indoor CO concentration is the metabolism of the occupants, who continuously exhale a steady amount of CO, that is added to the base global CO concentration, setting the lower level for the indoor concentration. An elevated indoor CO level causes significant symptoms for humans: reduction of mental concentration, fatigue, headache, and dizziness [4]. Extreme conditions, such as agricultural silo accidents, can even lead to death. Application of CO gas sensors in heating, ventilation, and air conditioning systems (HVAC) improves indoor air quality and thus the comfort for its occupants. Moreover, precise control of HVAC by air quality monitoring sensors—in particular, CO sensors—would strongly reduce the overall energy consumption of those systems. According to Nassif [5] the energy consumption of regular HVAC systems can be potentially decreased by 25% by switching to intelligent CO controlled HVACs, which would have a great impact on the global CO emissions and thus the outdoor CO levels. Currently available commercial CO gas sensors, which measure the CO concentration directly, are mostly based on optical (infra-red) detection [6] employing an IR emitter and a detector with a specific absorption length in between. The advantages of these sensors are their precision, resolution, and robustness. The disadvantages are their size (several cm), high power consumption and comparatively high cost. At research level a lot of effort is put into the exploitation of new approaches for optical CO sensors [7,8], in particular with respect to miniaturization. Employment of wave-guides and integration on silicon or even CMOS devices might reduce size and power consumption; however, the optical principle requires a minimum absorption length, which prevents significant miniaturization. A promising alternative to optical sensors are conductometric chemical sensors. A variety of established sensors already exist on the market, which can detect various target gases, such as CO, H or Volatile Organic Compounds (VOCs).
In literature various material types exhibiting sensitivity towards CO are reported: metal organic framework [9], nascion [10], perovskite [11], solid electrochemical type [12]. The most prominent class of materials for gas sensing are metal oxide materials, which exhibit high sensitivity towards numerous gases, but in general hardly any to CO. For the following metal oxides a sensitivity to CO has been reported: Gd-doped CeO [13], Pd-doped LaO [14], nano-particulate CuO films [15,16] and BaTiO-CuO films [17]. However, up to now no electrical sensor capable to directly detect CO is available as a commercial product.
In this work, we present CuO thin film sensors fabricated by thermal oxidation of patterned copper layers. The sensitivities of the pristine CuO sensors and sensors functionalized with gold (Au) nanoparticles have been evaluated towards CO at different humidity levels. While the pristine CuO sensor has a maximum response of 32% at 350 C, the Au functionalization of the CuO sensor leads to an exceptional increase of the response by a factor of 11 up to 365% at 300 C. To our best knowledge this is one of the highest responses ever reported for a conductometric CO sensor. Table A1 shows some of the highest CO responses for metal oxide-based sensors in literature compared to this work. One of the most important features of our sensor device is that the entire process flow enables an integration on CMOS devices.
2. Materials and Methods
2.1. Gas Sensor Fabrication
The gas sensor is fabricated using a five-step process: (1) electrode deposition, (2) fabrication of a patterned copper (Cu) layer, (3) sensor stack assembly, (4) thermal oxidation and (5) nanoparticles functionalization. All the essential parameters of the fabrication process have been optimized to enable subsequent integration on CMOS devices.
- The base substrate for fabricating the gas sensors is a silicon substrate with a thermal silicon oxide layer of 300 nm on top (SIEGERT WAFER GmbH). Gold electrodes are employed to electrically contact the CuO sensing film. The fabrication of the electrode system is done by photolithography with a positive photoresist (AZ®MIR701, Microchemicals, EVG 620 Mask aligner) and thermal evaporation (Univex Evaporator 450 by Leybold GmbH) of 5 nm thick titanium layer and a gold layer of 200 nm thickness as electrode material. The lift-off process is realized by submerging the substrate in acetone for a duration of 12 h (see Table A2 in appendix for the applied process parameters). The geometry of the electrode system is designed to enable four-point measurement (see Figure 1b) and to ensure precise electrical resistance measurements.
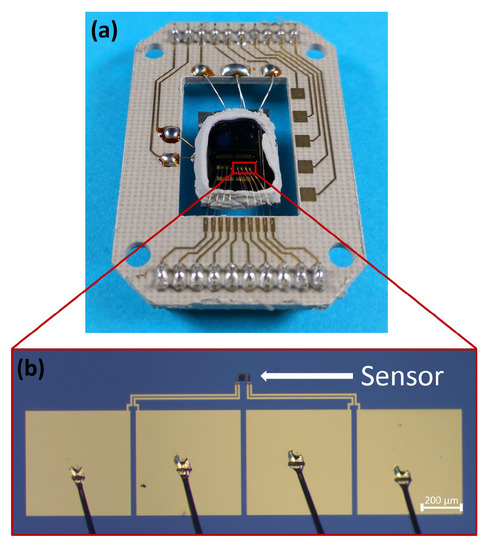 Figure 1. (a) Evaluation board with soldered heater and thermocouple and wire bonded gas sensor stack. (b) Wire bonded gas sensors with electrode system.
 - In the second step the Cu-films are deposited on top of the Ti/Au electrode system. For this a 60 µm by 25 µm structure is exposed by electron beam lithography (Raith eLINE plus, positive electron beam resist AR-P 672.08, ALLRESIST GmbH) into the resist. The structure itself is subdivided into six strips, which are separated by a distance of 2.25 µm. After resist development, a Ti adhesion layer (thickness 5 nm) and a Cu layer (thickness 500 nm) are deposited by thermal evaporation (Univex Evaporator 450, Leybold GmbH). The lift-off process is realized by submerging the entire substrate in acetone for 4 h.
- In the third step the assembly of the gas sensor stack is performed. Metal oxide gas sensors need to be operated at higher temperatures (200 C–400 C). Therefore, the sensor stack, containing the substrate with Ti/Au electrode system and the Cu layer (as precursor for CuO), must be merged with a heater and a thermocouple. The heater consists of two Pt 6.8 elements (Delta-R GmbH) connected in series; a Pt100 element (Delta-R GmbH) is used as the thermocouple to monitor operation temperature. The sensors are glued with both heater elements and thermocouple to a sensor system with thermoconductive adhesive (Aremco Ceramabond 865, Aremco Products Inc.). The final device is soldered, and wire bonded to a custom-made printed circuit board (PCB) as shown in Figure 1a.
- The fourth step addresses the thermal oxidization of the Cu metal layer, which is performed in situ in the gas measurement set-up (GMS). The atmospheric condition in the GMS is provided by synthetic air (Linde Gas GmbH) with relative humidity level (rH) of 50%. For a duration of six hours the gas sensor is heated at a constant temperature of 400 C, which results in oxidation of the Cu layer. The entire Cu metal layer is oxidized to form a continuous CuO film.
- The sensor fabrication is finalized in the fifth step by functionalizing the CuO film with Au nanoparticles (Au-NPs). This is performed by stepwise drop coating a volume of 5 µL of an aqueous Au-NPs solution (CANdot® Series G, c = 100 g Au/mL, Fraunhofer IAP-CAN) onto the sensor surface. To ensure a fast evaporation of the solvent during nanoparticles deposition, the sensor is heated up to 85 C. This is repeated several times; each consecutive step is started once the solvent is evaporated.
2.2. Sensitivity Calculation and Data Evaluation
The gas sensors sensitivity is determined by Equation (1). Herein, the resistance of the gas sensors in synthetic air is , whereas the highest resistance value during gas exposure is . The sensitivity is a measure of the gas sensors’ response towards a specific target gas at a specific concentration, humidity level and the operation temperature of the gas sensor.
2.3. Scanning Electron Beam Microscopy
The scanning electron microscopy (SEM) investigation was done on an Auriga®-CrossBeam® Workstation (Carl Zeiss Microscopy GmbH) with an acceleration voltage of 10 keV. The surface investigations at high magnification and the elemental mapping were done on a ZEISS GeminiSEM 450 at 3 keV and 5 keV.
2.4. Raman Spectroscopy
The Raman spectrum was measured with LabRAM HR800 from Horiba Jobin Yvon. A green (514.5 nm) Ar-ion laser in backscattering geometry was used as an excitation source. The analysis of the Raman signal was performed with a grating (1800 g/mm), whereas the signal detection was done by a multichannel CCD.
2.5. Gas Measurements Set-Up
The GMS used in this work is a custom-made system capable of chemical sensor evaluation in a controlled and adjustable mixture of gases. The GMS consists of two parts: the gas atmospheric part and the electrical evaluation part.
The gas atmospheric part shown in Figure A1a enables precise control of the concentrations of two different test gases and the relative humidity (rH) levels of the background gas. Since the goal is to simulate an ambient atmosphere, synthetic air (20% O, 80% N, Linde Gas GmbH) is used as background gas. The background gas is set by two mass flow controllers (type: EL-FLOW, Bronkhorst High-Tech B.V.). The first mass flow controller is providing dry air, whereas the second mass flow controller is providing wet air, formed by bubbling part of the synthetic air through a container filled with deionized water. The two outputs of the dry and wet air are mixed to provide specific rH levels in the range of 10%–90% rH, which is measured using a commercial, humidity sensors (type: AFK-E, KOBOLD Holding Gesellschaft m.b.H.). Similar to the background gas the flows of each of the two test gases are set by three independent mass flow controllers (type: EL-FLOW, Bronkhorst High-Tech B.V.) to provide a wide adjustable range of concentrations. Each of these three mass flow controllers is calibrated for a specific concentration range to provide precision and range for varying test plan requirements. The background gas and the test gases are mixed before being introduced into the measurement chamber, which is an air-tight sealed stainless steel tube holding a volume of approximately 80 cm. Our specific GMS is designed for a constant flow of 1000 sccm to ensure an optimal gas injection into the measurement chamber. The gas is flowing parallel to the sensor surface. The sensor stack (see Figure 1) has a comparatively high thermal mass and no cooling effect was observed. Moreover, the Pt100 element provides a feedback loop to keep the sensor stack at a constant temperature.
The electrical evaluation part of the GMS (see Figure A1b) is designed for measuring the electrical resistance of the gas sensor, for operating the heater and for measuring the operation temperature of the entire sensor stack via voltage measurement of the thermocouple. The gas sensor resistance is measured by employing a source measure unit (type: 2400 SourceMeter SMU, Keithley). The heater is operated by a voltage source (type: PL330P, Thurlby Thandar Instruments). The voltage measurement of the thermocouple is done by a digital multimeter (type: 34401A, Keysight technologies). Both parts of the GMS are joined by a LabView program, wherein specific test plans can be defined.
3. Results
3.1. Copper Oxide Characterization
The evaluation of the gas sensitive copper oxide film was done by SEM and Raman spectroscopy. Figure 2a shows the oxidized surface of the copper structures. The initial Cu strips can still be seen suggestively as vertical lines; however, thermal oxidation results in swelling of the Cu structures, the gaps between the separated Cu stripes are closed, electrically connected and a continuous film of copper oxide is formed. The oxidation parameters (T = 400 C/rH = 50%/t = 6 h) were chosen to result in the formation of a CuO film instead of CuO nanowires. Figure 3 shows a representative SEM image of the sensor surface, where the bright spots indicate the Au-NPs. A TEM picture of a Au-NP having an average diameter of 20 nm is shown in the insert. The SEM image shows both single Au-NPs on the CuO surface as well as agglomerated Au-NPs. To analyze the material composition and confirm the materials responsible for the chemical sensing mechanism at the sensor’s surface, an elemental mapping has been performed in the 4 µm × 4 µm section of the sensor surface as shown in Figure 3. The elemental mapping was done for four elements and is presented in Figure 4: (a) gold Au, (b) copper Cu, (c) oxygen O and (d) silicon Si. The contrast of each color corresponds to the occurrence of the element. The SEM picture shows multiple nanoparticles on the sensor surface, high contrast. The Au elemental map clearly shows the highest contrast for Au at the same bright structures, which are shown in Figure 3 as Au-NPs. In both the Cu and the O elemental maps voids can be clearly seen at the location of these Au-NPs. Figure 4d presents the elemental mapping of Si, where the occurrence of Si is a result of silicon diffusion during the oxidation process. Figure 5 shows an EDX of one of the Au-NPs, which clearly indicates that these nanoparticles are made of Au.
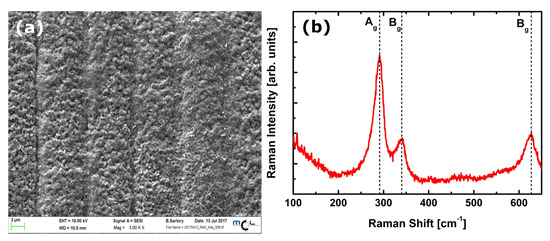
Figure 2.
(a) SEM picture of the thermally oxidized CuO film. (b) Raman spectrum of the thermally oxidized CuO film.
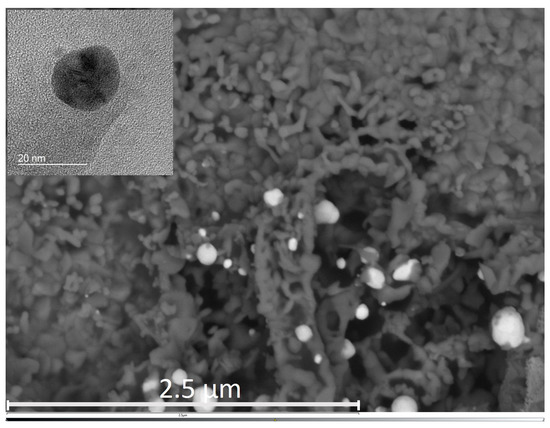
Figure 3.
SEM image of the investigated sensor surface area containing Au nanoparticles. The insert shows a TEM image of a single nanoparticle.
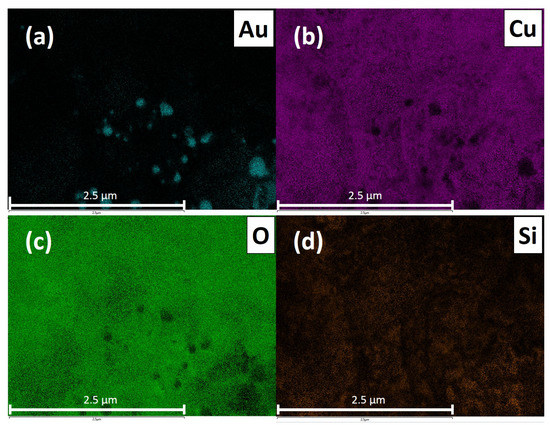
Figure 4.
Elemental mapping of a 4 µm × 4 µm section on the copper oxide surface with 5 keV (primary beam energy). (a) Au elemental map, (b) Cu elemental map, (c) O elemental map and (d) Si elemental map.
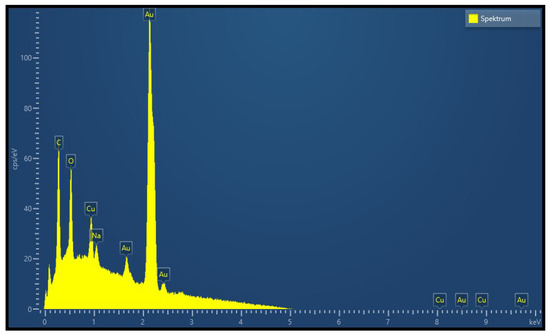
Figure 5.
EDX spectrum of a single nanoparticle on the copper oxide surface at 5 keV.
The identification of the copper oxide state (CuO or CuO) was performed by Raman spectroscopy. CuO possesses 12 phonon modes due to the presence of four atoms in the primitive unit cell. Factor group analysis gives [18]:
of which only the three A and B modes are Raman-active. The Raman spectrum of CuO presents a strong A mode at 296 cm and two B modes at 346 cm and 631 cm. These modes involve only the vibrations of oxygen atoms in the direction of the b-axis of the unit cell for A and perpendicular to the b-axis for B modes [18]. Figure 2b presents the Raman spectrum measured on the thermally oxidized film. The assignment of the Raman modes confirms that only CuO (one A mode and two B modes compatible with the positions reported in literature) is present—other copper oxide species cannot be evidenced from the measured spectrum. CuO and CuO, in fact, present distinctive modes at 150 cm, 220 cm and 541 cm, respectively [18], which were not detected on the oxidized CuO film.
3.2. Carbon Dioxide Measurements of a Pristine and Functionalized Gas Sensor
The CO measurements were performed in the GMS (see Section 2.5). The evaluation of the gas sensors’ performance towards CO was done following this measurement plan: the gas sensor was operated at three different temperatures (300 C, 350 C, 400 C) and for each operating temperature three rH levels (25%, 50%, 75%) were set. Within each rH level a series of CO gas pulses (single pulse duration: 5 min) with various concentrations (250 ppm, 500 ppm, 1000 ppm, 1500 ppm and 2000 ppm) were applied to meet the general demands of indoor air quality monitoring. Figure 6 shows the sensor resistances of the pristine (not functionalized with nanoparticles) and the Au-NPs functionalized CuO sensors responding to different concentrations of CO at 300 C operation temperature. Herein, it can be seen that the base resistance of the functionalized sensor decreases by a factor of 2 compared to the pristine sensor. The pristine CuO sensor exhibits a small response to CO (maximum 28%), which decreases with increasing rH level. The response of the functionalized CuO sensor is 13 times higher and reaches a maximum of 365%. The response increases linearly with the CO concentration. To the best of our knowledge this is one of the highest reported sensitivities of a conductometric CO sensor. For clear comparison the gas sensor performance of the pristine and Au-NPs functionalized CuO sensors to a CO concentration of 2000 ppm are shown in Figure 7 and Figure 8, respectively, for three different operation temperatures (300 C, 350 C, 400 C) and three different rH levels (25%, 50%, 75%). The sensitivities are normalized in accordance with Equation (1).
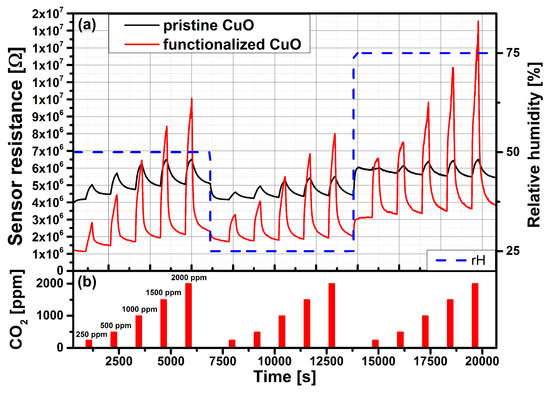
Figure 6.
(a) Carbon dioxide measurement of the pristine and functionalized CuO gas sensors at an operation temperature of 300 C and rH levels of 25%, 50% and 75%. (b) CO gas pulses: 250 ppm, 500 ppm, 100 ppm, 1500 ppm and 2000 ppm.
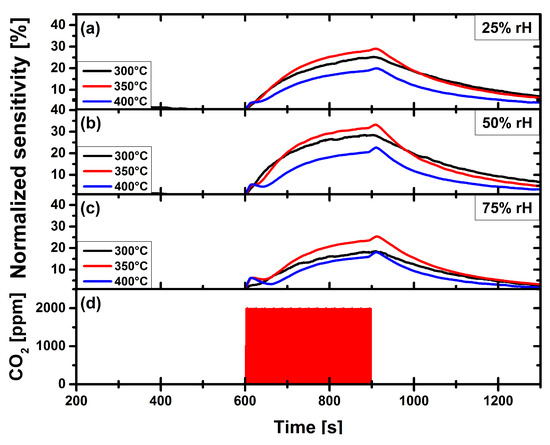
Figure 7.
Carbon dioxide measurement of pristine CuO gas sensor, at operation temperatures 300 C, 350 C and 400 C, at constant relative humidity levels of: (a) 25%. (b) 50%. (c) 75%. (d) Applied gas pulse of 2000 ppm CO.
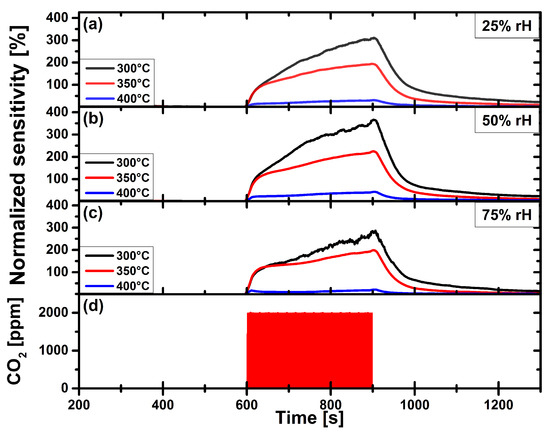
Figure 8.
Carbon dioxide measurement of gold nanoparticles functionalized CuO gas sensor, at operation temperatures 300 C, 350 C and 400 C, at constant relative humidity levels of: (a) 25%. (b) 50%. (c) 75%. (d) Applied gas pulse of 2000 ppm CO.
Figure 7 depicts the CO gas measurement of a pristine CuO gas sensor towards a single CO gas pulse of 2000 ppm. In this figure the gas sensor response for all three sensor operation temperatures is shown for constant relative humidity levels of (a) 25%, (b) 50% and (c) 75%. Figure 7d depicts the CO gas pulse of 2000 ppm. The sensitivity of the pristine CuO gas sensor reaches a maximum of 32% at an operation temperature of 350 C and a rH-level of 50%.
Figure 8 shows the sensitivity of the Au-NPs functionalized CuO gas sensor. Please note that the sensitivity scale of Figure 8 is expanded by a factor of ten as compared to the scale of Figure 7. The functionalized CuO gas sensor reaches a maximum of 365% at an operation temperature of 300 C and at a rH-level of 50%. The maximum sensitivity is a factor of 11 higher than that of the pristine sensor at its optimal, operation temperature of 350 C. The response of the Au-NPs functionalized CuO sensor decreases with increasing temperature (350 C) and drops drastically at 400 C operation temperature.
In Figure 9 the maximum sensitivities of the pristine sensor and the Au-NPs functionalized sensor to a CO concentration of 2000 ppm are compared for the different relative humidity levels (25%, 50%, 75%) at the same operation temperature of 300 C. The functionalized sensor has a maximum sensitivity of 365% at 50% rH, which decreases down to 283% at 75% rH. Its average response time is 4.3 min with an average recovery time of 4.4 min. The pristine sensor has a maximum sensitivity of 28% at 50% rH, which decreases down to 18% at 75% rH. The average response time for the pristine sensor is 3.7 min, whereas the its average recovery time is 11.1 min. At the same operation temperature of 300 C the sensitivity of the Au-NPs functionalized sensor is even increased by a factor of 13 compared to the pristine sensors’ sensitivity. While both types of sensors exhibit a certain cross-sensitivity to water, this sensitivity drop is much less in the case of the functionalized sensor. Functionalization with Au-NPs thus not only increases the sensitivity, but also decreases cross-sensitivity to humidity.
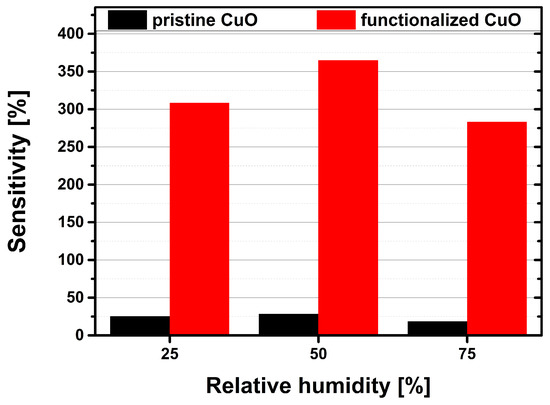
Figure 9.
Comparison of the pristine (black bars) and the Au-NPs functionalized (red bars) gas sensors sensitivities towards a 2000 ppm CO gas pulse at relative humidity levels of 25%, 50% and 75% at an operation temperature of 300 C.
3.3. Carbon Monoxide Measurements
Cross selectivity is an important issue for chemical sensors. Our sensor developments are focused on indoor air quality monitoring, where detection of carbon monoxide (CO) is important for safety reasons. CO is a color- and odorless gas, which is highly toxic. Incomplete combustion of natural gas in gas appliances, such as boilers, gas fires, or gas cookers can lead to people being exposed to CO in their homes or at work place. Prolonged exposure to CO in case of a defect heating system, for example, can eventually be fatal. The maximum permitted work place concentration value for CO is 30 ppm [19] in Germany. Thus, the sensitivity of the Au-NPs functionalized CuO-based sensors has been also evaluated towards CO. Figure 10 shows the sensitivity of the Au-NPs functionalized CuO-based gas sensor towards CO and CO. The CuO-based sensors show a response of less than 5% at CO concentrations around 20 ppm. Thus, to achieve a relevant response, the concentration of CO has been increased up to 200 ppm, which is compared with the response to a CO concentration of 2000 ppm. The sensor temperature is set to 300 C, since this is the optimum operation temperature for both test gases. Furthermore, the sensitivities have been evaluated for three different relative humidity levels (25%, 50%, 75%).
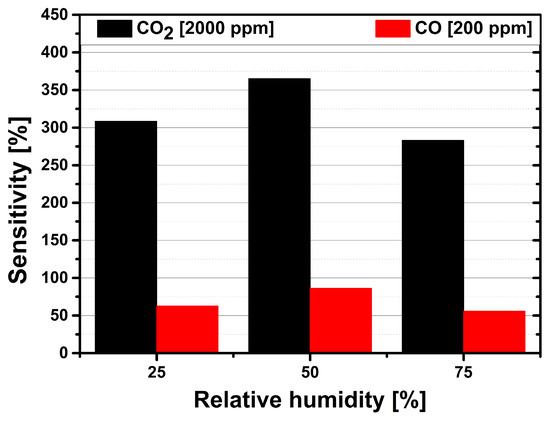
Figure 10.
Comparison of the Au-NPs functionalized gas sensors sensitivities towards a 2000 ppm CO gas pulse (black bars) and a 200 ppm CO gas pulse (red bars) at relative humidity levels of 25%, 50% and 75% at an operation temperature of 300 C.
The sensitivity of the gas sensor towards CO reaches its maximum of 86% at 50% rH. At 75% rH the sensitivity to CO decreases to 56%. The average response time for the CO measurement is 3 min, whereas the average recovery time is 10 min. The direct comparison of the Au-NPs functionalized sensors’ sensitivity to the maximum concentrations of CO and of CO at 50% rH shows that the CO sensitivity is roughly 4 times higher than the CO sensitivity. Figure 10 clearly shows that the CuO-based sensor exhibits a much higher sensitivity towards CO which is enough to discriminate between the two different target gases.
4. Discussion and Conclusions
The CuO films used within this work are formed during an in situ thermal oxidation process [20]. It is well established that metallic Cu predominately oxidizes into cuprous oxide (CuO) or cupric oxide (CuO). As proven by Raman spectroscopy, in case of our sensors the thermal oxidation resulted in CuO. According to Chen et al. [21] copper oxidizes by forming a multi-layer system of metallic Cu, CuO and CuO. Xu et al. [22], who investigated the thermal oxidation of Cu foils, found that oxidation temperatures of 400 C and higher would result in the formation of CuO nanowires. In our case, however, only a few CuO-NWs have been found on the thermally oxidized Cu structures. The employed Cu structures have a smaller lateral dimension and thickness, and thus much less volume than a bulk material. Furthermore, the Cu-layers have been deposited by thermal evaporation method. Both specific features—small Cu volume and evaporation method—could lead to a deviation from Xu’s findings. The authors presume the gaps between the Cu stripes provide additionally lateral room for the thermal copper oxide to expand. Thereby, the built-up of strain or stress in the Cu structure, which are strong driving forces for the growth of CuO-NWs during oxidation, is to a large extent avoided. As a result, the formation of the CuO nanowires could be inhibited.
The SEM investigation show (Figure 2a) that the gaps between the copper structures are bridged by the expanding CuO. We conclude that the thermal oxidation process results first in a multi-layer of Cu, CuO and CuO [21], which is subsequently fully converted to CuO during the six hours oxidation. This is in accordance with the work of Adilov et al. [23], who found that CuO films heated to a temperature of 400 C and above would transform into CuO. This assumption is fully supported by Raman spectroscopy measurement, where no peaks for Cu- and CuO-phases have been found on our sensing films.
It has already been reported in literature that CuO is sensitive to carbon dioxide [16,24]. The results in Figure 7 show that the maximum sensitivity of our pristine CuO sensor exposed to a CO concentration of 2000 ppm at 50% rH and an operation temperature of 350 C is 35%. This supports findings in literature and can be compared to CuO-based sensors reported by Abdelmounaim et al. [24] and Ishihara et al. [25].
A potential surface reaction explaining the interaction between the target gas CO and the sensing material CuO (NPs) has been described by Tanvir et al. [16]. A key reactant of this reaction is humidity. The authors of [16] presume that the CuO-NPs’ surface reacts with CO and HO forming either malachite or azurite, since these reactions are thermodynamically more favorable than the formation of copper carbonate (CuCO). Equations (3) and (4) display the formation equations of these two hydroxycarbonates. Furthermore, Tanvir et al. [16] presume that CO can either be available on the surface in its gaseous phase or solvated in water. Table 1 shows the Gibbs free energy for the formation of malachite and azurite at 400 ppm CO at 298.15 K. Equations (A1), (A2) and (A3) and literature values (Table A4) used for the calculations of the values in Table 1 can be found in the appendix. Since malachite and azurite are both insulators the formation of those compounds on the sensor surface would result in a resistance increase. This sensing mechanism deviates from the established ionosorption model, where adsorbed ionic oxygen species on the sensor surface interact with the test gas resulting in resistance change of the sensor.

The decrease in sensor sensitivity at temperatures exceeding the optimal operation temperature of 300 C can be connected to the formation of malachite or azurite too. Seguin [26] investigated the dissociation of malachite and azurite by DTA measurements. Seguin found that the malachite dissociates in a temperature window of 310 C to 420 C, whereas azurite dissociates between 290 C to 395 C. Therefore, the authors presume that malachite is mainly responsible for the sensing mechanism at the optimal operation temperature. Furthermore, the dissociation of malachite and azurite at these temperatures explains the decrease in sensitivity at the investigated operation temperatures of 350 C and 400 C.
The dramatic increase of the sensitivity to CO has been achieved by functionalizing the pristine CuO film with Au-NPs. According to Korotcenkov [27] nanoparticles deposited onto a MOx surface in general change the sensitivity of a metal oxide gas sensor either by chemical sensitization or electronic sensitization. The authors presume that the interface of metal oxide and gold nanoparticles provide additional active cites for the adsorption of CO. A similar process was reported by Yang et al. [28], where the base material was a CeO/TiO substrate on which Au nanoparticles were deposited. As a result, the adsorption of CO increased. In our case, the increased CO adsorption could lead to a rise in malachite formation, thereby increasing the sensors’ sensitivity. However, at the moment we do not understand this interaction mechanism yet. We cannot exclude chemical surface reactions such as diffusion of Au into the CuO and resulting alloy of Au–CuO hybrid NPs or similar effects, which might arise due to the high operation temperature up to 400 C. Detailed analysis of the Au-NPs functionalized CuO surface with respect to potentially new alloys or phases are presently under investigation in order to clarify the surface reaction process for the Au-NPs functionalized CuO film.
The lifetime of the CO sensor has been tested over more than 2 weeks in DC-operation and a degradation of the sensor performance has been observed, which the authors mainly attribute to structural changes of the functionalization. As is obvious from Figure 3, the Au nanoparticles seem to agglomerate over time, which might be responsible for a reduced response. Another issue is the adhesion of the CuO-layer on the Si-substrate. Although the chosen patterns (Cu stripes) release part of the stress/strain during thermal oxidation, reliable adhesion is still a problem. Optimization of the process technology steps (variation of gap width between Cu stripes, Cu-thickness etc.) is in progress. Concerning repeatability, the process technology used in this work to functionalize the CuO surface with the Au nanoparticles is drop-coating. Since this method has limits concerning reproducibility, more precise technologies for deposition such as ink-jet printing will be employed in the future to ensure repeatable Au-coverage.
The issue of cross-sensitivity is investigated by the evaluation of the Au-NPs functionalized sensors’ sensitivity towards carbon monoxide. Figure 10 clearly shows that the sensor exhibits a higher sensitivity towards CO. Although the maximum concentrations, which are compared in Figure 10 are not equivalent, this comparison reflects practical requirements for indoor air quality monitoring. CO concentration can easily exceed 2000 ppm in closed rooms, which can be detected by the CuO-based sensor even in case of extremely high CO concentration of 200 ppm. For detection of CO concentrations well below 100 ppm SnO-based gas sensors can be employed. A combination of the CuO-based CO sensor and a SnO-based sensor would thus be a proper choice for air quality as well as safety issues. In case of a HVAC system monitored by such a sensor combination, the HVAC would immediately blow in fresh air.
In conclusion, it has been shown that CuO formed by in situ thermal oxidation and functionalized with gold nanoparticles exhibits a high sensitivity towards CO. Direct comparison of the pristine and Au-NPs functionalized CuO sensor shows a sensitivity increase by a factor 13 (comparison: CO 2000 ppm, rH 50%, operation temperature 300 C). Compared to the sensitivity values of various MOx gas sensors found in literature (see Table A1), the gas sensor introduced in this work exhibits one of the highest sensitivities towards CO, at lower temperatures. The process flow of our Au-NPs functionalized CuO gas sensor enables integration on CMOS-based microhotplates.
5. Patents
The fabrication procedure and the CO sensor with the specific sensing material are subject-matter of Austrian patent application no. A 50377/2018 filed on May 4, 2018.
Author Contributions
The concept of the presented work has been elaborated by R.W.-T. and A.K.; J.S.N. and O.T. provided the Au-NPs for the sensor fabrication process; the gas sensors were fabricated by R.W.-T.; the gas measurements were conducted by R.W.-T., F.S.-L. and B.Z.T.; the Raman measurement was done by M.D.; the evaluation of the measurements was done by R.W.-T., F.S.-L., M.D. and S.D.; all authors contributed to the writing process.
Funding
This work was funded in part by the Sevenths Framework Programme for Research and Technological Development of the European Union as part of the MSP - Multi-Sensor Platform for Smart Building Management [No. 611887] and the ECSEL project IOSense [GA. No. 692480, FFG No. 6054961].
Acknowledgments
The authors want to thank Günther Maier for valuable discussion during the writing process. Furthermore, the authors want to thank Bernhard Sartory for the SEM investigations.
Conflicts of Interest
The authors declare no conflict of interest.
Abbreviations
The following abbreviations are used in this manuscript:
| MOx | Metal oxide |
| CO | Carbon dioxide |
| CMOS | Complementary metal oxide semiconductor |
| CuO | Cupric oxide |
| CuO | Cuprous oxide |
| HVAC | Heating, ventilation and air conditioning |
| rH | Relative humidity |
| ppm | Parts per million |
| Au-NP | Gold nanoparticles |
| GMS | Gas measurement set-up |
Appendix A. Supplementary Information
Appendix A.1. Metal Oxide-Based Carbon Dioxide Gas Sensors
Table A1.
CO responses of various metal oxide materials reported in literature.
Table A1.
CO responses of various metal oxide materials reported in literature.
| Material | T [C] | Response | CO [ppm] | Reference |
|---|---|---|---|---|
| LaO/SnO | 400 | 3.6 | 2000 | [29] |
| LaOCl | 260 | 3.4 | 2000 | [30] |
| LaOCl-functionalized SnO nanowires | 400 | 5.6 | 2000 | [31] |
| Au-NPs functionalized CuO | 300 | 4.7 | 2000 | this work |
Appendix A.2. Photolithography
Table A2.
Process parameters for the fabrication of gold electrodes.
Table A2.
Process parameters for the fabrication of gold electrodes.
| (1) Photolithography | |
| Positive photoresist | AZ®MIR701 (Microchemicals GmbH) |
| Spin-coating speed [rpm] | 4000 |
| Spin-coating duration [s] | 35 |
| Annealing temperature [C] | 90 |
| Annealing duration [s] | 60 |
| Developer | AZ®MIF726 (Microchemicals GmbH) |
| Development duration [s] | 30 |
| Stopper | deionized water |
| Stopper duration [s] | 120 |
| (2) Thermal Evaporation | |
| Adhesion layer | titanium |
| Adhesion layer thickness [nm] | 5 |
| Primary layer | gold |
| Primary layer thickness [nm] | 200 |
| (3) Lift-Off | |
| Solvent | acetone |
| Duration [h] | 12 |
Appendix A.3. Electron Beam Lithography
Table A3.
Process parameters for the fabrication of the CuO thin film functionalized with Au nanoparticles.
Table A3.
Process parameters for the fabrication of the CuO thin film functionalized with Au nanoparticles.
| (1) Electron Beam Lithography | |
| Positive PMMA resist | AR-P 672.08 (ALLRESIST GmbH) |
| Spin-coating speed [rpm] | 2000 |
| Spin-coating duration [s] | 60 |
| Annealing temperature [C] | 180 |
| Annealing duration [s] | 300 |
| Developer | AR600-55 (ALLRESIST GmbH) |
| Development duration [s] | 15 |
| Stopper | AR600-60 (ALLRESIST GmbH) |
| Stopper duration [s] | 60 |
| (2) Thermal Evaporation | |
| Adhesion layer | titanium |
| Adhesion layer thickness [nm] | 5 |
| Primary layer | copper |
| Primary layer thickness [nm] | 500 |
| (3) Lift-Off | |
| Solvent | acetone |
| Duration [h] | 4 |
| (4) Thermal Oxidation | |
| Oxidation temperature [C] | 400 |
| Oxidation duration [h] | 6 |
| Relative humidity [%] | 50 |
| (5) Au Nanoparticles Depositon | |
| Deposition volume [µL] | 40 |
| Deposition temperature [C] | 85 |
Appendix A.4. Equations for Gibbs Free Energy Calculation
The equations used for calculations were taken form the work of Tanvir et al. [16].
- Standard Gibbs free energy for the formation of a compound:G: Change of the standard Gibbs free energy of the examined chemical reaction at standard conditions. Standard conditions refer to a temperature of 298.15 K and a pressure of 1 bar.: Sum over all standard Gibbs free energies of the products.: Sum over all standard Gibbs free energies of the educts.
- Gibbs free energy at varying pressures (malachite):
- Gibbs free energy at varying pressures (azurite):G: Change of Gibbs free energy of formation at a partial pressure varying from standard conditions.G: Change of the standard Gibbs free energy of the examined chemical reaction at standard conditions. Standard conditions refer to a temperature of 298.15 K and a pressure of 1 bar.R: Gas constant. R = 8.314T: Temperature.p: Partial pressure of CO.
- Gibbs free energy of formation for educts and products envolved in the formation of malachite and azurite (standard conditions):
Table A4. Gibbs free energy of formation for educts and products of malachite and azurite formation at 298.15 K and 1 bar.Table A4. Gibbs free energy of formation for educts and products of malachite and azurite formation at 298.15 K and 1 bar.
Compounds G [] at 298.15 K CuO [32] −127.6 CO [16] −385.99 HO [32] −237.34 Cu(OH)CO [malachite] [32] −906.2 Cu(OH)(CO) [azurite] [32] −1439.13
Appendix A.5. Gas Measurement Set-Up
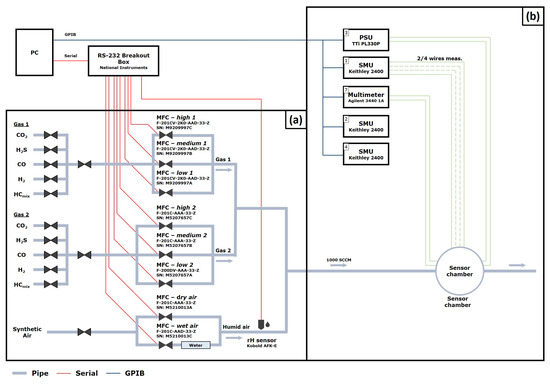
Figure A1.
Gas measurement set-up: (a) gas atmospheric part, (b) electrical evaluation part.
Figure A1.
Gas measurement set-up: (a) gas atmospheric part, (b) electrical evaluation part.

References
- Pachauri, R.K.; Allen, M.R.; Barros, V.R.; Broome, J.; Cramer, W.; Christ, R.; Church, J.A.; Clarke, L.; Dahe, Q.; Dasgupta, P.; et al. Climate Change 2014: Synthesis Report. Contribution of Working Groups I, II and III to the Fifth Assessment Report of the Intergovernmental Panel on Climate Change; IPCC: Geneva, Switzerland, 2014; p. 28. [Google Scholar]
- Ahn, J.; Brook, E.J.; Mitchell, L.; Rosen, J.; McConnell, J.R.; Taylor, K.; Etheridge, D.; Rubino, M. Atmospheric CO2 over the last 1000 years: A high-resolution record from the West Antarctic Ice Sheet (WAIS) Divide ice core. Glob. Biogeochem. Cycles 2011, 26. [Google Scholar] [CrossRef]
- Recent Monthly Average Mauna Loa CO2. 2018. Available online: https://www.esrl.noaa.gov/gmd/ccgg/trends/index.html (accessed on 18 July 2018).
- Seppänen, O.A.; Fisk, W.J.; Mendell, M.J. Association of Ventilation Rates and CO2 Concentrations with Health andOther Responses in Commercial and Institutional Buildings. Indoor Air 1999, 9, 226–252. [Google Scholar] [CrossRef] [PubMed]
- Nassif, N. A robust CO2-based demand-controlled ventilation control strategy for multi-zone HVAC systems. Energy Build. 2012, 45, 72–81. [Google Scholar] [CrossRef]
- Raum-Luftqualitätsfühler QPA10.. QPA20.., 2005. Available online: https://hit.sbt.siemens.com/RWD/DB/DE/de/Assets/39693.pdf (accessed on 18 July 2018).
- Ratterman, M.; Shen, L.; Klotzkin, D.; Papautsky, I. Carbon dioxide luminescent sensor based on a CMOS image array. Sens. Actuators B Chem. 2014, 198, 1–6. [Google Scholar] [CrossRef]
- Wang, J.; Wen, Z.; Yang, B.; Yang, X. Optical carbon dioxide sensor based on fluorescent capillary array. Results Phys. 2017, 7, 323–326. [Google Scholar] [CrossRef]
- Pentyala, V.; Davydovskaya, P.; Ade, M.; Pohle, R.; Urban, G. Carbon dioxide gas detection by open metal site metal organicframeworks and surface functionalized metal organic frameworks. Sens. Actuators B Chem. 2016, 225, 363–368. [Google Scholar] [CrossRef]
- Lorenc, P.; Strzelczyk, A.; Chachulski, B.; Jasinski, G. Properties of Nasicon-based CO2 sensors with Bi8Nb2O17 reference electrode. Solid State Ion. 2015, 271, 48–55. [Google Scholar] [CrossRef]
- Wang, X.; Qin, H.; Sun, L.; Hu, J. CO2 sensing properties and mechanism of nanocrystalline LaFeO3 sensor. Sens. Actuators B Chem. 2013, 188, 965–971. [Google Scholar] [CrossRef]
- Lee, J.; Choi, N.J.; Lee, H.K.; Kim, J.; Lim, S.; Kwon, J.; Lee, S.; Moon, S.; Jong, J.; Yoo, D. Low power consumption solid electrochemical-type micro CO2 gas sensor. Sens. Actuators B Chem. 2017, 248, 957–960. [Google Scholar] [CrossRef]
- Abouda, A.; Al-Keleshb, H.; El Roubyc, W.; Farghalic, A.; Hamdedeinc, A.; Khedrc, M. CO2 responses based on pure and doped CeO2 nano-pellets. J. Mater. Res. Technol. 2018, 7, 14–20. [Google Scholar] [CrossRef]
- Yadav, A.; Lokhande, A.; Kim, J.H.; Lokhande, C. Enhanced sensitivity and selectivity of CO2 gas sensor based on modified La2O3 nanorods. J. Alloys Compd. 2017, 723, 880–886. [Google Scholar] [CrossRef]
- Tanvir, N.; Yurchenko, O.; Laubender, E.; Urban, G. Investigation of low temperature effects on work function based CO2 gas sensing of nanoparticulate CuO films. Sens. Actuators B Chem. 2017, 247, 968–974. [Google Scholar] [CrossRef]
- Tanvir, N.; Yurchenko, O.; Wilbertz, C.; Urban, G. Investigation of CO2 reaction with copper oxide nanoparticles for room temperature gas sensing. J. Mater. Chem. A 2016, 4, 5294–5302. [Google Scholar] [CrossRef]
- Herran, J.; Mandayo, G.; Castano, E. Semiconducting BaTiO3-CuO mixed oxide thin films for CO2 detection. Thin Solids Films 2009, 517, 6192–6197. [Google Scholar] [CrossRef]
- Debbichi, L.; Marco de Lucas, M.; Pierson, J.; Krüger, P. Vibrational Properties of CuO and Cu4O3 from First-Principles Calculations, and Raman and Infrared Spectroscopy. J. Phys. Chem. 2012, 116, 10232–10237. [Google Scholar] [CrossRef]
- Deutsche Forschungsgemeinschaft. MAK– und BAT–Werte–Liste 2013: Maximale Arbeitsplatzkonzentrationen und Biologische Arbeitsstofftoleranzwerte. Mitteilung 49; Wiley VCH Verlag GmbH & Co. KGaA: Weinheim, Germany, 2013; p. 93. [Google Scholar] [CrossRef]
- Steinhauer, S.; Brunet, E.; Maier, T.; Mutinati, G.; Köck, A. Suspended CuO nanowires for ppb level H2S sensing in dry and humid atmosphere. Sens. Actuators B Chem. 2013, 186, 550–556. [Google Scholar] [CrossRef]
- Chen, M.; Yue, Y.; Ju, Y. Growth of metal and metal oxide nanowires driven by the stress-induced migration. J. Appl. Phys. 2012, 111, 104305. [Google Scholar] [CrossRef]
- Xu, C.H.; Woo, C.H.; Shi, S.Q. Formation of CuO nanowires on Cu foil. Chem. Phys. Lett. 2004, 399, 62–66. [Google Scholar] [CrossRef]
- Adilov, S.R.; Afanaciev, V.P.; Kashkul, I.N.; Kumekov, S.E.; Mukhin, N.V.; Terukov, E.I. Studying the Composition and Structure of Films Obtained by Thermal Oxidation of Copper. Glass Phys. Chem. 2017, 43, 272–275. [Google Scholar] [CrossRef]
- Abdelmounaïm, C.; Amara, Z.; Maha, A.; Mustapha, D. Effects of molarity on structural, optical, morphological and CO2 gas sensing properties of nanostructured copper oxide films deposited by spray pyrolysis. Mater. Sci. Semicond. Process. 2016, 43, 214–221. [Google Scholar] [CrossRef]
- Ishihara, T.; Higuchi, M.; Takagi, T.; Ito, M.; Nishiguchi, H.; Takita, Y. Preparation of CuO thin films on porous BaTiO3 by self-assembled multibilayer film formation and application as a CO2 sensor. J. Mater. Chem. 1998, 8, 2037–2042. [Google Scholar] [CrossRef]
- Seguin, M. Thermogravimetric And Differential Thermal Analysis Of Malachite And Azurite In Inert Atmospheres And In Air. Can. Mineral. 1975, 13, 127–132. [Google Scholar]
- Korotcenkov, G. Handbook of Gas Sensor Materials, 1st ed.; Springer-Verlag New York: New York, NY, USA, 2013; pp. 273–279. [Google Scholar]
- Yang, X.; Kattel, S.; Senanayake, S.; Boscoboinik, J.; Nie, X.; Graciani, J.; Rodriguez, J.; Liu, P.; Stacchiola, D.; Chen, J.G. Low Pressure CO2 Hydrogenation to Methanol over Gold Nanoparticles Activated on a CeOx/TiO2 Interface. J. Am. Chem. Soc. 2015, 137, 10104–10107. [Google Scholar] [CrossRef] [PubMed]
- Iwata, T.; Matsuda, K.; Takahashi, K.; Sawada, K. CO2 Sensing Characteristics of a La2O3/SnO2 Stacked Structure with Micromachined Hotplates. Sensors 2017, 17, 2156. [Google Scholar] [CrossRef] [PubMed]
- Marsal, A.; Dezanneau, G.; Cornet, A.; Morante, J. A new CO2 gas sensing material. Sens. Actuators B Chem. 2003, 95, 266–270. [Google Scholar] [CrossRef]
- Trung, D.; Toan, L.; Hong, H.; Lam, T.; Trung, T.; Hieu, N. Selective detection of carbon dioxide using LaOCl-functionalized SnO2 nanowires for air-quality monitoring. Talanta 2012, 88, 152–159. [Google Scholar] [CrossRef] [PubMed]
- Robie, R.; Waldbaum, D. Thermodynamic properties of minerals and related substances at 298.15 K (25.0 °C) and one atmosphere (1.013 bars) pressure and at higher temperatures. Available online: https://pubs.er.usgs.gov/publication/b1259 (accessed on 22 November 2018).


© 2018 by the authors. Licensee MDPI, Basel, Switzerland. This article is an open access article distributed under the terms and conditions of the Creative Commons Attribution (CC BY) license (http://creativecommons.org/licenses/by/4.0/).