Article

A Co2+ Fluorescent Probe Based on Surface Complexation for On-Site Feed Detection

1
HQU Research Center for Emerging Pollutants Analysis and Ecotoxicology Assessment, College of Materials Science and Engineering, Huaqiao University, Xiamen 361021, China
2
College of Chemical Engineering, Huaqiao University, Xiamen 361021, China
*
Authors to whom correspondence should be addressed.
Chemosensors 2026, 14(7), 168; https://doi.org/10.3390/chemosensors14070168
Submission received: 9 June 2026 / Revised: 2 July 2026 / Accepted: 14 July 2026 / Published: 16 July 2026
(This article belongs to the Special Issue Fluorescent Probes for Highly Sensitive Ion and Compound Detection)

Abstract

As a core component of vitamin B12, Co2+ is closely associated with the health, life performance, and productivity of ruminants. Therefore, the selective and sensitive detection of Co2+ is of great significance. In this work, using the Au–S bond as an “anchor”, a ternary nanocomposite (CDs-AuNPs-GSH) with synergistic functions was constructed by combining gold nanoparticles (AuNPs) with glutathione (GSH) through hydrogen bonding and electrostatic interactions with functional groups on the surface of carbon dots (CDs). The resulting nanocomposite was employed as a fluorescence sensor for Co2+ detection. Under optimal conditions at pH 6.0, the sensor exhibited a good linear relationship over the Co2+ concentration range of 0.5–125.0 mM, with a limit of detection (LOD) of 0.38 mM. The interaction mechanism between Co2+ and the composite was systematically investigated using various characterization methods. The results indicated that Co2+, owing to its strong coordination ability, enriches on the surface of the composite, subsequently triggering dynamic fluorescence quenching via an electron transfer pathway. The sensor was successfully applied to determine Co2+ in mixed livestock and poultry feed samples, with recovery rates ranging from 89.4% to 103.9%, demonstrating its potential for on-site detection in feed analysis.

1. Introduction

Cobalt ions (Co2+), as typical transition metal ions, are widely present in various fields such as battery manufacturing, metallurgical processing, catalytic materials, the pharmaceutical industry, and livestock and poultry feed [1,2,3]. Although cobalt is one of the essential trace elements for the human body, its excessive presence in the environment poses potential risks to ecosystems and human health, including neurological damage, cardiovascular diseases, and cytotoxic effects [4,5]. Feed is the primary source of Co2+ intake for animals. Excessive Co2+ content in feed not only endangers the health of livestock and poultry but may also affect human safety through the food chain [6]. Therefore, the detection of Co2+ in feed is of critical importance.
Conventional detection techniques for Co2+ mainly include atomic absorption spectrometry (AAS), inductively coupled plasma mass spectrometry (ICP-MS), electrochemical analysis, and spectrophotometry [7,8]. Although these methods offer high detection accuracy, they generally suffer from drawbacks such as expensive instrumentation, complicated operation, and long detection cycles, making it difficult to meet the requirements for on-site rapid screening [9]. In recent years, fluorescence analysis technology has emerged as a new technical route for the on-site screening of metal ions, owing to its advantages of high sensitivity, rapid response, simple operation, low sample consumption, and easy realization of visual detection [10,11].
Among various fluorescent materials, carbon dots (CDs), as a novel class of zero-dimensional carbon nanomaterials, are rich in functional groups such as carboxyl, hydroxyl, and amino groups on their surface and exhibit stable fluorescence emission properties, making them promising for a wide range of applications including fluorescence sensing, bioimaging, drug delivery, and optoelectronic devices [12,13]. However, the limited types and quantities of surface functional groups on pristine CDs often render their detection sensitivity for specific metal ions insufficient for practical requirements [14]. To overcome this limitation, researchers have increasingly focused on constructing composite systems by integrating CDs with other functional materials, such as metal nanoparticles, polymers, metal–organic frameworks (MOFs), and coordination compounds [15].
Co2+ possesses partially filled d orbitals and readily forms coordination bonds with oxygen- or nitrogen-containing donor atoms, thereby producing a significant quenching effect on the fluorescence of CDs [16,17]. The surface structure, particle size distribution, and electronic state characteristics of CDs in different composite systems can greatly influence their fluorescence response behavior [18]. Introducing functional molecules or polymers with specific coordination sites can enhance the selective recognition of Co2+. Meanwhile, tuning the surface defect states of CDs helps to optimize their fluorescence quantum yield and response sensitivity [19]. Therefore, an in-depth investigation of the fluorescence quenching mechanism based on surface complexation, from the perspectives of both material structural design and mechanistic study, is of great guiding significance for the development of high-performance CD-based fluorescence sensing systems for Co2+.
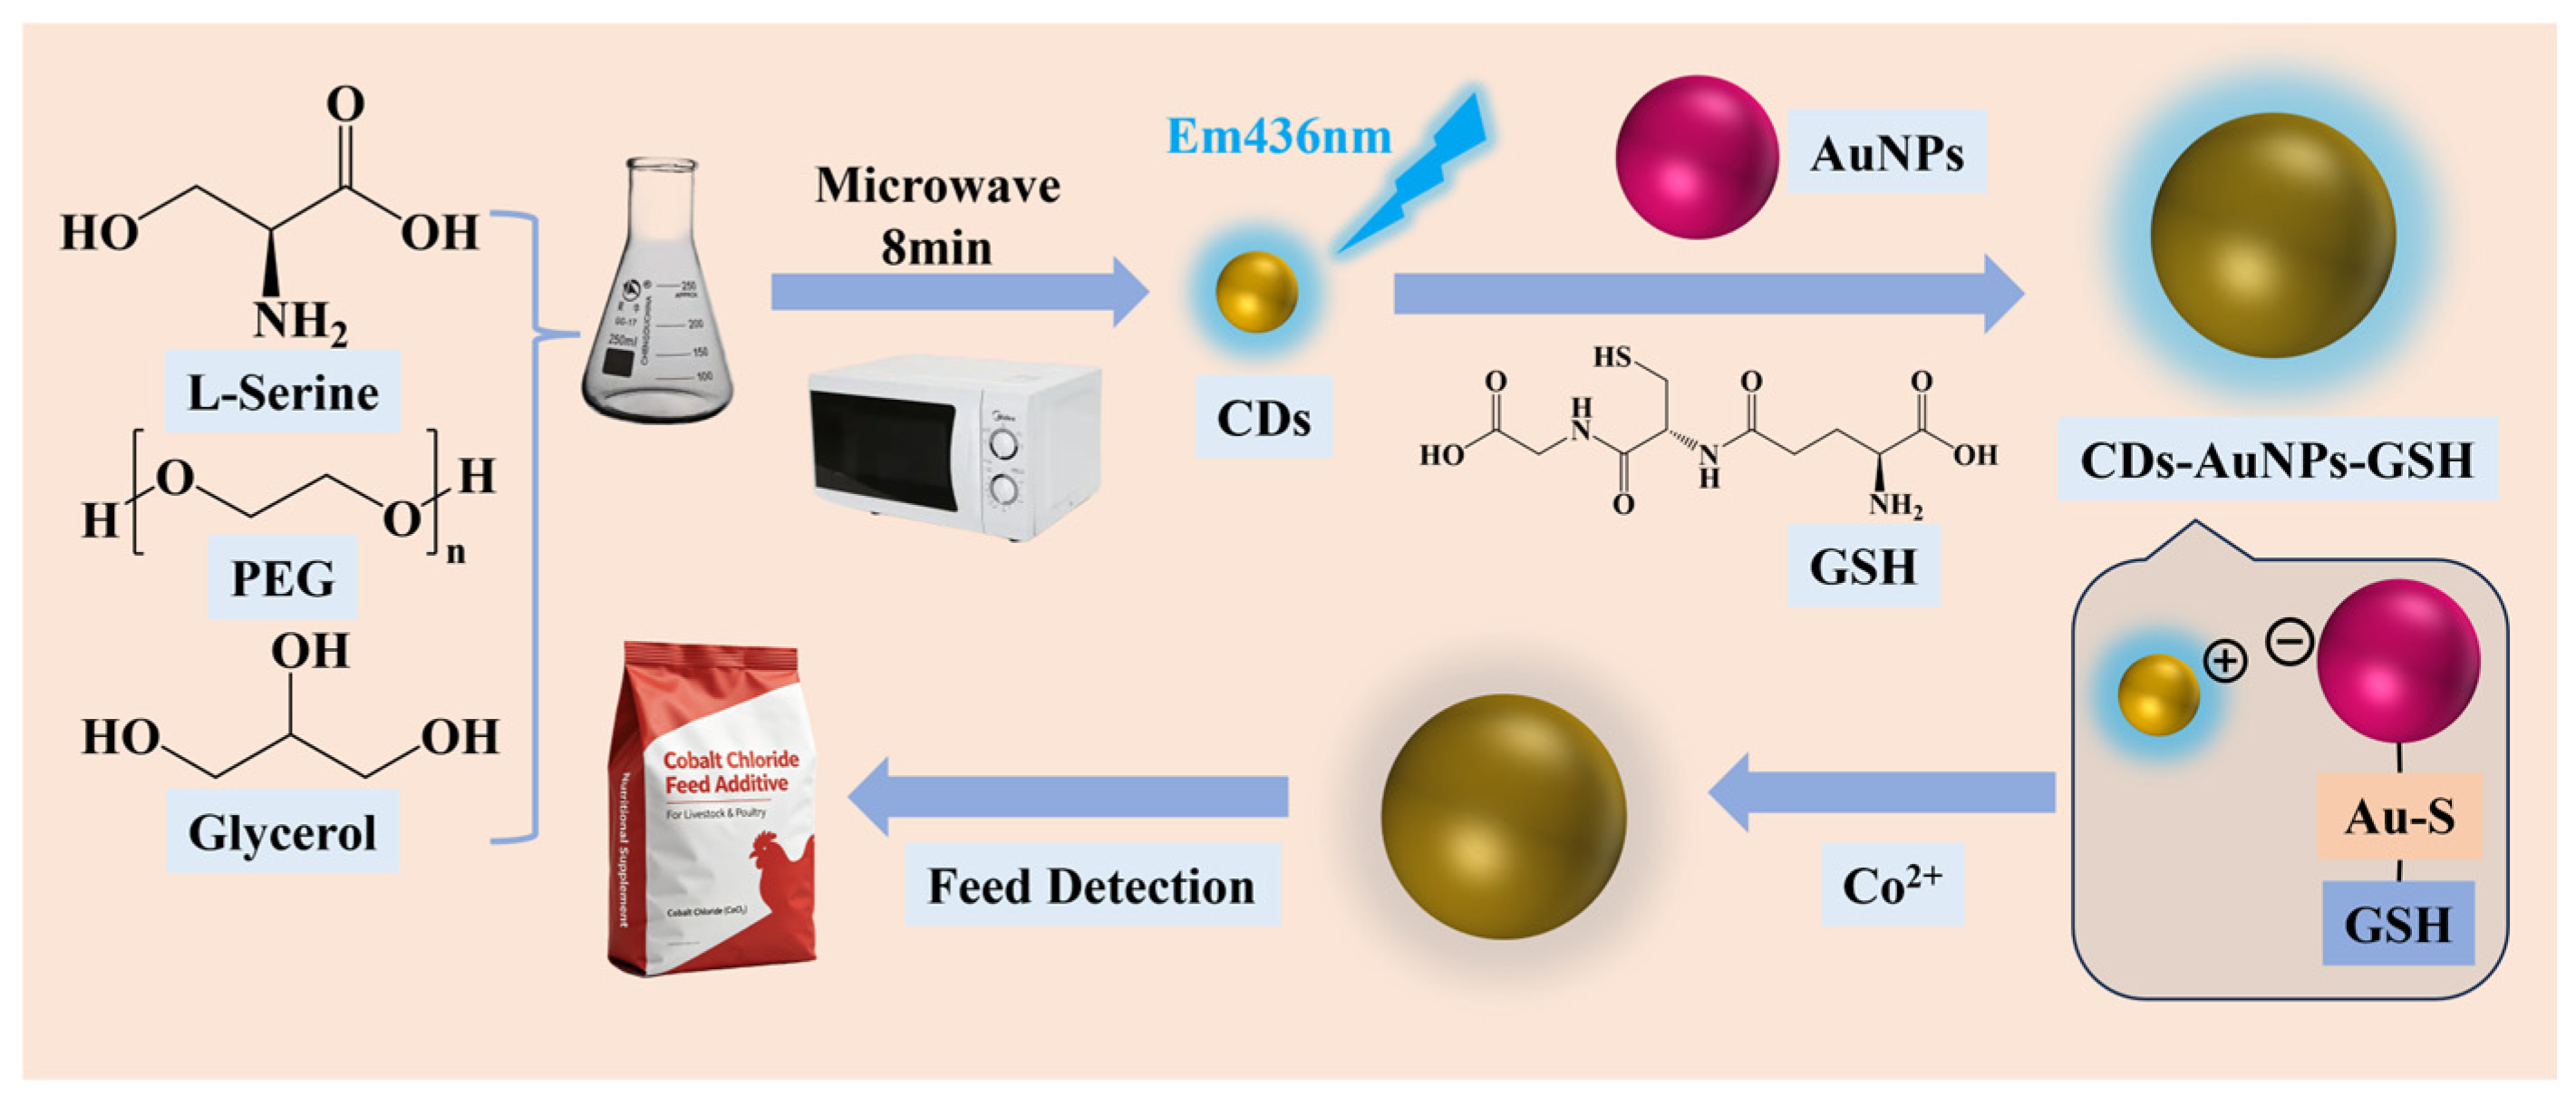
In this work, a carbon dot-based fluorescent composite probe was constructed using CDs, gold nanoparticles (AuNPs), and glutathione (GSH) for the rapid and sensitive detection of Co2+ in feed. As illustrated in Figure 1, the CDs prepared via a microwave method were assembled with AuNPs and GSH through electrostatic adsorption and Au–S bonds. The resulting composite then coordinates with Co2+, leading to fluorescence quenching. Thus, a simple and rapid detection system for Co2+ was developed, and its linear range, recovery, and specificity were evaluated.

2. Experimental Materials and Methods

2.1. Materials and Methods

L-Serine, Glutathione, MnCl2, ZnCl2 and Glycerol were obtained from the Macklin Biochemical Co., Ltd. (Shanghai, China). Poly(ethylene glycol) (Mn 1500), Sodium citrate dihydrate, HAuCl4·3H2O, CoCl2 and ZrCl4 were obtained from the Aladdin Biochemical Technology Co., Ltd. (Shanghai, China). NaCl, CaCl2, FeSO4·7H2O, Ni(NO3)2·6H2O, Hydrochloric acid and Ethanol were obtained from the Sinopharm Chemical Reagent Co., Ltd. (Shanghai, China). MgCl2·6H2O and KCl were obtained from Xilong Scientific Co., Ltd. (Guangdong, China). All the reagents were applied directly without further purification.
The morphology was acquired using a Talos F200X G2 transmission electron microscope (TEM, Thermo Fisher Scientific, Brno, Czech Republic) at an acceleration voltage of 200 kV. The crystal structure was characterized via X-ray diffraction (XRD), and the data were collected on a Rigaku Smart Lab-3Kw X-ray diffractometer (Rigaku Corporation, Akishima, Tokyo, Japan). The surface functional groups of NCDs were measured using a NICOLET iS 50 Fourier transform infrared spectrometer (FT-IR, Thermo Fisher Scientific, Madison, WI, USA). The fluorescence spectroscopy (FL) and ultraviolet-visible absorption spectroscopy (UV-Vis) were measured on a Hitachi F-7000 fluorescence spectrometer (Hitachi High-Technologies Corporation, Minato, Tokyo, Japan) and a Molecular Devices/SpectraMax iD5 (Molecular Devices, LLC, San Jose, CA, USA), respectively. The fluorescence lifetime was measured using an Edinburgh FLS1000 steady state and lifetime fluorescence spectrometer (Edinburgh Instruments Ltd., Livingston, UK). The zeta potential was measured using a nanobrook omni multi-angle particle size and high-sensitivity zeta potential analyzer (Brookhaven Instruments Corporation, Holtsville, NY, USA).

2.2. Synthesis of CDs

A mixture of 1 g PEG (Mn = 1500) and 1 g L-serine was fully dissolved in 15 mL glycerol. The mixture was transferred to a flask and heated in a microwave oven at high power for 10 min. The resulting crude CDs solution was allowed to cool to room temperature and stored in the dark. A portion of the crude solution was dialyzed against deionized water using a 1000 Da dialysis bag for 48 h. After dialysis, the solution was freeze-dried under vacuum to obtain CDs powder, which was then stored in the dark for further use.

2.3. Synthesis of AuNPs

Using a previously reported method [20], 20 mL of 38.8 mM sodium citrate solution was added to 200 mL of a boiling 1.0 mM HAuCl4 solution under rapid stirring. The mixture was kept boiling for another 15 min. After naturally cooling to room temperature, the solution was filtered through a 0.22 μm Millipore membrane filter. The as-prepared AuNPs (approximately 20 nm in diameter) were stored at 4 °C.

2.4. Pre-Treatment of the Feed Sample

According to the national standard (GB/T 13884-2018) [21], the feed samples were pretreated as follows: 2 g of feed was weighed into a beaker, and 100 mL of 0.1 M hydrochloric acid solution was added. The mixture was stirred for 30 min for extraction, then centrifuged at 5000 r/min for 5 min. The obtained supernatant was filtered through a 0.22 μm membrane. After filtration, the extract was concentrated to one-tenth of its original volume using a rotary evaporator.

2.5. Preparation of Co2+ Fluorescence Sensor and Detection of Co2+

The as-prepared CD stock solution was diluted 100-fold with deionized water to obtain the working concentration. A 1.0 M GSH solution was prepared using deionized water. The CDs, AuNPs, and GSH were then mixed at a volume ratio of 10:0.5:1 to form the CD-based fluorescent composite (CDs-AuNPs-GSH), which was stored in the dark. For Co2+ detection, the above CDs-AuNPs-GSH composite was mixed with different concentrations of Co2+ at a volume ratio of 1: 99 and incubated at room temperature for 10 min. Fluorescence measurements were then performed with an excitation wavelength of 350 nm and an emission wavelength of 436 nm. The signal was expressed as (F0−F)/F, where F0 is the fluorescence intensity of the CDs-AuNPs-GSH composite without Co2+, and F is the fluorescence intensity of the composite in the presence of different concentrations of Co2+.

3. Results and Discussions

3.1. Characterization of CDs and CDs-AuNPs-GSH

3.1.1. Characterization of CDs

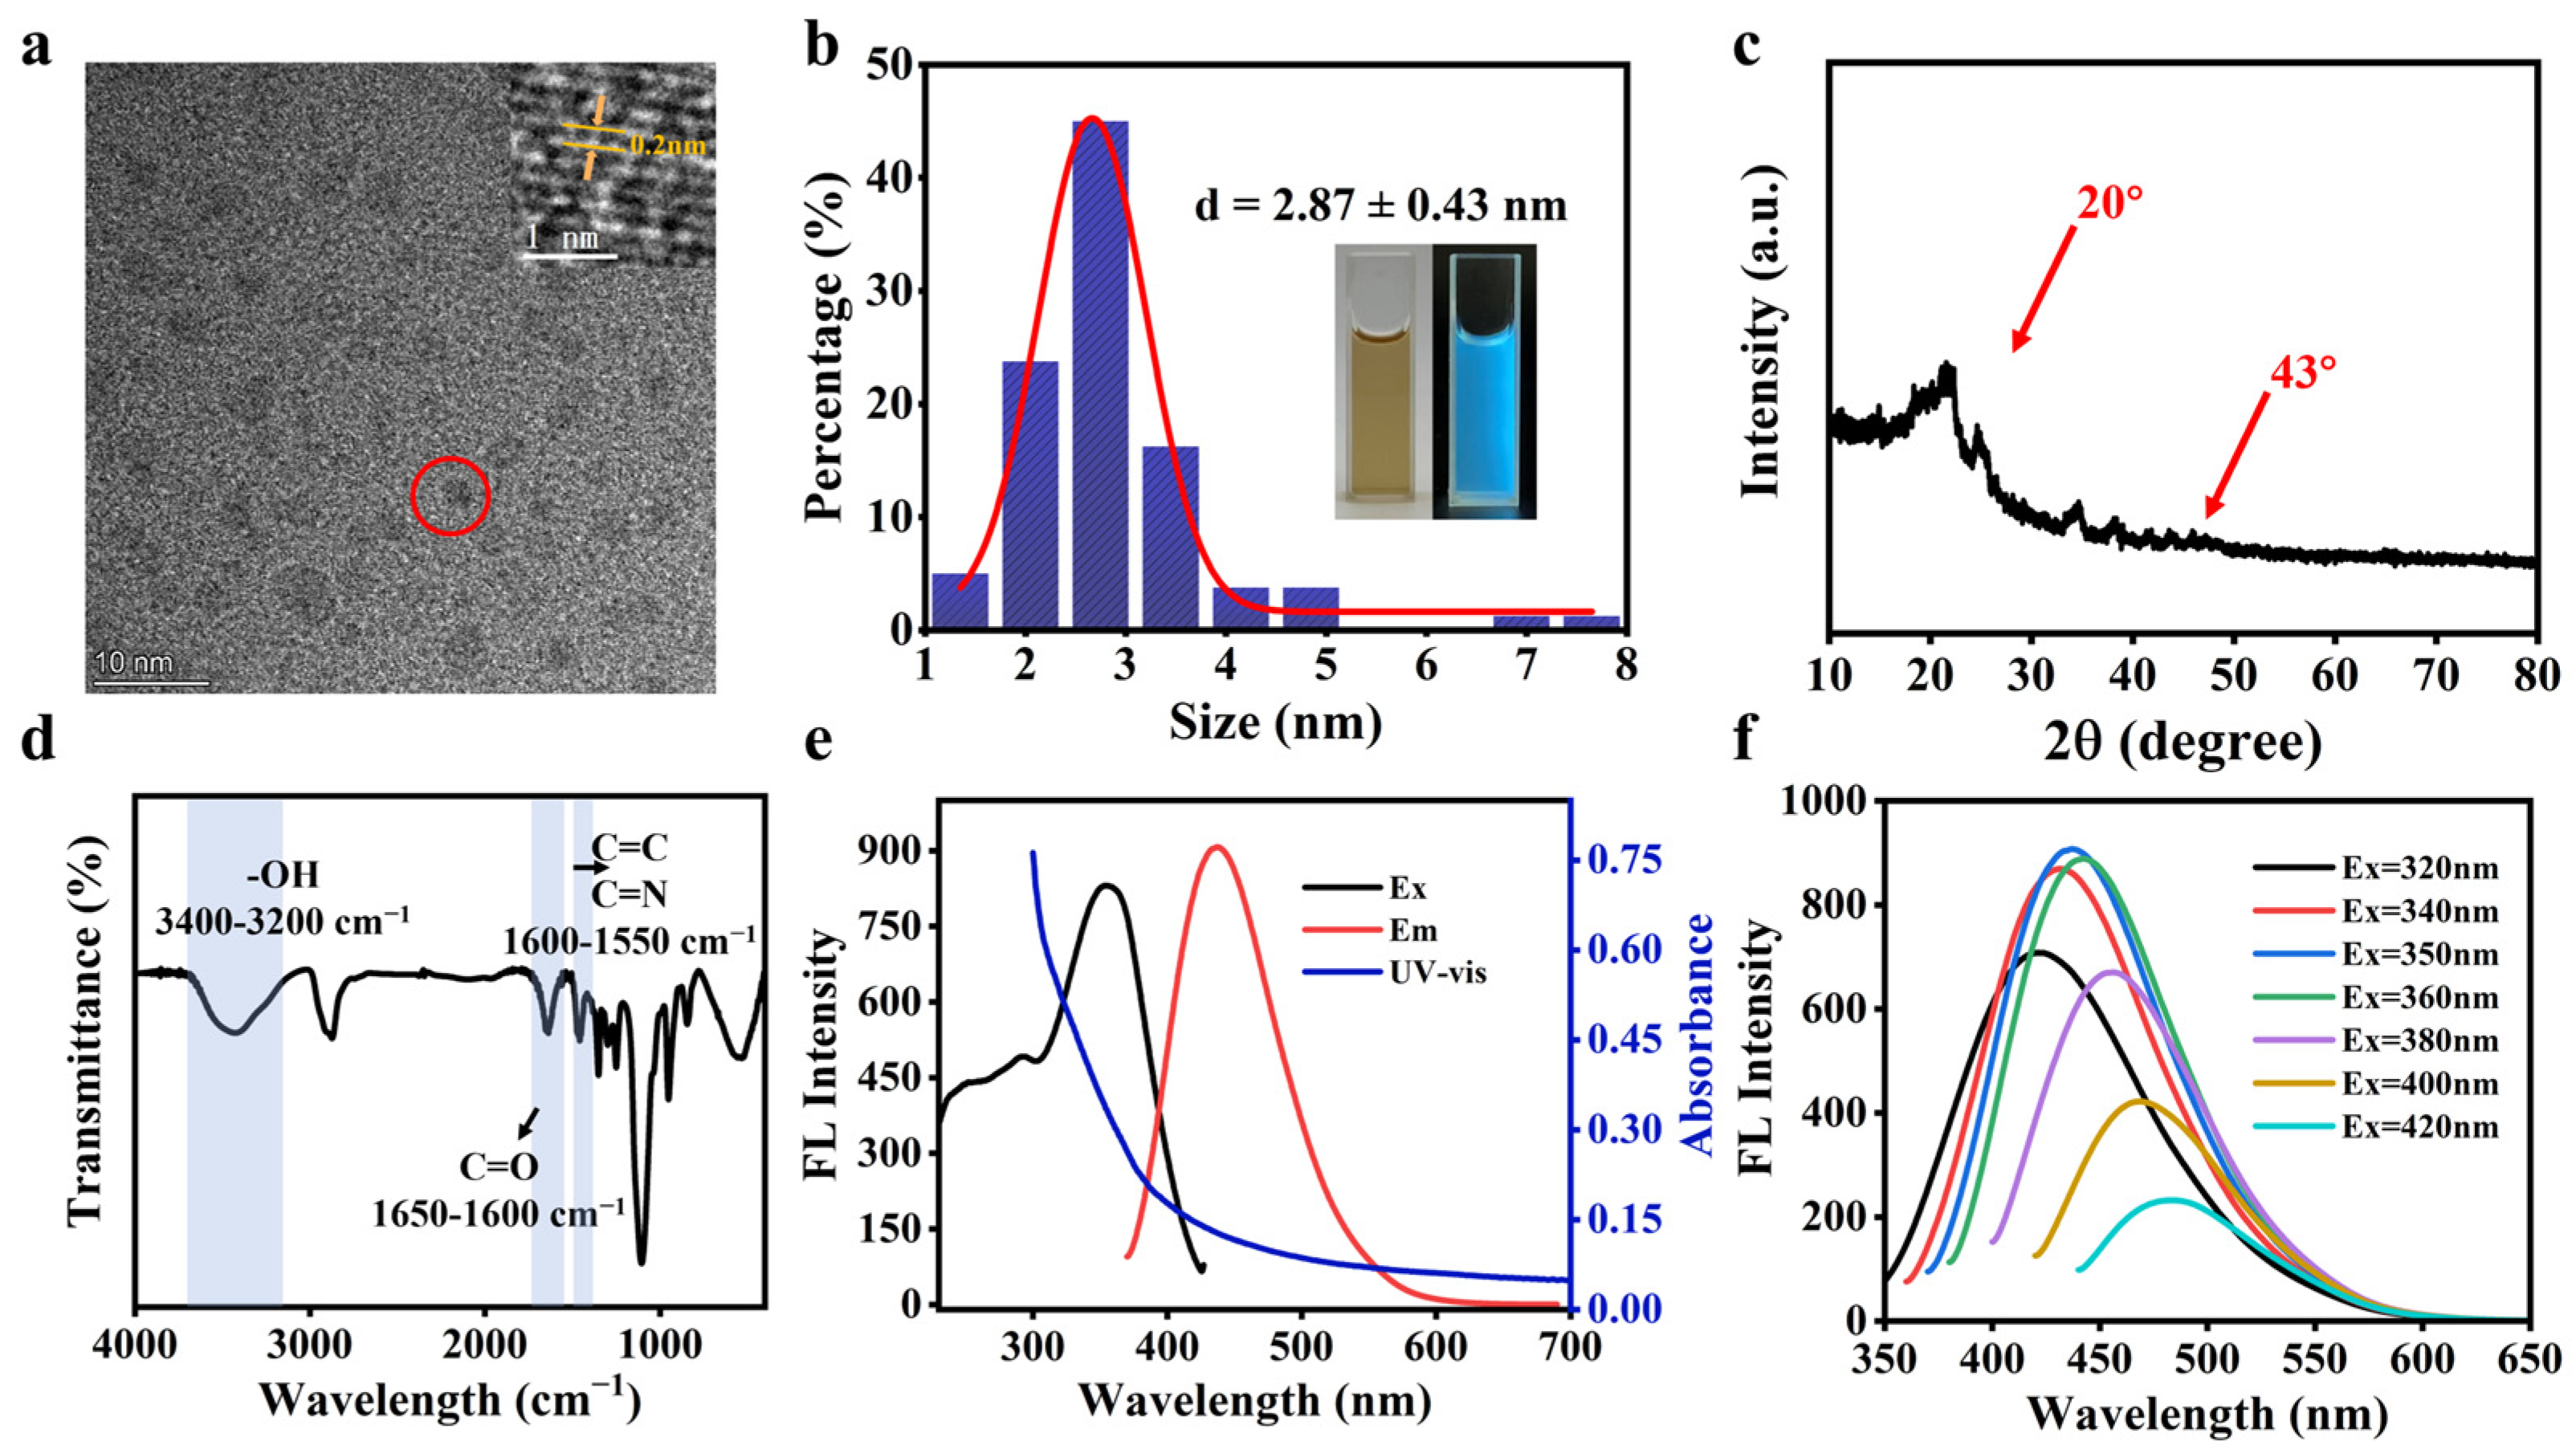
The morphology and size of CDs were characterized via transmission electron microscopy (TEM). As shown in Figure 2a, the CDs exhibit nearly spherical particle shapes with uniform dispersion, with particle sizes ranging from 1.37 to 7.81 nm and an average diameter of 2.87 nm (Figure 2b), showing no obvious aggregation. Under white light, the aqueous solution of CDs appears pale yellow, and under excitation at 365 nm, it emits strong blue fluorescence. High-resolution TEM further reveals clear lattice fringes spaced at 0.2 nm, corresponding to the (101) plane of graphitic carbon or the (100) plane of graphene, indicating the presence of certain graphitic microdomains within the synthesized CDs [22]. XRD analysis, as shown in Figure 2c, reveals a broad and intense diffraction peak at 20°, which is attributed to the highly disordered carbon framework or amorphous carbon characteristics introduced by abundant surface functional groups (such as oxygen- and nitrogen-containing groups); meanwhile, a weaker diffraction peak observed at 43° confirms the existence of short-range ordered graphitic structures within the CDs, corresponding to the (101) or (100) reflections of graphite, consistent with the 0.2 nm lattice spacing observed in TEM [23]. Combining TEM and XRD results, it can be inferred that the synthesized CDs are primarily composed of an amorphous carbon matrix embedded with nanoscale graphitic microdomains. This partially graphitized structure provides conjugated sp2-hybridized carbon domains and defect-related emission centers, forming the structural basis for their strong fluorescent emission.
Infrared spectroscopy was used to identify the surface functional groups on the CDs, revealing the presence of various oxygen- and nitrogen-containing groups, as shown in Figure 2d. A broad and strong absorption peak between 3200 and 3400 cm−1 corresponds to the stretching vibrations of –OH and –NH groups, indicating abundant hydroxyl and amino groups on the CDs surface, closely related to the introduction of PEG, glycerol, and L-serine. An absorption peak near 2920 cm−1 corresponds to the stretching vibration of aliphatic C–H bonds, suggesting that some alkyl structures remain on the CDs’ surface. The absorption band in the range of 1600–1650 cm−1 is assigned to the stretching vibration of C=O, while the characteristic peak at 1550–1600 cm−1 may be associated with N–H bending or C=N/C=C vibrations, confirming successful nitrogen doping into the CDs structure. Strong absorption peaks in the region of 1000–1200 cm−1 mainly originate from the stretching vibrations of C–O–C and C–O bonds, reflecting ether linkages and hydroxyl groups derived from PEG and glycerol. These results indicate that the CDs synthesized via the microwave-assisted method possess abundant hydrophilic functional groups such as hydroxyl, carboxyl, amino, and ether groups, which contribute to their excellent dispersibility in aqueous media and facilitate subsequent functionalization.
The optical properties of CDs were investigated using UV-Vis and fluorescence spectroscopy. The UV-Vis spectrum of CDs is shown in Figure 2e, exhibiting distinct absorption features in the ultraviolet region. The absorption near 250–300 nm is attributed to π–π* transitions of C=C bonds in the sp2 carbon structure, while the shoulder or weak absorption in the 300–350 nm region is associated with n–π* transitions caused by oxygen- and nitrogen-containing functional groups such as C=O and C–N. This suggests that during the microwave synthesis process, precursors including PEG, L-serine, and glycerol underwent carbonization and condensation reactions, resulting in a CDs structure containing conjugated carbon cores and rich surface functional groups. The fluorescence emission behavior of CDs under different excitation wavelengths is shown in Figure 2f. As the excitation wavelength increases from 320 nm to 420 nm, the maximum emission peak of the CDs redshifts by 60 nm, while the fluorescence intensity gradually decreases from enhancement, exhibiting typical excitation-wavelength-dependent emission characteristics. This phenomenon is likely attributed to the non-uniform size distribution and diverse surface state energy levels of the CDs, where different excitation wavelengths selectively activate distinct emitting centers at various energy levels, thereby causing shifts in emission wavelength. These results indicate that both core-state and surface-state emission mechanisms coexist in the synthesized CDs, and surface functional groups (such as carboxyl and amino groups) play a significant role in their photoluminescence process. Furthermore, the emission spectra exhibit consistent redshifts with increasing excitation wavelength, showing good correspondence with each other, suggesting stable emitting centers within this CDs system [24]. The strongest emission peak of the CDs lies in the blue region (approximately 430–470 nm), and combined with their strong and broad absorption in the ultraviolet region, it can be inferred that the fluorescence emission primarily arises from radiative recombination processes associated with surface states [25]. The above optical properties demonstrate that the CDs synthesized via this method possess excellent UV-vis responsiveness and tunable emission behavior, offering promising potential applications in fluorescent probes, bioimaging, and optoelectronic functional materials.

3.1.2. Characterization of AuNPs

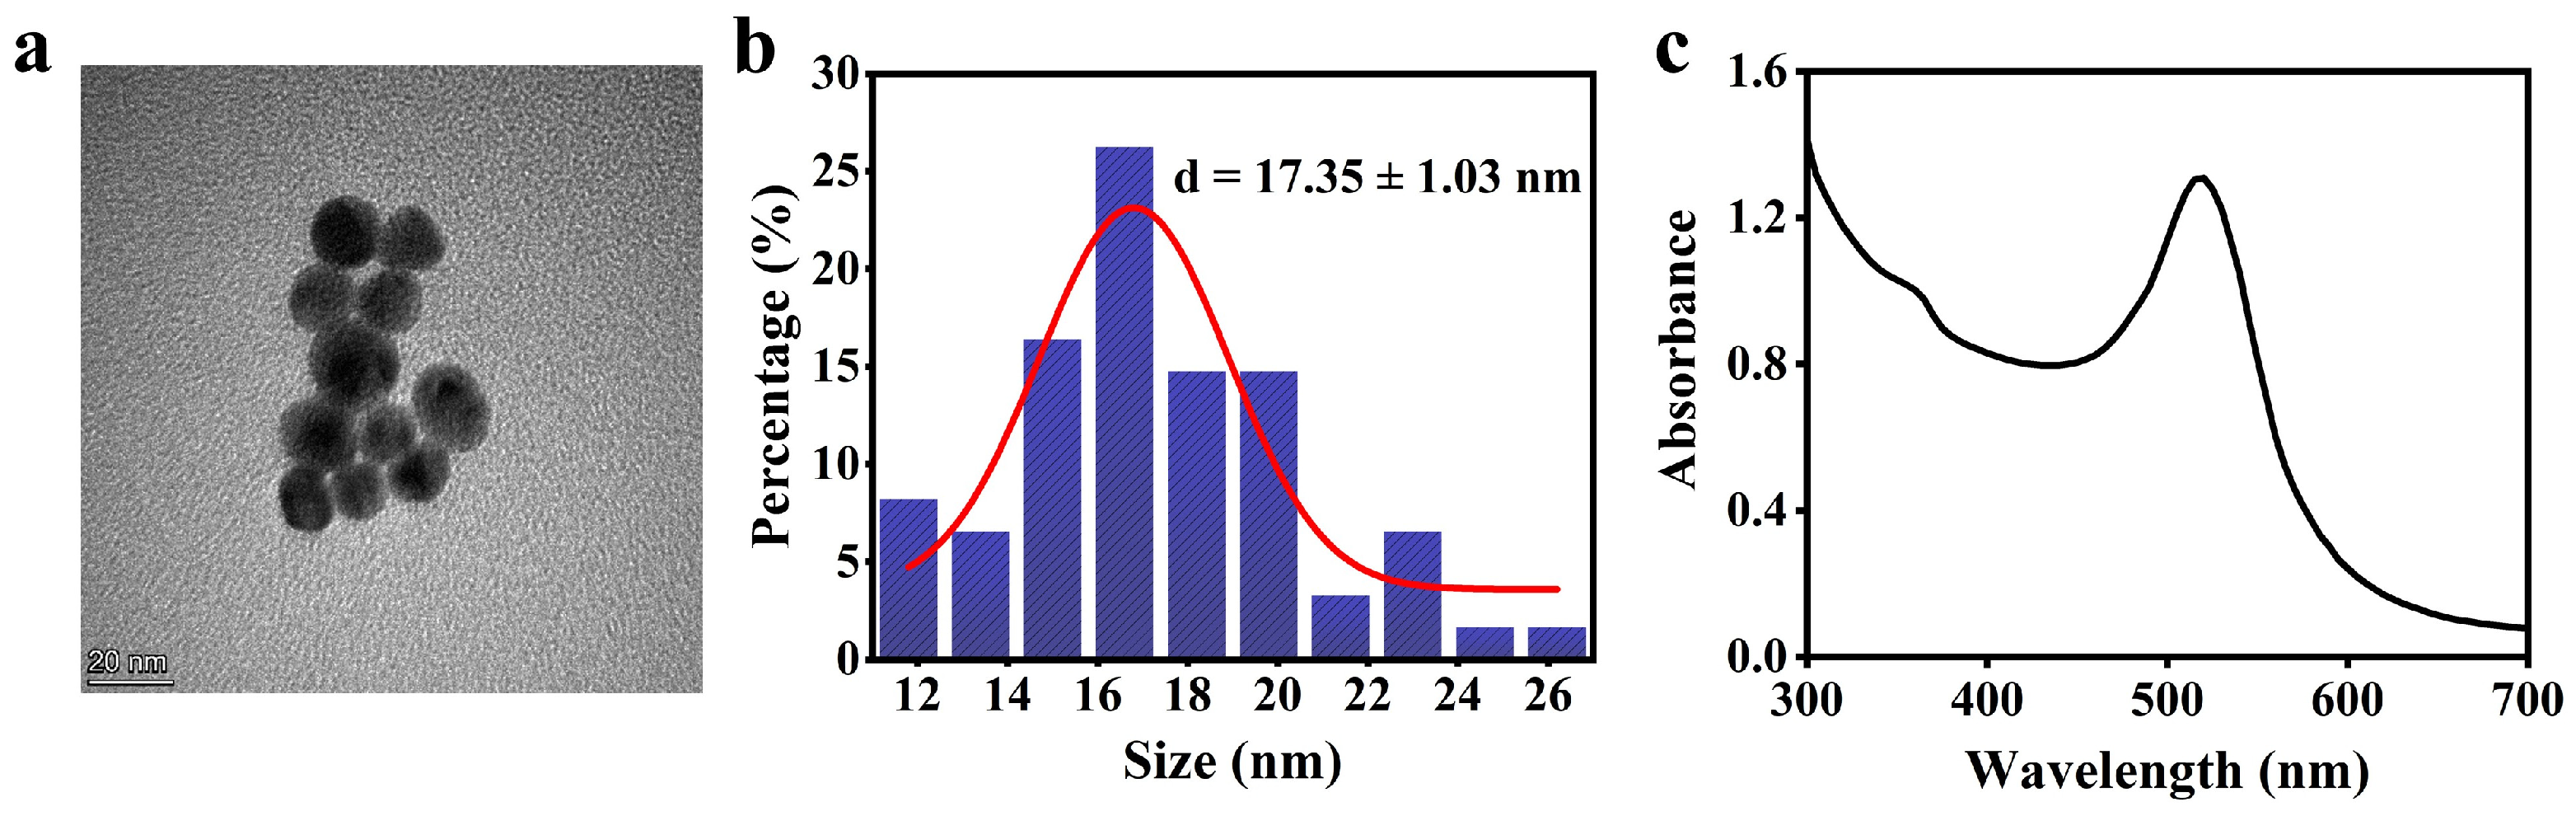
The morphology and particle size distribution of the prepared AuNPs were analyzed via TEM. As shown in Figure 3a,b, the AuNPs were nearly spherical, with clear particle contours and high contrast. The particle size of the AuNPs was analyzed, and it was found to be in the range of 11.13 to 26.90 nm, with an average size of 17.35 nm. It was observed that there was a certain degree of agglomeration of the AuNPs, which might be related to the high surface energy of the nanoparticles or the enhanced interaction between the particles during the drying process. Although there was a slight agglomeration, most of the particles still maintained the independent nanoparticle morphology, without obvious shape collapse or irregular structure, indicating that the synthesis method adopted could effectively control the nucleation and growth process of AuNPs.
The UV-vis test of AuNPs showed that there was a clear absorption peak at 520 nm in the AuNPs (as shown in Figure 3c), which was caused by the localized surface plasmon resonance, causing the AuNPs to strongly absorb light at 520 nm, and the solution color was wine red. Combined with the literature report [26], the absorption peak of spherical gold nanoparticles with diameters in the range of 10 to 30 nm was also located at 520 nm, which proved the successful synthesis of AuNPs.

3.1.3. Characterization of CDs-AuNPs-GSH

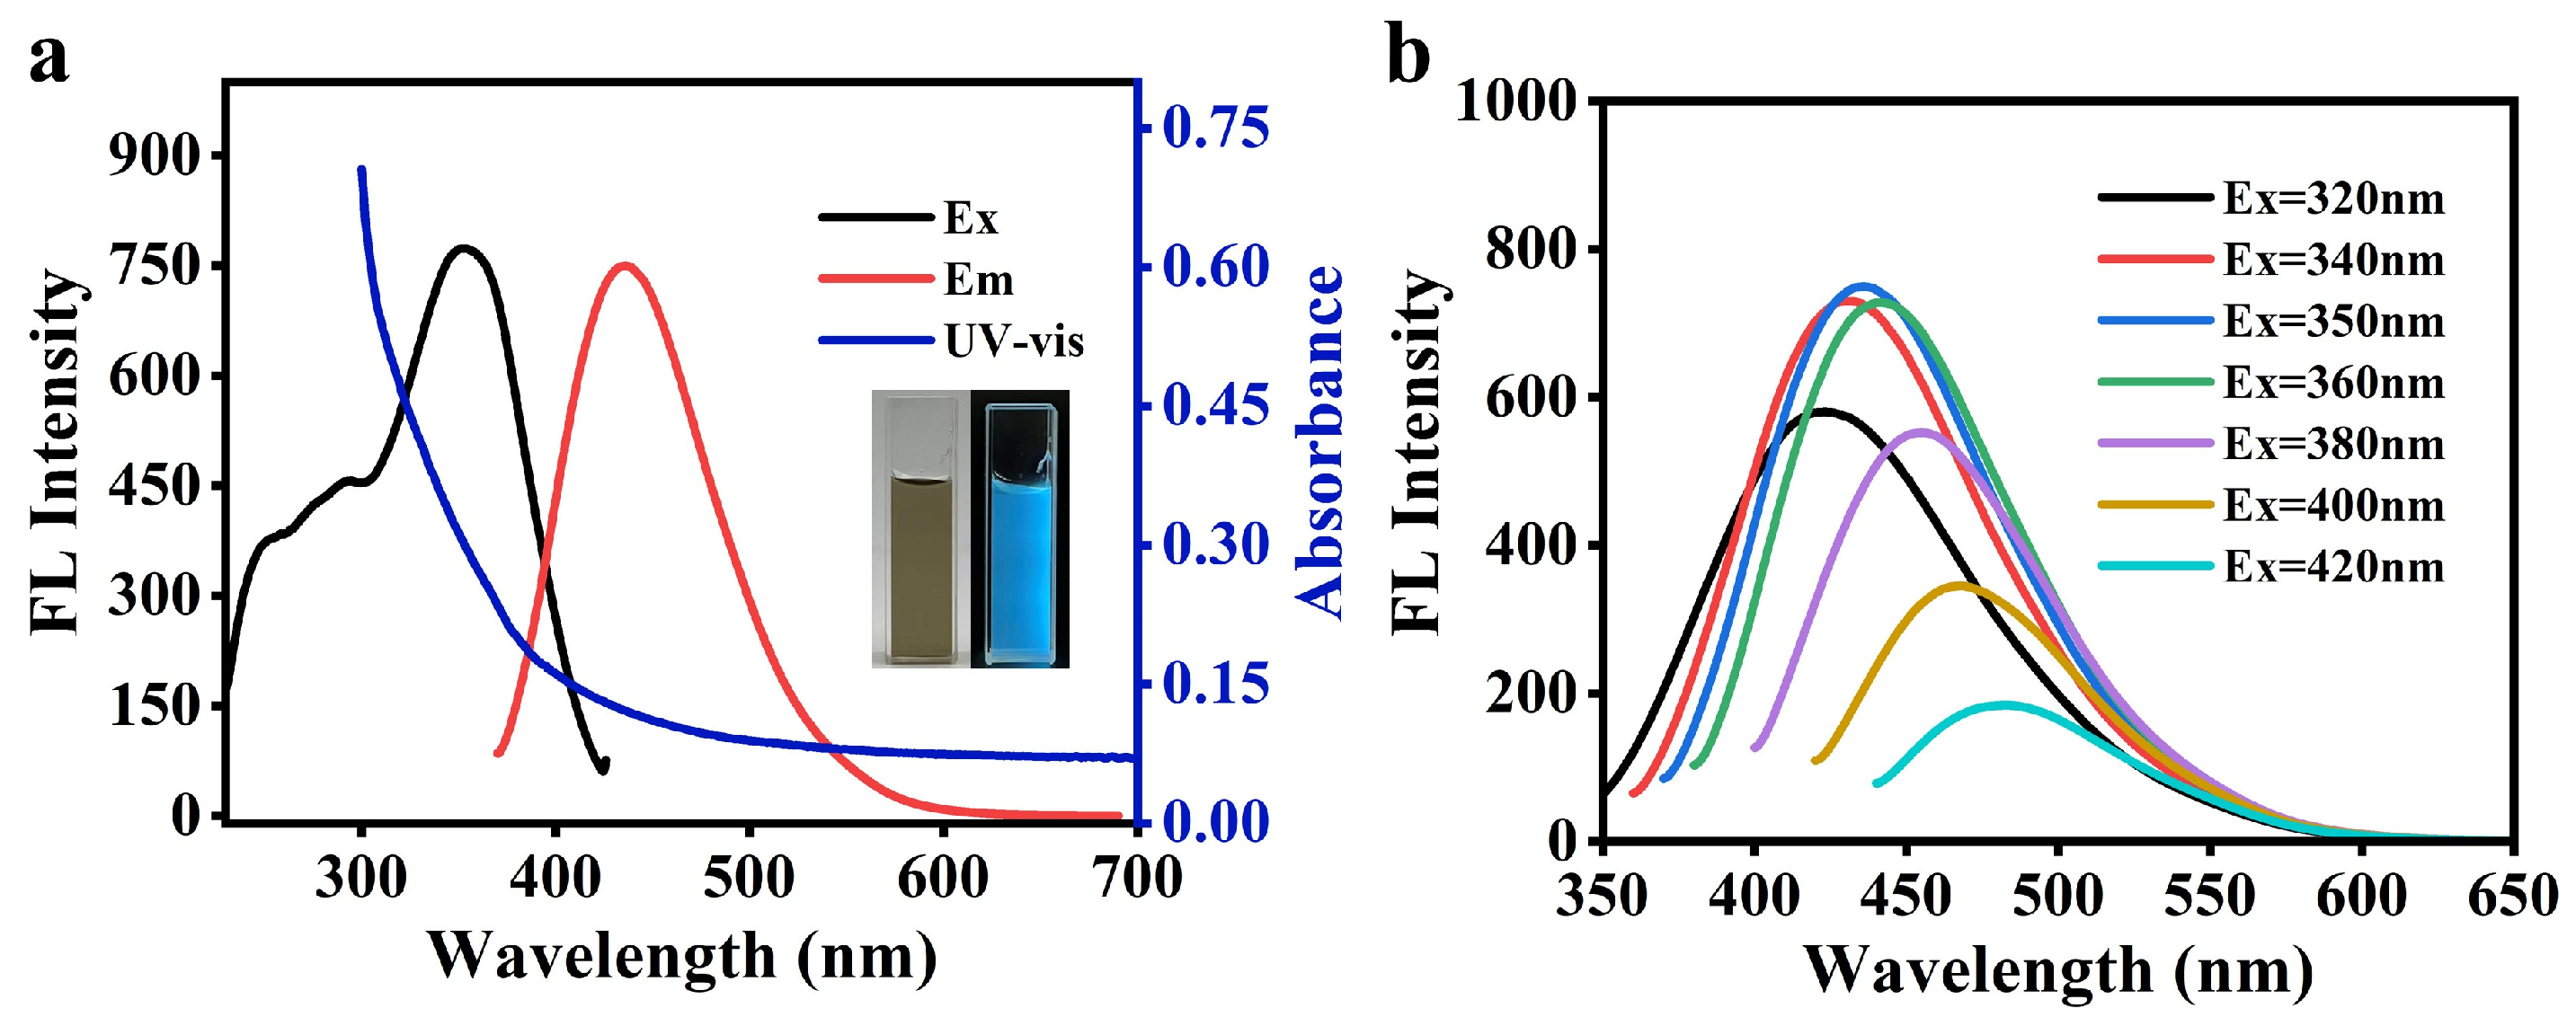
As shown in Figure 4, under white light, the CDs-AuNPs-GSH fluorescent complex changes color to yellowish-gray compared to CDs. However, under 365 nm excitation light, strong blue fluorescence can still be observed. The CDs-AuNPs-GSH fluorescent complex retains obvious absorption characteristics in the ultraviolet region, indicating that the conjugated carbon core structure of CDs has not been disrupted during the complexation process. Meanwhile, the absorption intensity changes in the visible light region, which is speculated to be related to the introduction of AuNPs and their surface plasmon resonance effect. The GSH molecule forms stable Au-S bonds with the surface of AuNPs through the thiol group, enabling CDs, AuNPs, and GSH to form a relatively stable composite structure, thereby regulating the optical response of the system. From the fluorescence spectrum, it can be seen that the CDs-AuNPs-GSH fluorescent complex still exhibits a clear fluorescence emission peak in the blue light region, with the maximum emission wavelength being basically the same as that of the pure CDs system, but the fluorescence intensity has undergone a certain degree of change. Compared to pure CDs, the fluorescence intensity of the CDs-AuNPs-GSH fluorescent complex is overall reduced, indicating that the introduction of AuNPs has caused a fluorescence quenching effect to some extent. This quenching behavior may originate from the non-radiative transfer process of AuNPs’ excited-state energy, such as energy transfer or electron transfer, reflecting the effective interface interaction between CDs and AuNPs. Additionally, the fluorescence emission spectra under different excitation wavelengths show that the CDs-AuNPs-GSH fluorescent complex still exhibits obvious excitation wavelength-dependent emission characteristics. As the excitation wavelength increases from 320 nm to 420 nm, the emission peak gradually shifts to the red and the fluorescence intensity gradually weakens. This behavior is similar to that of the pure CDs system, indicating that the surface state luminescence mechanism of CDs still dominates after the complexation, while the introduction of AuNPs and GSH mainly regulates its luminescence intensity through interface coupling, without changing its basic luminescence nature.

3.2. Fluorescence Sensing of Co2+

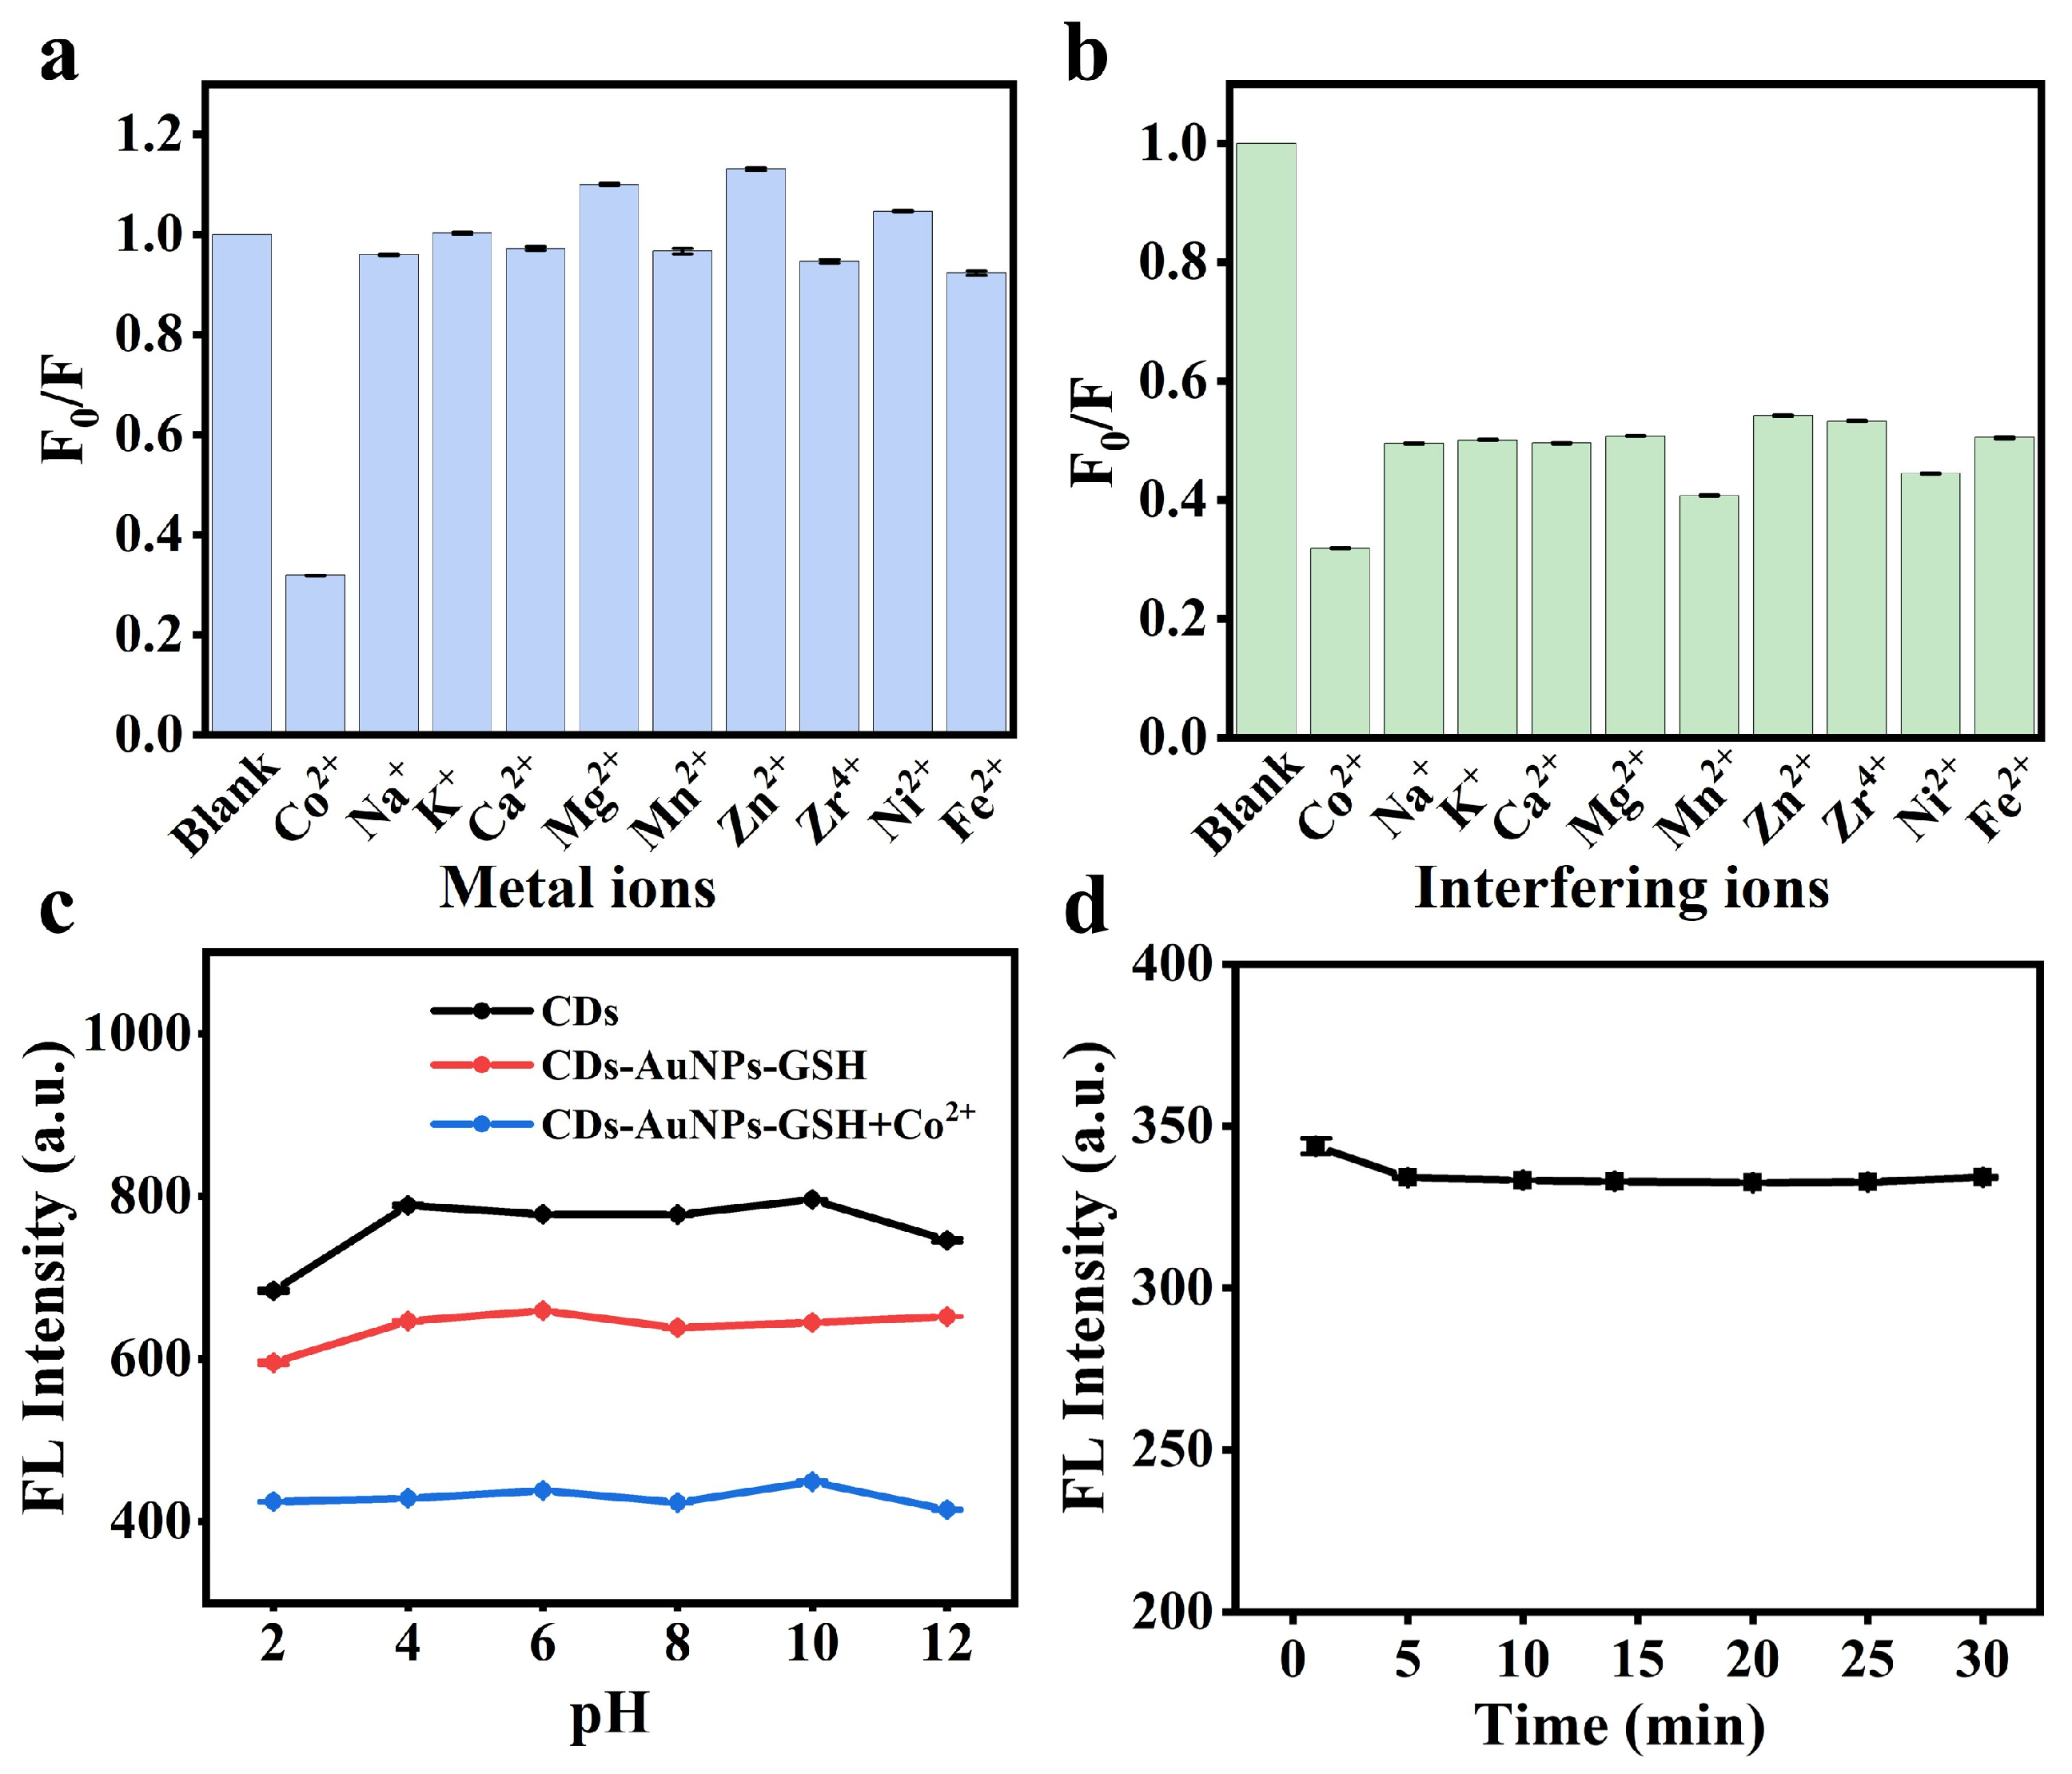
The fluorescence responses of the CDs-AuNPs-GSH fluorescent composite to various other metal ions, including Na+, K+, Ca2+, Mg2+, Mn2+, Zn2+, Zr4+, Ni2+, and Fe2+, were investigated. As shown in Figure 5a, upon the addition of Co2+, the fluorescence intensity of the CDs-AuNPs-GSH composite was significantly quenched, and the quenching amplitude was much larger than that observed for the other tested ions. Common main-group metal ions such as Na+, K+, Ca2+, and Mg2+ caused almost no fluorescence change. Transition metal ions including Mn2+, Zn2+, Ni2+, and Fe2+, induced only extremely weak fluorescence fluctuations. Even Zr4+, though a high-valence cation, did not produce an obvious quenching effect. Collectively, the CDs-AuNPs-GSH fluorescent composite exhibited excellent selective recognition toward Co2+. Considering that real samples may contain various coexisting metal ions, the anti-interference capability of the fluorescent composite was further evaluated. The above metal ions were selected as interferents and individually mixed with Co2+, and the resulting mixtures were then added to the CDs-AuNPs-GSH fluorescent composite. The fluorescence intensities of the mixed systems were measured. As shown in Figure 5b, after mixing different metal ions with Co2+, the fluorescence was still effectively quenched, demonstrating that the fluorescent composite possesses good anti-interference ability for Co2+ detection.
Considering that the surface of CDs is rich in oxygen- and nitrogen-containing functional groups such as hydroxyl, carboxyl, and amino groups, different pH conditions can affect the protonation/deprotonation states of these groups, thereby influencing the fluorescence emission efficiency of the CDs. The fluorescence intensities of the CDs, the CDs-AuNPs-GSH fluorescent composite, and the CDs-AuNPs-GSH composite after the addition of Co2+ were examined over a pH range of 2–12. As shown in Figure 5c, the fluorescence intensity of the CDs alone remained relatively stable in the pH range of 4–10, indicating good pH stability. The CDs-AuNPs-GSH composite and the composite after Co2+ addition also exhibited stable fluorescence intensities within the pH range of 4–10, suggesting that neither the assembly of CDs with AuNPs and GSH nor the recognition interaction between Co2+ and the composite impaired the fluorescence emission of the CDs. Thus, the CDs-AuNPs-GSH fluorescent composite maintained reliable fluorescence responses in the pH range of 4–10. Considering that actual sample pretreatment requires acid digestion, pH = 6 was selected for subsequent experiments. Furthermore, the reaction kinetics between the CDs-AuNPs-GSH fluorescent composite and Co2+ were investigated. As shown in Figure 5d, the fluorescence intensity of the composite decreased slightly within the first 5 min after Co2+ addition and then became stable after 5 min. Therefore, 5 min was chosen as the optimal incubation time for subsequent fluorescence detection experiments.
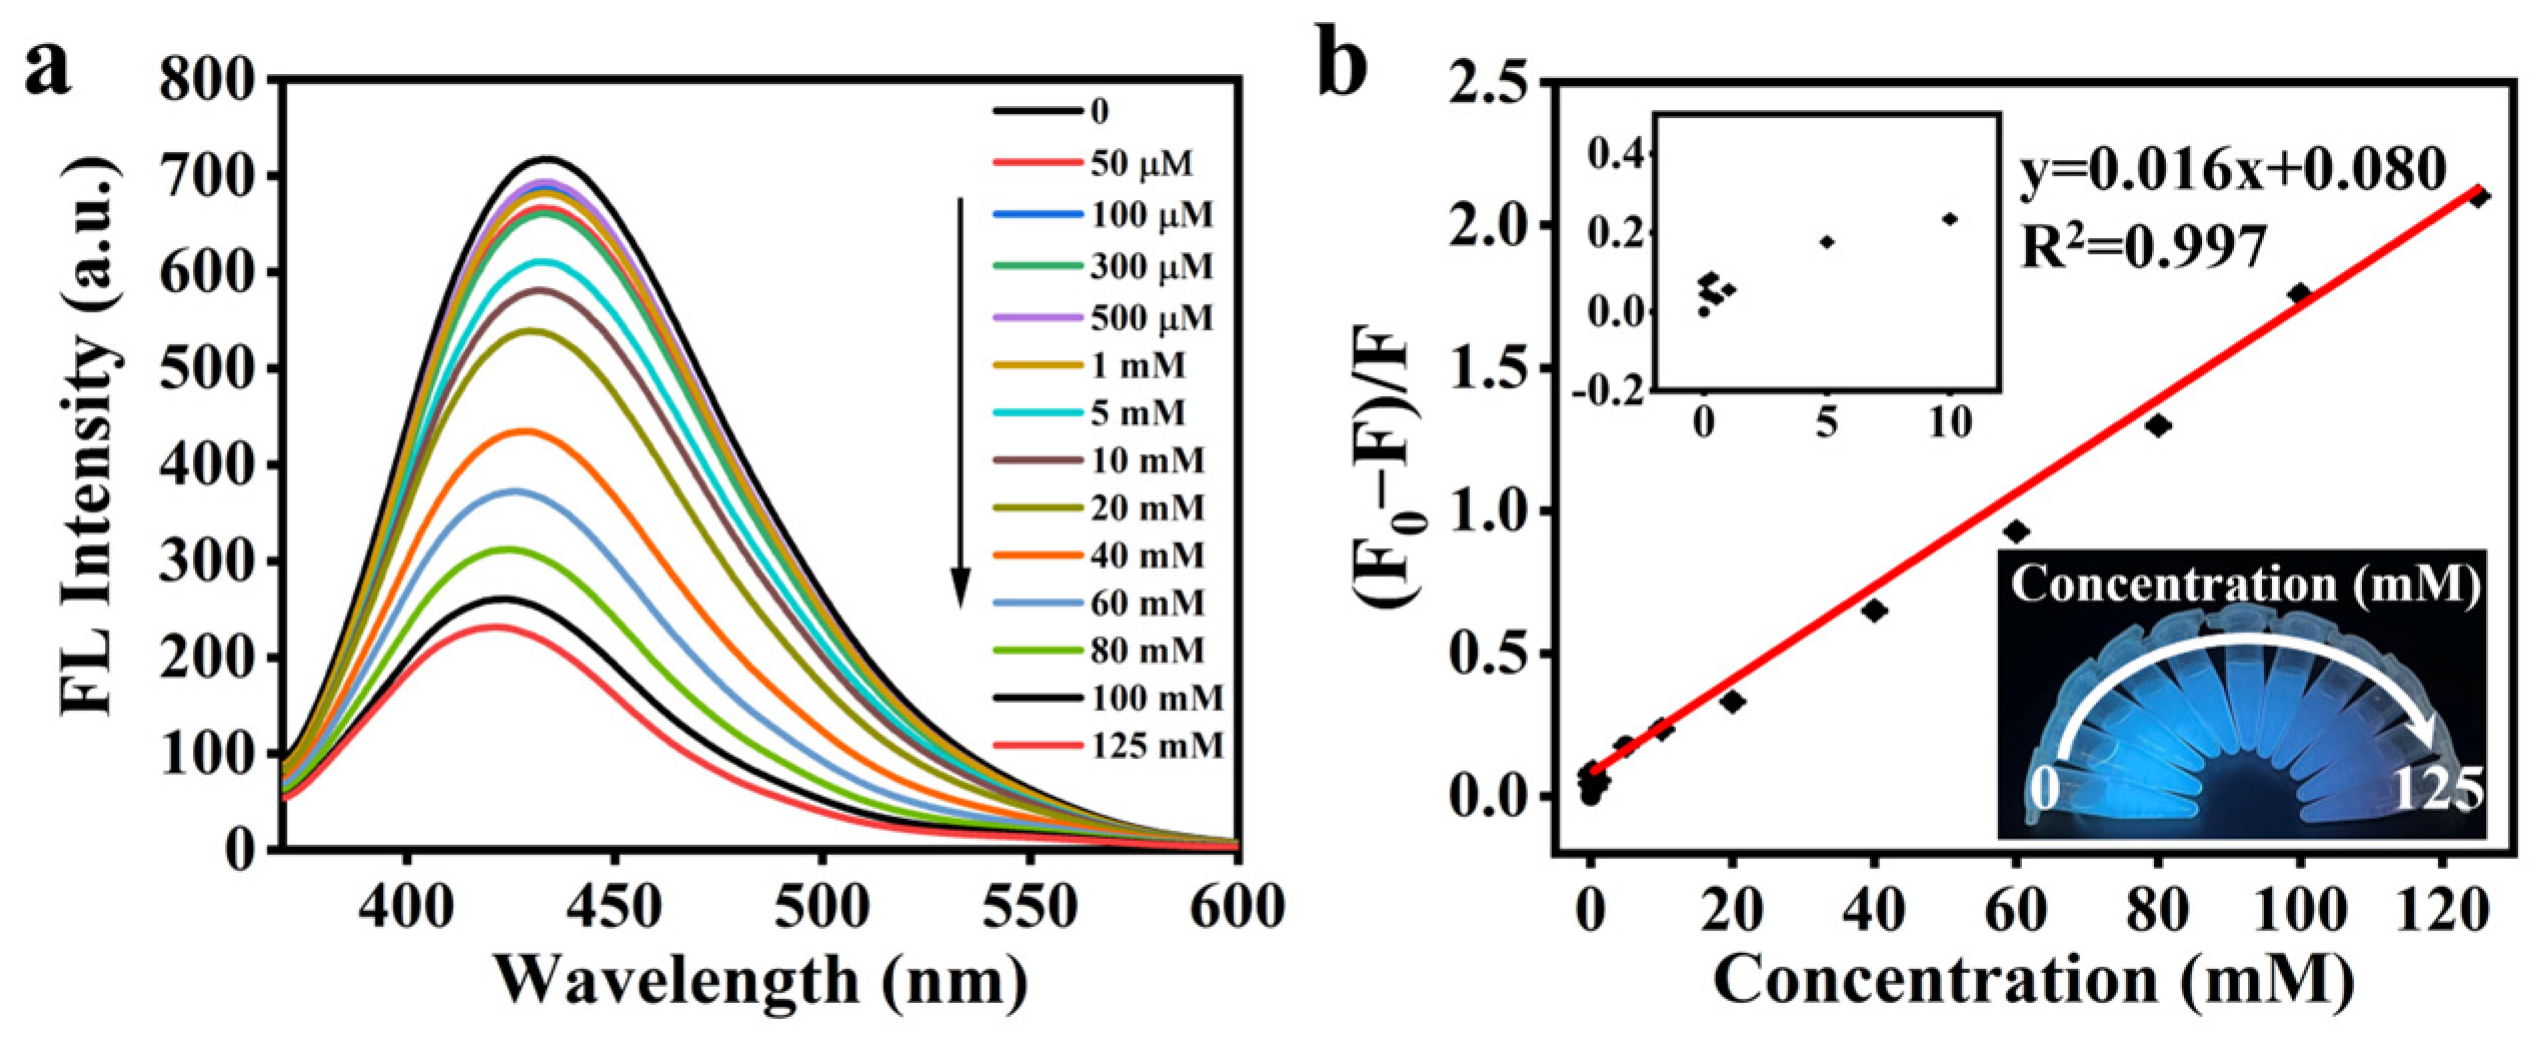
Furthermore, the response of the CDs-AuNPs-GSH fluorescent composite to various concentrations of Co2+ was investigated under the optimal detection conditions to evaluate the quantitative detection capability of this method. Figure 6a shows the fluorescence spectra of the composite upon addition of different concentrations of Co2+ in the range of 0.5–125.0 mM. As the Co2+ concentration gradually increased, the fluorescence intensity of the composite exhibited a continuous decrease, indicating that the coordination-induced dynamic quenching process between Co2+ and the composite is concentration-dependent. To establish a quantitative analysis model, (F0−F)/F was plotted against the Co2+ concentration for linear fitting. As shown in Figure 6b, (F0−F)/F exhibited a good linear relationship with the Co2+ concentration, with a correlation coefficient R2 = 0.997, demonstrating the excellent linear response of this method within the tested concentration range. The corresponding linear equation was (F0−F)/F = 0.016x + 0.080 (where x denotes the concentration of Co2+ in mM), and the LOD was calculated to be 0.38 mM.
It is important to contextualize the analytical performance of our sensor against the reported probes summarized in Table 1. Detection ranges are listed using the original units reported in the corresponding references (μM or mM) to preserve consistency with the literature. While those methods often achieve lower detection limits in the micromolar range, they are typically designed for environmental or biological samples where Co2+ is present at trace levels. In stark contrast, the primary application scenario of our sensor is the on-site quality control of livestock and poultry feed additives (e.g., cobalt chloride premixes), where the Co2+ concentration is intrinsically high. In this context, the wide linear range (0.5–125.0 mM) of our sensor is not a drawback but a deliberate design advantage. Although the LOD (0.38 mM) is higher than that of some other probes, it is fully sufficient for the direct analysis of feed extracts without the need for cumbersome and error-prone serial dilutions, thereby simplifying the operation procedure and reducing potential errors. This focus on practical “fitness-for-purpose” over absolute sensitivity underscores the utility of our sensor as a practical and cost-effective tool for rapid, high-throughput screening in industrial production lines.

3.3. Effect of AuNPs and GSH Modification on Co2+ Sensing Performance

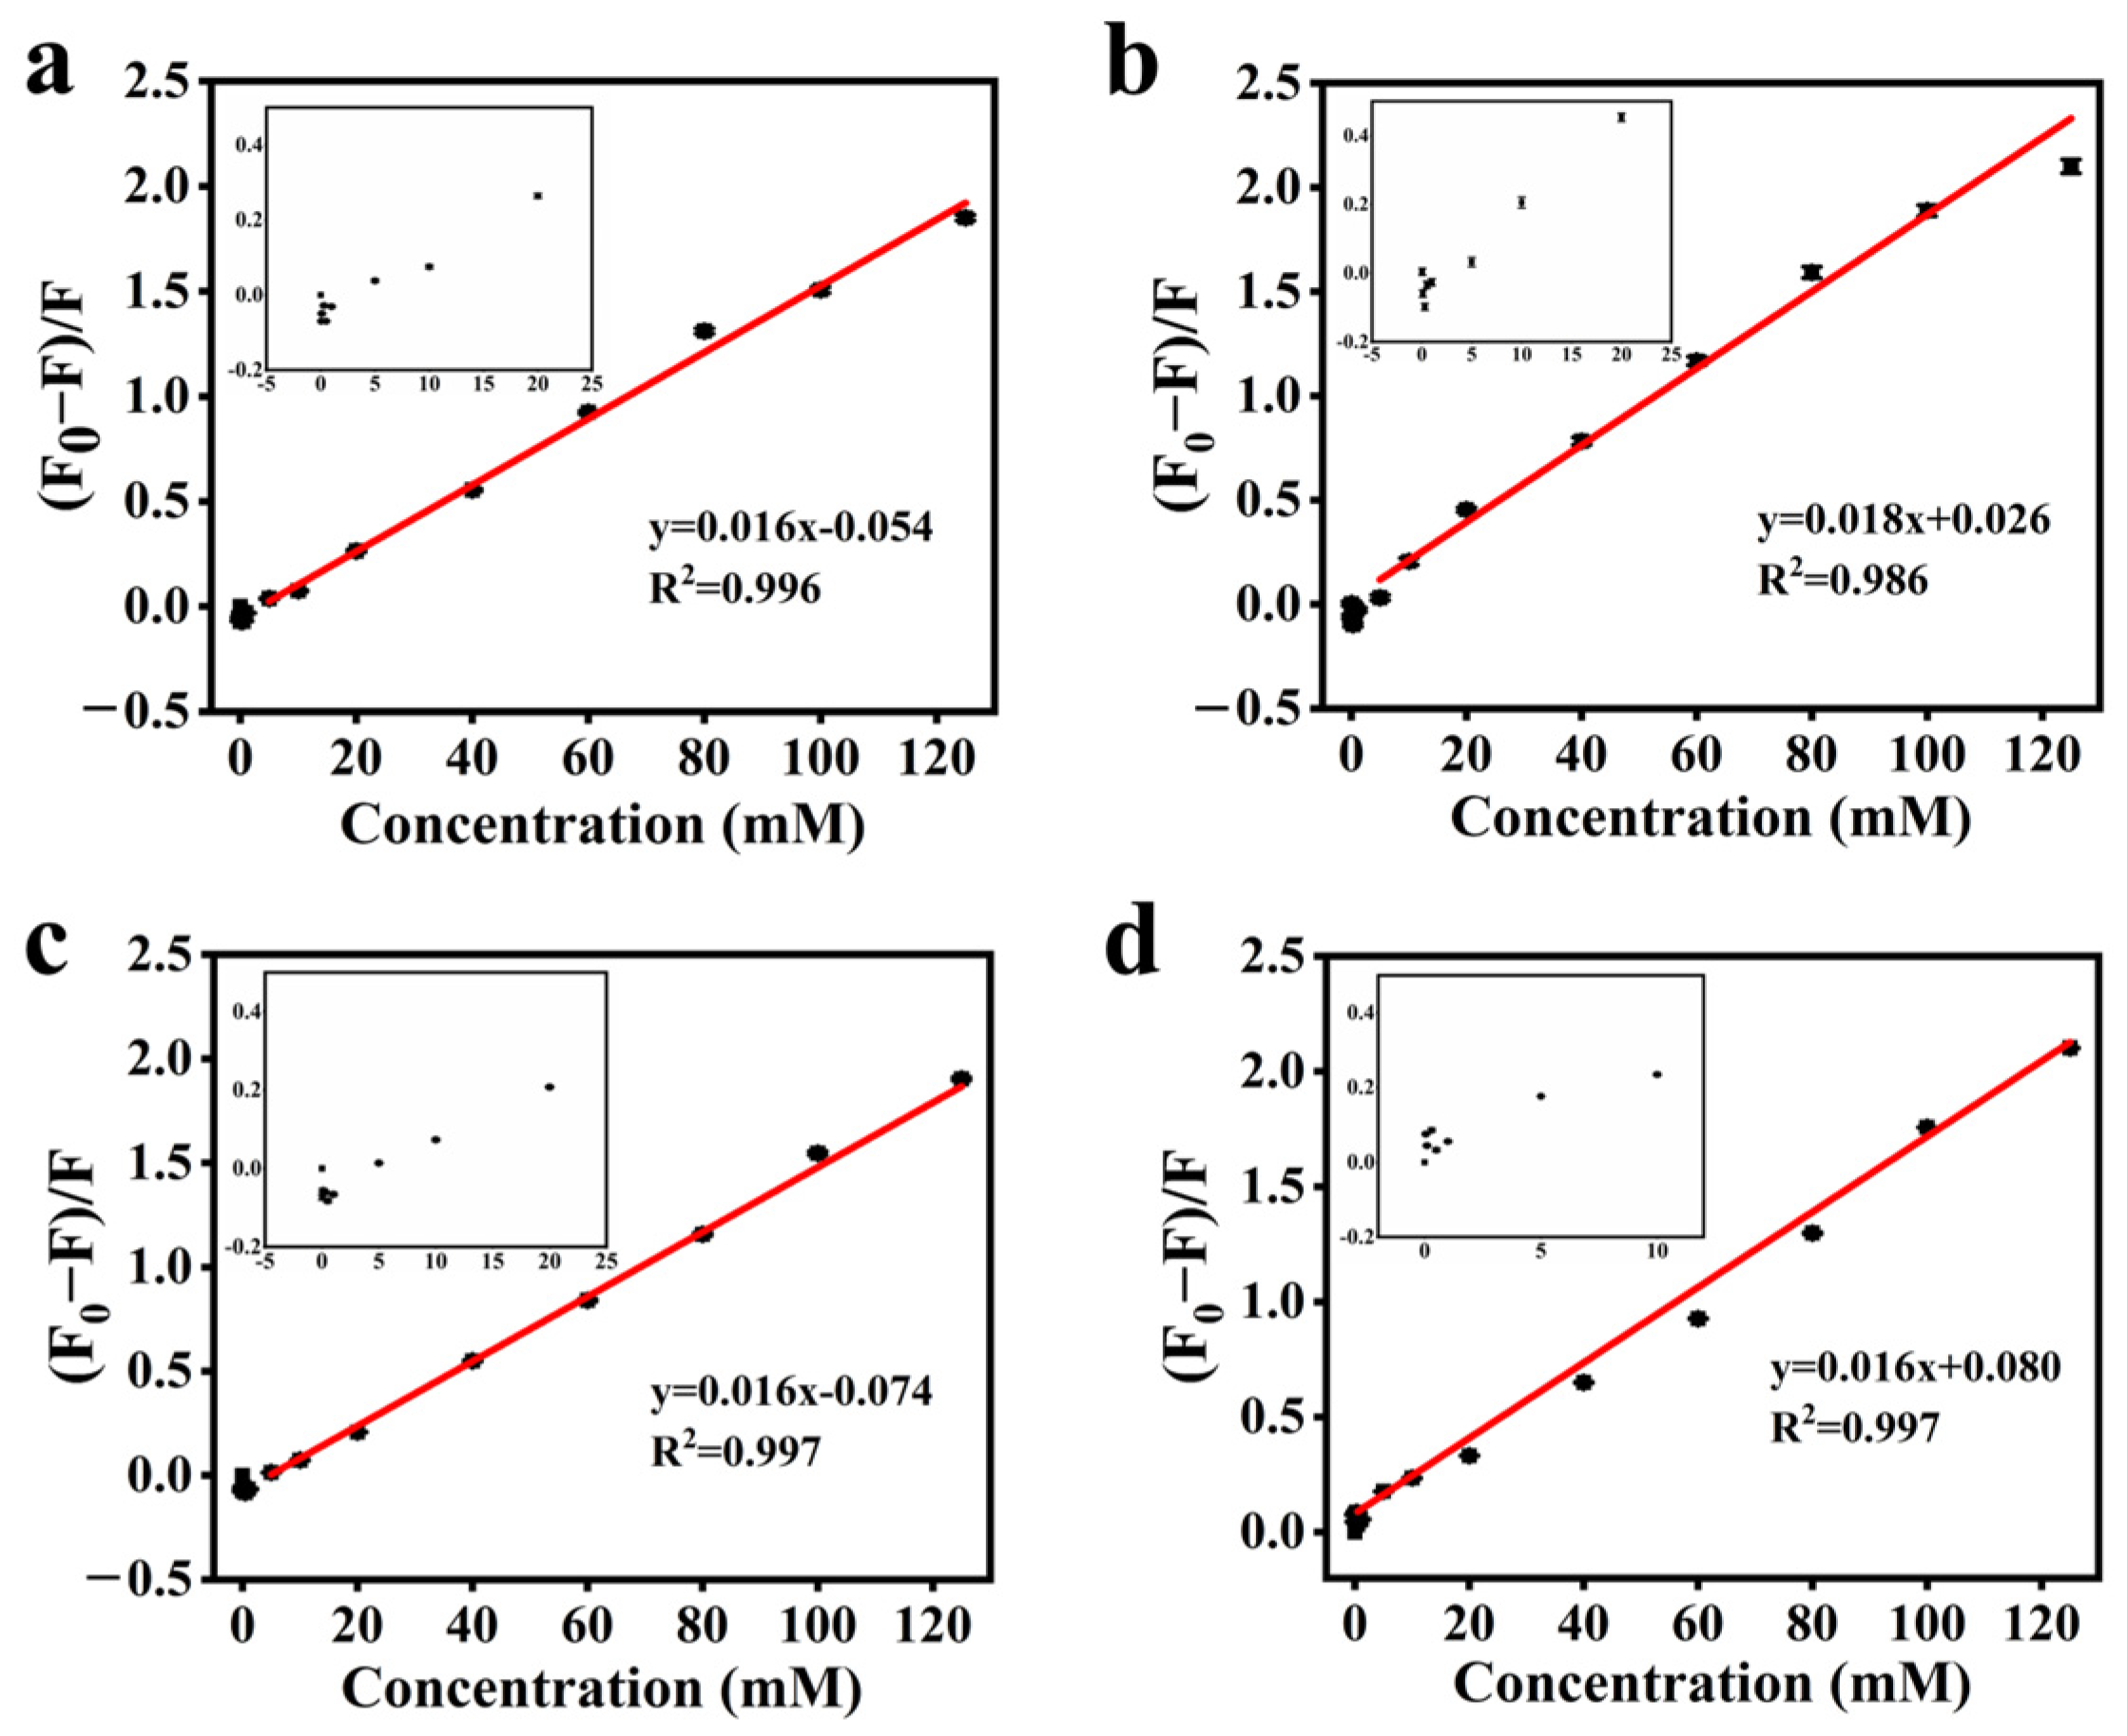
To verify the contribution of each component in the sensing system, the fluorescence responses of CDs, CDs–AuNPs, CDs–GSH, and CDs–AuNPs–GSH toward Co2+ were systematically compared. As shown in Figure 7, the pristine CDs exhibited fluorescence quenching only at relatively high Co2+ concentrations (5–125 mM). Similar sensing behavior was observed for both CDs–AuNPs and CDs–GSH, indicating that introducing either AuNPs or GSH alone did not significantly improve the sensing performance. In contrast, the CDs–AuNPs–GSH composite responded to Co2+ over a much lower concentration range (0.5–125 mM), demonstrating a markedly enhanced sensitivity. This improvement suggests that the synergistic integration of AuNPs and GSH effectively enriches Co2+ around the fluorescent CDs through abundant coordination sites, thereby facilitating more efficient fluorescence quenching.

3.4. Actual Feed Sample

A commercially available mixed livestock and poultry feed additive, cobalt chloride, was pretreated according to the method described in Section 2.4. Using the standard addition method, 0, 20, 40, and 60 mM of Co2+ were spiked into the pretreated samples. Fluorescence intensity measurements were performed at an excitation wavelength of 350 nm, and the obtained data were processed. The results are summarized in Table 2. The recovery rates ranged from 89.4% to 103.9%, with low relative standard deviations (RSD). These results indicate that the proposed method can be successfully applied to the detection of cobalt chloride in spiked feed samples.

3.5. Fluorescence Quenching Mechanism of CDs-AuNPs-GSH and Co2+ Surface Complexation

To clarify the fluorescence quenching mechanism of the CDs–AuNPs–GSH sensing system toward Co2+, possible quenching pathways including inner-filter effects (IFE), static quenching arising from ground-state complex formation and dynamic quenching were systematically investigated using UV–vis absorption, zeta potential, FTIR and fluorescence lifetime analyses.
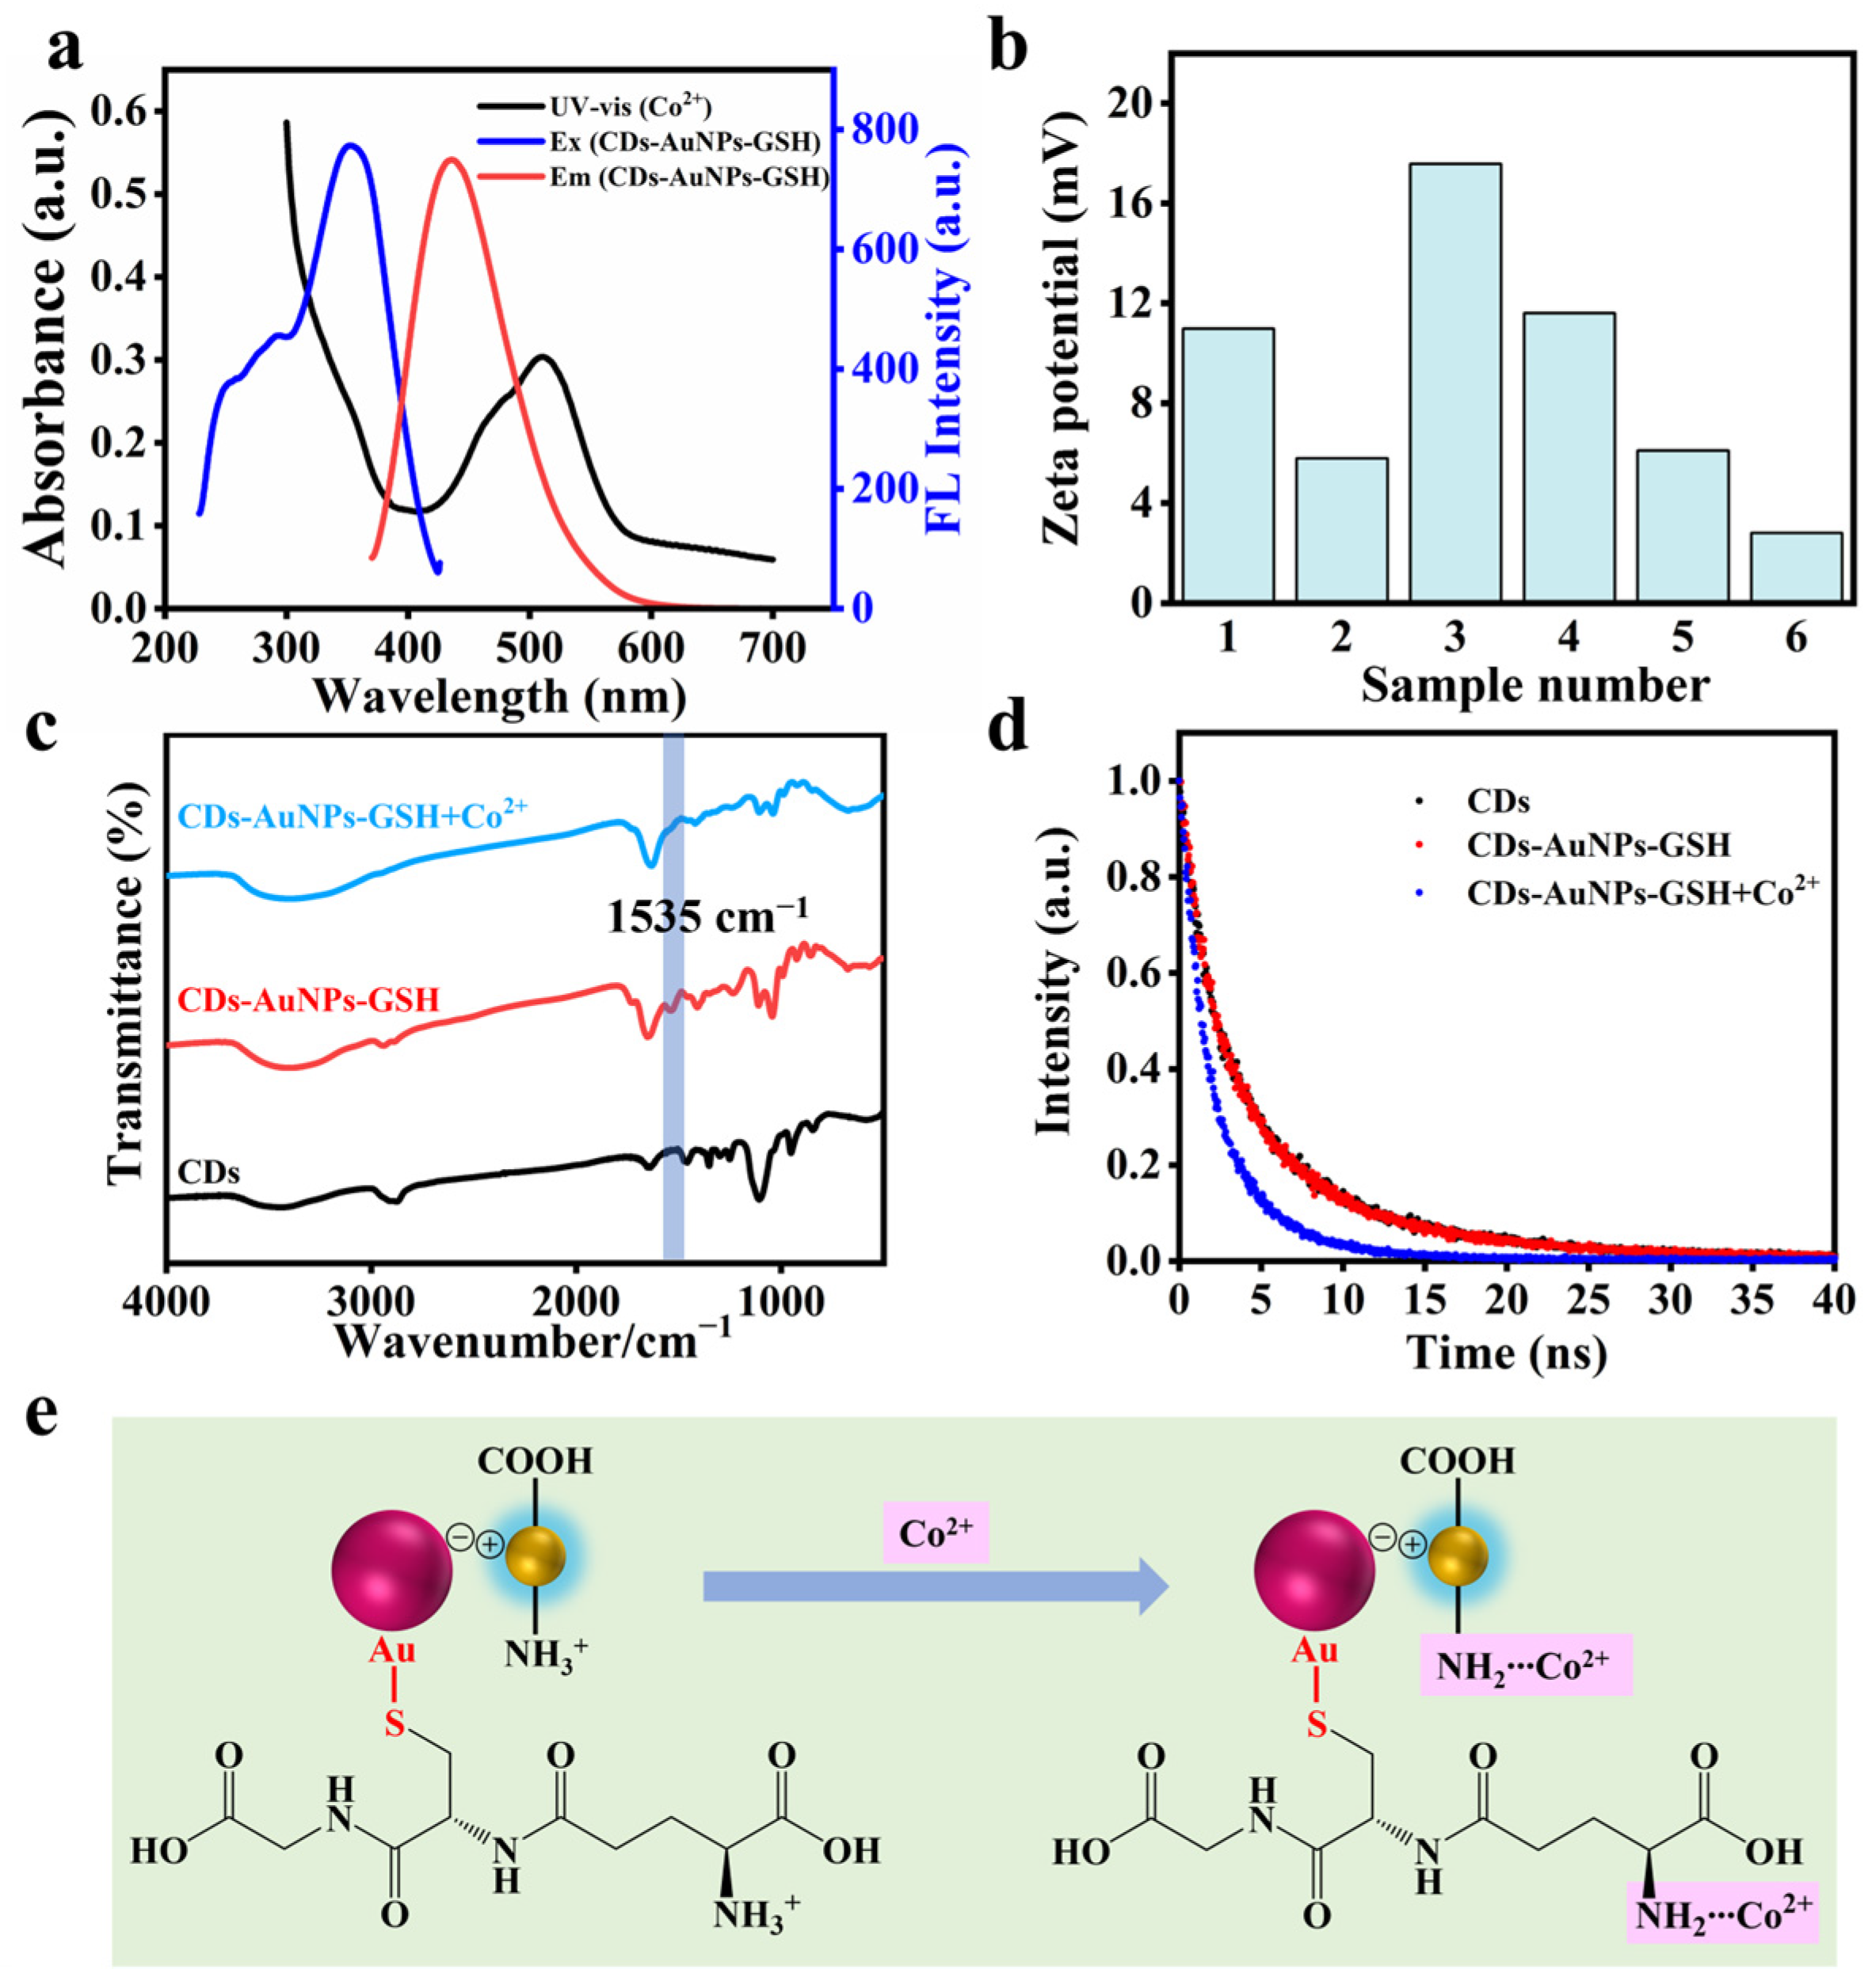
As shown in Figure 8a, the UV–vis absorption spectrum of Co2+ was compared with both the excitation and emission spectra of the CDs–AuNPs–GSH composite. Partial spectral overlap is observed between the absorption of Co2+ and the excitation spectrum in the 300–380 nm region, indicating that a weak primary inner-filter effect may exist. However, little overlap is observed with the emission spectrum centered at approximately 436 nm, suggesting that secondary inner-filter effects are negligible. Therefore, although optical attenuation may contribute slightly to fluorescence reduction, IFE is unlikely to be the dominant origin of the observed quenching.
To determine whether Co2+ directly interacts with the sensing interface, zeta potential and FTIR analyses were performed. As shown in Figure 8b, the zeta potential of the CDs alone was 10.99 mV. At pH = 6, the carboxyl groups on the CD surface lose protons to form negatively charged carboxylate ions (–COO), while the amino groups are protonated (–NH3+), making the CDs positively charged overall. This indicates that the number of amino groups on the CDs’ surface is higher than that of carboxyl groups. The AuNPs are negatively charged due to the abundant carboxyl groups on their surface. Upon the addition of AuNPs, the positively charged CDs and negatively charged AuNPs attract each other, resulting in a zeta potential of 5.79 mV for the mixture. With the subsequent addition of GSH, the thiol groups (–SH) of GSH form Au–S bonds with AuNPs, introducing more protonated amino groups. Consequently, the zeta potential of the CDs-AuNPs-GSH composite further increased to 17.58 mV. The zeta potential of the CDs–AuNPs–GSH composite changed after the addition of Co2+, indicating surface charge redistribution caused by coordination interactions. To further verify the formation of coordination bonds, the FTIR spectra of the CDs, the CDs-AuNPs-GSH composite, and the CDs-AuNPs-GSH-Co2+ system were compared. As shown in Figure 8c, the overall peak shape of the CDs-AuNPs-GSH composite is similar to that of the CDs, indicating that the CDs’ structure was not disrupted. The narrowing of the peak at ~3400 cm−1 may be attributed to changes in the hydrogen bonding environment of the surface groups due to the introduction of GSH and AuNPs. No obvious absorption peak is observed at ~2550 cm−1, indicating the absence of free –SH groups from GSH, confirming the formation of Au–S bonds between –SH and AuNPs. The peaks between 1650 and 1550 cm−1 show slight shifts, reflecting the interaction of the amide groups of GSH with the CDs. In the FTIR spectrum of the CDs-AuNPs-GSH-Co2+ system, the peak at ~3400 cm−1 changes further, likely due to the coordination of Co2+ with –OH/–NH groups, which alters the hydrogen bonding network. The amide peaks at ~1650 and ~1550 cm−1 exhibit shifts or intensity changes, indicating that Co2+ may coordinate with the carboxyl or amino groups of GSH. Additionally, a new peak appears in the region of 500–600 cm−1, which may be assigned to the vibrational peaks of Co–O or Co–N coordination bonds. These results demonstrate the existence of coordination interactions but do not by themselves distinguish between static and dynamic quenching.
Fluorescence lifetime measurements provide the key evidence for distinguishing the quenching pathway. Figure 8d shows the fluorescence lifetime decay curves of the CDs, CDs-AuNPs-GSH composite, and CDs-AuNPs-GSH composite with Co2+. Fitting with a single-exponential function yielded fluorescence lifetimes of 7.76 ns for CDs, 7.18 ns for CDs-AuNPs-GSH composite, and 2.65 ns for CDs-AuNPs-GSH-Co2+ mixture. In a purely static quenching process, fluorophores that remain emissive retain essentially unchanged excited-state lifetimes because quenching occurs through the formation of non-emissive ground-state complexes. In contrast, the significant lifetime shortening observed here indicates accelerated excited-state deactivation. The introduction of AuNPs and GSH already slightly altered the electronic transition and exciton relaxation behavior on the CDs’ surface. Upon Co2+ addition, a strong interaction between Co2+ and CDs-AuNPs-GSH composite occurred, increasing the non-radiative transition pathways of the excited electrons in CDs, thereby promoting rapid energy dissipation of the excited excitons and suppressing radiative fluorescence emission. Therefore, the fluorescence quenching is dominated by a dynamic quenching process.
Upon excitation at the excitation wavelength, the CDs–AuNPs–GSH fluorescent composite absorbs photon energy and is promoted from the ground state to the excited state, producing the excited species (CDs–AuNPs–GSH*), as described in Equation (1). In the absence of Co2+, the excited fluorophore returns to the ground state through a radiative transition, accompanied by fluorescence emission, as expressed in Equation (2). After the introduction of Co2+, coordination interactions occur between Co2+ and the amino/carboxyl functional groups on the surface of the CDs–AuNPs–GSH composite, leading to the enrichment of Co2+ at the fluorophore interface (Figure 8e). These coordination interactions facilitate excited-state non-radiative relaxation and accelerate energy dissipation in the form of heat, thereby effectively suppressing fluorescence emission, as illustrated in Equation (3). Collectively, these results indicate that coordination between Co2+ and the surface functional groups of the CDs–AuNPs–GSH composite provides the structural basis for fluorescence quenching by enriching Co2+ at the fluorophore interface. The significant decrease in fluorescence lifetime demonstrates that this coordination mainly promotes excited-state non-radiative relaxation rather than the formation of stable non-emissive ground-state complexes. Therefore, the fluorescence response toward Co2+ is dominated by a coordination-assisted dynamic quenching mechanism, while the contribution of the inner-filter effect is considered to be minor under the present experimental conditions.
CDs − AuNPs − GSH + hνEx → CDs − AuNPs − GSH*
CDs − AuNPs − GSH* → CDs − AuNPs − GSH + FL
CDs − AuNPs − GSH* + Co2+ → CDs − AuNPs − GSH+Co2+ + heat

4. Conclusions

In this study, CDs with abundant amino groups on their surface were rapidly synthesized via a microwave method. A fluorescent composite, CDs-AuNPs-GSH, was subsequently constructed by introducing AuNPs and GSH. The fluorescence detection performance of the CDs-AuNPs-GSH composite for Co2+ was systematically investigated. The results showed that the fluorescence intensity of the CDs-AuNPs-GSH composite decreased significantly in the presence of Co2+, exhibiting excellent response characteristics. Under the optimal conditions (pH = 6), the LOD for Co2+ was determined to be 0.38 mM. To elucidate the fluorescence quenching mechanism, fluorescence lifetime, UV–vis absorption, zeta potential, and FTIR analyses were comprehensively performed. The results demonstrate that Co2+ coordinates with the amino- and carboxyl-containing functional groups on the surface of the CDs–AuNPs–GSH composite, providing the structural basis for the quenching process. Fluorescence lifetime measurements further revealed a significant shortening of the excited-state lifetime after the addition of Co2+, indicating that the fluorescence quenching is dominated by a coordination-assisted dynamic quenching mechanism. Meanwhile, comparison of the UV–vis absorption spectrum of Co2+ with the excitation and emission spectra of the fluorescent probe suggests that the inner-filter effect contributes only marginally to the observed fluorescence attenuation under the present experimental conditions. Overall, this work provides a simple and effective fluorescent sensing platform for Co2+ detection and offers a more comprehensive understanding of the quenching mechanism, which may facilitate the rational design of carbon-dot-based fluorescent probes for metal ion sensing.

Author Contributions

Conceptualization, J.H., H.L. and X.L.; methodology, J.H., M.Y. and X.L.; validation, J.H. and M.Y.; investigation, J.H., H.L. and X.L.; resources, H.L. and X.L.; data curation, J.H., M.Y. and X.L.; writing—original draft preparation, J.H. and H.L.; writing—review and editing, J.H., M.Y. and X.L.; supervision, H.L. and X.L.; project administration, J.H., H.L. and X.L.; funding acquisition, X.L. All authors have read and agreed to the published version of the manuscript.

Funding

This project was funded by the Fujian Provincial Department of Science and Technology (2025Y4014) and the Xiamen Municipal Bureau of Science and Technology (2024CXY0202).

Institutional Review Board Statement

Not applicable.

Informed Consent Statement

Not applicable.

Data Availability Statement

The original contributions presented in this study are included in the article. Further inquiries can be directed to the corresponding authors.

Conflicts of Interest

The authors declare no conflicts of interest.

Abbreviations

The following abbreviations are used in this manuscript:
CDsCarbon dots
AuNPsGold nanoparticles
GSHGlutathione
PEGPoly(ethylene glycol)
LODLimit of detection

References

  1. Lee, S.; Manthiram, A. Can cobalt be eliminated from lithium-ion batteries? ACS Energy Lett. 2022, 7, 3058–3063. [Google Scholar] [CrossRef] [Scilit]
  2. Iravani, S.; Varma, R.S. Sustainable synthesis of cobalt and cobalt oxide nanoparticles and their catalytic and biomedical applications. Green Chem. 2020, 22, 2643–2661. [Google Scholar] [CrossRef] [Scilit]
  3. Raths, R.; Rodriguez, B.; Holloway, J.W.; Waite, A.; Lawrence, T.; Van de Ligt, J.L.; Purvis, H.; Doering-Resch, H.; Casper, D.P. Comparison of growth performance and tissue cobalt concentrations in beef cattle fed inorganic and organic cobalt sources. Transl. Anim. Sci. 2023, 7, txad120. [Google Scholar] [CrossRef] [Scilit] [PubMed]
  4. Gharehbaghi, M.; Shemirani, F.; Baghdadi, M. Dispersive liquid–liquid microextraction and spectrophotometric determination of cobalt in water samples. Int. J. Environ. Anal. Chem. 2008, 88, 513–523. [Google Scholar] [CrossRef] [Scilit]
  5. Rezaei, V. Optimization of a doped sol–gel glass with a nanoporous structure as a chemical sensor for the determination of cobalt (ii): Analysis of food, pharmaceutical and biological samples. New J. Chem. 2020, 44, 14358–14366. [Google Scholar] [CrossRef] [Scilit]
  6. Genchi, G.; Lauria, G.; Catalano, A.; Carocci, A.; Sinicropi, M.S. Prevalence of cobalt in the environment and its role in biological processes. Biology 2023, 12, 1335. [Google Scholar] [CrossRef] [Scilit] [PubMed]
  7. Knoop, A.; Planitz, P.; Wüst, B.; Thevis, M. Analysis of cobalt for human sports drug testing purposes using ICP-and LC-ICP-MS. Drug Test. Anal. 2020, 12, 1666–1672. [Google Scholar] [CrossRef] [Scilit] [PubMed]
  8. Selvolini, G.; Marrazza, G. On spot detection of nickel and cobalt from exhausted batteries by a smart electrochemical sensor. Talanta 2023, 253, 123918. [Google Scholar] [CrossRef] [Scilit] [PubMed]
  9. García, R.; Báez, A. Atomic absorption spectrometry (AAS). At. Absorpt. Spectrosc. 2012, 1, 1–13. [Google Scholar]
  10. Li, L.; Wang, J.; Xu, S.; Li, C.; Dong, B. Recent progress in fluorescent probes for metal ion detection. Front. Chem. 2022, 10, 875241. [Google Scholar] [CrossRef] [Scilit] [PubMed]
  11. Shahbaz, M.; Dar, B.; Sharif, S.; Khurshid, M.A.; Hussain, S.; Riaz, B.; Musaffa, M.; Khalid, H.; Ch, A.R.; Mahboob, A. Recent advances in the fluorimetric and colorimetric detection of cobalt ions. RSC Adv. 2024, 14, 9819–9847. [Google Scholar] [CrossRef] [Scilit] [PubMed]
  12. Liu, H.; Zhong, X.; Pan, Q.; Zhang, Y.; Deng, W.; Zou, G.; Hou, H.; Ji, X. A review of carbon dots in synthesis strategy. Coord. Chem. Rev. 2024, 498, 215468. [Google Scholar] [CrossRef] [Scilit]
  13. Khayal, A.; Dawane, V.; Amin, M.A.; Tirth, V.; Yadav, V.K.; Algahtani, A.; Khan, S.H.; Islam, S.; Yadav, K.K.; Jeon, B.-H. Advances in the methods for the synthesis of carbon dots and their emerging applications. Polymers 2021, 13, 3190. [Google Scholar] [CrossRef] [Scilit] [PubMed]
  14. Batool, M.; Junaid, H.M.; Tabassum, S.; Kanwal, F.; Abid, K.; Fatima, Z.; Shah, A.T. Metal ion detection by carbon dots—A review. Crit. Rev. Anal. Chem. 2022, 52, 756–767. [Google Scholar] [PubMed]
  15. Liu, Z.; Gong, Y.; Fan, Z. Cysteine detection using a high-fluorescence sensor based on a nitrogen-doped graphene quantum dot–mercury (II) system. J. Lumin. 2016, 175, 129–134. [Google Scholar] [CrossRef] [Scilit]
  16. Chen, L.; Ding, Y.; Zhang, G.; Liu, N.; Zhang, H. Multi-functional sensing system integrated with smartphone and LDA based on an AIE dye for dual-mode detection and discrimination of Fe2+, Fe3+, Co2+ and Mn2+. Anal. Chim. Acta 2025, 1386, 345048. [Google Scholar] [PubMed]
  17. Yu, C.; Yang, M.; Zhang, H.; Li, X.; Zhang, J. A multifunctional Cu2+, Fe3+ and Co2+ selective fluorescent probe and its application in cell/marine medaka (Oryzias melastigma) imaging. J. Mol. Struct. 2026, 1358, 145430. [Google Scholar] [CrossRef] [Scilit]
  18. Kar, D.K.; V, P.; Si, S.; Panigrahi, H.; Mishra, S. Carbon dots and their polymeric nanocomposites: Insight into their synthesis, photoluminescence mechanisms, and recent trends in sensing applications. ACS Omega 2024, 9, 11050–11080. [Google Scholar] [CrossRef] [Scilit] [PubMed]
  19. Abraham, J.E.; Balachandran, M. Fluorescent mechanism in zero-dimensional carbon nanomaterials: A review. J. Fluoresc. 2022, 32, 887–906. [Google Scholar] [CrossRef] [Scilit] [PubMed]
  20. Sarfraz, N.; Khan, I. Plasmonic gold nanoparticles (AuNPs): Properties, synthesis and their advanced energy, environmental and biomedical applications. Chem.–Asian J. 2021, 16, 720–742. [Google Scholar] [CrossRef] [Scilit] [PubMed]
  21. GB/T 13884-2018; Determination of Cobalt in Feeds—Atomic Absorption Spectrometry. Standards Press of China: Beijing, China, 2018.
  22. Singh, V.P.; Singh, A.K. Temperature-Triggered Structural Boundary between Nitrogen-Doped Carbon Dots and Graphene Quantum Dots. Nano Lett. 2026, 26, 4204–4211. [Google Scholar] [CrossRef] [Scilit] [PubMed]
  23. Ge, G.; Li, L.; Wang, D.; Chen, M.; Zeng, Z.; Xiong, W.; Wu, X.; Guo, C. Carbon dots: Synthesis, properties and biomedical applications. J. Mater. Chem. B 2021, 9, 6553–6575. [Google Scholar] [CrossRef] [Scilit] [PubMed]
  24. Ju, B.; Nie, H.; Liu, Z.; Xu, H.; Li, M.; Wu, C.; Wang, H.; Zhang, S.X.-A. Full-colour carbon dots: Integration of multiple emission centres into single particles. Nanoscale 2017, 9, 13326–13333. [Google Scholar] [CrossRef] [Scilit] [PubMed]
  25. Nguyen, V.; Si, J.; Yan, L.; Hou, X. Direct demonstration of photoluminescence originated from surface functional groups in carbon nanodots. Carbon 2016, 108, 268–273. [Google Scholar] [CrossRef] [Scilit]
  26. Zuber, A.; Purdey, M.; Schartner, E.; Forbes, C.; Van der Hoek, B.; Giles, D.; Abell, A.; Monro, T.; Ebendorff-Heidepriem, H. Detection of gold nanoparticles with different sizes using absorption and fluorescence based method. Sens. Actuators B Chem. 2016, 227, 117–127. [Google Scholar] [CrossRef] [Scilit]
  27. Oliveira, C.; Lima, F.E.H.; Lopes, G.; Matos, W.O.; Antunes, R.A.; Neto, M.; Moura, T.; Pascoal, A.; César, C.; Carvalho, H. Multifunctional sensing of cobalt ions and methylcobalamin using doped carbon quantum dots. Microchem. J. 2025, 217, 114930. [Google Scholar] [CrossRef] [Scilit]
  28. Qiao, Y.; Guo, L.; He, Y.; Li, Z.; Meng, Q.; Yao, J.; Zhao, Y.; Yan, H. Dual-excitation and single-emission B, N-codoped carbon dots: Synthesis, fluorescent properties and multi-ion detection. J. Photochem. Photobiol. A Chem. 2025, 462, 116180. [Google Scholar] [CrossRef] [Scilit]
  29. Vasu, S.; Sharma, A.; Johnson, V.; Sukumar Uday, K. Turn-Off Fluorometric Detection of Co2+ by Polyethylenimine-Passivated Carbon Nanoprobes: Mechanistic Insights through ITC. ACS Appl. Bio Mater. 2025, 8, 8072–8083. [Google Scholar] [CrossRef] [Scilit] [PubMed]
  30. Sullam, E.M.; Adam, K.M.; Liu, J.; Chen, H.; Xiao, J. Silicon quantum dots-based fluorescent sensor for the detection of cobalt with high sensitivity and selectivity. Chin. Chem. Lett. 2024, 35, 108476. [Google Scholar] [CrossRef] [Scilit]
  31. Reji, R.; Biju, V. Rapid and scalable synthesis of sulfur quantum dots through ozone etching: Photoluminescence and FRET-mediated Co2+ sensing. New J. Chem. 2023, 47, 9113–9123. [Google Scholar] [CrossRef] [Scilit]
Figure 1. Schematic diagram of the synthesis of CDs and the construction of Co2+ fluorescence sensor.
Chemosensors 14 00168 g001
Figure 2. Characterization of CDs: (a) HRTEM image of CDs; (b) Size distribution of CDs and the physical images of CDs aqueous solutions under white light and 365 nm excitation light; (c) XRD spectra of CDs; (d) FTIR spectra of CDs; (e) UV-vis absorption spectra and Fluorescence spectra of CDs; (f) Fluorescence spectra of CDs at different excitation wavelengths.
Chemosensors 14 00168 g002
Figure 3. Characterization of AuNPs: (a) TEM image of AuNPs; (b) Size distribution of AuNPs; (c) UV-vis absorption spectra of AuNPs.
Chemosensors 14 00168 g003
Figure 4. Characterization of CDs-AuNPs-GSH: (a) UV-vis and FL spectra of CDs-AuNPs-GSH and its physical images under white light and 365 nm excitation light; (b) Fluorescence spectra of CDs-AuNPs-GSH at different excitation wavelengths.
Chemosensors 14 00168 g004
Figure 5. Fluorescence sensing of Co2+: (a) The selectivity of the CDs-AuNPs-GSH for detecting Co2+; (b) The anti-interference property of the CDs-AuNPs-GSH for detecting Co2+; (c) The FL Intensity of CDs and CDs-AuNPs-GSH with or without Co2+ in different pH environments; (d) The FL Intensity of CDs-AuNPs-GSH with reaction time after adding Co2+ (Data are presented as mean ± SD (n = 3, error bars represent SD).
Chemosensors 14 00168 g005
Figure 6. The sensitivity of fluorescence sensing: (a) Fluorescence spectra of the system at different Co2+ concentrations; (b) Linear fitting and the fluorescence quenching effect of CDs-AuNPs-GSH at 0 to 125 mM Co2+ (Data are presented as mean ± SD (n = 3, error bars represent SD).
Chemosensors 14 00168 g006
Figure 7. Linear fitting and the fluorescence quenching effect of (a) CDs; (b) CDs-AuNPs; (c) CDs-GSH; (d) CDs-AuNPs-GSH at 0 to 125 mM Co2+ (Data are presented as mean ± SD (n = 3, error bars represent SD).
Chemosensors 14 00168 g007
Figure 8. The research of fluorescence quenching mechanism: (a) UV-vis of Co2+and FL spectra of CDs-AuNPs-GSH; (b) Zeta potential (1: CDs; 2: CDs-AuNPs; 3: CDs-AuNPs-GSH; 4: CDs-AuNPs-GSH + low concentration Co2+; 5: CDs-AuNPs-GSH + medium concentration Co2+; 6: CDs-AuNPs-GSH + high concentration Co2+); (c) FTIR spectra of CDs and CDs-AuNPs-GSH before and after Co2+ addition; (d) Fluorescence lifetime of CDs-AuNPs-GSH before and after Co2+ addition; (e) Schematic diagram of the fluorescence quenching mechanism of Co2+ by the CD-AuNPs-GSH.
Chemosensors 14 00168 g008
Table 1. Comparison of the detection of Co2+.
MaterialMethodDetection RageLOD
N,S-CD [27]Fluorescence enhancement1.5~5.0 mM0.86 mM
B,N-CD [28]Fluorescence quenching10~100 μM5.49 μM
PEI-MCDs [29]Fluorescence quenching20~180 μM1.10 μM
Si QDs [30]Fluorescence quenching1~120 μM0.37 μM
Oz-SQDs [31]Fluorescence resonance energy transfer (FRET)19.6~56.6 μM2.44 μM
CDs-AuNPs-GSH (This article)Fluorescence quenching0.5~125.0 mM0.38 mM
Table 2. Detection of Co2+ in actual samples (n = 3).
SampleAdd (mM)Found (mM)Recovery (%)RSD (%)
Chloride cobalt feed additive044.99-0.07
2062.8789.40.09
4084.3698.40.06
60107.34103.90.13
Disclaimer/Publisher’s Note: The statements, opinions and data contained in all publications are solely those of the individual author(s) and contributor(s) and not of MDPI and/or the editor(s). MDPI and/or the editor(s) disclaim responsibility for any injury to people or property resulting from any ideas, methods, instructions or products referred to in the content.