Article

Detection of Hg2+ in Water by Modified Gold Nanoparticles: A Rapid Method and Its Mechanistic Basis


1
Key Laboratory of Urban Stormwater System and Water Environment, Ministry of Education, Beijing University of Civil Engineering and Architecture, Beijing 100044, China
2
CAUPD (Beijing) Planning & Design Consultants Co., Ltd., Beijing 100044, China
*
Author to whom correspondence should be addressed.
Chemosensors 2026, 14(6), 138; https://doi.org/10.3390/chemosensors14060138
Submission received: 21 May 2026 / Revised: 12 June 2026 / Accepted: 14 June 2026 / Published: 16 June 2026

Abstract

A new sensor was developed to detect Hg2+ ions; different volume ratios of chloroauric acid and sodium citrate were used, which were 1.0, 0.8 and 0.5. Three kinds of gold nanoparticles (AuNPs) with sizes of 18 nm, 25 nm and 32 nm were synthesized in this way. The functional modification with succinimide and glutarimide was performed on these three sizes of AuNPs. Hg2+ was detected by colorimetric detection of AuNPs modified with succinimide and glutarimide. Research shows that, because a complex structure was formed by a coordination reaction with Hg2+, the aggregation of AuNPs occurred, the color changed from red to purple, and the characteristic absorption peak of the UV–visible absorption spectrum was redshifted. The best visual detection limit is 5 μmol/L, showing good selectivity and broad applicability; it was found that the material was specific to the detection of Hg2+. The novelty of this study lies in the use of simple imide-containing modifiers and the systematic comparison of particle-size-dependent colorimetric responses of modified AuNPs toward Hg2+. These results offer a promising approach for tracking and monitoring Hg2+ contamination in aquatic environments.

1. Introduction

Heavy metal pollution has received increasing attention due to its threat to global ecosystems and public health [1,2,3], especially mercury (Hg) as one of the most toxic heavy metals [4,5]. Nevertheless, mercury is extensively applied in multiple industrial fields including precious metal refining and pigment production, and it still finds broad practical usage in glass thermometers, electronic components and industrial catalytic processes [6,7,8,9]. For example, Hg2+ may be present in wastewater generated from metal smelting and refining, chlor-alkali production, battery and electronic manufacturing, pigment production, laboratory discharge, and landfill leachate. These wastewater sources may release soluble mercury species into aquatic environments if they are not properly treated. However, the large-scale use of mercury has caused serious harm to organisms because mercury has been improperly treated and has led to accidental leakage of mercury [10]. Studies also confirm that exposure to a minimal amount of mercury via the food chain can also cause acute or chronic damage to the human body due to several interactions, such as anemia, diabetes, liver and kidney damage, and heart failure [4,11,12]. Therefore, people pay more attention to heavy metal pollution, especially mercury, lead, and cadmium pollution, and carry out toxicological research on it [13,14,15].
The Minamata Convention regards mercury pollution control as an important issue of global environmental governance, and requires the control of the release of mercury and mercury compounds into the air, land and water. According to the World Health Organization, the maximum allowable concentration of mercury is 6 ng/mL, which is 6 ppb [9,16]. Conventional methods for the determination of Hg2+ include atomic absorption spectrometry, atomic fluorescence spectrometry, inductively coupled plasma mass spectrometry, and electrochemical methods [17,18]. Spectrometric and ICP-based methods generally provide high sensitivity and reliable quantitative results, but they often require expensive instruments, complicated sample pretreatment, and trained operators [19,20]. In contrast, electrochemical methods are generally considered relatively low-cost, portable, and suitable for rapid detection. However, their analytical performance may still be affected by electrode modification procedures, electrode stability, surface fouling, and interference from complex sample matrices. Therefore, it is still meaningful to develop simple, visual, and rapid colorimetric methods for Hg2+ detection.
Over the past few years, there have been many reports about the use of the gold nanoparticle (AuNP) sensors for colorimetric detection [21,22,23]. Usually, nanotechnology colorimetry is commonly constructed to achieve highly sensitive, rapid, and low-cost analysis on the basis of its excellent physical and chemical properties [24,25,26]. In addition, colorimetry is simple and inexpensive, and color changes can be identified visually [27,28]. AuNPs are modified by poly-thionine composite [29], DNA [30], amino acids [31], polymercaptans [32], 2-Aminothiazole [33], and surfactants [34]. AuNPs exhibit a pronounced localized surface plasmon resonance (LSPR) band in the visible region, making them suitable for colorimetric sensing and visual readout [35,36,37,38,39]. According to Mie theory, the optical extinction of spherical AuNPs arises from both absorption and scattering, and their localized surface plasmon resonance (LSPR) band is closely related to particle size and the surrounding dielectric environment [40]. For spherical AuNPs, the LSPR absorption band usually appears in the visible region, typically around 500–600 nm [41,42]. For the colorimetric detection of AuNPs, when Hg2+ exists, the state of aggregation or dispersion of AuNPs changes, and the position of the peak will change with the size of AuNPs and the change in its degree of separation [43,44]. Therefore, the position and shape of the surface plasmon resonance (SPR) absorption peak will change [45]. When Hg2+ reacts with AuNPs modified with the hormone-affinity amino acid, Hg2+ induces aggregation of AuNPs, shifting the absorption peak to red, or induces dispersion of AuNPs, shifting the absorption peak to blue [46]. A change in the absorption peak can be precisely measured with a UV-Vis spectrometer for quantitative determination of Hg2+ [47,48,49]. Measuring the colorimetric change in AuNPs can accurately identify the colorimetric correlation between AuNPs and Hg2+ [50].
Several studies have shown that to achieve specific recognition of target substances in the colorimetric detection of AuNPs, most of the organic compounds synthesized in AuNPs surface modification are used, which is complicated, time-consuming, and costly [51]. The AuNPs were modified with succinimide and glutarimide, which were directly available at relatively low cost, and the colorimetric detection of Hg2+ was carried out. In this study, the AuNPs were modified with succinimide and glutarimide, which were directly available at relatively low cost. Compared with L-cysteine functionalized AuNPs (Cys-GNPs) by Chai et al., AuNPs modified by succinimide and glutarimide are more convenient to operate, and Cys-GNPs need the assistance of an ultraviolet light source, which is not conducive to rapid on-site detection [52]. Zhang et al. reported a method for colorimetric detection of Hg2+ based on quantum dots. Compared with this study, the complex preparation process of quantum dots is an unfavorable factor limiting its application in heavy metal detection [53]. The sensitivity, selectivity, and universality of AuNPs for Hg2+ detection were studied. The application of AuNPs in colorimetric detection of heavy metal Hg2+ is further expanded, providing a theoretical basis for real-time field detection of heavy metal Hg2+ pollutants.

2. Materials and Methods

2.1. Chemical Reagent

Succinimide and glutarimide were chemically pure, and were purchased from Beijing Chemical Plant (Beijing, China). Potassium dihydrogen phosphate, potassium hydrogen phosphate, nitric acid and hydrochloric acid were analytical reagents purchased from the Beijing Chemical Plant (Beijing, China). Chloroauric acid was an analytical reagent, which was purchased by Chemical Reagent Co., Ltd. (Beijing, China). The standard solutions of sodium citrate, lead, zinc, mercury, manganese, nickel, cadmium, copper and cobalt were analytical reagents purchased from Tianjin Guangfu Technology Development Co., Ltd. (Tianjin, China). Thiosulfate and hexamethylene diamine were analytical reagents purchased from Sanofi Chemical Reagents Co., Ltd. (Paris, France). The glass instruments used in this experiment were cleaned with aqua regia (the volume fraction of concentrated hydrochloric acid and concentrated nitric acid was 3:1) and ultrapure water was obtained from a Millipore water purification system (Burlington, MA, USA).

2.2. Characterization of AuNPs

Absorption spectra were detected with an ultraviolet–visible light detector (Lambda 650S) from PerkinElmer Inc. (Waltham, MA, USA) at room temperature. Glass instruments were dried in a high-performance blower dryer (BGP-9140A) from Shanghai Yiheng Scientific Instruments Co., Ltd. (Shanghai, China). The particle size of the material was characterized using a transmission electron microscope (TEM, EM-1200EX) from Japan JEOL Corp at an accelerating voltage of 120 kV (Tokyo, Japan). Particle size distribution of the nanocrystalline Au solution was measured using a particle size potentiometer (Zetasizer Nano) from Malvern Instruments Co., Ltd. (Malvern, UK). The AuNPs and functional material were mixed by a vortex mixing meter (Vortex-Genie 2) manufactured by Shanghai Qiangqiang Equipment Co., Ltd. (Shanghai, China).

2.3. Preparation of AuNPs

AuNPs were prepared using a modified sodium citrate reduction method [25,50,52]. Before the experiment, all glassware was soaked in aqua regia for about 2 h, washed thoroughly with ultrapure water, and dried in an oven. Briefly, 5 mL of HAuCl4 solution (0.2%, w/w) and 92.5 mL of ultrapure water were added into a 250 mL three-neck round-bottom flask. Under reflux conditions, the solution was heated to approximately 100 °C and magnetically stirred at 1500 rpm. Then, sodium citrate solution (1%, w/w) was rapidly added while stirring continuously. The color of the solution gradually changed from light yellow to colorless, then to brown and black, and finally to burgundy, indicating the formation of AuNPs. After the color no longer changed, the solution was further heated and boiled for 15 min until the resulting AuNP solution became stable. After boiling, the solution was continuously stirred and cooled to room temperature, and then stored at 4 °C.
The particle size of AuNPs was regulated by changing the feeding ratio of HAuCl4 and sodium citrate. Specifically, 5.0, 4.0, and 2.5 mL of sodium citrate solution were added to prepare AuNPs with particle sizes of approximately 18, 25, and 32 nm, respectively. The other preparation conditions were kept the same for all three particle sizes.

2.4. Preparation of the Functionalized AuNPs

Two sets of 17 mL of AuNP solution were taken in a 50 mL centrifuge tube, 2.84 mL of PBS buffer solution (pH = 7.17) was added, then mixed and stirred. Then, 17 mL of succinimide (the concentration is 1.74 μmol/L) was mixed and stirred for 1 h and set aside for use. Glutarimide-modified AuNPs were prepared by the same procedure.

2.5. Experimental

2.5.1. Sensitivity

The Hg2+ stock solution was prepared by diluting the mercury standard solution with ultrapure water. Working solutions of Hg2+ with different concentrations were freshly prepared by further dilution of the stock solution before use. Three milliliters of succinimide/glutarimide-modified AuNP solution was added to a 5 mL centrifuge tube, followed by the addition of 0.6 mL of Hg2+ solutions with different concentrations (0, 0.1, 1, 10, 20, 25, 30, 40, 50, 60, and 80 μmol/L). The mixture was mixed thoroughly and allowed to stand for color development. The color of the gold solution was observed with increasing Hg2+ concentration. The ultraviolet–visible absorption spectrum was used to measure the reaction solution, then UV-Vis spectra were obtained. A blank control and 30 μmol/L Hg2+ AuNPs solution were selected for TEM and particle size distribution characterization, and detection results were compared.

2.5.2. Selectivity

The addition of 30 μmol/L Hg2+ significantly changed the color of the succinimide/glutarimide-modified AuNPs solution. Therefore, 30 μmol/L was selected for the selectivity study. Other metal ion stock solutions, including Mn2+, Cu2+, Zn2+, Cd2+, Ni2+, Pb2+, and Co2+, were prepared at a concentration of 30 μmol/L. The standard solutions of different metal ions were diluted with ultrapure water to prepare 30 μmol/L solutions of different metal ions. Three milliliters of succinimide/glutarimide-modified AuNP solution was added to a 5 mL centrifuge tube, followed by the addition of 0.6 mL of each metal ion stock solution. The mixture was mixed thoroughly and allowed to stand for color development. The color change of different gold solutions was observed with the addition of metal ions, and the reaction solution with the addition of 30 μmol/L Hg2+ was analyzed and compared.

2.5.3. Application of Modified AuNPs in Real Tap Water

Tap water was used as the medium to prepare Hg2+ solution with different concentrations (0, 1, 30, and 50 μmol/L), then 3 mL of succinimide/glutarimide-modified AuNP solution was mixed with 0.6 mL of diluted Hg2+ standard solution with different concentrations in a 5 mL centrifuge tube; after thorough mixing, the mixture was allowed to stand for color development.

3. Results

3.1. Characterization of AuNPs

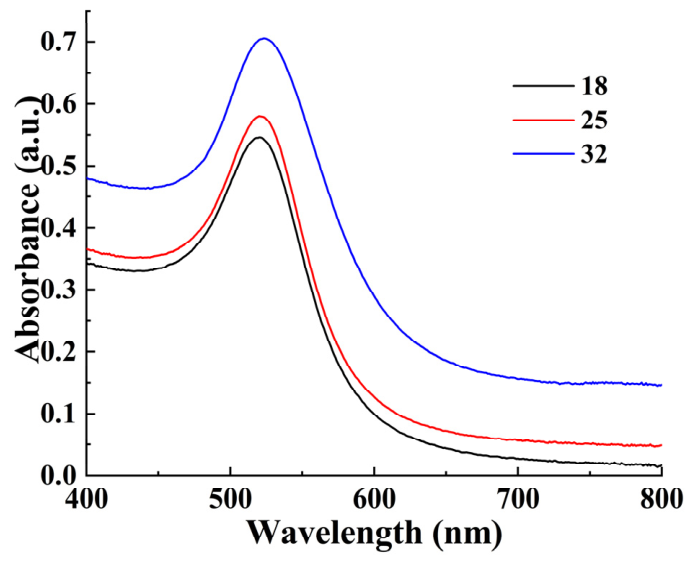
As shown in Figure 1, the UV–Vis absorption spectra of the prepared AuNPs showed characteristic LSPR absorption bands around 520 nm, indicating the successful formation of colloidal AuNPs. This result is consistent with the typical optical behavior of spherical AuNPs prepared by citrate reduction, whose LSPR absorption usually appears in the visible region. With the increase in particle size from 18 nm to 32 nm, the maximum absorption peak showed a slight redshift and the absorption band became broader. This phenomenon can be attributed to the size-dependent plasmonic properties of AuNPs. Larger AuNPs generally exhibit stronger light scattering and increased radiation damping, which can lead to peak broadening and redshifting of the LSPR band. In addition, the broader absorption band of larger AuNPs may also indicate a wider particle size distribution and relatively lower monodispersity. These results are consistent with previous studies showing that the optical absorption of AuNPs is strongly dependent on particle size, morphology, and dispersion state [42,43]. The particle sizes of the prepared AuNPs were confirmed mainly by TEM image analysis.
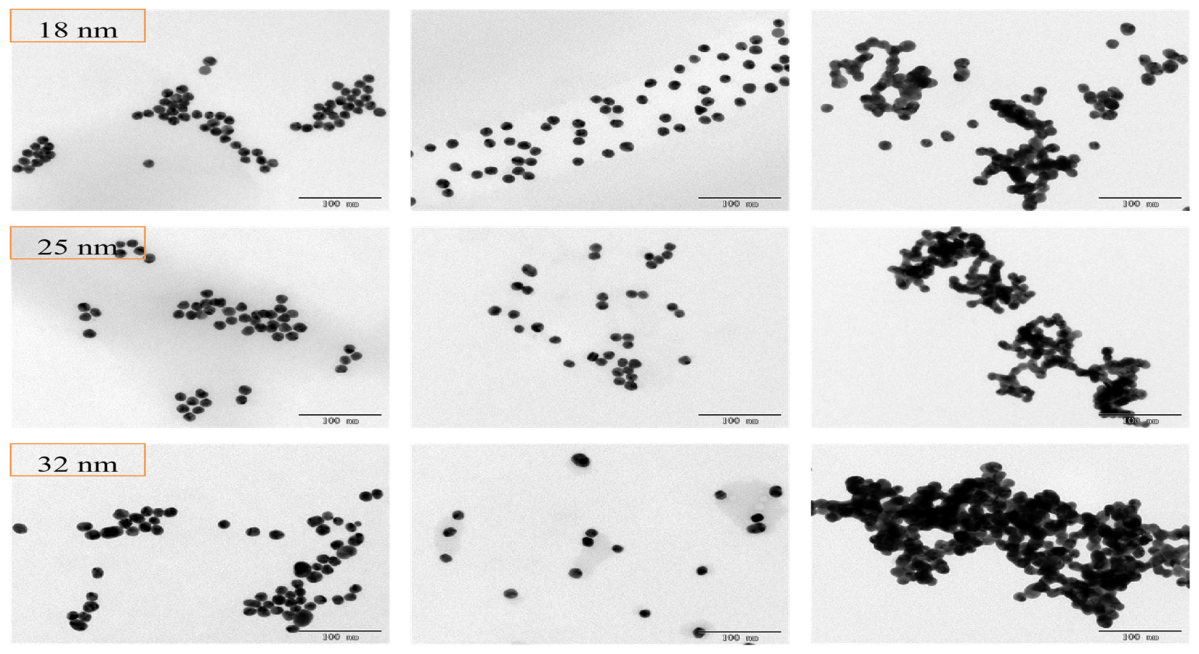
The AuNPs solution with the above three particle sizes of 15 μL was dropped on the carbon support film copper mesh for about 10 min, and the AuNP solution was sucked dry and dried naturally. The morphology, microscopic structure and particle size distribution of samples were observed by transmission electron microscopy. It can be seen that the three types of AuNPs prepared by sodium citrate reduction in chlorauric acid are basically spherical, uniform in shape, well-dispersed, stable, and without agglomeration.

3.2. Succinimide-Modified AuNPs

3.2.1. Sensitivity Study

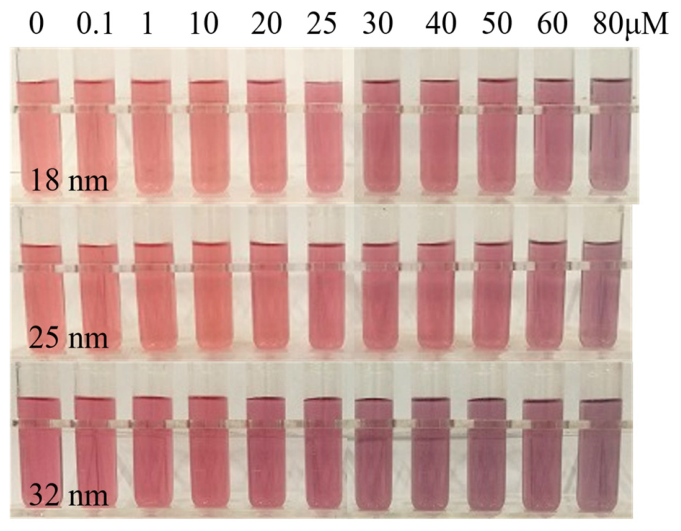
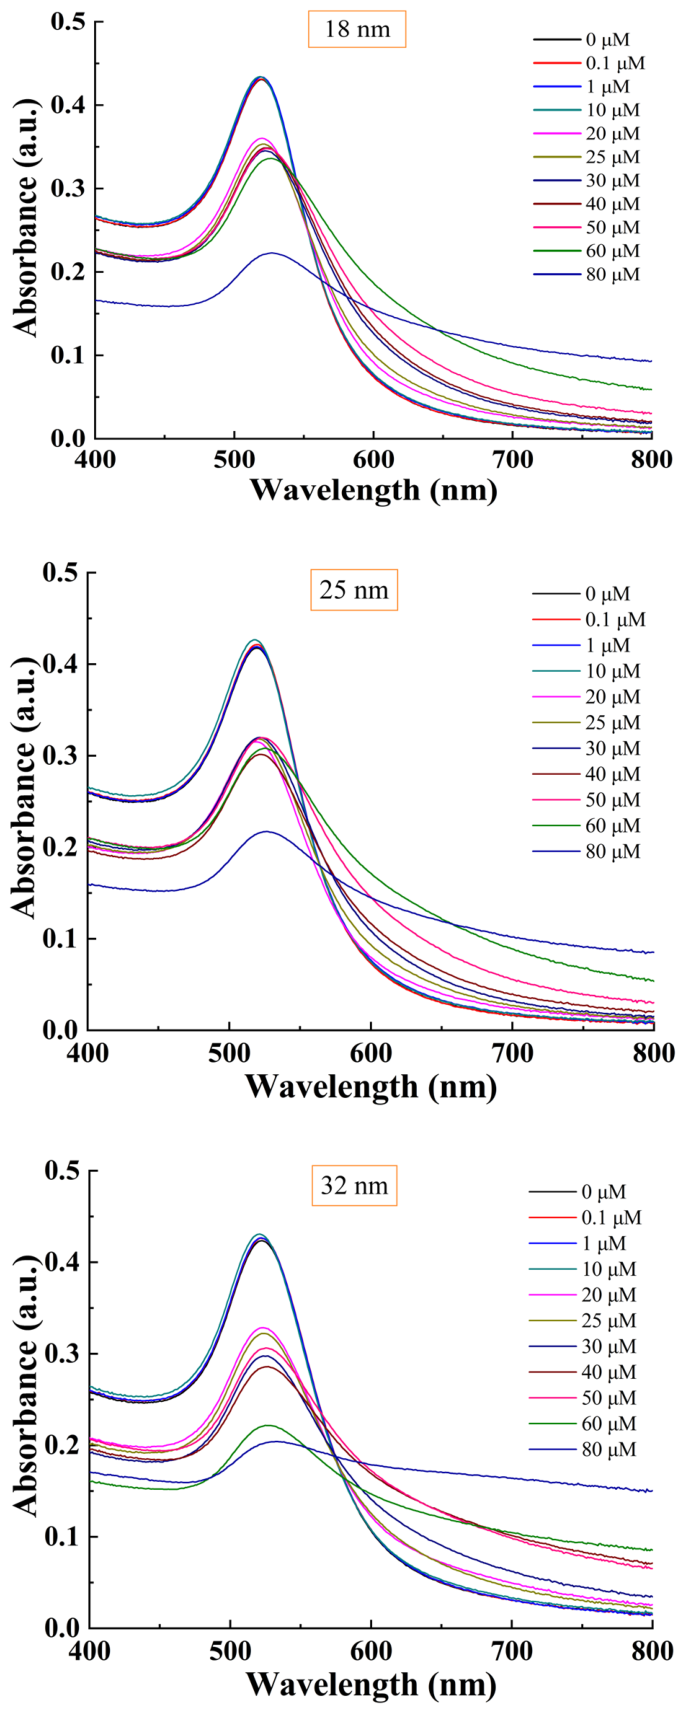
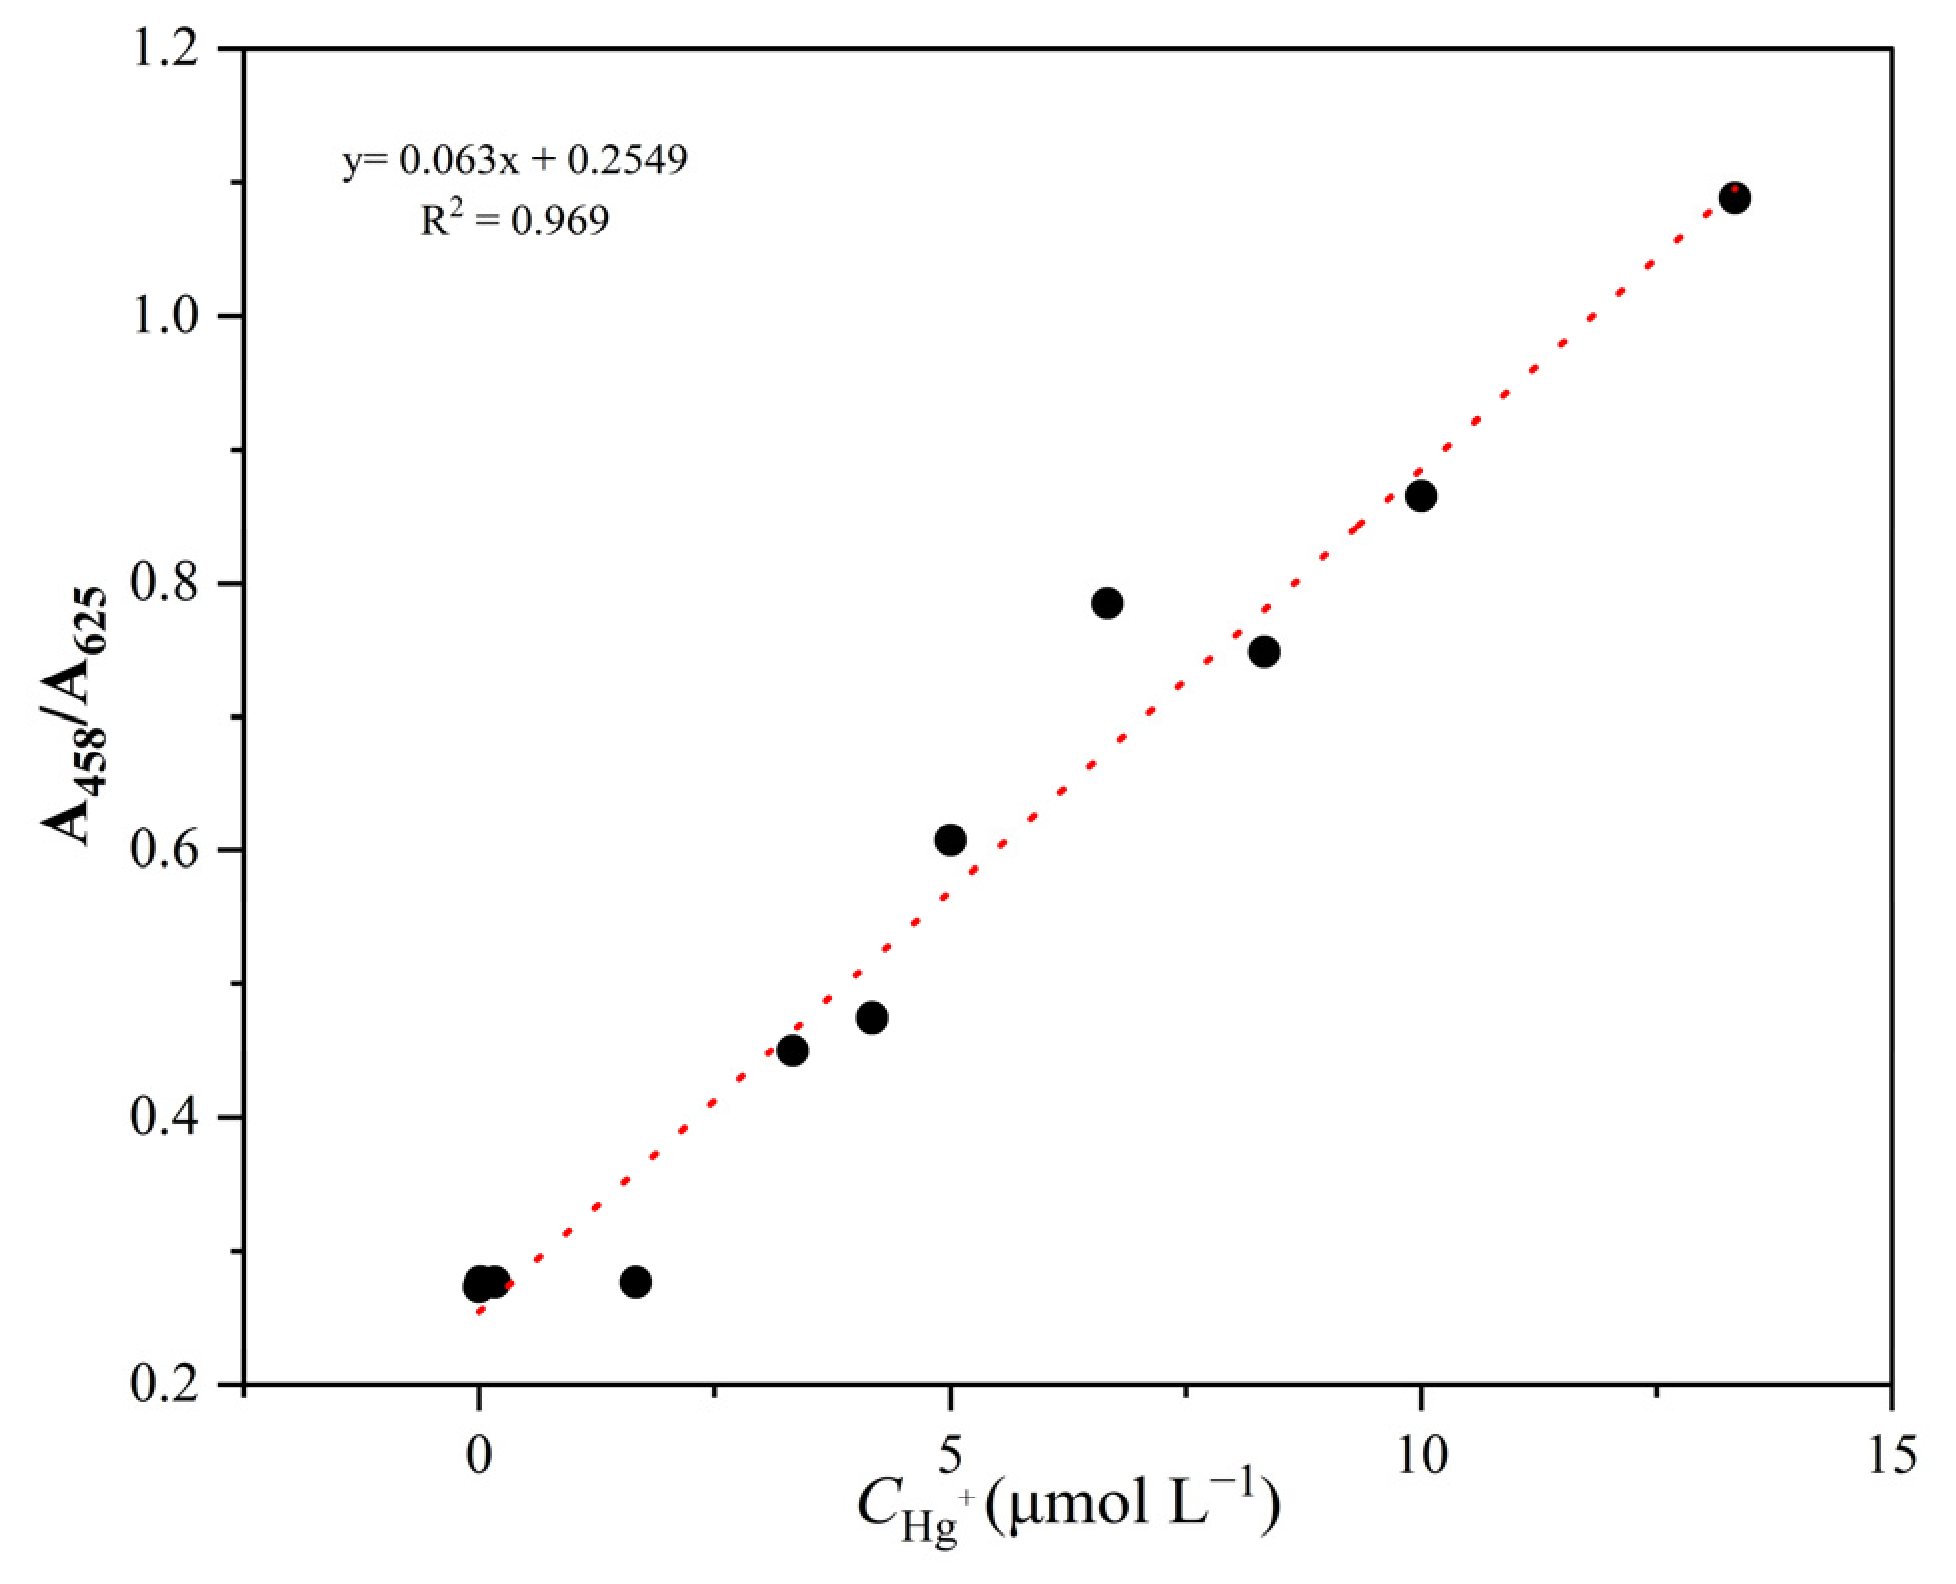
Under different concentrations of Hg2+, the colorimetric results of the detection system are shown in Figure 2. When the concentration of Hg2+ in the solution is 5 μmol/L, the color of the solution changes significantly compared to the blank control; that is, the color changes from red to dark purple. Therefore, 5 μmol/L is the visual detection limit of the detection system. Absorption spectra in the wavelength range of 400~800 nm were collected by a UV-Vis spectrophotometer. Ultraviolet–visible absorption spectra of succinimide, Figure 3, further indicate the degree of aggregation of different AuNPs at the same concentration of Hg2+. We compared the redshift effect and intensity change in characteristic peaks. Three types of AuNPs were used in this test. When mercury ion concentration reached 3.33 μmol/L, the absorption peak shifted obviously. Meanwhile, the peak intensity decreased significantly. However, the size of the 32 nm AuNP reaction solution has a higher degree of aggregation. As shown in Figure 4, the fitting equation of AuNPs modified by succinimide was y = 0.063x + 0.2549, q = 0.2549, R2 = 0.969. The minimum detection limit (LOD) was calculated to be 3σ/k according to the calibration curve, which was 2.167 μmol/L.
As for the sample of 15 μL (18 nm, 25 nm, 32 nm), it was added onto a copper mesh carbon carrier film to prepare the sample. The shape, appearance, and particle sizes were observed using the transmission electron microscope. These pictures are shown in Figure 5. Figure 5 is the TEM characterization of the reaction solution of AuNPs of three different sizes and intuitively reflects the aggregation state of the Hg2+ system detected by colorimetric detection, which is still spherical, and the particle size is much bigger than that of bare gold. The shape is basically uniform, and the stability is good. Results indicate that with Hg2+, the phenomenon of aggregation of the 32 nm AuNP reaction solution is obvious, and the agglomeration particle size is larger.
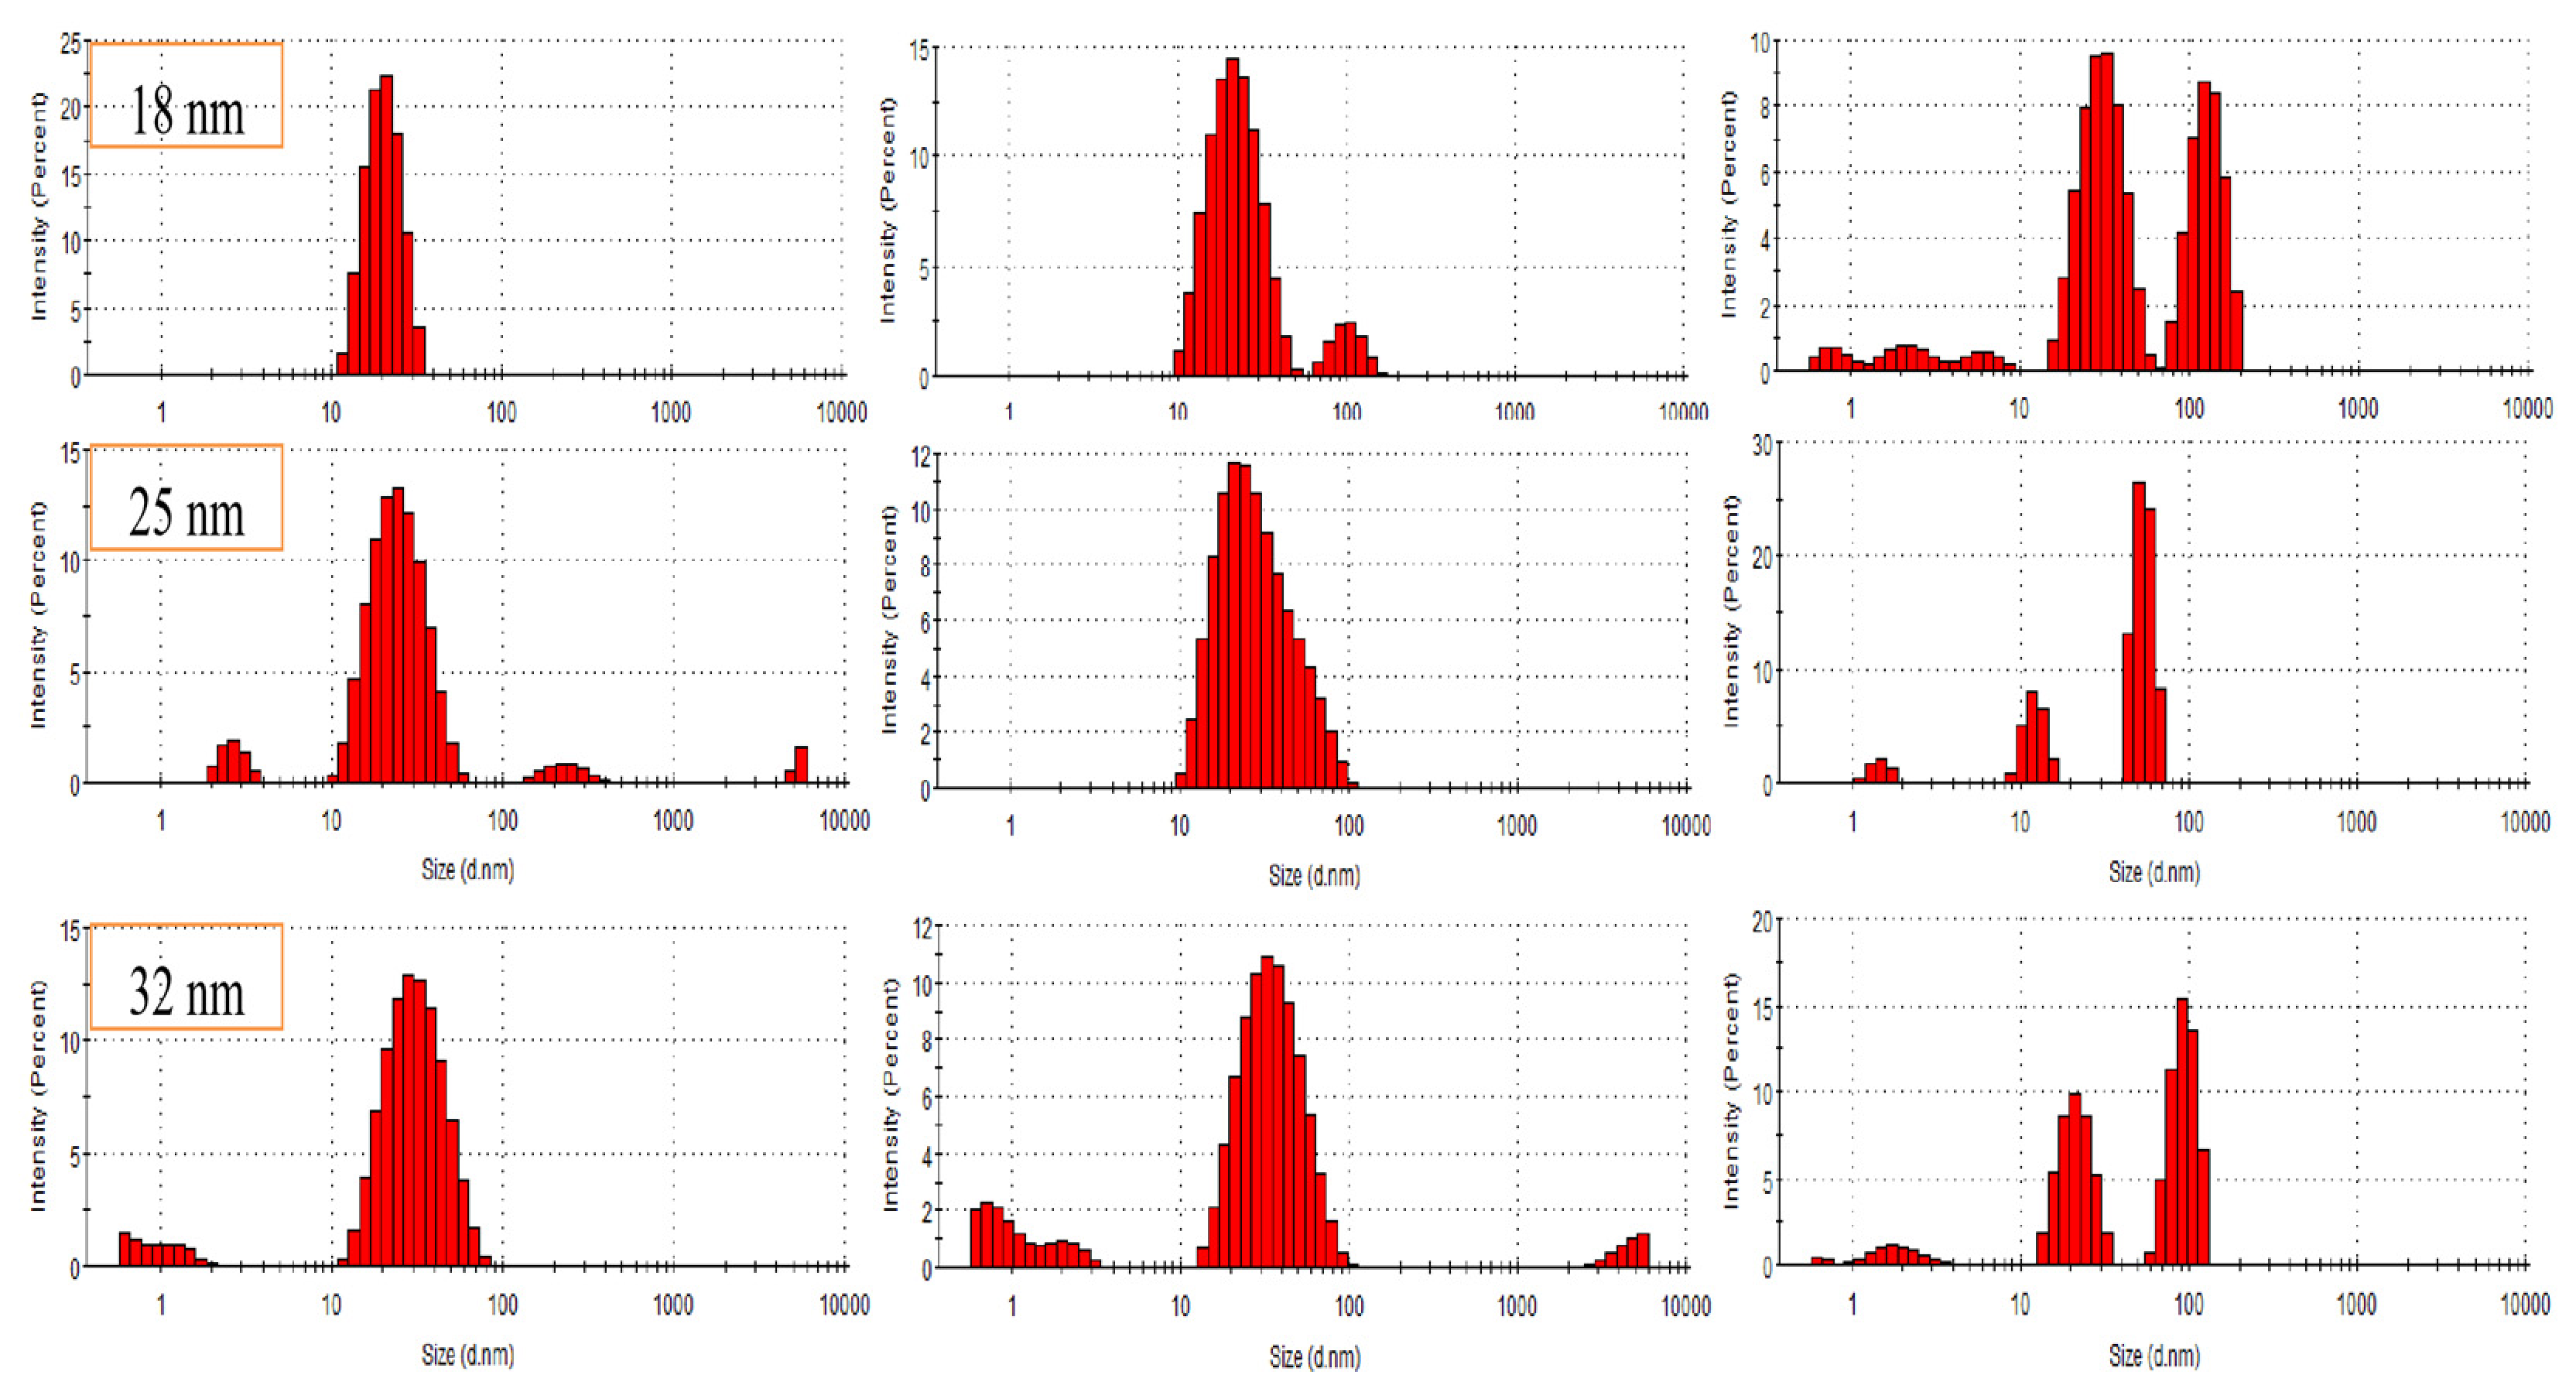
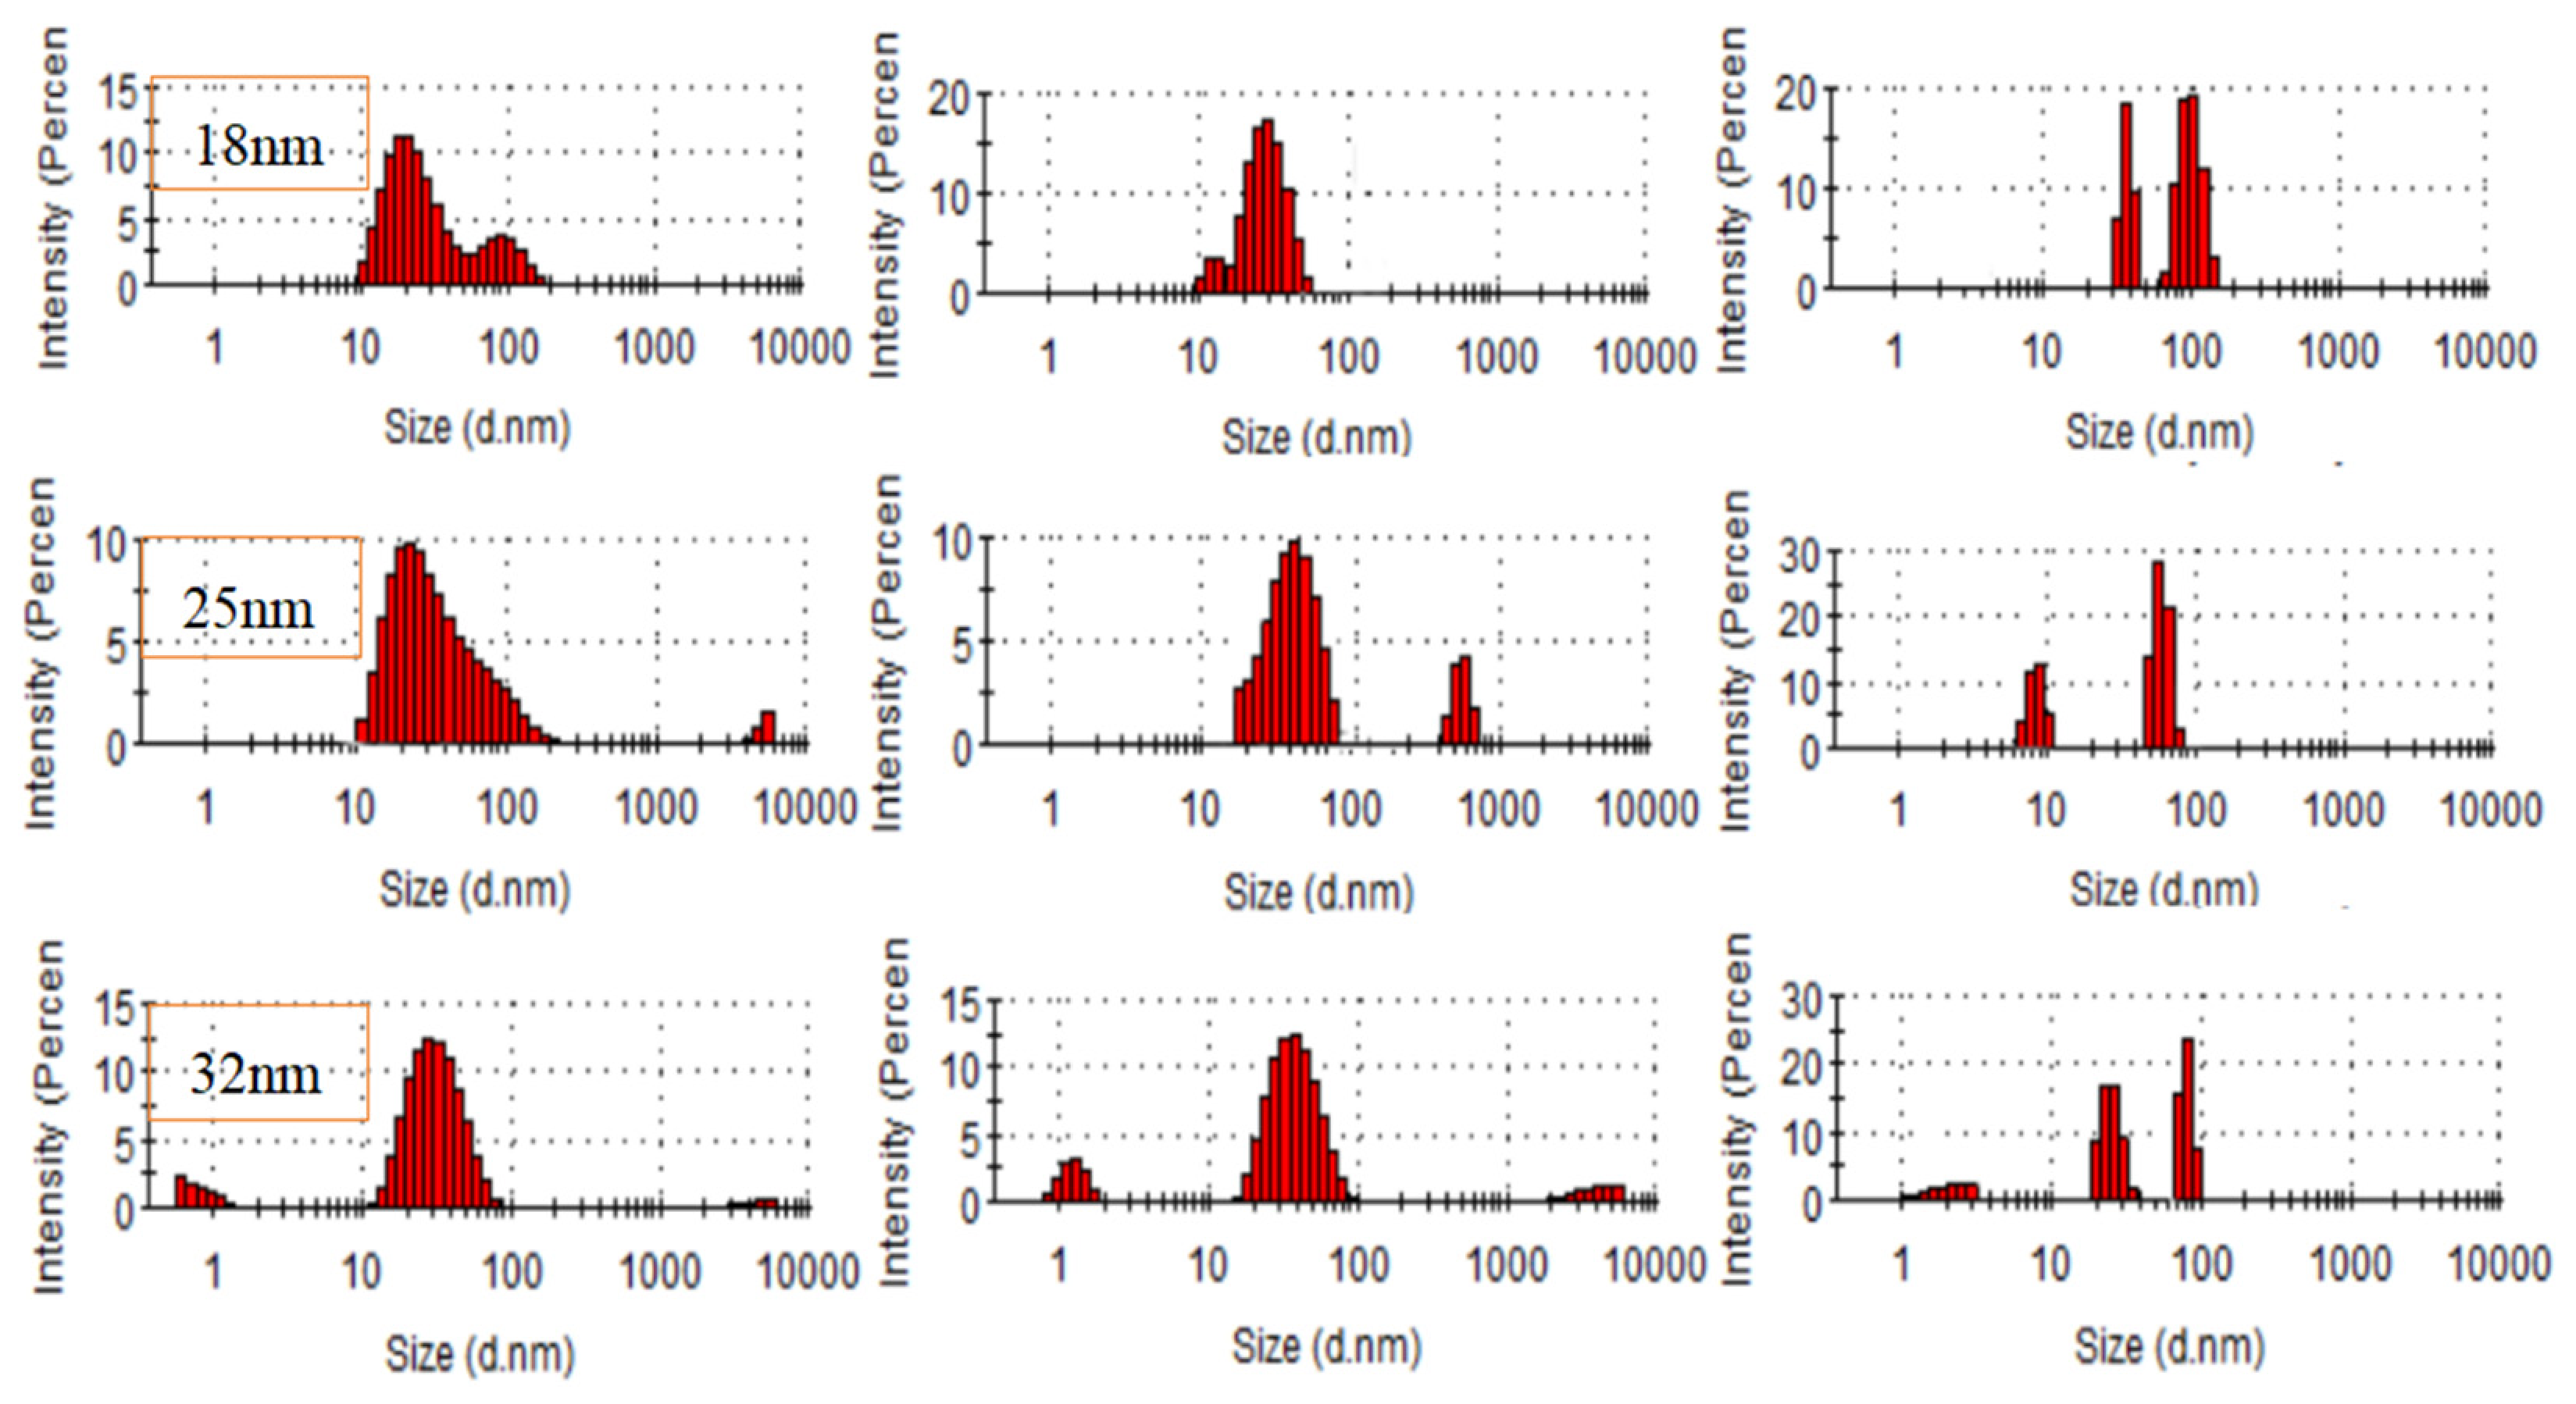
A total of 1.5 mL of AuNPs, succinimide-modified AuNPs, and succinimide-modified AuNPs + 30 μmol/LHg2+ (18 nm, 25 nm, 32 nm) were collected on the colorimetric plate. The particle size is scanned with a laser particle size analyzer. The result is shown in Figure 6. Figure 6 shows the particle sizes of succinimide-modified AuNPs and succinimide-modified AuNPs with Hg2+; the 18 nm AuNPs are approximately 22 ± 3.09 nm and 31 nm respectively, the 25 nm AuNPs are approximately 31 nm and 54 nm respectively and the 32 nm AuNPs are about 37 nm and 93 nm. It was further proved that more obvious aggregation occurred in the 32 nm AuNP reaction solution.

3.2.2. Detection of the Different Metal Ions

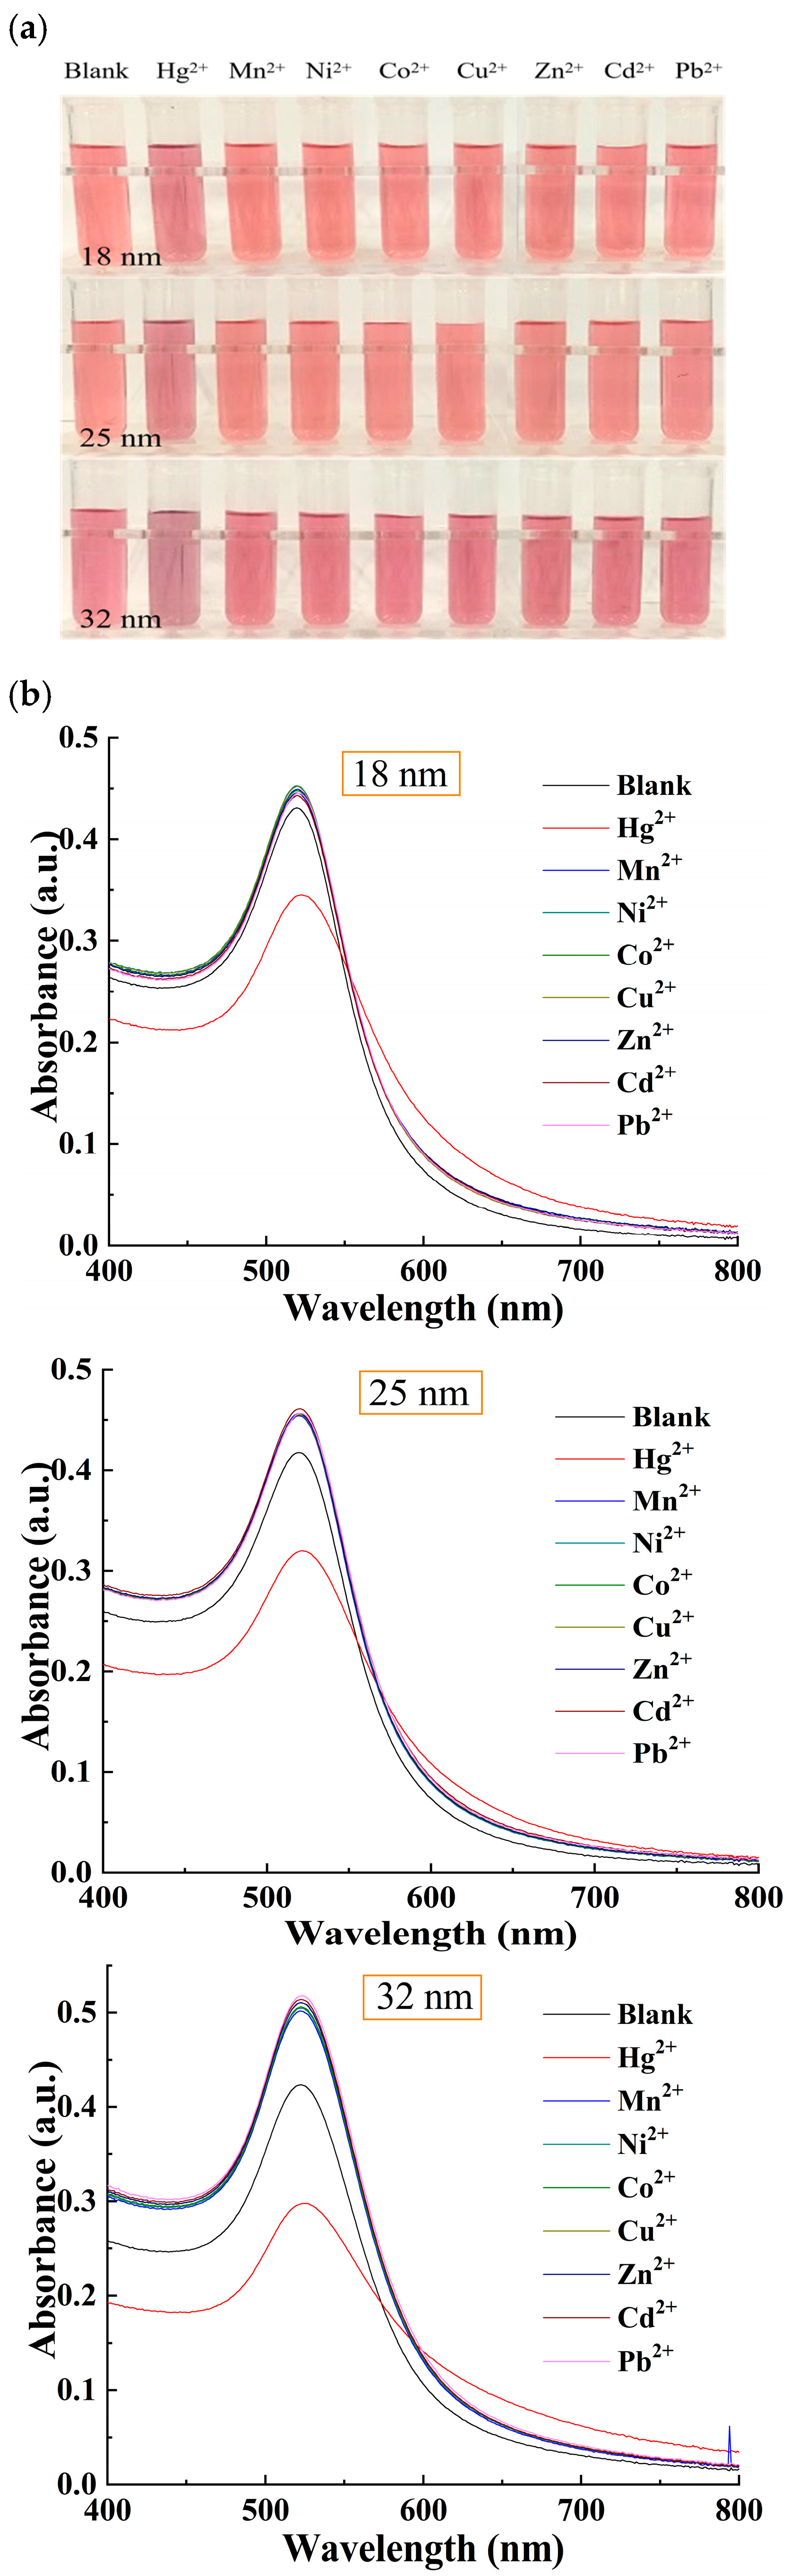
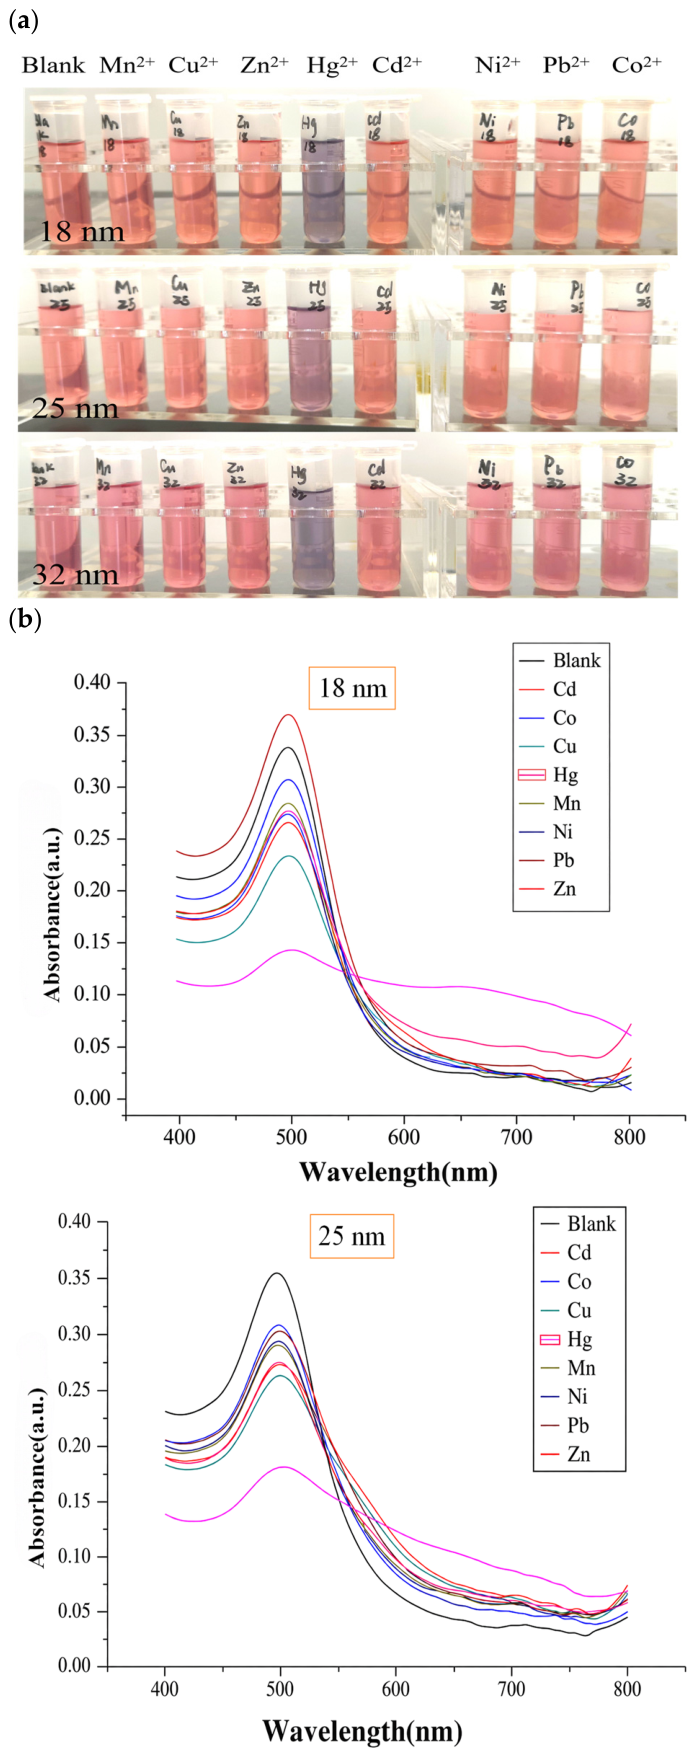
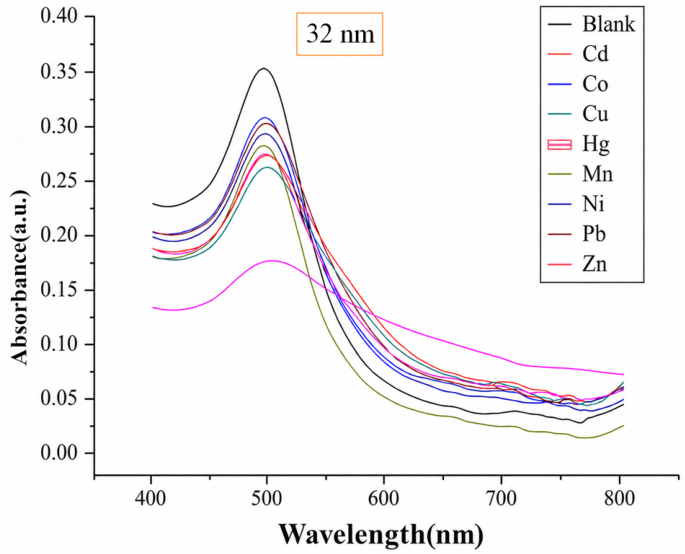
The colorimetric images and UV-Vis absorption spectra of different metal ions detected by the selective study of succinimide-modified AuNPs are shown in Figure 7. The results show that for the three sizes of the AuNPs modified by succinimide, other metal ions cannot aggregate and change color, and the UV-Vis absorption spectra are basically unchanged; the color change from red to blue occurred only when Hg2+ was added, and the surface plasmon resonance characteristic absorption peak in the UV-Vis absorption spectra gradually redshifted, and the peak intensity decreased. Three AuNP detection systems have good selectivity in the detection of Hg2+ and selectivity is relatively good when the particle size of AuNPs is 32 nm.

3.2.3. Application of Succinimide-Modified AuNPs in Real Tap Water

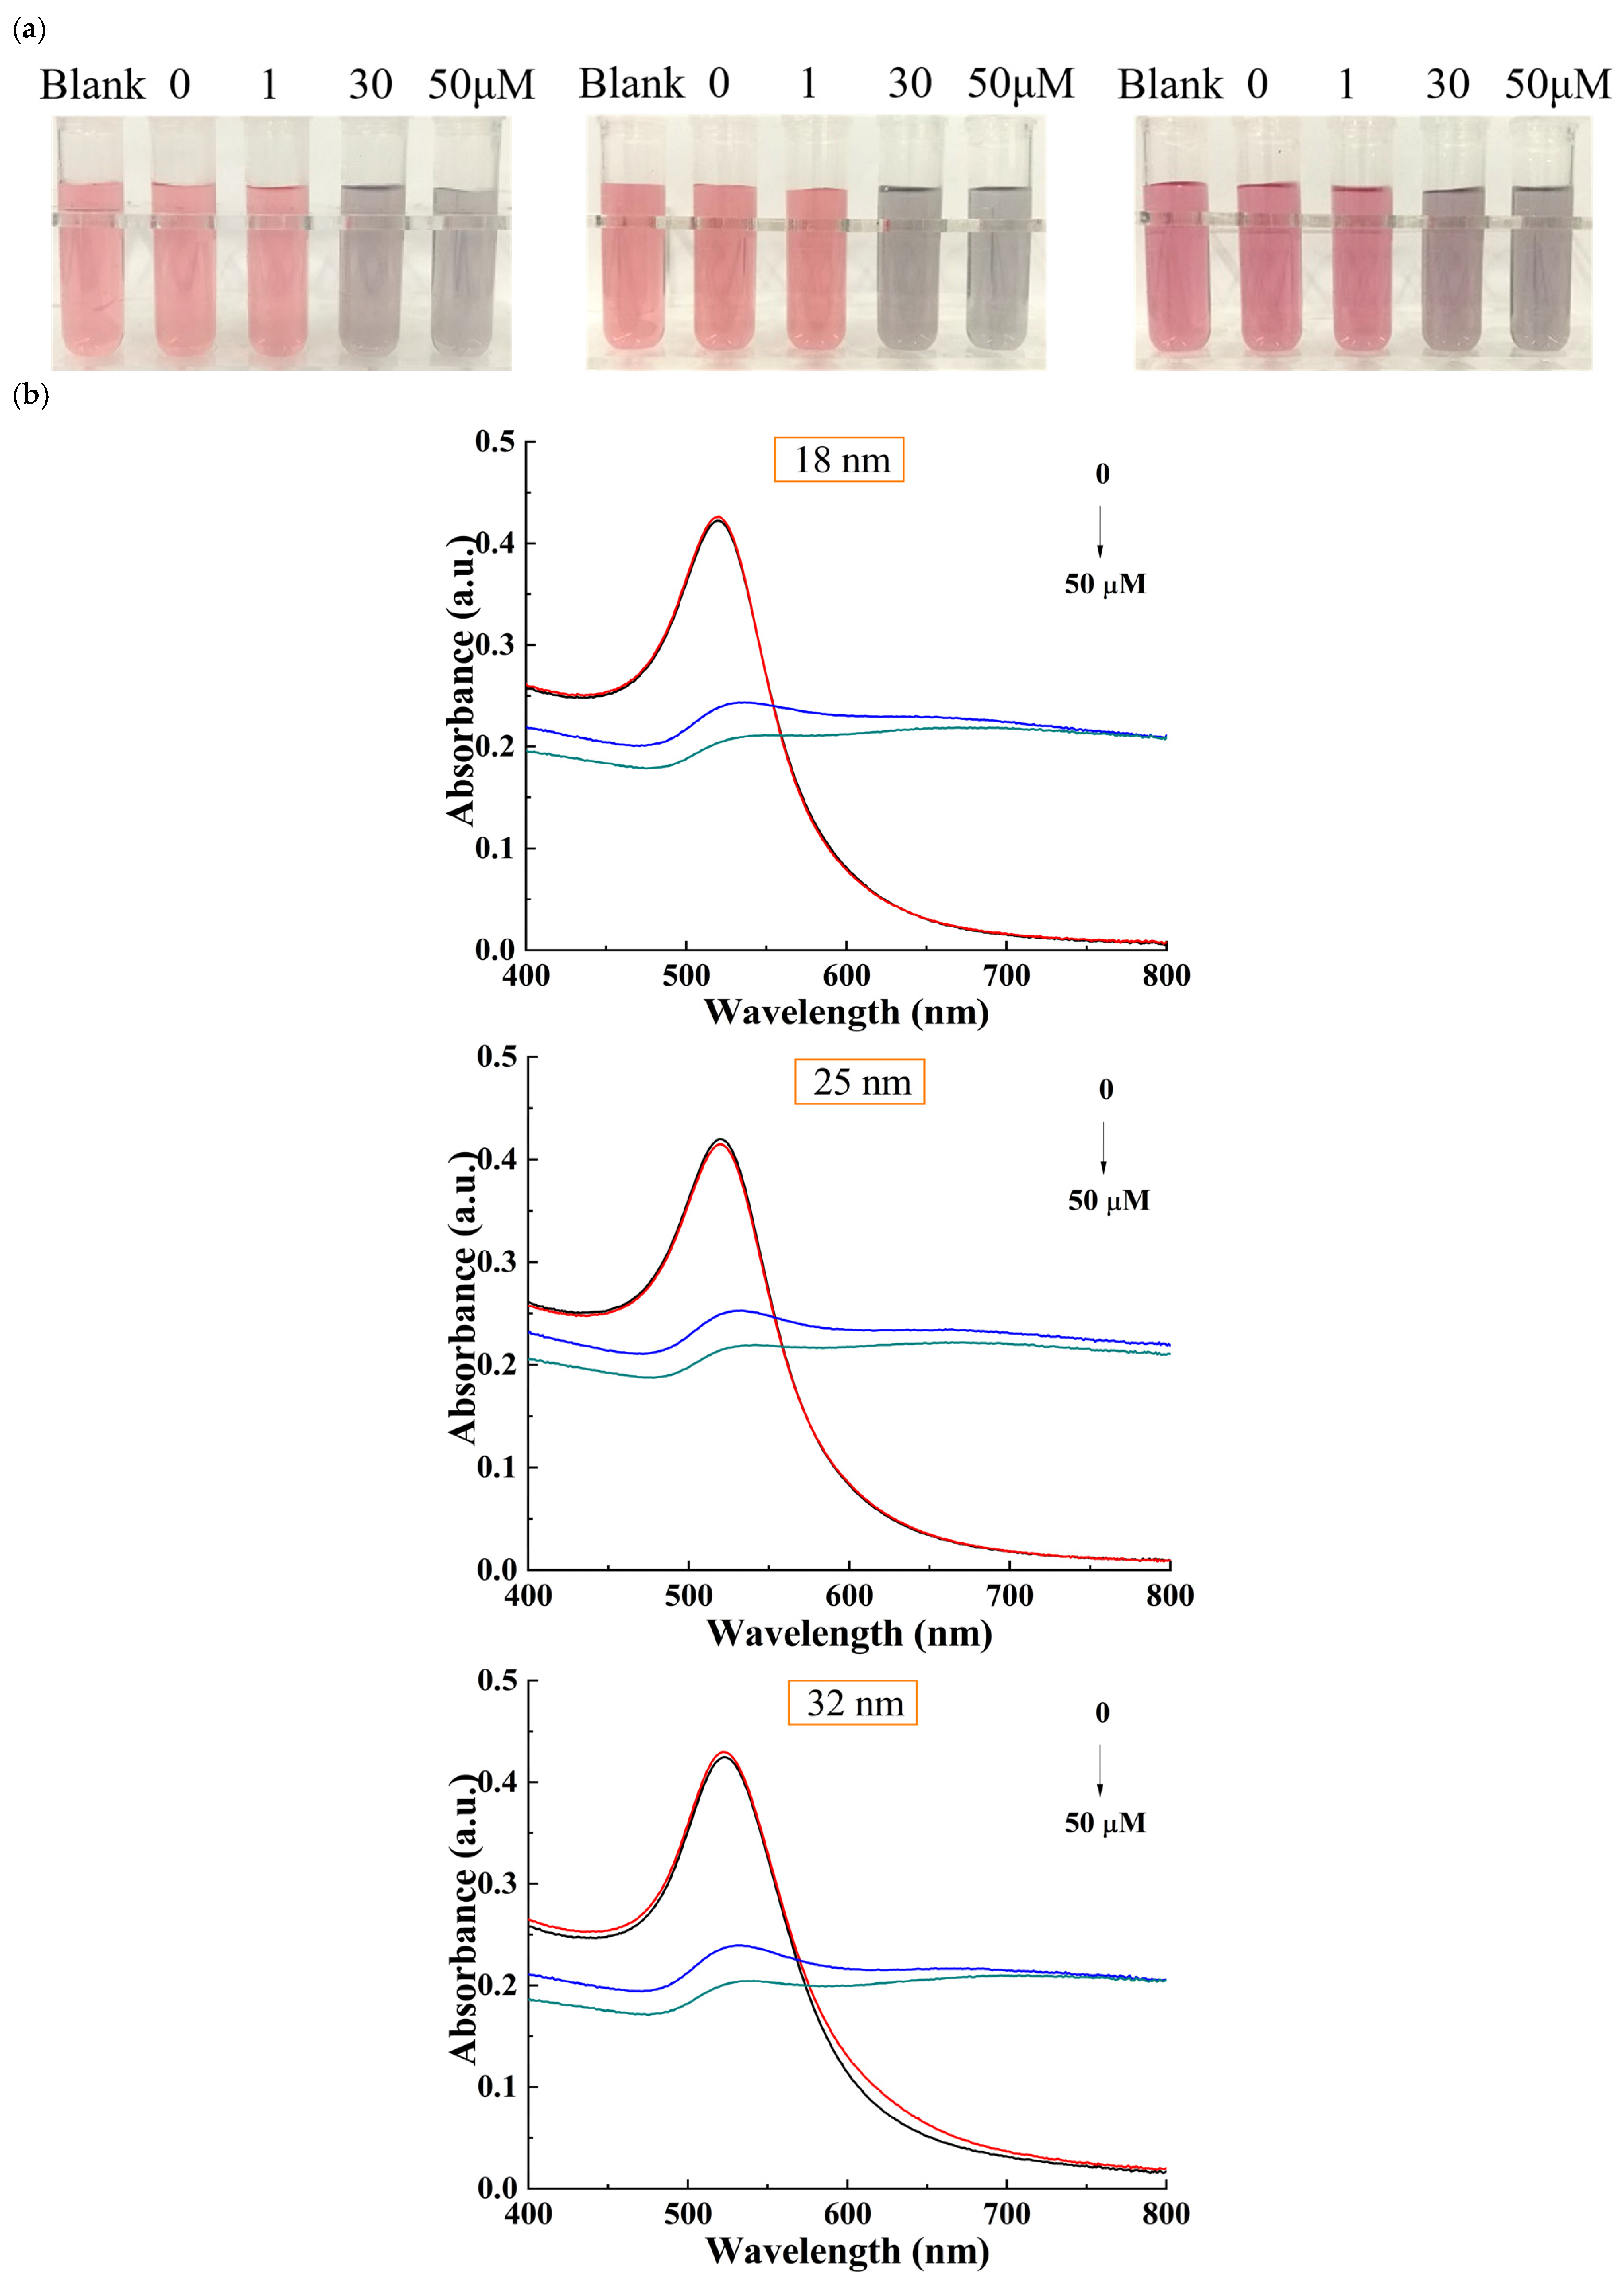
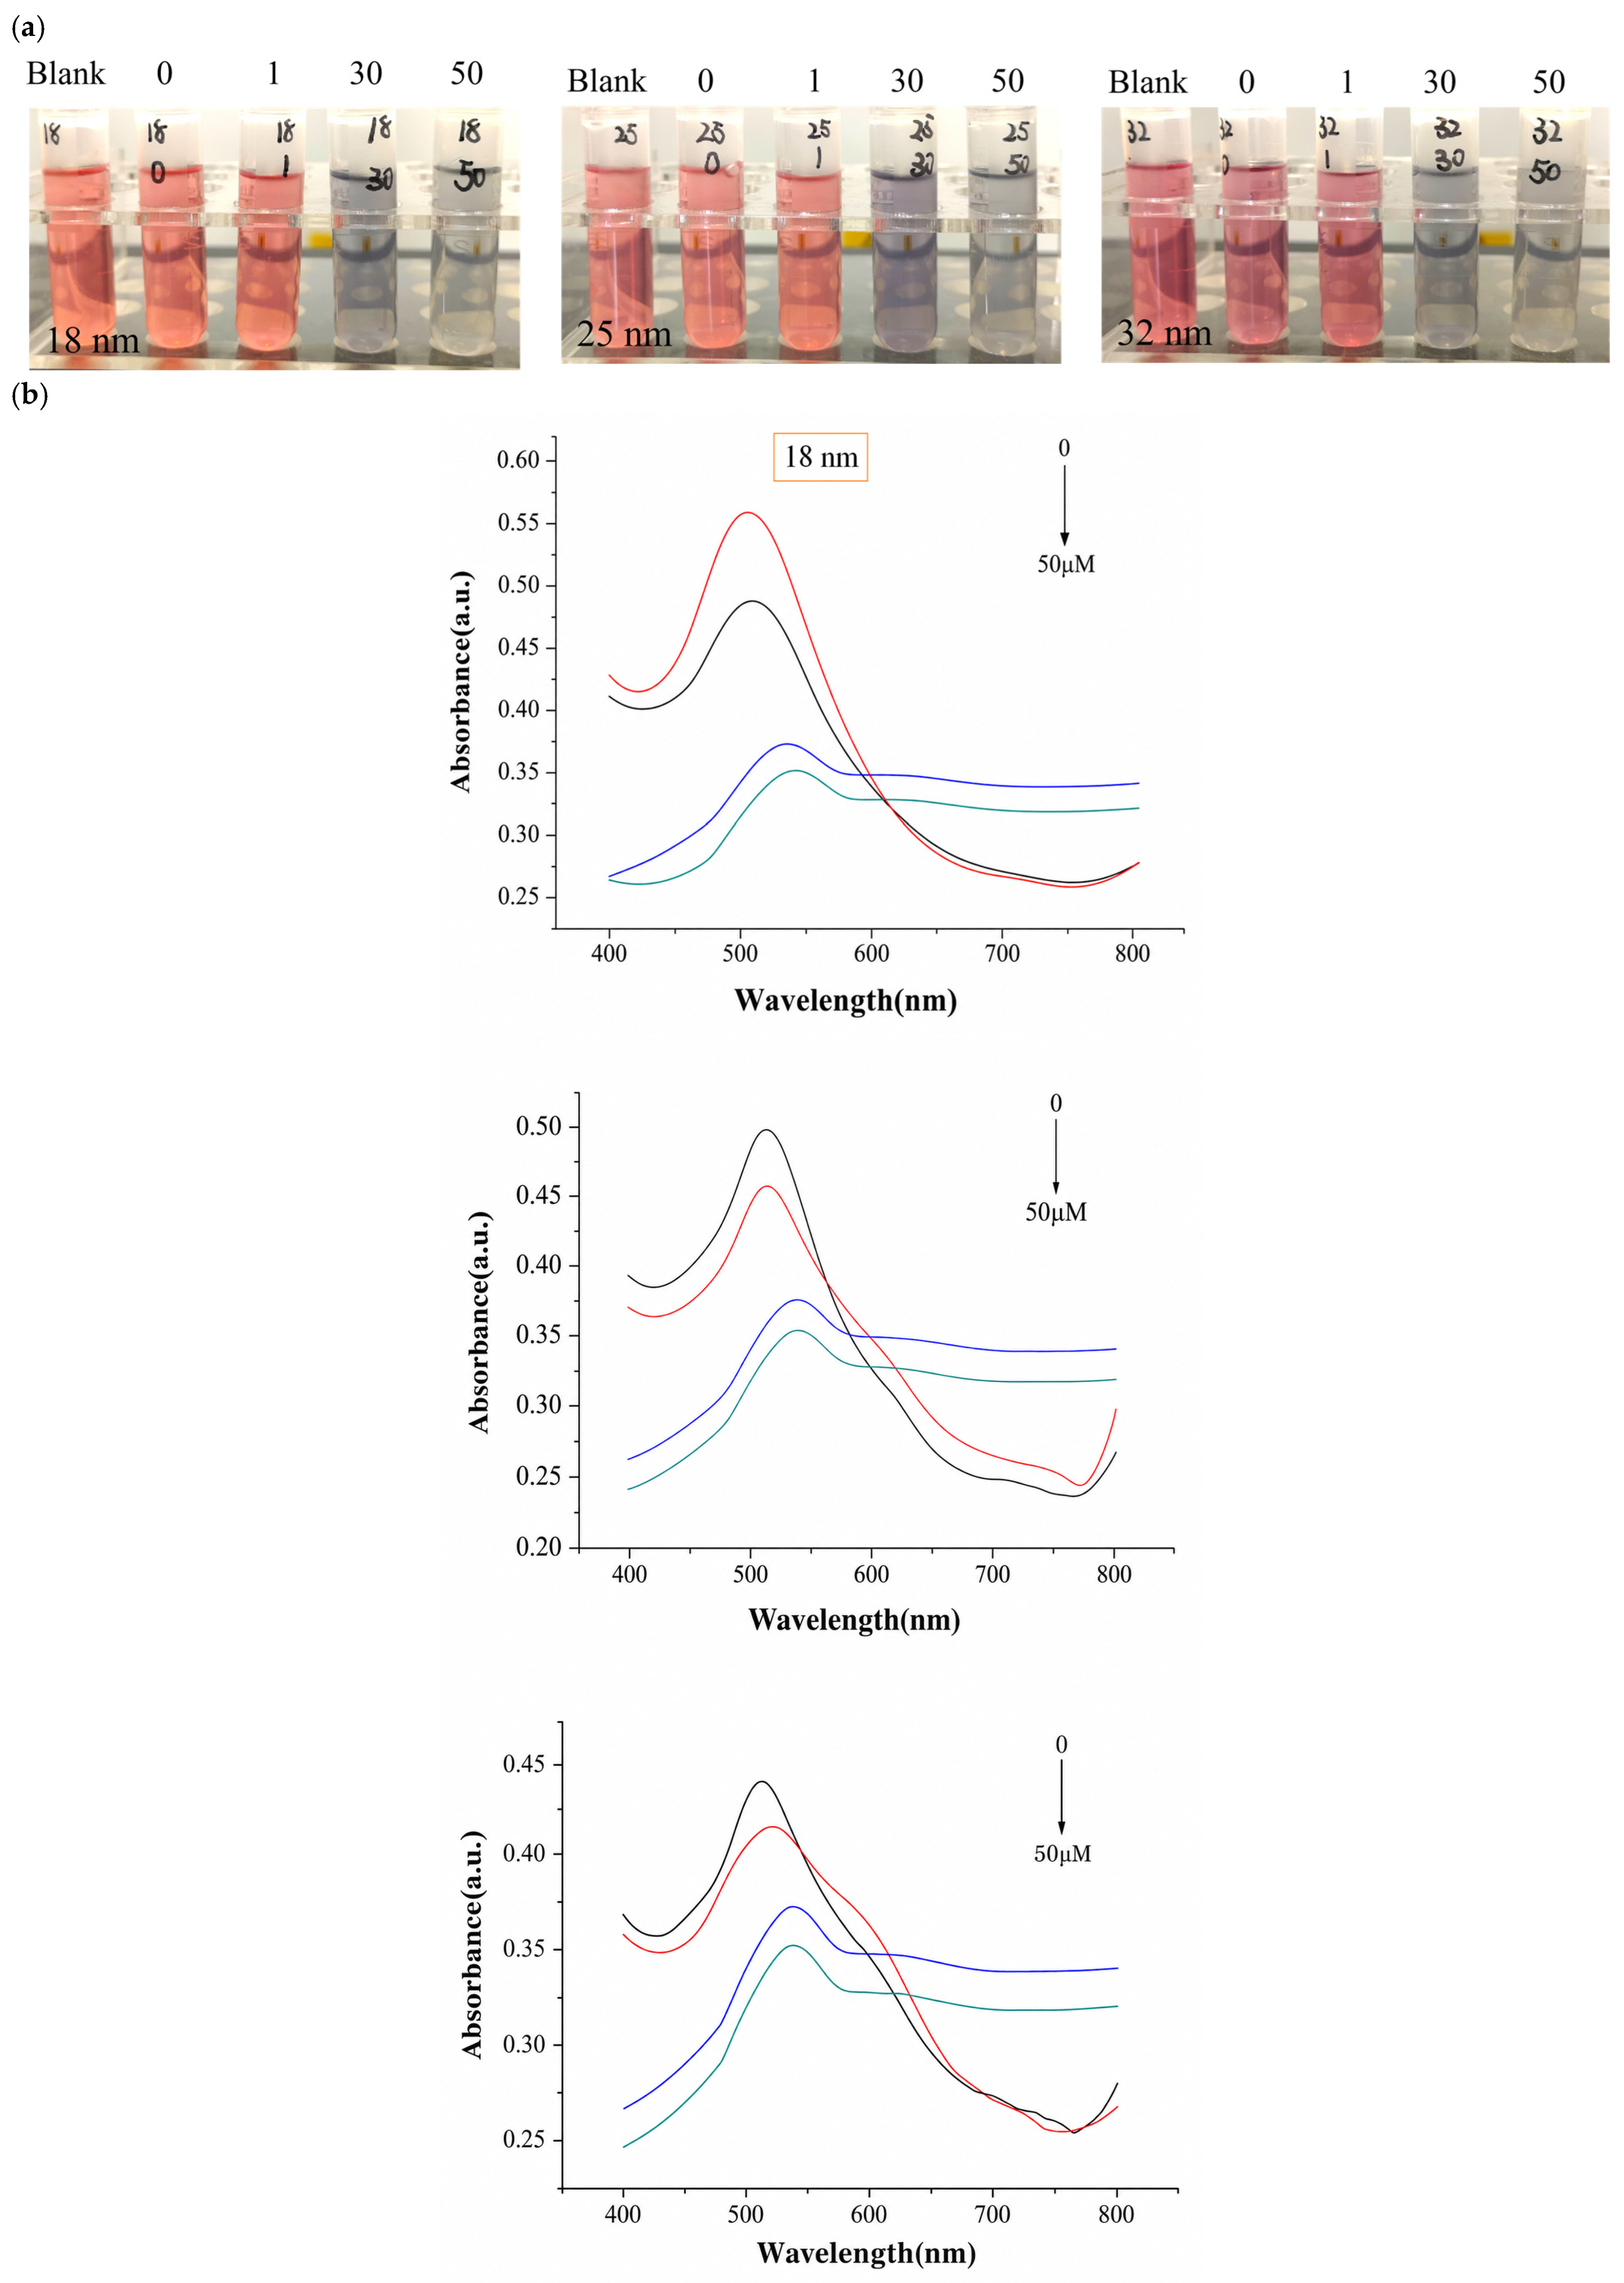
Three different sizes of succinimide-modified AuNPs in the universality study were tested on actual samples (tap water). Ultraviolet–visible spectrophotometers are used to measure the absorption spectrum at wavelengths from 400 nm to 800 nm, as shown in Figure 8. The results indicate that the color response of the three particle sizes is good, with regular, obvious changes in UV-Vis absorption spectra. For a given concentration, the color contrast and the UV spectrum have great reproducibility and also resemble the color change in detecting Hg2+ in ultrapure water very well, so all succinimide-modified Au NPs (18 nm, 25 nm, and 32 nm) have a more hopeful prospect.

3.3. Glutarimide-Modified AuNPs

3.3.1. Sensitivity Study

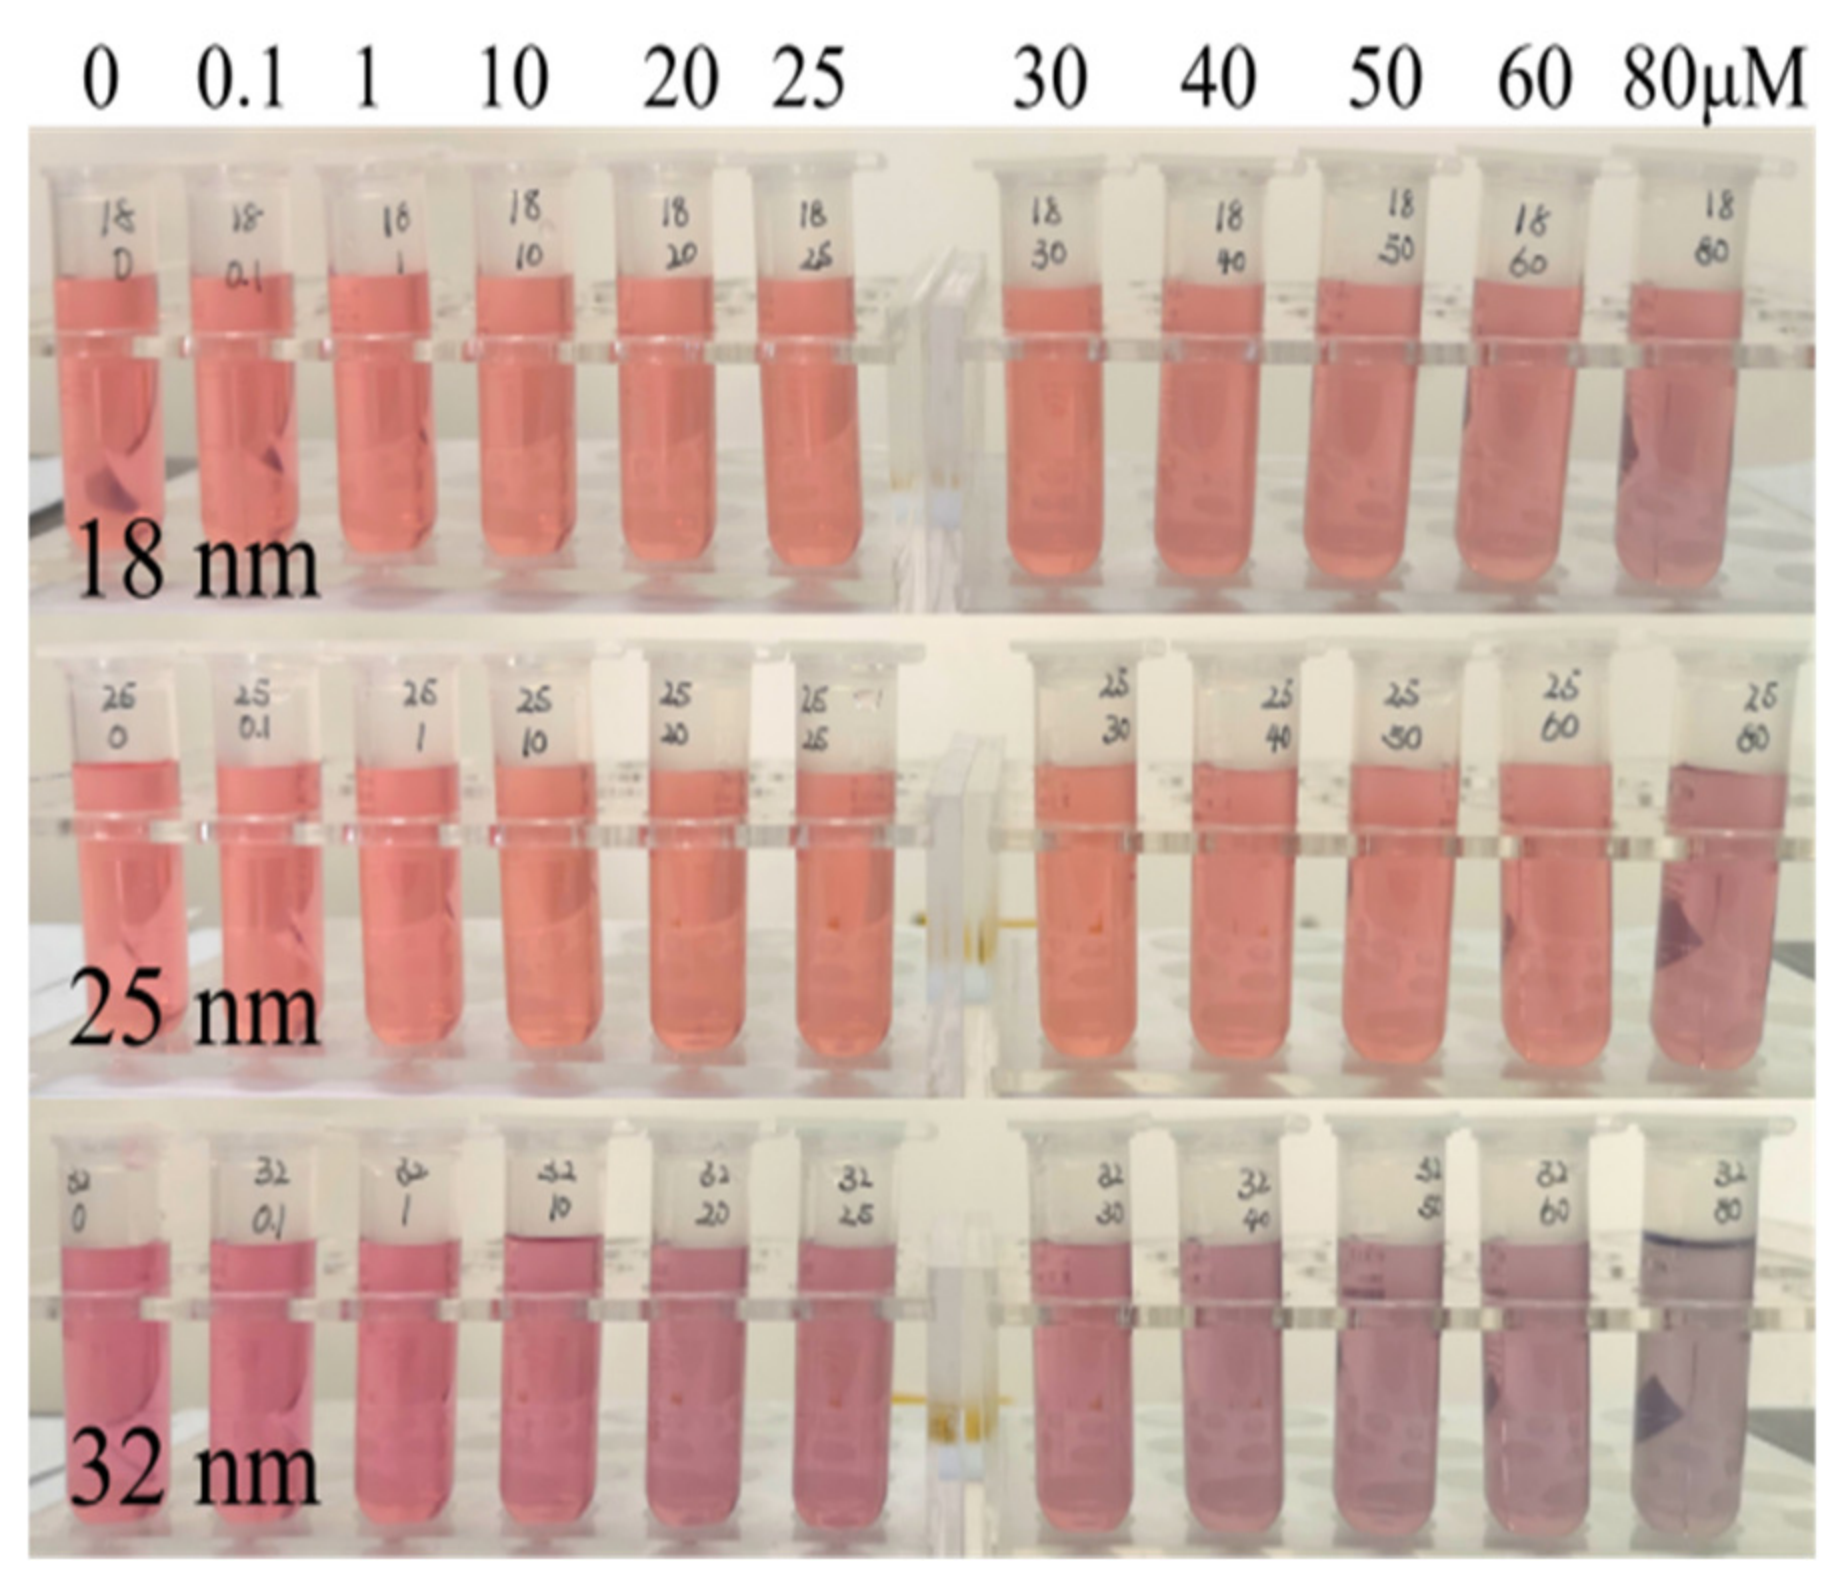
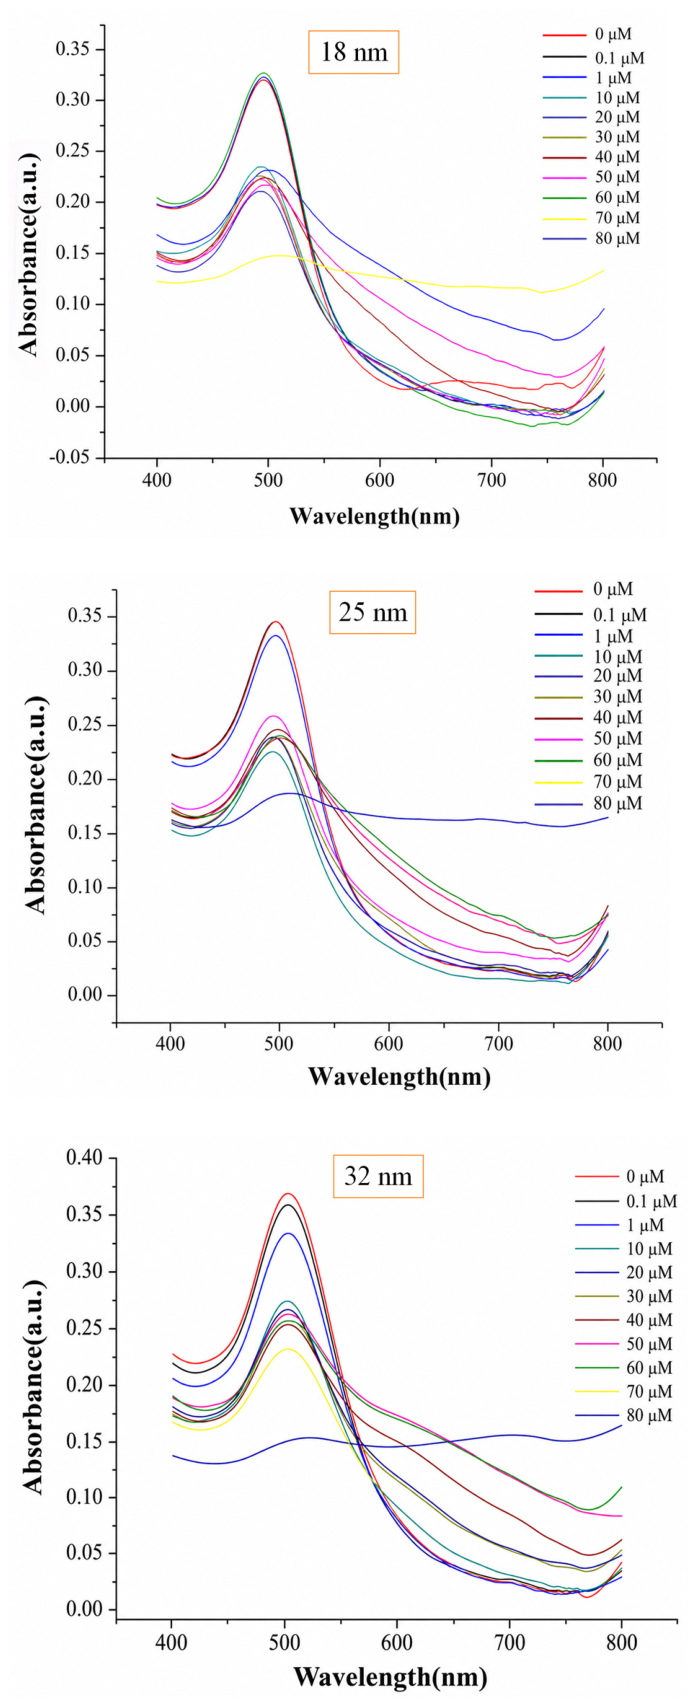
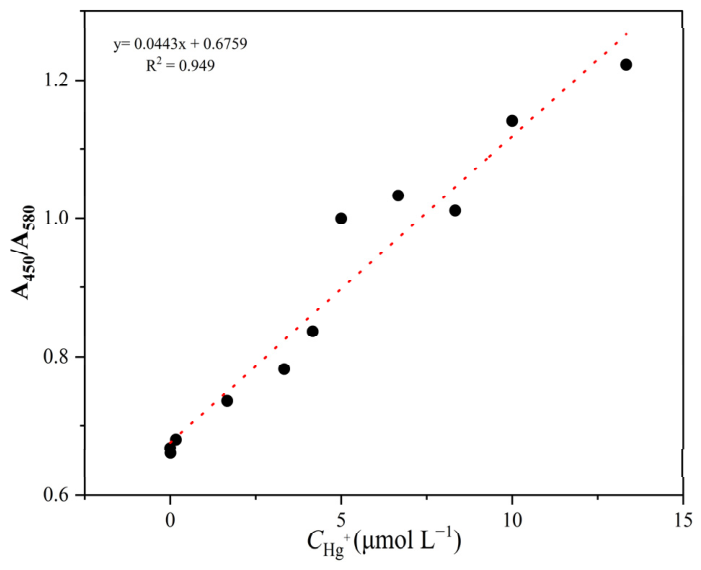
Under different concentrations of Hg2+, the colorimetric results of the detection system are shown in Figure 9. The concentrations in the figure are all pre-dilution concentrations, which correspond to the real Hg2+ concentrations of 0, 0.017, 0.167, 1.67, 3.33, 4.17, 5.00, 6.67, 8.33, 10.00, and 13.33 μmol/L, respectively. When the concentration of Hg2+ in the solution is 5 μmol/L, the color of the solution changes significantly compared to the blank control; that is, the color changes from red and purple to gray–red and gray–purple. Therefore, 5 μmol/L is the visual detection limit of the detection system. The UV–visible spectrophotometer was used to scan in the wavelength range of 400 nm~800 nm, and the spectral results are shown in Figure 10. As shown in Figure 11, the fitting equation of glutarimide-modified AuNPs was y = 0.0443x + 0.6759, q = 0.6759, R2 = 0.949. The minimum detection limit (LOD) was calculated to be 3σ/k according to the calibration curve, which was 2.937 μmol/L. The visual detection limit of the sensor designed in this study was 5 μmol/L, and the minimum detection limits were 2.1682 μmol/L and 2.9374 μmol/L. Compared with the amrinone-modified AuNPs designed by Li et al., the visual detection limit was 0.8 μmol/L, and the minimum detection limit was 18.2 nmol/L; the detection limit advantage was not obvious. However, the advantage of this method is not the absolute minimum LOD, but the simple modifier, low cost, more complete discussion of particle size effect, and suitability for rapid visual detection of Hg2+ in water environments [43].
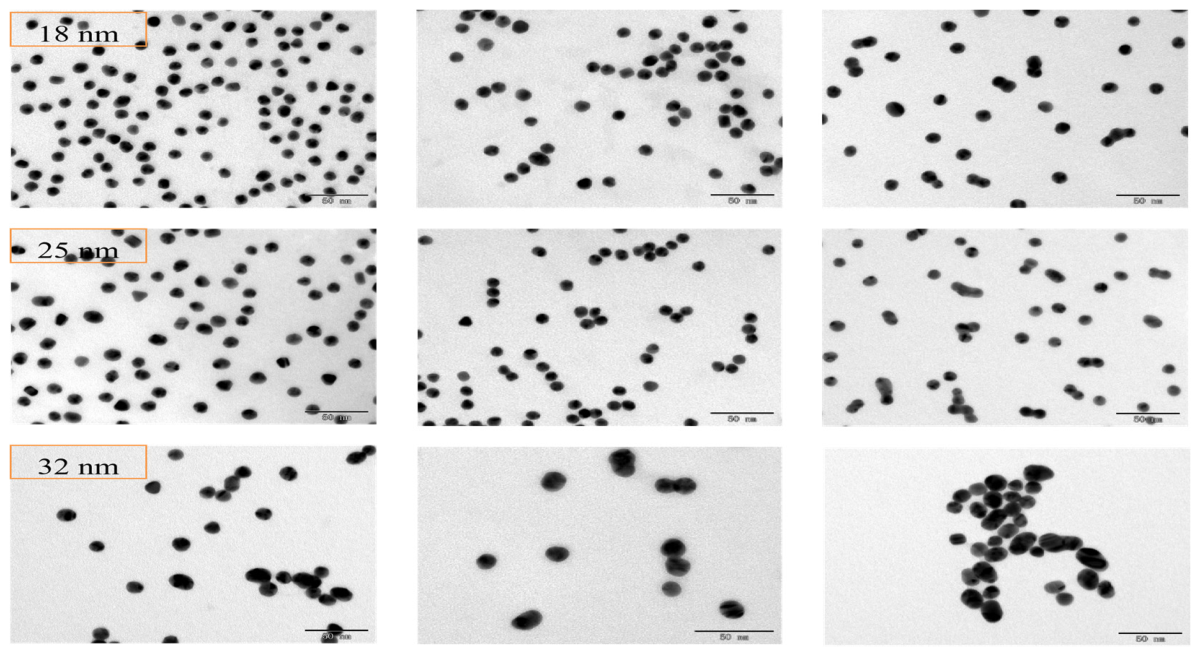
The samples with blank control and obvious color change were selected; that is, 30 μmol/L of Hg2+ AuNPs solution of 30 μmol/L Hg2+ was added, the microscope photograph of which was characterized by transmission electron microscope and laser particle size analyzer, and their detection results were compared with each other, as shown in Figure 12 and Figure 13.
From the Hg2+ detection by UV-Vis spectrophotometry, results show that with the increase in Hg2+ concentration, the peak value of the characteristic absorption peak of surface plasmon resonance near 520 nm decreases gradually, and then the intensity of the absorption peak weakens gradually. AuNPs were also aggregated. When the Hg2+ concentration of the solution is 3.33 μmol/L, the height of the characteristic absorption peak is obviously redshifted, and the intensity is greatly reduced. The aggregation process of the Hg2+ system was further studied, and TEM tests were carried out on three different reaction liquids: AuNPs, AuNPs modified with glutarimide, and AuNPs modified with glutarimide added with Hg2+. Figure 12 illustrates the morphology and dispersion of the synthesized AuNPs. The images reveal that the as-prepared AuNPs are monodisperse with a uniform size distribution. Furthermore, even after functionalization with glutarimide, the AuNPs maintain excellent colloidal stability and dispersion.
The particle size distribution of the above three solutions was measured by a laser particle size analyzer, as shown in Figure 13. It is easy to know that the AuNPs states have a big difference. The 18 nm AuNPs are approximately 18 nm, 25 nm, and 38 nm respectively; the 25 nm AuNPs are approximately 25 nm, 40 nm, and 55 nm respectively; and the 32 nm AuNPs are about 32 nm, 40 nm, and 86 nm, respectively, further proof that Hg2+ can cause the aggregation of glutarimide-modified AuNPs.

3.3.2. Detection of Different Metal Ions

Under the selected experimental conditions, the influence of other common metal ions on the detection system was investigated, and the concentration of various metal ions was selected to be 30 μmol/L. The results of the selectivity study are shown in Figure 14a. Only Hg2+ can transform the color of the AuNP solution, but only Hg2+ can transform the reaction solution of the detection system from red to dark purple. This is because only Hg2+ can combine with glutarimide to form a complex structure, thus narrowing the distance between the AuNP particles, resulting in a change in the color of the reaction solution. However, other metal ions cannot bind to glutarimide to discolor the reaction solution. These results also showed that the detection of Hg2+ by other common metal ions has little effect.
Figure 14b is a characteristic of UV-Vis absorption spectra, showing that all heavy metal ions react differently. The peak intensity of the UV spectrum also has an obvious change. The results show that glutarimide-modified AuNPs (18 nm, 25 nm, 32 nm) can be used to detect all the heavy metal ions studied in this article. Through color change, glutarimide-modified AuNPs are the most selective for mercury ions. Only glutarimide-modified AuNPs, when adding Hg2+, show obvious changes in the spectral absorption curve, and the characteristic peak is greatly redshifted, and the peak intensity decreases dramatically, which is caused by the accumulation of AuNPs. The results show that the detection system of Hg2+ is not affected by other common metal ions. The results also show that the detection system has high selectivity for Hg2+.

3.3.3. Application of Glutarimide-Modified AuNPs in Real Tap Water

The actual effect of this method was further verified. Tap water was used as the medium to prepare Hg2+ solutions with different concentrations. The detection results of the glutarimide-modified AuNP colorimetric method for Hg2+ detection of actual samples are shown in Figure 15.
In Figure 15, compared to the blank (reaction solution with an equal amount of ultrapure water), it was found that the actual sample (tap water) without Hg2+ can not change the color of the AuNP solution, while tap water with a certain concentration of Hg2+ can change the color of the AuNP solution, and the color change also increases with increasing concentration of Hg2+. For the UV-Vis absorption spectra, as the amount of Hg2+ in the real sample increases, the characteristic peak gradually redshifted and the intensity of the peak diminished.

4. Conclusions

In summary, we have developed a highly sensitive and selective colorimetric sensor for Hg2+ on the basis of succinimide- and glutarimide-modified AuNPs. Our investigation into the size-dependent optical properties revealed that 32 nm AuNPs provide the most significant visual contrast and spectral response compared to smaller counterparts (18 nm and 25 nm), a phenomenon well-supported by Mie scattering theory and the enhanced extinction cross-sections of larger particles.
The sensing mechanism was systematically elucidated as a Hg2+-induced aggregation process. According to HSAB theory [54], Hg2+ is generally regarded as a soft Lewis acid and can coordinate with electron-donating groups on organic ligands. The imide groups on the surface of modified AuNPs contain potential nitrogen and oxygen donor atoms, which may provide coordination sites for Hg2+. Similar Hg2+-mediated N-Hg2+-N coordination structures have been reported in T-Hg2+-T base pairs. Therefore, Hg2+ may bridge imide-functionalized AuNPs through coordination interactions, reduce the electrostatic repulsion between particles, and induce AuNP aggregation, leading to plasmon coupling and a visible color change [55,56]. These developed sensors gave nice sensitivity with the LODs of 2.167 μmol/L (succinimide-AuNPs) and 2.937 μmol/L (glutarimide-AuNPs), and high selectivity over other common metal ions.
Furthermore, the practical applicability of these modified AuNPs was demonstrated in tap water samples, highlighting their potential as a robust, cost-effective, and rapid tool for on-site monitoring of mercury contamination in environmental water systems. Moreover, this work not only presents an efficient sensing strategy, but it also give a better understanding of the rational design of nanoparticle-based colorimetric probes after surface modification.
Although the detection limits of the present system are not lower than those of some previously reported AuNP-based sensors, this method offers advantages in terms of simple modifiers, low cost, convenient preparation, clear visual response, and suitability for rapid on-site screening of Hg2+ in aqueous environments. Therefore, this work provides a simple imide-based surface modification strategy for constructing AuNP colorimetric sensors and offers useful information for the rational design of nanoparticle-based visual probes for Hg2+ monitoring.
Future studies using spectroscopic characterization and theoretical calculations are needed to further elucidate the binding mechanism and improve sensor performance. However, this study did not include the measurement of PDI and zeta potential, as well as SEM analysis and XRD analysis. Future work will focus on these analyses to further evaluate the stability of the modified AuNPs and elucidate their interaction mechanism with Hg2+.

Author Contributions

Methodology, Y.K.; writing—original draft preparation, R.W.; formal analysis, R.W.; writing—review and editing, X.C.; validation, X.C.; writing—review and editing, C.S.; data curation, C.S.; supervision, Y.K.; funding acquisition, Y.K. All authors have read and agreed to the published version of the manuscript.

Funding

This work is supported by the National Natural Science Foundation of China (52470100), Jing-Jin-Ji Regional Integrated Environmental Improvement-National Science and Technology Major Project (2026ZD1215400), and the Project of Construction and Support for high-level Innovative Teams of Beijing Municipal Institutions (BPHR20220108).

Institutional Review Board Statement

Not applicable.

Informed Consent Statement

Not applicable.

Data Availability Statement

The original contributions presented in this study are included in the article. Further inquiries can be directed to the corresponding author.

Conflicts of Interest

Author Chuyu Shang was employed by CAUPD (Beijing) Planning & Design Consultants Co., Ltd., Beijing. The remaining authors declare that the research was conducted in the absence of any commercial or financial relationships that could be construed as a potential conflict of interest.

References

  1. Wang, X.M.; Zhao, C.; Fan, J.P.; Zhao, Q.W.; Zhang, X.G.; Zhang, N.; Fang, X.; Pang, H.; Li, W.; Su, X.; et al. Contamination status and health risk assessment of potentially toxic trace elements in soils surrounding rare earth tailings in China: A retrospective review. Ecotoxicol. Environ. Saf. 2025, 298, 118270. [Google Scholar] [CrossRef] [PubMed]
  2. Sharma, S.; Kumar, T.; Das, D.K.; Mittal, A.; Verma, N.; Vashistha, V.K. Phytoremediation of Heavy Metals in Soil—Concepts, Advancements, and Future Directions. J. Soil Sci. Plant Nutr. 2025, 25, 1253–1280. [Google Scholar]
  3. Ahmad, S.; Rabbani, S.; Salma, U.; Khan, S.A. Imidazole Derivatives as ON/OFF Fluorescent Chemosensor to Detect Mercury Ion: A Mini Review. J. Fluoresc. 2025, 35, 11825–11836. [Google Scholar] [CrossRef] [PubMed]
  4. Cong, W.X.; Li, N.; Miao, Y.L.; Huang, Y.X.; Zhao, W.H.; Kang, Y.; Zhang, B.Q.; Wang, J.B.; Zhang, J.Y.; Lv, Y.H. DNA hypomethylation-associated transcriptional rewiring enables resistance to heavy metal mercury (Hg) stress in rice. J. Hazard. Mater. 2024, 461, 132649. [Google Scholar] [PubMed]
  5. Du, H.F.; Shang, J.T.; Tang, H.B.; Wang, S.J.; Li, X. A simple colorimetric sensor for visual detection of Hg (II) ions using functionalized gold nanoparticles modified by 5-(m-aminophenyl) tetrazoles. Inorg. Nano-Met. Chem. 2026, 56, 401–411. [Google Scholar]
  6. Balali-Mood, M.; Naseri, K.; Tahergorabi, Z.; Khazdair, M.R.; Sadeghi, M. Toxic Mechanisms of Five Heavy Metals: Mercury, Lead, Chromium, Cadmium, and Arsenic. Front. Pharmacol. 2021, 12, 643972. [Google Scholar] [CrossRef] [PubMed]
  7. Lim, J.W.; Kim, T.-Y.; Choi, S.-W.; Woo, M.-A. 3D-printed rolling circle amplification chip for on-site colorimetric detection of inorganic mercury in drinking water. Food Chem. 2019, 300, 125177. [Google Scholar] [PubMed]
  8. Wang, M.; Markert, B.; Chen, W.P.; Peng, C.; Ouyang, Z. Identification of heavy metal pollutants using multivariate analysis and effects of land uses on their accumulation in urban soils in Beijing, China. Environ. Monit. Assess. 2012, 184, 5889–5897. [Google Scholar] [PubMed]
  9. Fu, K.X.; Liu, X.; Yu, D.Y.; Luo, J.M.; Wang, Z.W.; Crittenden, J.C. Highly Efficient and Selective Hg(II) Removal from Water Using Multilayered Ti3C2Ox MXene via Adsorption Coupled with Catalytic Reduction Mechanism. Environ. Sci. Technol. 2020, 54, 16212–16220. [Google Scholar] [CrossRef] [PubMed]
  10. Zhu, W.; Li, Z.G.; Li, P.; Sommar, J.; Fu, X.W.; Feng, X.B.; Yu, B.; Zhang, W.; Reis, A.T.; Pereira, E. Legacy Mercury Re-emission and Subsurface Migration at Contaminated Sites Constrained by Hg Isotopes and Chemical Speciation. Environ. Sci. Technol. 2024, 58, 5336–5346. [Google Scholar] [CrossRef] [PubMed]
  11. Jia, L.S.; Dong, W.X.; Lin, G.G.; Guang, Y.Z. Status and environmental management of soil mercury pollution in China: A review. J. Environ. Manag. 2021, 277, 111442. [Google Scholar] [CrossRef] [PubMed]
  12. Fu, Z.Q.; Liu, G.; Wang, L.X. Assessment of potential human health risk of trace element in wild edible mushroom species collected from Yunnan Province, China. Environ. Sci. Pollut. Res. 2020, 27, 29218–29227. [Google Scholar] [CrossRef] [PubMed]
  13. Minervino, A.H.H.; Neto, O.G.N.; Albuquerque, F.E.A.; Albuquerque, K.C.G.D.P.; Assis, F.F.V.D.; Sousa, R.S.; Júnior, R.A.B.; López-Alonso, M.; Miranda, M. Heavy Metal Accumulation in Cattle from Western Pará: Human Health Risk Assessment. Toxics 2025, 13, 740. [Google Scholar] [CrossRef] [PubMed]
  14. Singhato, A.; Rueangsri, N.; Thanaratsotornkun, P.; Boonyingsathit, K.; Sridonpai, P.; Laitip, N.; Ornthai, N.; Judprasong, K. Risk Assessment of Toxic Heavy Metal Exposure in Selected Seafood Species from Thailand. Foods 2025, 14, 3725. [Google Scholar] [CrossRef] [PubMed]
  15. Li, F.; Chao, S.M.; Wang, X.Q.; Hu, Z.M.; Wang, D.M.; Tang, C.Y.; Gong, Z.J.; Zhang, H.; Fan, M.K. AI-Enhanced SERS with Probe Combinations for Concurrent Identification and Quantification of Coexisting Metal Ions in Water. Environ. Sci. Technol. 2025, 59, 17322–17333. [Google Scholar] [PubMed]
  16. Zhao, Z.Y.; Yang, J.N.; Zhao, M.; Zhu, J.X. Mercury waste management in China: Implications on the implementation of the Minamata Convention on Mercury. J. Mater. Cycles Waste Manag. 2023, 25, 2584–2598. [Google Scholar] [CrossRef]
  17. Chen, D.Y.; Lu, L.; Zhang, H.; Lu, B.; Feng, J.L.; Zeng, D. Sensitive Mercury Speciation Analysis in Water by High-Performance Liquid Chromatography-Atomic Fluorescence Spectrometry Coupling with Solid-Phase Extraction. Anal. Sci. 2021, 37, 1235–1240. [Google Scholar] [CrossRef] [PubMed]
  18. Zhang, X.A.; Jiang, Y.J.; Zhu, M.C.; Xu, Y.W.; Wang, D. Electrochemical DNA Sensor for Inorganic Mercury(II) Ion at Attomolar Level in Dairy Product Using Cu(II)-Anchored Metal-Organic Framework as Mimetic Catalyst. Chem. Eng. J. 2019, 383, 123182. [Google Scholar]
  19. Kim, Y.-J.; Kim, Y.S.; Niazi, J.H.; Gu, M.B. Electrochemical aptasensor for tetracycline detection. Bioprocess Biosyst. Eng. 2010, 33, 31–37. [Google Scholar] [PubMed]
  20. Yang, K.; Zhu, R.Q.; Li, Z.P.; Shuang, S.M.; Zhai, Y.; Dong, C. Label-free colorimetric detection of tetracycline using gold nanoparticles with different surface charge. Talanta 2024, 266, 125077. [Google Scholar] [CrossRef] [PubMed]
  21. Zhang, L.S.; Huang, D.S.; Yue, G.Z.; Zhu, J.; Yang, L.J.; Yang, L.M.; Dan, W.H.; Zhao, P.X. Effective colorimetric detection of Ni2+ using gold nanoparticles functionalized with phytate. Chem. Phys. Lett. 2021, 784, 139101. [Google Scholar] [CrossRef]
  22. Li, X.H.; Zhao, C.X.; Lin, L.L. Plasma-based instant synthesis of functionalized gold nanoparticles for colorimetric detection of lead ions. Chem. Eng. Sci. 2022, 260, 117849. [Google Scholar] [CrossRef]
  23. Luo, X.Y.; Zhang, A.; Wu, L.H.; Fu, Y.Z. Rapid Biosynthesis of Highly Active Gold Nanoparticles for Colorimetric Detection of P-Phenylenediamine and P-Nitrophenol Reduction in Wastewater. J. Environ. Chem. Eng. 2024, 12, 112036. [Google Scholar] [CrossRef]
  24. Das, R.; Vecitis, C.D.; Schulze, A.; Cao, B.; Ismail, A.F.; Lu, X.; Chen, J.; Ramakrishna, S. Recent advances in nanomaterials for water protection and monitoring. Chem. Soc. Rev. 2017, 46, 6946–7020. [Google Scholar] [CrossRef] [PubMed]
  25. Chen, H.Y.; Xi, C.Y.; Xu, H.B.; Ye, M.J.; He, Y.; Chen, B.B.; Li, D.W. Reaction-based SERS probes for the detection of Raman-inactive species. ACS Appl. Mater. Interfaces 2024, 16, 67134–67154. [Google Scholar] [CrossRef] [PubMed]
  26. Fu, J.R.; Zhang, H.; Xiang, Z.; Wu, L.Y.; Jin, S.W. Biologically inspired superwetting surface enhanced Raman scattering (SERS) substrates. ACS Appl. Nano Mater. 2024, 7, 23337–23367. [Google Scholar] [CrossRef]
  27. Fang, Y.Z.; Jiang, L.; Zhou, Y.D.; Jin, S.Z. Effect of AuNP Size on Detection of PML/RARA Fusion Gene Using Surface Plasmon Resonance Imaging. Appl. Nano Mater. 2024, 7, 10648–10659. [Google Scholar]
  28. Liu, Y.; Liu, Y.L.; Xu, L.; Li, J.; Liu, X.Y.; Liu, J.S.; Li, G.Y. Highly selective, colorimetric detection of Hg2+ based on three color changes of AuNPs solution from red through sandy beige to celandine green. Sens. Actuators B Chem. 2017, 249, 331–338. [Google Scholar] [CrossRef]
  29. Zheng, Y.J.; Zhong, T.H.; Xu, Y.C.; Chen, L.; Lin, X.H. Rapid Determination of 7-Hydroxycoumarin Using a Nanogold/Poly-thionine Modified Glass Carbon Electrode. Anal. Sci. 2020, 37, 1073–1079. [Google Scholar] [CrossRef] [PubMed]
  30. Ren, L.J.; Ma, S.L.; Li, C.L.; Wang, D.K.; Zhang, P.; Wang, L.L.; Qin, Z.R.; Jiang, L.Y. Development of a highly sensitive ampicillin sensor utilizing functionalized aptamers. Anal. Methods 2024, 16, 3522–3529. [Google Scholar] [CrossRef] [PubMed]
  31. Chen, Z.; Luo, S.; Liu, C.; Cai, Q. Simple and sensitive colorimetric detection of cysteine based on ssDNA-stabilized gold nanoparticles. Anal. Bioanal. Chem. 2009, 395, 489–494. [Google Scholar] [PubMed]
  32. Ziarani, G.M.; Roshankar, S.; Mohajer, F.; Baddiei, A.; Karimi-Maleh, H.; Gaikwad, S.V. Molecular docking and optical sensor studies based on 2,4-diamino pyrimidine-5-carbonitriles for detection of Hg2. Environ. Res. 2022, 212, 113245. [Google Scholar] [CrossRef] [PubMed]
  33. Amari, H.; Guerrouache, M.; Mahouche-Chergui, S.; Abderrahim, R.; Carbonnier, B. 2-Aminothiazole-functionalized triazine-modified polystyrene decorated with gold nanoparticles as composite catalyst for the reduction of 4-nitrophenol. React. Funct. Polym. 2017, 121, 58–66. [Google Scholar] [CrossRef]
  34. Sianglam, P.; Ngamdee, K.; Nalaoh, P.; Promarak, V.; Hunt, A.J.; Ngeontae, W. A simple strategy to enhance the sensitivity of fluorescent sensor-based CdS quantum dots by using a surfactant for Hg2+ detection. Anal. Methods 2021, 13, 4069–4078. [Google Scholar] [CrossRef] [PubMed]
  35. Tombuloglu, H. CRISPR-Cas12a and freezing-functionalized gold nanoparticles (AuNP)-based rapid visual detection of SARS-CoV-2. Microchem. J. 2026, 224, 117842. [Google Scholar]
  36. Duan, Y.F.; Wang, F.; Zhang, X.P.; Liu, Q.; Lu, M.D.; Ji, W.; Zhang, Y.; Jing, Z.G.; Peng, W. TFBG-SPR DNA-biosensor for renewable ultra-trace detection of mercury ions. J. Light. Technol. 2021, 39, 3903–3910. [Google Scholar]
  37. Gao, J.J.; Yang, W.; Liu, R.C.; Feng, J.W.; Li, Y.R.; Jiang, M.S.; Jiang, S.Z. A reliable gold nanoparticle/Cu-TCPP 2D MOF/gold/D-shaped fiber sensor based on SPR and LSPR coupling for dopamine detection. Appl. Surf. Sci. 2024, 655, 159523. [Google Scholar]
  38. Li, Y.X.; Bian, J.; Lin, T.; Zhang, Y.Y.; Liu, X.Y.; Liu, Y. Sensing of mercury and silver ions using branched Au nanoparticles prepared by hyperbranched polyethylenimine fabricated and capped AuNPs seeds. Nanotechnology 2021, 32, 375702. [Google Scholar] [CrossRef] [PubMed]
  39. Alebrahim, M.A.; Ahmad, A.A.; Migdadi, A.; Al-Bataineh, Q.M. Localize surface plasmon resonance of gold nanoparticles and their effect on the polyethylene oxide nanocomposite films. Phys. B Condens. Matter 2024, 679, 415805. [Google Scholar] [CrossRef]
  40. Brown, R. Absorption and scattering of light by small particles. Opt. Acta Int. J. Opt. 1984, 31, 3. [Google Scholar] [CrossRef]
  41. Haiss, W.; Thanh, N.T.; Aveyard, J.; Fernig, D.G. Determination of size and concentration of gold nanoparticles from UV–Vis spectra. Anal. Chem. 2007, 79, 4215–4221. [Google Scholar] [CrossRef] [PubMed]
  42. Link, S.; El-Sayed, M. Size and temperature dependence of the plasmon absorption of colloidal gold nanoparticles. J. Phys. Chem. B 1999, 103, 4212–4217. [Google Scholar] [CrossRef]
  43. Li, G.N.; Liu, L.C.; Liu, X.Y.; Han, J.S.; Hao, T.T.; Wang, C.C.; Sun, J.W.; Du, H.F.; Li, X. Rapid Colorimetric Detection of Heavy Metal Hg2+ in Cosmetics Based on Amrinone-Modified AuNPs Sensor. ChemNanoMat 2023, 9, e202300203. [Google Scholar]
  44. Li, Y.X.; Tang, L.; Zhu, C.X.; Liu, X.Y.; Wang, X.; Liu, Y. Fluorescent and colorimetric assay for determination of Cu (II) and Hg (II) using AuNPs reduced and wrapped by carbon dots. Microchim. Acta 2022, 189, 10. [Google Scholar]
  45. Zhao, Z.H.; Wang, Q. Gold nanoparticles (AuNPs) and graphene oxide heterostructures with gold film coupling for an enhanced sensitivity surface plasmon resonance (SPR) fiber sensor. Instrum. Sci. Technol. 2022, 50, 530–542. [Google Scholar] [CrossRef]
  46. Saputri, F.A.; Zubaidah, E.U.; Kenanga, A.W.P.; Jatmika, C.; Pratiwi, R.; Dhumale, V.A. Development of a colorimetric paper sensor for Hg2+ detection in water using cyanuric acid-conjugated gold nanoparticles. Molecules 2023, 28, 6527. [Google Scholar] [CrossRef] [PubMed]
  47. Suhaidi, N.A.; Halmi, M.I.E.; Rashidi, A.A.; Anuar, M.F.M.; Mahmud, K.; Kusnin, N.; Gani, S.S.A.; Shukor, M.Y.A. Colorimetric detection of mercury (Hg2+) using UV–vis spectroscopy and digital image analysis based on gold nanoparticles functionalized with bromelain enzyme. 3 Biotech 2023, 13, 121. [Google Scholar] [CrossRef] [PubMed]
  48. Ulloa-Gomez, A.M.; Lucas, A.; Koneru, A.; Barui, A.; Stanciu, L. Simultaneous colorimetric and electrochemical detection of trace mercury (Hg2+) using a portable and miniaturized aptasensor. Biosens. Bioelectron. 2023, 221, 114419. [Google Scholar] [PubMed]
  49. Ramachandiran, D.; Rajesh, K. Selective colorimetric and fluorimertic sensor of Hg (II) ion from silver nanoparticles using Acacia chundra leaves extract. Mater. Chem. Phys. 2022, 287, 126284. [Google Scholar] [CrossRef]
  50. Cai, B.; Ren, T.Y.; Yu, X.W.; Lv, W.D.; Liang, Y. Aptamer-functionalized gold nanoparticles for mercury ion detection in a colorimetric assay based on color change time as signal readout. Microchim. Acta 2024, 191, 74. [Google Scholar] [CrossRef] [PubMed]
  51. Obaid, A.; Maslamani, N.; Teqah, A.; Siddiq, H.; Ghubayra, R.; Mousa, I.; Jamil, A.K.M.; Mohamad, S. Colorimetric Sensors for Recognition of Chiral Drugs Using Gold Nanoparticles. Chirality 2025, 37, e70039. [Google Scholar] [CrossRef] [PubMed]
  52. Chai, F.; Wang, C.G.; Wang, T.T.; Ma, Z.F.; Su, Z.G. L-cysteine functionalized gold nanoparticles for the colorimetric detection of Hg2+ induced by ultraviolet light. Nanotechnology 2010, 21, 025501. [Google Scholar] [PubMed]
  53. Zhang, F.; Zeng, L.; Yang, C.; Xin, J.; Wang, H.; Wu, A. A one-step colorimetric method of analysis detection of Hg2+ based on an in situ formation of Au@ HgS core–shell structures. Analyst 2011, 136, 2825–2830. [Google Scholar] [PubMed]
  54. Pearson, R. Hard and soft acids and bases, HSAB, part 1: Fundamental principles. J. Chem. Educ. 1968, 45, 581. [Google Scholar] [CrossRef]
  55. Ono, A.; Togashi, H. Highly selective oligonucleotide-based sensor for mercury (II) in aqueous solutions. Angew. Chem. 2004, 116, 4400–4402. [Google Scholar]
  56. Miyake, Y.; Togashi, H.; Tashiro, M.; Yamaguchi, H.; Oda, S.; Kudo, M.; Tanaka, Y.; Kondo, Y.; Sawa, R.; Fujimoto, T. MercuryII-mediated formation of thymine–HgII–thymine base pairs in DNA duplexes. J. Am. Chem. Soc. 2006, 128, 2172–2173. [Google Scholar] [PubMed]
Figure 1. UV–Vis spectra of AuNPs (18 nm, 25 nm, 32 nm).
Chemosensors 14 00138 g001
Figure 2. Colorimetric images of three different sizes of succinimide-modified AuNPs for the detection of different concentrations of Hg2+.
Chemosensors 14 00138 g002
Figure 3. Changes in UV-Vis absorption spectra of AuNPs modified with succinimide for the detection of different concentrations of Hg2+.
Chemosensors 14 00138 g003
Figure 4. The linear calibration curve of the relative absorbance ratio (A458/A625) of succinimide-modified AuNPs with Hg2+ concentration.
Chemosensors 14 00138 g004
Figure 5. TEM images of three kinds of AuNPs with different particle sizes.
Chemosensors 14 00138 g005
Figure 6. Particle size distribution of three kinds of AuNPs with different particle sizes.
Chemosensors 14 00138 g006
Figure 7. Colorimetric diagram (a) and UV-Vis absorption spectra (b) of AuNPs modified with succinimide of three different particle sizes for detection of different metal ions. The concentration of various metal ions is 30 μmol/L.
Chemosensors 14 00138 g007
Figure 8. Colorimetric diagram of the actual sample (tap water) of AuNPs modified with succinimide of three different particle sizes (a) and ultraviolet–visible absorption spectra (b).
Chemosensors 14 00138 g008
Figure 9. Colorimetric images of three different sizes of glutarimide-modified AuNPs for the detection of different concentrations of Hg2+.
Chemosensors 14 00138 g009
Figure 10. Variation in UV-Vis absorption spectra of different concentrations of Hg2+ detected by glutarimide-modified AuNPs.
Chemosensors 14 00138 g010
Figure 11. The linear calibration curve of the relative absorbance ratio (A450/A580) of glutarimide-modified AuNPs with Hg2+ concentration.
Chemosensors 14 00138 g011
Figure 12. TEM images of three kinds of AuNPs with different particle sizes.
Chemosensors 14 00138 g012
Figure 13. Particle size distribution of three kinds of AuNPs with different particle sizes.
Chemosensors 14 00138 g013
Figure 14. Colorimetric diagram of detection of different metal ions by AuNPs modified by glutarimide with three different particle sizes (a) and ultraviolet–visible absorption spectra (b). The concentration of various metal ions is 30 μmol/L.
Chemosensors 14 00138 g014aChemosensors 14 00138 g014b
Figure 15. Colorimetric diagram of the actual sample (tap water) of AuNPs modified with three different particle sizes (a) and ultraviolet–visible absorption spectra (b).
Chemosensors 14 00138 g015
Disclaimer/Publisher’s Note: The statements, opinions and data contained in all publications are solely those of the individual author(s) and contributor(s) and not of MDPI and/or the editor(s). MDPI and/or the editor(s) disclaim responsibility for any injury to people or property resulting from any ideas, methods, instructions or products referred to in the content.