Article

Diffuse Reflectance Infrared Spectroscopic Characterization of the Soft Stone of the Berici Hills (Vicenza, Italy) and Classification of Its Main Varieties Using Multivariate Analysis


by
Alessandra De Lorenzi Pezzolo
*,
Paolo Stoppa
and
Andrea Pietropolli Charmet
Department of Molecular Sciences and Nanosystems, Ca’ Foscari University of Venice, Via Torino 155, I-30170 Mestre, Venice, Italy
*
Author to whom correspondence should be addressed.
Chemosensors 2026, 14(6), 130; https://doi.org/10.3390/chemosensors14060130
Submission received: 30 April 2026 / Revised: 1 June 2026 / Accepted: 2 June 2026 / Published: 4 June 2026
(This article belongs to the Special Issue Advanced Chemometric Methods for Analytical Applications)

Abstract

In this work, the Diffuse Reflectance Infrared Fourier Transform (DRIFT) spectra of 30 specimens of Soft Stone of the Berici Hills (Vicenza, Italy) are analyzed by multivariate tools to characterize their different varieties. This calcareous material shows different characteristics regarding colour, hardness, and type and quantity of included fossils that led to various denominations and classifications. By performing a Principal Component Analysis in the 900–1220 cm−1 spectral range, four main groups could be identified in the dataset investigated: Oligocene stones (White and Coloured Vicenza) and Eocene ones (Yellow and Grey Nanto-like, and Nanto p.d.). The spectral features due to the non-carbonate content of the samples (in particular those of quartz, montmorillonite, kaolinite and sanidine) are discussed and employed to characterize the different groups. An appropriate characterization of the three most represented groups is then proposed by means of a Soft Independent Modelling of Class Analogy (SIMCA). This model also proved useful to get information on the samples left out (the Nanto p.d. sample and the five with hybrid characteristics, Grigio Alpi and Pietra del Mare).

1. Introduction

The soft calcareous stones quarried in the Berici Hills district (located near Vicenza, in north-eastern Italy), commonly referred to as Pietra di Vicenza or Pietra di Nanto, have been widely employed since ancient times for architectural, sculptural and decorative purposes. Their use became particularly renowned during the Renaissance through the works of Andrea Palladio, who extensively employed these materials in some of the most representative architectural landmarks in the Veneto region. Owing to their workability, esthetic qualities and local availability, these stones have continued to be exploited up to the present day both in restoration activities and in contemporary architectural and ornamental applications (for more information, see the Historical Background file in the Supplementary Materials).
The Soft Stones of the Berici Hills are bio-calcarenitic materials characterized by considerable heterogeneity in terms of colour, texture, porosity, hardness and fossil content. Their colour ranges from off-white to yellow and grey shades, while their texture may include both microfossils and larger bioclasts that contribute to the ornamental appearance of the material. These lithotypes are associated with two geological formations of different ages: the Calcari Nummulitici (Middle Eocene) and the Calcareniti di Castelgomberto (Oligocene) [1,2,3]. The differences in depositional environment and sedimentological evolution are reflected in the compositional and macroscopic variability observed among the stones.
Due to the long-standing tradition of the use of this material, numerous traditional names designate its different varieties. The nomenclature often reflects the precise geographical provenance or the colour of the stone; alternatively, names rely on a combination of both criteria or are strictly commercial branding terms. A systematic classification based on geological criteria was proposed by Cattaneo et al. [1], distinguishing between Pietra di Vicenza and Pietra di tipo Nanto according to their geological origin. The Oligocene stones were named Pietra di Vicenza, whereas the Eocene ones were Pietra di Tipo Nanto (Nanto-like Stones), with the further indication of Pietra di Nanto p.d. (p.d. standing for “propriamente detta” or “in strict sense”) reserved for stones quarried in the neighbourhood of the homonymous village. More recently Benchiarin [4] focussed primarily on the stone colour, introducing the three main groups of White, Yellow and Grey Vicenza Stone, with additional subdivisions taking into account their geographic origin: White Vicenza Stones comprise the two San Gottardo and Costozza varieties, whereas the subgroups Nanto and Yellow San Germano make up the Yellow Vicenza Stones; the denomination Grey San Germano Stone was also proposed as a synonym for Grey Vicenza Stone. In this paper, building on our previous studies on this material, we adopt the classification proposed by Cattaneo et al., partially integrating it with the colour-based approach outlined by Benchiarin (see below). The present analysis expands upon earlier investigations, including preliminary studies based on a subset (20 out of 30) of the samples considered here [5,6], as well as previous [7,8,9] and ongoing thesis work.
The characterization of this material is based on mineralogical and petrographic analyses traditionally employed in the study of carbonate materials (using a polarized light microscope, SEM, TEM, etc.) [10,11,12,13], sometimes combined with dating methods such as fossil inclusion studies [3,4,14,15,16,17,18,19,20,21,22,23,24]. Investigations aiming to determine its composition are mainly carried out with techniques such as X-ray diffractometry (often after elimination of the carbonate component through acid attack by diluted hydrochloric acid) [1,3,4,19,20,25]. Spectroscopic analyses reported in the literature mainly concern the identification of the products of degradation either in materials exposed to pollution or with traces of original superficial finishes and/or previous restorations [20,26,27], falling short of addressing the direct spectroscopic characterization of quarried materials. In this respect, infrared spectroscopy represents an attractive analytical approach because it requires only small amounts of material, involves minimal sample preparation and allows rapid acquisition of compositional information (e.g., [28,29,30]), especially when coupled with chemometric tools (some examples of application to geomaterials can be found in [31,32,33,34]).
In this paper, the characterization of the quarried material was carried out through DRIFTS (Diffuse Reflectance Infrared Fourier Transform Spectroscopy), exploiting a qualitative analysis of X-Ray Diffraction (XRD) patterns to assist in the spectral interpretation. Our long-term goal is to develop and test a fast method for the identification of the main varieties of Soft Stones from the Berici Hills through an analysis focused on a spectral region of the IR spectrum obtained from a small quantity of untreated sample where the contributions of accessory minerals are most evident. Within this framework, the present work combines experimental work and chemometric analysis (rooted in Principal Component Analysis, PCA, and Soft Independent Modelling of Class Analogy, SIMCA) to evaluate the possibility of classifying the main lithotypes in the current database. If suitably expanded to encompass a wider range of lithotypes, this model could be upgraded for a discriminant analysis [35,36,37,38], offering a methodology potentially useful for provenance studies, material identification, and cultural heritage applications through a rapid and minimally destructive analytical approach. A possible shortcoming is its application to stones which have undergone gypsum formation [26,39,40]. The exposure of calcium carbonate to sulfuric acid leads to the formation of calcium sulphate dihydrate, whose most intense absorption bands fall in the spectral range of interest proposed in this paper; work is currently under way to identify the different stone varieties in gypsificated specimens, exploiting alternative spectral ranges.

2. Materials and Methods

Thirty stone specimens were analyzed and discussed in this paper; seventeen are of Oligocene origin, seven of which come from active quarries (Badia, Monte Bernardo, Gazzo, Pederiva, Strenghe), eight were collected in inactive quarries (in Costozza and Arcugnano), and two are from unknown quarries in the Zovencedo and Montecchio areas. The Eocene group is also represented by thirteen samples, one of Pietra di Nanto p.d. coming from an unknown, but certainly inactive quarry (none is active nowadays in the area), and the others from three active quarries (Acque, Cengelle, Scioso). Details of the provenance and further characteristics of the specimens can be found in Table S1 of the Supplementary Material, together with the approximate locations where the investigated samples come from (Figure S1).
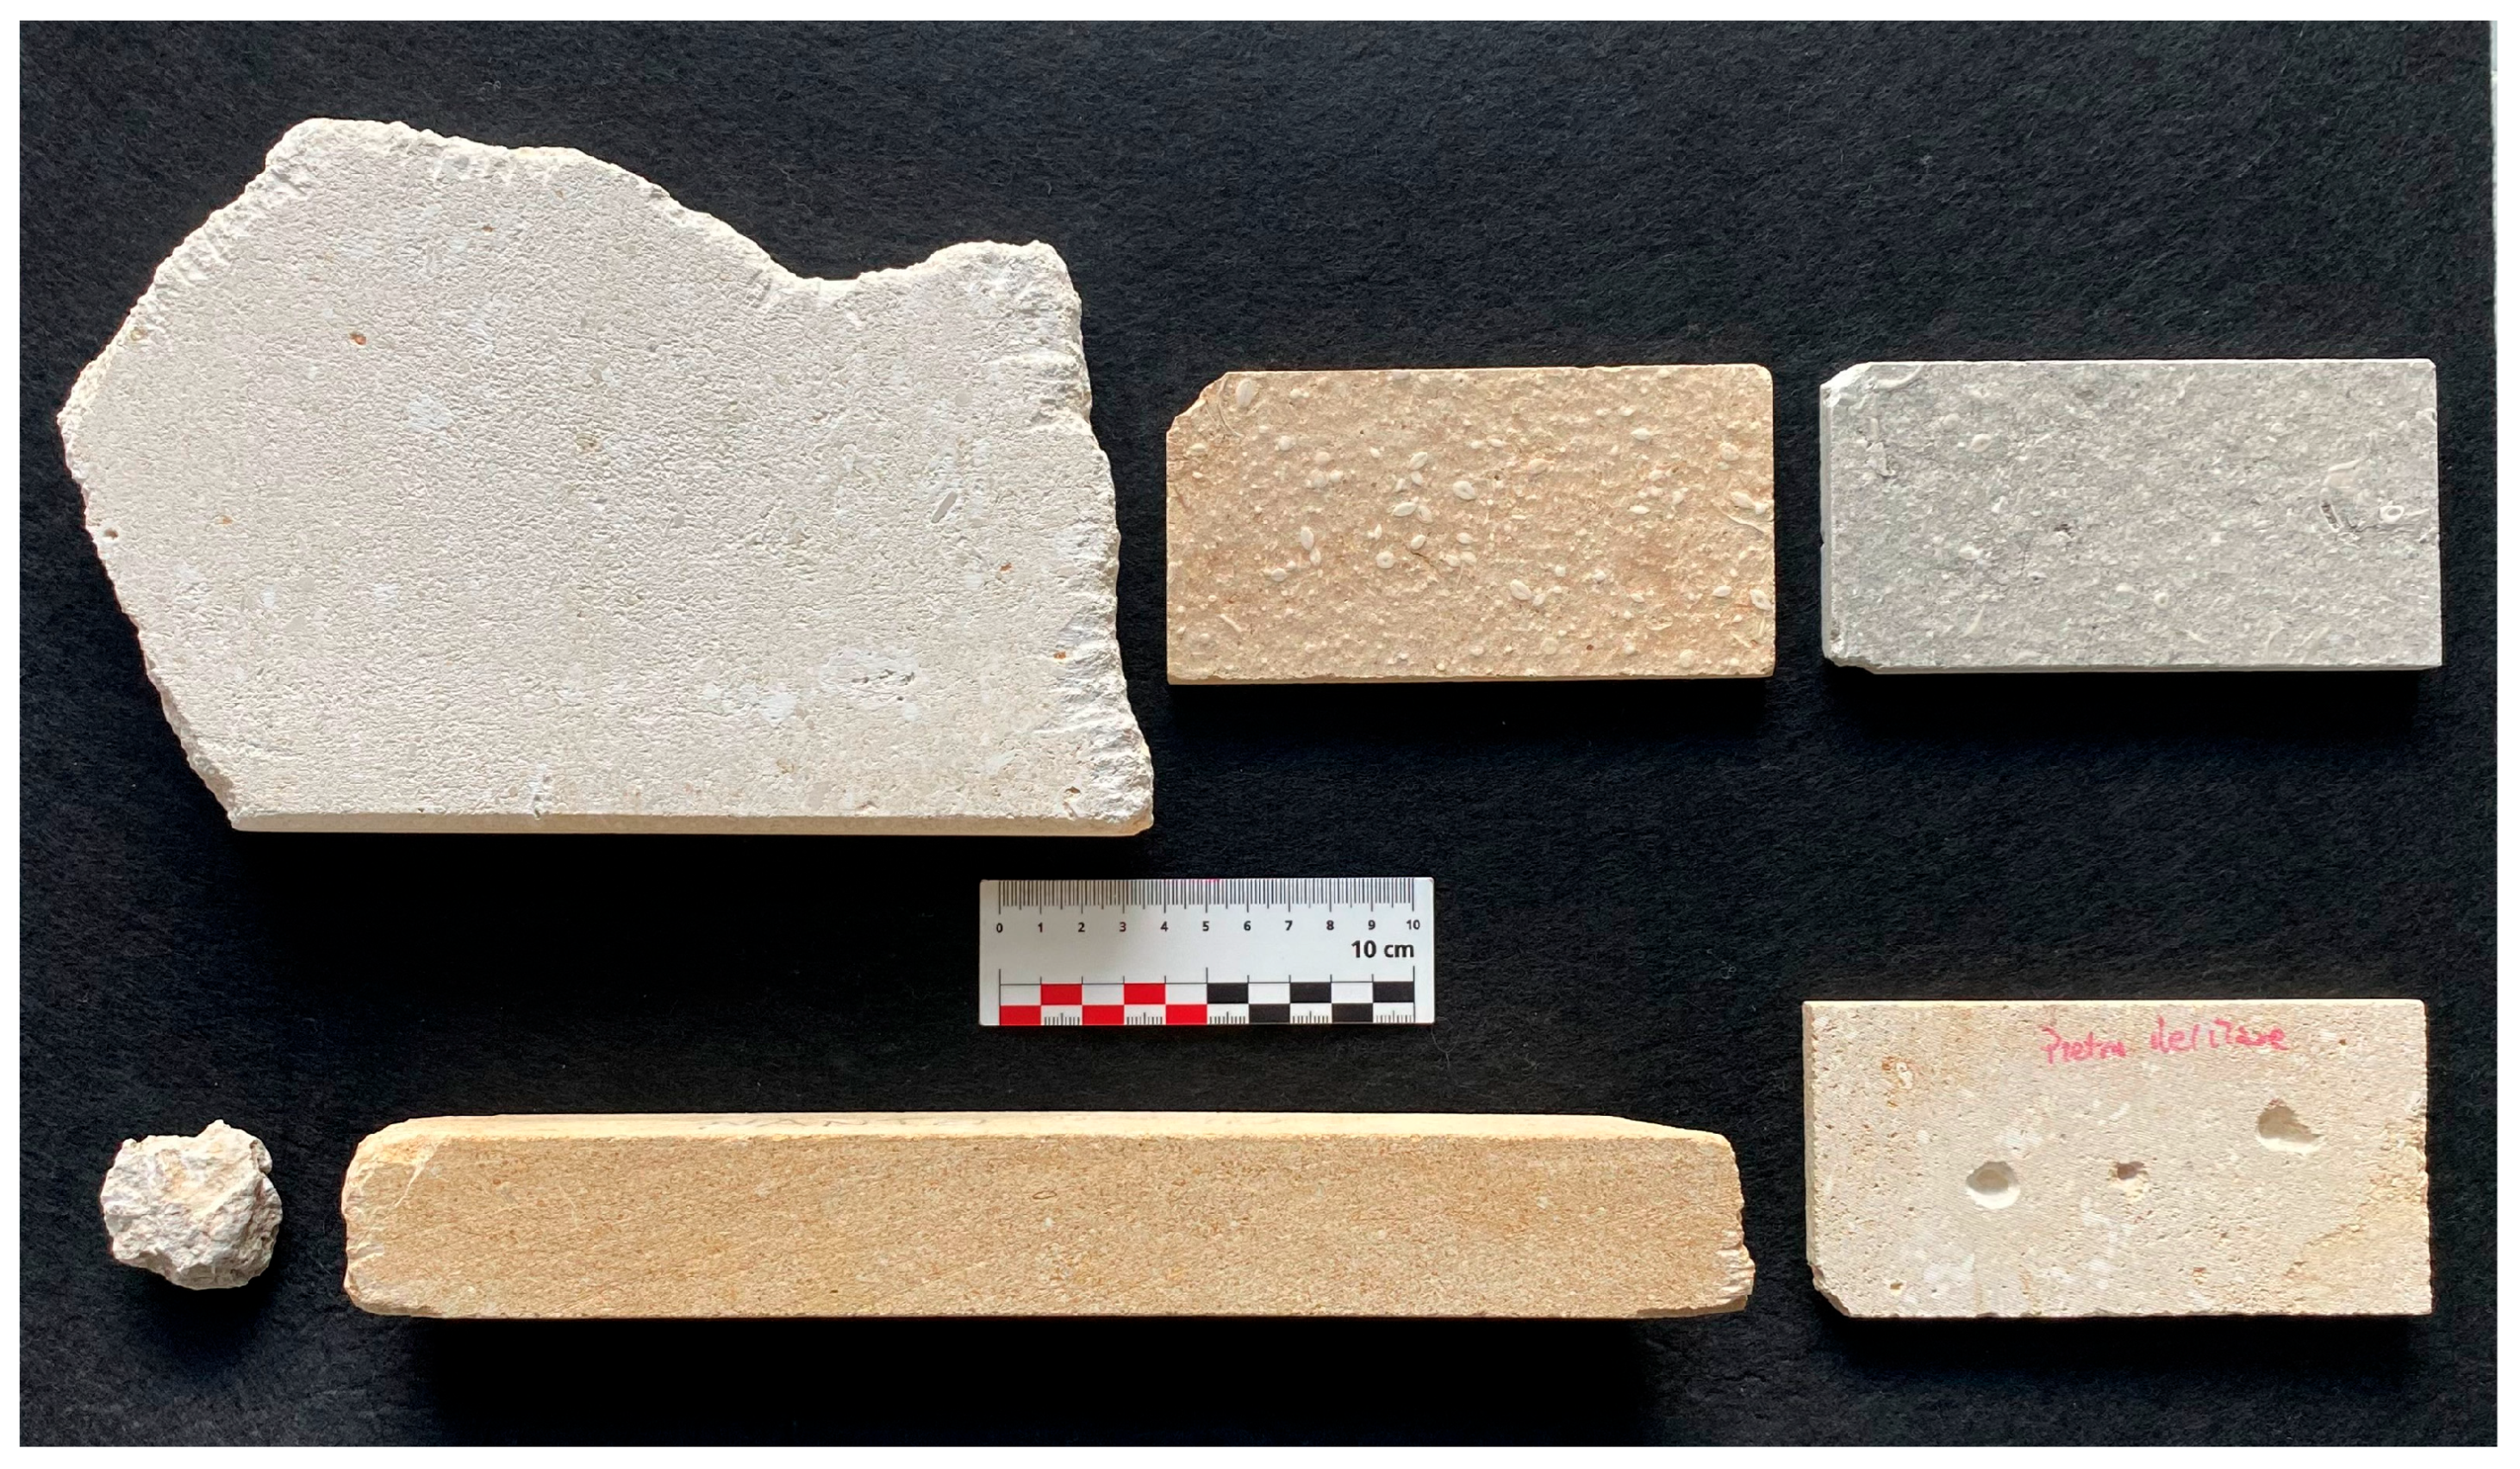
In Figure 1, some representative stone samples are shown, illustrating the differences in colour and texture of this material.
In Table 1, the possible classifications according to the criteria illustrated above are presented. It should be remarked that the Grigio Alpi and Pietra del Mare varieties present peculiar characteristics, as confirmed by the producer’s technical data sheets, where they are classified as biosparrudites rather than biocalcarenites (as is the case of Bianco Avorio, Giallo Dorato, and Grigio Argento varieties) [41]. According to Folk’s classification, this implies that their framework is bound by a crystalline cement (sparite) instead of a microcrystalline carbonate mud (micrite), a microstructural difference directly reflected in their superior mechanical properties. Furthermore, both varieties exhibit a cross-boundary transitional behaviour between the Eocene and Oligocene. Pietra del Mare (Eocene) displays Oligocene traits, characterized by a skeletal framework rich in bryozoans typical of the subsequent Oligocene biofacies, while Grigio Alpi (Oligocene) retains Eocene physical and textural features exhibiting a higher bulk density, a lower open porosity and an abundance of large-scale bioclasts [41]. Accordingly, these two stone varieties are considered “hybrid” (henceforward labelled hy) instead of being included in one of the proposed stone groups: White Vicenza (labelled WV), Coloured Vicenza (CV), Yellow Nanto-Like (yNL), Grey Nanto-Like (gNL) and Nanto p.d. (NN).
Since visually the Vicenza stone appears as an extremely heterogeneous material, to ensure that the analyzed portion is representative of the whole specimen, the sampling was performed (either by hand using a scalpel or by means of an electric drill) in three different spots of each stone, as can be seen in Figure 1 showing the three sampling spots of the pdm2 sample (bottom row, third specimen).
The obtained powders were then ground, when necessary, through a 15 min cycle in a Specac mod. Specamill vibrating mill, in an agate vial with three agate grinding balls. Careful cleaning of the grinding accessories was performed after each preparation. All powders were kept overnight in an oven at about 120 °C and stored in a desiccator whenever possible to avoid possible interferences from water absorption lines.
The stone powders were diluted at approximately 4 wt% in spectroscopic grade potassium bromide (Sigma-Aldrich, St. Louis, MO, USA) using a Kern balance (1 mg sensitivity) and subjected to a 10 min vibrating mill mixing cycle (Specamill, Specac, Orpington, UK); this sample concentration was chosen to remain within the linear proportionality range of the carbonate signal intensity and, at the same time, to ensure the presence of sufficient non-carbonate material to allow its absorptions to be observed in the spectra. The homogenized mixtures were finally poured into mini-cup stainless steel sample holders (4.70 mm diameter, 1.6 mm depth) to be put in the DRIFTS unit together with a pure KBr powder sample to be used as a reference. An Optik Vertex 70 spectrometer (Bruker, Billerica, MA, USA) equipped with a DiffusIR accessory (Pike Technologies, Madison, WI, USA), was employed to record the DRIFT spectra from the sample and the KBr reference. All the spectra reported in the present work were obtained in the 400–4000 cm−1 range with a nominal resolution of 4 cm−1 by averaging 500 scans and performing a Norton-Beer (medium) apodization before Fourier transformation. After the acquisition, the spectra were subjected to the Atmospheric Compensation and 200-pts Baseline Rubberband Correction routines of the Bruker OPUS software (vers. 7.5). The corrected spectra were subsequently normalized with respect to the maximum value of the ν4 calcite band at about 713 cm−1 to take into account possible fluctuations since spectral intensities in DRIFTS are reported to depend also on the sample packing and the orientation of the surface particles [42]. Such a procedure allowed for an increase in the representativity of the spectra, considerably reducing the fluctuations in the intensity values as witnessed by the lower values of the cumulative standard deviation of the averaged spectra with respect to the single ones (in the example shown in Figure S3 of the Supplementary Material for the gid1 sample of Figure 2a below, such values are 296.4 and 145.8, respectively).
Powder X-Ray Diffraction patterns were collected on the ground stones in the 5° < 2θ < 140° range using an Empyrean diffractometer (Malvern Panalytical, Malvern, UK) in Bragg–Brentano reflection geometry, with CuKα radiation (λ = 1.54056 Å) operating at 40 kV and 40 mA, step 0.026°, integration time of 0.497 s/step, slit width of 0.19 mm and a PIXcel 3D detector (Malvern Panalytical, Malvern, UK). The qualitative analysis of the diffraction data was carried out with the support of the standard patterns reported in the ICDD database files and data available in the literature.

3. Results

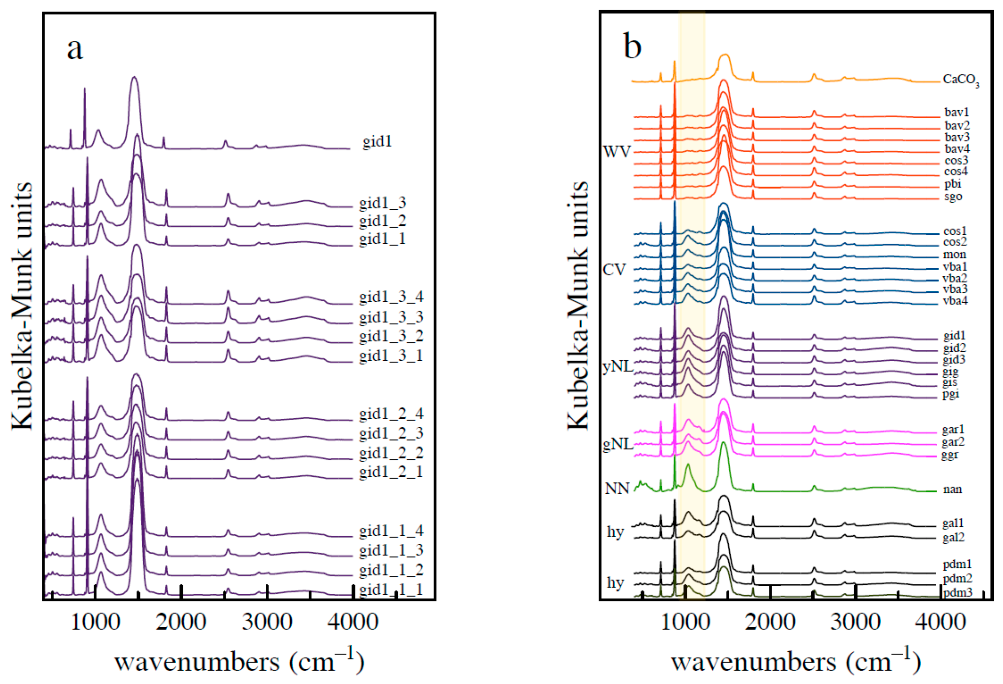
To attain a greater representativeness in the spectra of the stones, four spectra for each of the three samplings performed on the specimens were recorded, as can be seen in Figure 2a for the gid_1 sample chosen as an example (bottom). The averages on the four replicates are depicted in the middle section of the same figure, whereas the top profile is the overall average spectrum of the sample.
Figure 2. DRIFT spectra of the Vicenza Soft Stones (400–4000 cm−1 spectral range, 4 cm−1 resolution, 500 acquisition scans). All the spectra have been vertically shifted for clarity: (a) Example of the data from specimen gid1: the four replicas from each of the three samplings normalized to the calcite ν4 band at 713 cm−1 (bottom); the average spectra from each sampling (middle); the overall average spectrum for the specimen (top); (b) The overall average spectra of all the stone specimens (WV—red; CV—blue; yNL—purple; gNL—pink; NN—green; hy—black) and one from calcium carbonate (orange) for comparison. The spectral portion employed in the discussion is highlighted in light yellow.
Chemosensors 14 00130 g002

4. Discussion

In Figure 2b, the overall average spectra obtained for all the stone samples are shown together with the spectrum from a sample of pure calcium carbonate (Carlo Erba, 98.5%) for comparison (top). The spectrum of the latter presents three fundamental bands due to the C-O doubly degenerate in-plane bending mode (ν4 band at about 713 cm−1), the C-O out-of-plane bending mode (ν2 band at about 878 cm−1), and the C-O antisymmetric stretching mode (ν3 band at about 1440 cm−1) characteristic of the calcite trigonal crystalline unit [43,44]. Additional absorptions can be seen at higher wavenumbers, namely the ν1 + ν4 and 2ν2 + ν4 combination bands at about 1800 and 2515 cm−1 and the 2ν3 overtone at about 2875 cm−1 [45]. In the stone spectra, as expected, all the calcite bands can be easily recognized; however, it is evident that additional features are present as well, which are to be attributed to the non-carbonate species contained in the samples in variable proportions, with spectral intensities weaker for the WV and CV species as compared to the yNL, gNL, hy and NN species. According to Cattaneo et al., in the Pietra di Vicenza samples, the residual fraction after acid attack (2% hydrochloric acid) amounts to 0.2–1.0% [1], while in the White S. Gottardo and Costozza samples investigated by Benchiarin, the insoluble fraction (8% HCl) falls in the 0.5–0.6 and 0.7–2.1% range, respectively [4]. The values found in the Pietra di tipo Nanto samples of [1], conversely, show residuals amounting to 0.6–7.6%, with maximum values for the three Pietra di Nanto p.d. samples investigated that score 12.1, 14.1 and 15.7%. The Yellow and Grey S. Germano samples analyzed by Benchiarin show values in the 6.2–8.5% range [4], whereas for the Yellow Nanto ones, the reported values are 11.5, 11.8 and 12.5 [3,4].
As for the composition of the insoluble fraction, quartz is found in the literature as the main constituent in all the stone varieties. Additionally, in the Pietra di Vicenza samples, Cattaneo et al. found goethite in all but one of the samples investigated [1], while in the White Vicenza analyzed in [4], quartz turned out to be always associated with K-feldspars. According to Cattaneo et al. the latter are present in most of the Pietra di Nanto samples investigated, accompanied in accessory amounts by goethite, glauconite, and in one sample pyrite [1]; on the other hand, Benchiarin found K-feldspars and goethite in all the Yellow and Grey Vicenza samples and pyrite and glauconite in both Grey Vicenza samples [4], while in the Yellow Nanto ones the additional minerals identified were goethite, with K-feldspars and traces of montmorillonites in two out of the three samples analyzed [3,4].
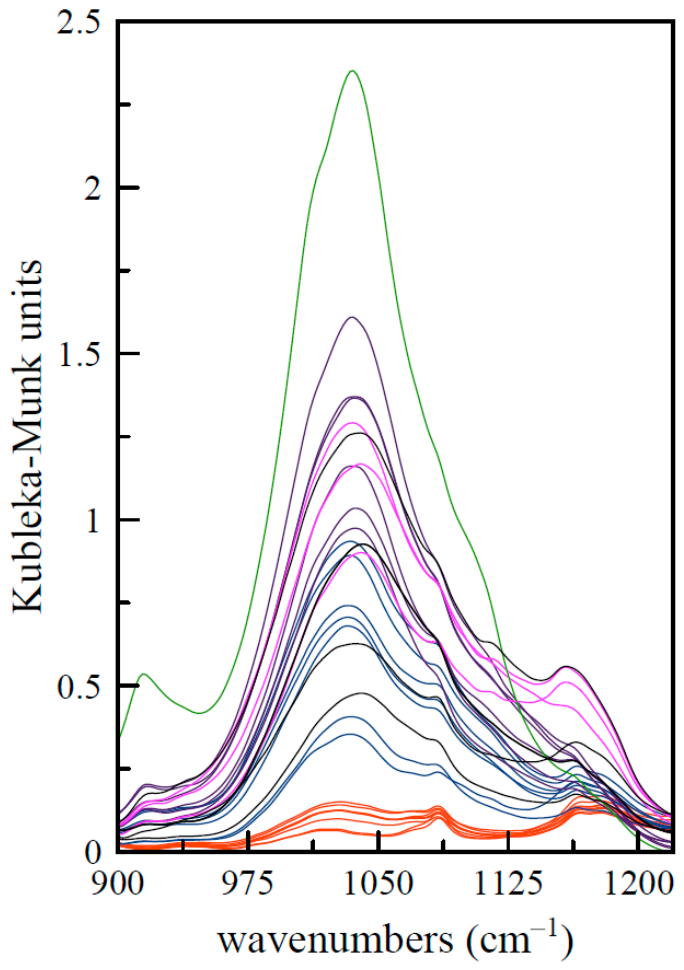
These non-carbonate contributions are particularly intense in the 900–1220 cm−1 range of the spectra (highlighted in yellow in Figure 2b). A closer inspection reveals differences in both intensity and band shape, which appear to be related to the main stone varieties, as further illustrated in Figure 3.
The strong differences in the spectral profiles that can be appreciated in Figure 3 suggest the possibility of discriminating among the proposed stone varieties according to the different extent of the non-carbonate contributions to their spectra. A rough quantitative estimate can be obtained by comparing the integrated intensity of the non-carbonate signal to the area of a peak characteristic of calcite, such as the ν2 band at about 878 cm−1. The integrals were computed for all 360 spectra employing the A-baseline Integration routine of the OPUS software in the 900–1220 and 856–955 cm−1 spectral ranges. The averages of the values obtained for each spectrum, multiplied for clarity by a factor of 100, are collected in Table 2 together with the corresponding errors (statistical error on 12 values).
As can be seen from the data in Table 2, the White Vicenza stone group presents the lowest values of the index, falling in the 44–79 range with a mean value of 59; 108–329 with a mean of 229 are the values found for the samples of the Coloured Vicenza group. The averaged value of 564 is the highest of all the indices, found for the Nanto p.d. sample, while the Nanto-like samples (of both colours) have an intermediate value in the 279–498 range, with a mean of 402. The Grigio Alpi samples present index values of 490 and 274, quite different but overall comparable to those of the Nanto-like group, whereas the indices found for the Pietra del Mare samples are closer to the Coloured Vicenza ones, being equal to 157, 305 and 224 (average 229). A visual representation of the trend of the indices is included in the Supplementary Material (Figure S2).
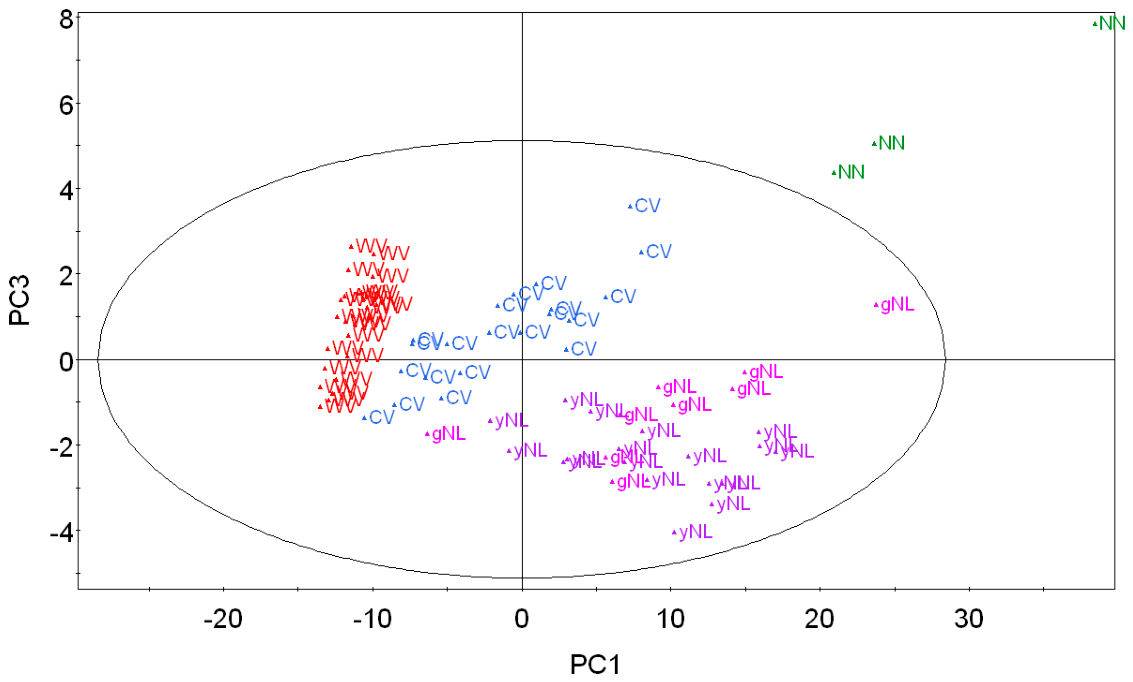
Since it is evident that the classification of the different varieties of Soft Stone allowed by the evaluation of the index based on the silicate/carbonate ratio is quite rough and does not always allow an unambiguous identification, a chemometric approach is then proposed, focusing on the non-carbonate spectral range or rather on the interval where calcite presents very weak absorptions since a preliminary analysis on the whole spectral range did not lead to promising results for what concerns the discrimination among the different stone varieties (see Figures S4 and S5, and Table S2 in the Supplementary Material). Thus, excluding the hy samples that in the PCA did not exhibit a distinctive behaviour (as shown in Figure S6 of the Supplementary Material) and that will be addressed later, a PCA was performed on the 75 average spectra obtained from the 25 stone specimens of the WV, CV, yNL, gNL and NN varieties in the 900–1220 cm−1 range (167 variables) using the Umetrics AB Simca-p software, vers. 8.0 (Sartorius, Göttingen, Germany). The data were pre-processed using unit variance scaling and mean centring to standardize the influence of variables; other pre-processing steps such as smoothing, denoising or outlier removal were not considered necessary with the present dataset. The first four PCs accounted for 99.1% of the total variance (77.5, 18.3, 2.5 and 0.8%, respectively). The best combination of projections along the principal components and spectral interpretation of the corresponding loading plots is found for the PC3 vs PC1 score plot, shown in Figure 4.
Figure 4 allows to appreciate that three varieties of the samples, namely WV, CV and NN, fall indeed in different portions of the plane considered, whereas the representative points of the Yellow and Grey Nanto-Like samples (purple for the yellow stones and pink for the grey ones) do not show a pattern related to the colour of the stone, so hereafter the two subgroups will be referred to generically as Nanto-Like (NL).
The model fitness and predictability were checked through the calculation of the two cumulative parameters, R2 and Q2. The first one is related to the goodness of the fit and measures the total dataset variance explained by using 100% of the data. The second one is related to the goodness of prediction and measures the ability of the model to predict unseen data—via a 7-fold cross-validation procedure where the dataset is iteratively partitioned into seven subsets, leaving one subset out at a time to be predicted by the model built on the remaining six. Along the fit, their difference was small and decreased (0.012, 0.007, 0.005 and 0.003); no further PCs were added to the analysis, since the consistency check showed for PC5 a trend inversion (from 0.003 to 0.007).
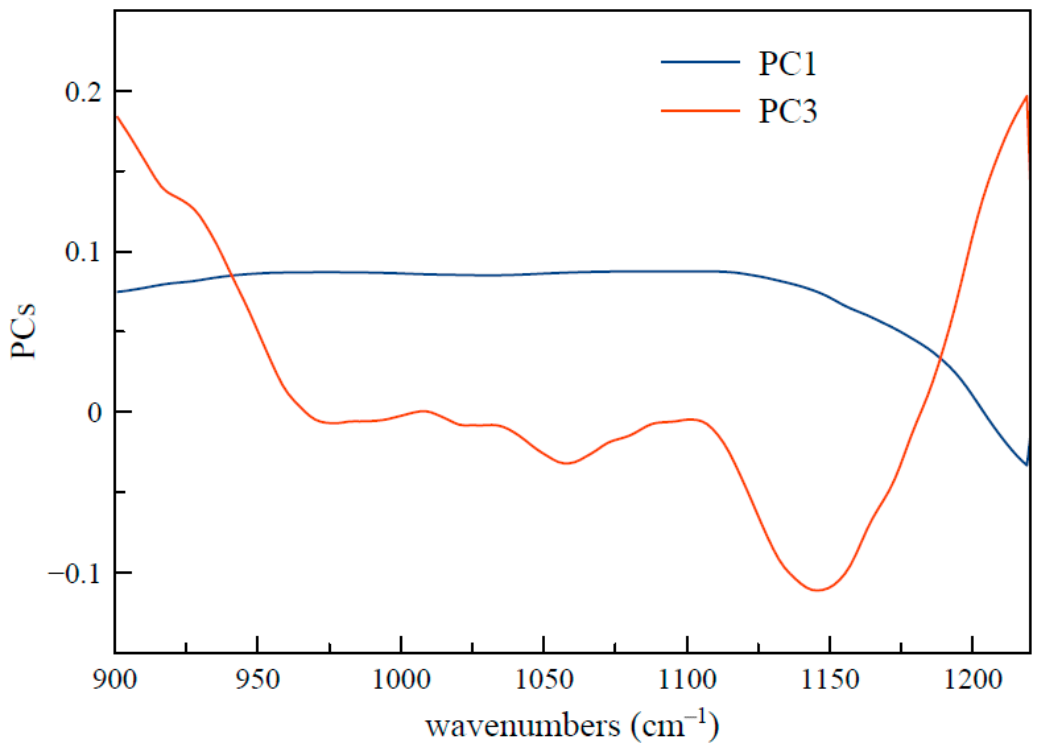
An attempt to correlate the location of the representative points of the spectra in the plot of Figure 4 to the non-carbonate mineral content of the specimens can be performed, considering the trend with respect to the wavenumbers of the loadings of the two principal components that allowed the best discrimination among the stone varieties, illustrated in Figure 5.
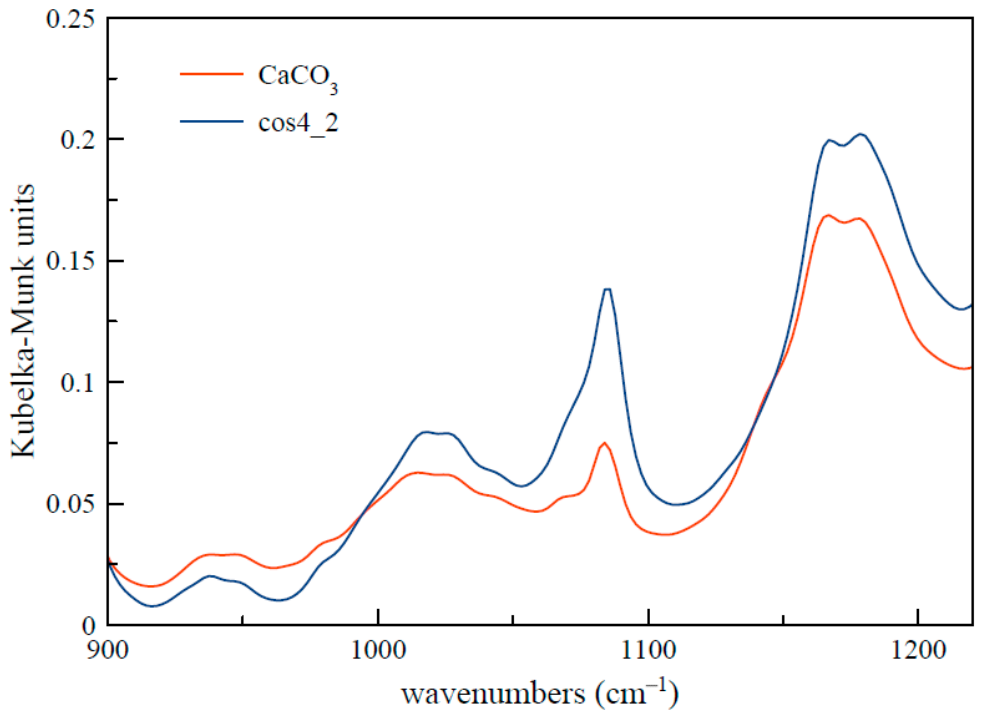
From its trend in Figure 5, it is clear that the PC1 loading plot is characterized by negative values in the high-wavenumber side of the range analyzed; as one can see in Figure 6, showing the 900–1220 cm−1 spectrum of calcium carbonate, this minimum can be related to the most intense absorptions of calcite in this region (those bands are extremely weak and thus unsuitable as a diagnostic feature and in fact, to our knowledge, they have not been investigated in the literature); consequently, specimens whose representative points fall in the left-hand side of the PC3 vs. PC1 score plot are comparatively richer in calcite than the other ones—actually all the White Vicenza samples (red representative points in Figure 4) do not show other spectral absorption besides those of calcite, meaning that any non-carbonate mineral, if present at all, is contained in quantities below the detection limit of the technique employed (a few percent).
In Figure 6, one of the spectra obtained from the cos4 sample is also reported, showing the calcite nature of this stone, chosen as a representative of the White Vicenza variety.
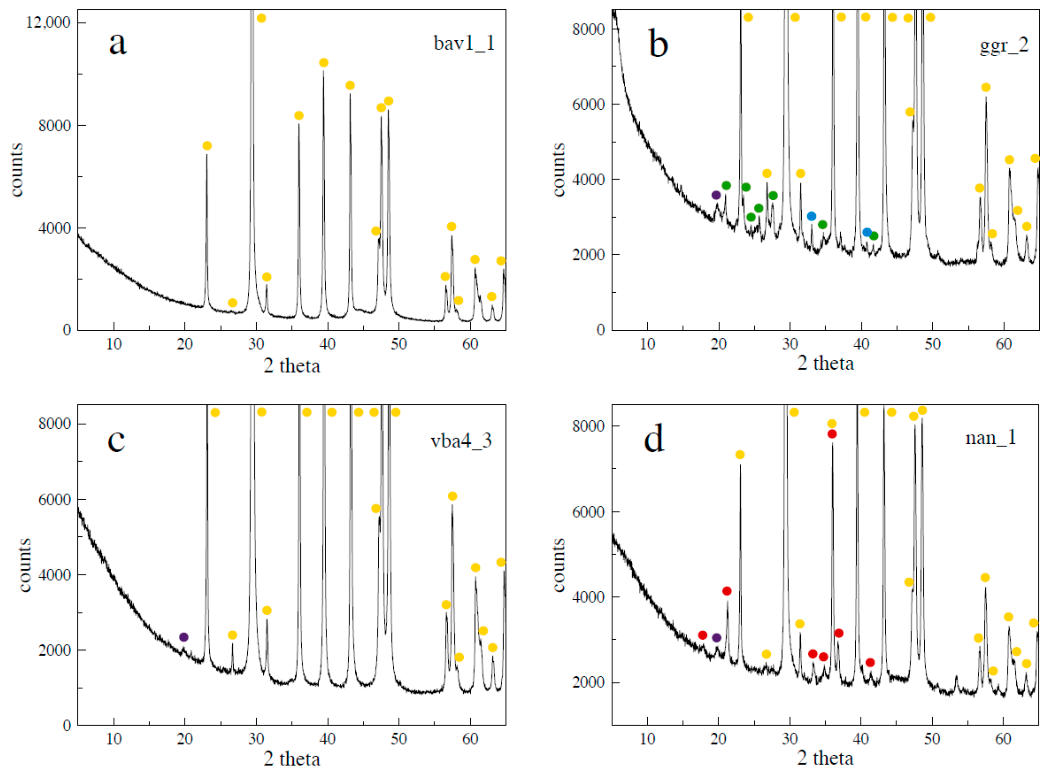
This composition is confirmed by XRD analysis, as shown in Figure 7a where no peaks besides those due to calcite are present in the diffractogram of the bav1_1 sample, also of the WV type (most intense peaks located at 2θ = 23.1, 29.4, 36.1, 39.5, 43.3, 47.2, 47.6, 49.6, 56.6, 57.4, 59.1, 60.7, 61.4, 63.1 and 64.7°) (ICDD No. 86-2334, No. 72-1652, No. 88-1809 and data from [46,47,48]).
On the other hand, samples whose representative points fall on the right-hand side of the PC3 vs. PC1 score plot present the non-carbonate components that make the calcite contribution comparatively less prominent in the spectra moving along the PC1 axis in the positive direction. So, the Pietra di Nanto spectra (green representative points in Figure 4) are appropriately located on the far right-end side of the (PC3, PC1) plane, being the ones with the highest value of the silicate/carbonate indices as previously discussed with regard to Table 2.
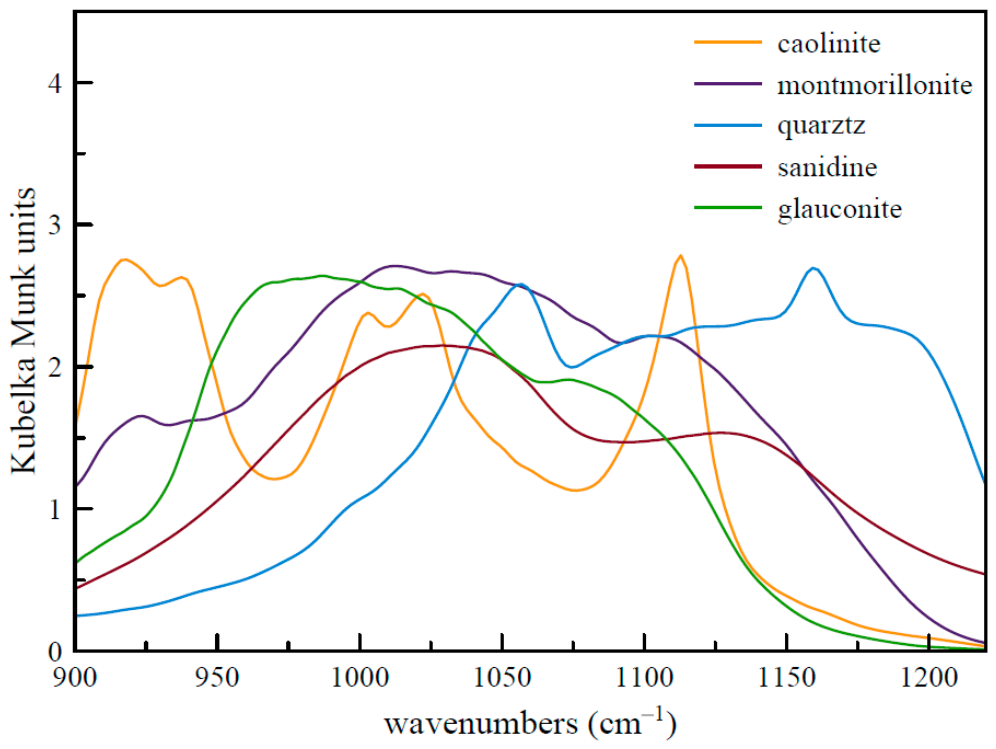
Compared to the PC1 case, the identification of the minerals that contribute to the third principal component is less straightforward: as suggested by the trend of its loading plot of Figure 8, actually, all the minerals known from the literature present in non-negligible quantities could play a role. In Figure 8, the DRIFT spectra of caolinite, montmorillonite, quartz, sanidine and glauconite recorded with the same acquisition parameters used for the stone samples are shown.
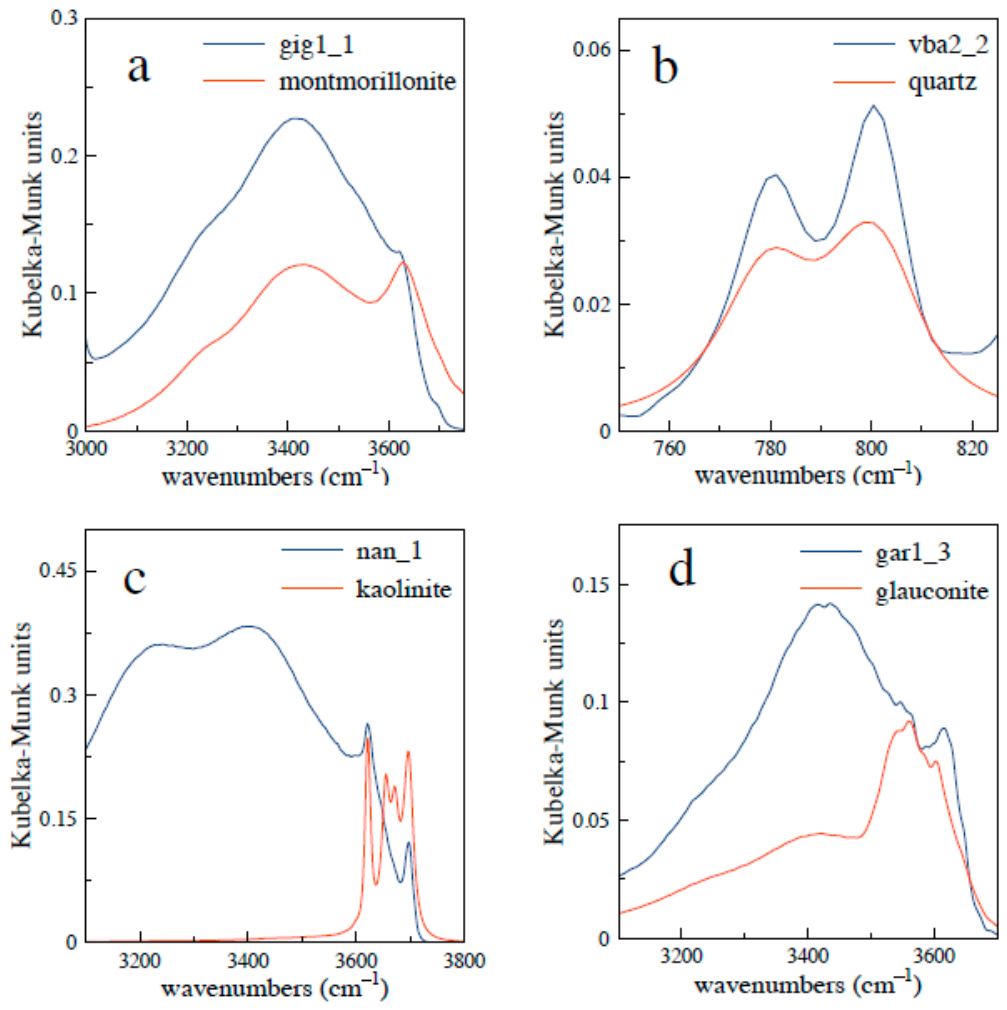
A first suggestion can be derived by considering the main minimum of the PC3 loading plot at about 1125–1140 cm−1, a spectral portion where most of the alkaline feldspars show absorption bands [49]; actually, although its features are not clearly recognizable in the spectra likely due to their superposition to other signals, the X-ray diffraction patterns of NL samples present reflections at 2θ = 21.0, 23.5, 25.7 and 27.6° characteristic of sanidine (ICDD No. 10-0353 and data from [50,51]), as can be seen for the ggr_2 sample shown as an example in Figure 7b. The location in the lower part of the (PC3, PC1) plane of the representative points of the Nanto-like samples (purple points in Figure 4) seems to support this insight. The other absorption of sanidine in this region, at lower wavenumbers (a broad band centred at about 1025–1030 cm−1 [52,53] that can be seen in Figure 8) fall in the same range of the montmorillonite one consisting of a broad band centred at about 1035 cm−1 [54] (also visible in Figure 8), and both could be related to the secondary minimum in the PC3 loading plot at about 1050 cm−1. Montmorillonite, whose presence in the spectra was confirmed by an absorption at 3620 cm−1 in the OH region [54]—see the example in Figure 9a –, was found in different quantities in the spectra of both the VC and TN group samples, thus contributing to making less straightforward the precise identification of the factors affecting the position of the representative points of the samples in the score plot. In Figure 7b–d, the montmorillonite characteristic peak at 2θ = 19.8° [46,55] in the XRD profiles of samples ggr_2 (NL), vba4_3 (CV), and nan_1 (NN) can be found.
Quartz was found exclusively in the spectra of the CV stones, identified through its typical doublet at about 780 and 800 cm−1 [52,56]—see for instance sample vba2_2 in Figure 9b above—but its absorptions in the non-carbonate region at about 1082 and 1170 cm−1 do not seem to play a significant role in the position of the representative points in the PC3 vs. PC1 score plot since they should be pushed downwards to negative values of PC3 at these wavenumbers where sanidine and montmorillonite also absorb. Features characteristic of kaolinite at about 915 and 938 cm−1 [52] on the contrary could be crucial to the positive values of the PC3 loading plot in the lower wavenumber range and consequently could reflect onto the location of the CV samples and especially of the NN ones in the upper part of the PC3 vs. PC1 scores plot; the presence of kaolinite was confirmed by the two most intense peaks of its characteristic quartet in the OH region of the infrared spectra at about 3620 and 3695 cm−1 [57], as shown in Figure 9c for the nan_1 sample.
To round up the identification of the non-carbonate contributions to the stone spectra, it is worth noting that, although without being detectable in the 900–1220 cm−1 range employed in the classification of the Soft Stone varieties, two additional minerals were found in the Grigio di Grancona samples: glauconite could be identified through weak absorptions in the OH region at about 3535–3560 cm−1 [33,58] as shown as in Figure 9d for sample gar1_3 (showing also the montmorillonite features at higher wavenumbers), whereas pyrite was detected only through the presence of two weak X-ray diffraction peaks at 2θ = 33.0 and 56.2° (ICDD No. 71-1680 and data from [59]) as shown in Figure 7b in the case of sample ggr_2. Finally, most of the yellow samples show the presence of goethite in their XRD patterns with peaks at 2θ = 17.8, 21.3, 33.3, 34.8, 36.1, 36.8 and 41.2° (ICDD No. 29-0713 and data from [60])—see for example sample nan_1 in Figure 7d—that on the other hand could not be unambiguously identified by its characteristic absorptions at about 450, 665, 800 and 887 cm−1 [61,62] in the weak and quite crowded low-wavenumbers portion of the spectra. It is worth mentioning, moreover, that the PCA could not discriminate between the Yellow and Grey Nanto-like samples very likely due to the absence of goethite absorptions in the considered spectral portion, and that, conversely, White and Coloured Vicenza stones present different behaviours due to the presence of quartz exclusively in the CV samples.
As a further step of the analysis, based on the PCA results, the samples were divided into three main classes (WV, CV and NL) and subjected to a SIMCA (Soft Independent Modelling of Class Analogies); in this step, the NN ones were left out (but reconsidered below) because their number (three) is too small to run the model. The results obtained for the three classes are summarized in Table 3.
For the WV class, 99.7% of the variance is accounted for by the first five PCs (79.0, 16.1, 3.7, 0.6 and 0.3%, respectively), whereas the first five components explain 99.8% of the total variance for the CV class (with individual values of 89.6, 8.4, 1.2, 0.5 and 0.1%). Four PCs were finally employed to model the NL class, accounting for 98.7% of the variance (69.9, 25.8, 2.3 and 0.8, respectively). The good quality of the fits is reflected in the values of the differences between R2 and Q2 along the fit, equal to 0.014, 0.005, 0.002, 0.002, 0.001; 0.004, 0.010, 0.005, 0.004, 0.003; and 0.013, 0.010, 0.007, 0.006 for classes WV, CV and NL, respectively.
The confusion matrices obtained by a prediction procedure (threshold 5%) performed on the three classes:
( 21 3 0 48 )   ( 18 3 1 50 )   ( 24 3 6 39 )
show that the White Vicenza group (first matrix) was quite satisfactorily modelled: 87.5% of the averaged WV spectra (21 out of 24) are recognized as group members, while no samples of the other two stone varieties are identified as belonging to it.
The modelling of the Coloured Vicenza variety (second matrix) was slightly less efficient: 85.7% of the CV average spectra (18 out of 21) are properly identified as belonging to the group, but also one spectrum (of the WV variety) is identified as being part of the CV group (false positives 4.2%). No spectrum of the Nanto-like group is classified as CV.
The class that led to the least satisfactory modelling is that of the Nanto-like stones: although the percentage of true positives is higher than that of the other classes, 88.9% (24 out of 27), the model identifies as belonging to this class also 29% of the Coloured Vicenza spectra (6 out of 21). No false positives are present for the WV samples.
Finally, the remaining stones, the Nanto p.d., the two Grigio Alpi and the three Pietra del Mare were tested with regard to their belonging to one of the modelled classes, yielding the results shown in Table 4.
As was to be expected, none of the Pietra di Nanto p.d. spectra are classified into one of the three classes, consistent with the peculiar nature of this stone. As for the two hybrid varieties, neither is assigned to a specific class, except for some cases pointing out that the Grigio Alpi spectra (66.7% of the cases) and, to a lesser extent, the Pietra del Mare ones (33.3%) bear similarities to those of the Nanto-like class.

5. Conclusions

In this study, thirty samples of Soft Stone from the Berici Hills (Vicenza, Italy) were investigated with the aim of developing a rapid method for the identification of the main stone varieties based on DRIFTS spectroscopy coupled to Principal Component Analysis (PCA) and Soft Independent Modelling of Class Analogy (SIMCA) chemometrics techniques. A PCA performed in the 900–1220 cm−1 spectral region enabled the identification of four main groups in the dataset, corresponding to the Oligocene varieties White Vicenza and Coloured Vicenza, and the Eocene varieties Nanto-like and Nanto p.d. The distribution of the samples in the most informative score plot PC3 vs. PC1 was found to be primarily related to variations in the relative contribution of non-carbonate components as highlighted by the analysis of the loading plots for PC1 and PC3. As a further step, the SIMCA method was applied to the White Vicenza, Coloured Vicenza and Nanto-like classes. The models correctly classified approximately 86–89% of the spectra. No false positives were observed for the White Vicenza class, whereas one White Vicenza spectrum was assigned to the Coloured Vicenza class and six Coloured Vicenza spectra were assigned to the Nanto-like class. Finally, none of the three spectra obtained for the Nanto p.d. sample was assigned to any of the modelled classes, confirming the distinct nature of this variety. Two additional lithotypes with intermediate characteristics, the Grigio Alpi and the Pietra del Mare, were also evaluated. These samples showed partial similarity with the Nanto-like class, being classified as such in approximately 67% and 33% of the cases, respectively. Overall, the proposed approach suggests that DRIFT spectroscopy, coupled with multivariate analysis, holds promise as a rapid screening tool for the classification of the main soft stone varieties using untreated material and requiring minimum sample preparation. As a straightforward and minimally destructive analytical framework, this combination may prove useful for material identification and cultural heritage applications. However, expanding the model to include a wider variety of samples remains necessary to establish its broader reliability.

Supplementary Materials

The following supporting information can be downloaded at: https://www.mdpi.com/article/10.3390/chemosensors14060130/s1, Table S1: Details of the 30 Soft Stone specimens investigated; Figure S1: Provenance of the samples in the Berici Hills district (Vicenza, Italy); Figure S2: Average values of the silicate/carbonate index for the 30 stone samples; Figure S3: Standard deviations of the gid1 spectra computed on all the samplings and on the averaged spectra from each sampling; Table S2: PCA results in the whole spectral range (400–4000 cm−1); Figure S4: PC2 vs PC1, PC3 vs PC1 and PC3 vs PC2 score plots of the Soft Stone specimens in the 400–4000 cm−1 range (all the spectra); Figure S5: PC2 vs PC1, PC3 vs PC1 and PC3 vs PC2 score plots of the Soft Stone specimens in the 400–4000 cm−1 range (average spectra); Figure S6: Scoring of the representative points of the hybrid samples Grigio Alpi and Pietra del Mare in the PC3 vs PC1 score plot of the Soft Stone specimens in the 900–1220 cm−1 range (average spectra). Historical background file. Raw DRIFTS data.

Author Contributions

Conceptualization, A.D.L.P.; methodology, A.D.L.P.; formal analysis, A.D.L.P.; data curation, A.D.L.P., P.S. and A.P.C.; writing—original draft preparation, A.D.L.P.; writing—review and editing, A.D.L.P., P.S. and A.P.C.; visualization, A.D.L.P., P.S. and A.P.C.; funding acquisition, A.D.L.P., P.S. and A.P.C. All authors have read and agreed to the published version of the manuscript.

Funding

This research was funded by the University Ca’ Foscari Venezia (ADiR funds).

Data Availability Statement

The original contributions presented in this study (Soft Stone DRIFT spectra; historical background; additional information on the samples and the analysis) are included in the Supplementary Materials. Further inquiries can be directed to the corresponding author.

Acknowledgments

We would like to thank all the stone suppliers (Berica Pietre, Nanto, Vicenza, Italy; Laboratorio Morseletto, Vicenza, Italy; La Bottega Vecia, Longare, Vicenza, Italy; Grassi 1880 Cave, Nanto, Vicenza, Italy; Grassi Pietre, Nanto, Vicenza, Italy; Peotta, Altavilla Vicentina, Vicenza, Italy) and the people (Lori and Giorgio Antonello; Francesco Antoniazzi; Anna Dal Farra; Alberto Quaranta; Maria Vittoria Grassi; Diana Ventoruzzo) who, to different extents, cooperated in the sample collection, Tiziano Finotto for recording the X-Ray diffractograms, and the Mineralogy Group of the Università Ca’ Foscari Venezia for supplying the reference minerals.

Conflicts of Interest

The authors declare no conflicts of interest.

Abbreviations

The following abbreviations are used in this manuscript:
DRIFTSDiffuse Reflectance Infrared Fourier Transform Spectroscopy
PCAPrincipal Component Analysis
SIMCASoft Independent Modelling of Class Analogy
XRDX-Ray Diffraction

References

  1. Cattaneo, A.; De Vecchi, G.P.; Menegazzo Vitturi, L. Le pietre tenere dei Colli Berici. Atti Mem. Accad. Patav. Sci. Lett. Arti 1976, 88, 69–99. [Google Scholar]
  2. Nebelsick, J.H.; Rasser, M.W.; Bassi, D. Facies dynamics in Eocene to Oligocene circumalpine carbonates. Facies 2005, 51, 197–216. [Google Scholar] [CrossRef] [Scilit]
  3. Benchiarin, S.; Fassina, V.; Molin, G. La Pietra di Nanto: Caratterizzazione Mineralogico-Petrografica e Studio del Comportamento Fisico-Meccanico Mediante Test di Invecchiamento Accelerato. In I Monumenti Funerari nei Chiostri della Basilica Antoniana in Padova—Indagini e Ricerche per la Conservazione; Spiazzi, A.M., Ed.; Il Prato: Padova, Italy, 2009; pp. 9–26. [Google Scholar]
  4. Benchiarin, S. Carbonate Lithotypes Employed in Historical Monuments: Quarry Materials, Deterioration and Restoration Treatment. Ph.D. Thesis, Università degli Studi di Padova, Padova, Italy, 2008. [Google Scholar]
  5. Cappellaro, M.; Dal Farra, A.; De Lorenzi Pezzolo, A. DRIFTS characterization of the “Soft Stone of the Berici Hills” and first results of a fast method for the classification of its main varieties through Multivariate Analysis. Sci. Cà Foscari 2012, 1, 46–59. [Google Scholar]
  6. De Lorenzi Pezzolo, A.; Dal Farra, A.; Cappellaro, M. DRIFTS Characterization of the “Soft Stone of the Berici Hills” and Classification of Its Main Varieties Through Multivariate Analysis. In CMACH 2018, Mediterraneum Meeting, Multivariate Analysis and Chemometry: An Essential Support for Environment and Cultural Heritage Researchers, 7th ed.; Università la Sapienza: Roma, Italy, 2018; Available online: https://www.cma4ch.org/18/_abstracts/A-DeLorenzi-Pezzolo_DRIFTS-Characterization-of-the-Soft-Stone(24vcc6598hju).pdf (accessed on 14 April 2026).
  7. Dal Farra, A. Caratterizzazione Tramite DRIFT (Diffuse Reflectance Infrared Fourier Transform) di Diverse Tipologie di Pietra Tenera dei Colli Berici: Un Contributo per l’Identificazione di Alcuni Materiali in Opera. Bachelor’s Thesis, Università Ca’ Foscari Venezia, Venezia, Italy, 2009. [Google Scholar]
  8. Cappellaro, M. Spettroscopia DRIFT (Diffuse Reflectance Infrared Fourier Transform) della Pietra Tenera dei Berici: Caratterizzazione delle Diverse Tipologie Tramite l’Analisi delle Componenti non Carbonatiche. Bachelor’s Thesis, Università Ca’ Foscari Venezia, Venezia, Italy, 2012. [Google Scholar]
  9. Gasparella, C. Indagini Spettroscopiche sulle Diverse Varietà di Pietra Tenera dei Berici. Bachelor’s Thesis, Università Ca’ Foscari Venezia, Venezia, Italy, 2025. [Google Scholar]
  10. Henry, D.G.; Watson, J.S.; John, C.M. Assessing and calibrating the ATR-FTIR approach as a carbonate rock characterization tool. Sediment. Geol. 2017, 347, 36–42. [Google Scholar] [CrossRef] [Scilit]
  11. Kambakhsh, H.; Nik Daud, N.N.; Inanch, S. Characterization of Weathered and Intact Limestone with FTIR Analysis in Batu Caves, Malaysia. Int. J. Integr. Eng. 2024, 16, 1–11. [Google Scholar] [CrossRef] [Scilit]
  12. Al-Amin, K.; Kawsar, M.; Bhuiyan Mamun, M.T.R.; Hossain, M.S. Fourier transform infrared spectroscopic technique for analysis of inorganic materials: A review. Nanoscale Adv. 2025, 7, 6677–6702. [Google Scholar] [CrossRef] [Scilit]
  13. El Omari, M.; El Amraoui, M.; Bejjit, L.; Fikri, I.; El Bakkali, A.; Haddad, M.; Ait Lyazidi, S.; El Amrani, A. Spectroscopic characterization of limestone and dolostone by Raman, FTIR, XRD and XRF analyses. E3S Web Conf. 2025, 675, 01007. [Google Scholar] [CrossRef] [Scilit]
  14. Cucchi, F. Le Pietre usate per la Scultura. In Il Restauro delle Sculture Lapidee nel Parco di Villa Manin a Passariano; Accornero, E., Ed.; Campanotto Editore: Udine, Italy, 1997; pp. 103–107. [Google Scholar]
  15. Cornale, P. Le pietre del Palladio. In Palladio e il Design Litico; Galiotto, R., Ed.; Consorzio Marmisti Chiampo: Vicenza, Italy, 2008; pp. 41–46. [Google Scholar]
  16. Nebelsick, J.H.; Bassi, D.; Lempp, J. Tracking paleoenvironmental changes in coralline algal-dominated carbonates of the Lower Oligocene Calcareniti di Castelgomberto formation (Monti Berici, Italy). Facies 2013, 59, 133–149. [Google Scholar] [CrossRef] [Scilit]
  17. Gheno, G.; Badetti, E.; Brunelli, A.; Ganzerla, R.; Marcomini, A. Consolidation of Vicenza, Arenaria and Istria stones: A comparison between nano-based products and acrylate derivatives. J. Cult. Herit. 2018, 21, 44–52. [Google Scholar] [CrossRef] [Scilit]
  18. Scrivano, S.; Gaggero, L.; Gisbert Aguilar, J. An experimental investigation of the effects of grain size and pore network on the durability of Vicenza Stone. Rock Mech. Rock Eng. 2019, 52, 2935–2948. [Google Scholar] [CrossRef] [Scilit]
  19. Tesser, E.; Conventi, A.; Majerle, F. Characterization of barium hydroxide used as consolidating agent for monumental surfaces in Venice. Heritage 2022, 5, 3280–3297. [Google Scholar] [CrossRef] [Scilit]
  20. Capasso, I.; Colella, A.; Iucolano, F. Silica-based consolidants: Enhancement of chemical-physical properties of Vicenza stone in heritage buildings. J. Build. Eng. 2023, 68, 106124. [Google Scholar] [CrossRef] [Scilit]
  21. Salvini, S.; Coletti, S.; Maritan, L.; Massironi, M.; Pieropan, A.; Spiess, R.; Mazzoli, C. Petrographic characterization and durability of carbonate stones used in UNESCO World Heritage Sites in northeastern Italy. Environ. Earth Sci. 2023, 82, 49. [Google Scholar] [CrossRef] [Scilit]
  22. Capasso, I.; Colella, A.; Iucolano, F. Weathering tests on raw and consolidated Vicenza Stone. Materials 2024, 17, 3541. [Google Scholar] [CrossRef] [Scilit] [PubMed]
  23. Dilaria, S.; Bonetto, J.; Germinario, L.; Previato, C.; Girotto, C.; Mazzoli, C. The stone artifacts of the National Archaeological Museum of Adria (Rovigo, Italy): A noteworthy example of heterogeneity. Archaeol. Anthropol. Sci. 2024, 16, 14. [Google Scholar] [CrossRef] [Scilit]
  24. Coletti, C.; Antonelli, F.; Germinario, L.; Maritan, L.; Piovesan, R.; Tesser, E.; Mazzoli, C. Investigating stone materials from some European cultural heritage sites for predicting future decay. Rend. Lincei Sci. Fis. Nat. 2025, 36, 103–127. [Google Scholar] [CrossRef] [Scilit]
  25. Di Benedetto, C.; Cappelletti, P.; Favaro, M.; Graziano, S.F.; Langella, A.; Colella, A. Porosity as a key factor in the durability of two historical building stones: Neapolitan Yellow Tuff and Vicenza Stone. Eng. Geol. 2015, 193, 310–319. [Google Scholar] [CrossRef] [Scilit]
  26. Biscontin, G.; Zendri, E.; Bakolas, A. Indagini chimico-fisiche finalizzate a un intervento conservativo di alcune sculture del giardino di Villa Manin. In Il Restauro delle Sculture Lapidee nel Parco di Villa Manin a Passariano; Accornero, E., Ed.; Campanotto Editore: Udine, Italy, 1997; pp. 143–152. [Google Scholar]
  27. Costinas, C.; Cotet, L.C.; Baia, L.; El Habra, N.; Nodari, L.; Tomasin, P. Performance assessment of graphene oxides as a protective coating for historical stone. Materials 2025, 18, 1243. [Google Scholar] [CrossRef] [Scilit]
  28. La Russa, M.F.; Ruffolo, S.A.; Barone, G.; Crisci, G.M.; Mazzoleni, P.; Pezzino, A. The use of FTIR and microFTIR spectroscopy: An example of application to Cultural Heritage. Int. J. Spectrosc. 2009, 2009, 893528. [Google Scholar] [CrossRef] [Scilit]
  29. So, R.T.; Blair, N.E.; Masterson, A. Carbonate mineral identification and quantification in sediment matrices using diffuse reflectance infrared Fourier transform spectroscopy. Environ. Chem. Lett. 2020, 18, 1725–1730. [Google Scholar] [CrossRef] [Scilit]
  30. Liu, G.L.; Kazarian, S.G. Recent advances and applications to cultural heritage using ATR-FTIR spectroscopy and ATR-FTIR spectroscopic imaging. Analyst 2022, 147, 1777–1797. [Google Scholar] [CrossRef] [Scilit]
  31. Coccato, A.; Caggiani, M.C. An overview of Principal Components Analysis approaches in Raman studies of cultural heritage materials. J. Raman Spectrosc. 2024, 55, 125–147. [Google Scholar] [CrossRef] [Scilit]
  32. Ritz, M.; Vaculícová, L.; Plevová, E.; Matysek, D.; Mališ, J. Determination of the predominant minerals in sedimentary rocks by chemometric analysis of infrared spectra. Clays Clay Min. 2012, 60, 655–665. [Google Scholar] [CrossRef] [Scilit]
  33. De Lorenzi Pezzolo, A.; Dal Fabbro, A.; Alterio, A. Spectroscopic and chemometric characterization of green earth pigments employed by ancient Romans in the wall decoration of buildings in the X Regio (Venetia et Histria). Spectrosc. Lett. 2023, 56, 129–146. [Google Scholar] [CrossRef] [Scilit]
  34. Di Fazio, M.; Calzolari, L.; Capriotti, S.; Rea, C.; Medeghini, L. Integrated IR Multi-methods Protocol for Cultural Heritage Geomaterials: Evaluation of Statistical Data Processing. In Advances in Nondestructive Evaluation Technologies for the Preservation of Cultural Heritage; Osman, A., Moropoulou, A., Lampropoulos, K., Eds.; Springer Nature: Berlin/Heidelberg, Germany, 2026; pp. 223–229. [Google Scholar]
  35. Vitale, R.; Cocchi, M.; Biancolillo, A.; Ruckebusch, C.; Marini, F. Class modelling by Soft Independent Modelling of Class Analogy: Why, when, how? A tutorial. Anal. Chim. Acta A 2023, 1270, 341304. [Google Scholar] [CrossRef] [Scilit] [PubMed]
  36. Malyiurek, Z.; Vitale, R.; Walczak, B. Different strategies for class model optimization. A comparative study. Talanta 2020, 215, 120912. [Google Scholar] [CrossRef] [Scilit]
  37. Riu, J.; Giussani, B. Analytical chemistry meets art: The transformative role of chemometrics in cultural heritage preservation. Chemom. Intell. Lab. Syst. 2024, 247, 105095. [Google Scholar] [CrossRef] [Scilit]
  38. Strani, L.; Cocchi, M.; Tanzilli, D.; Biancolillo, A.; Marini, F.; Vitale, R. One class classification (class modelling): State of art and perspectives. Trends Anal. Chem. 2025, 183, 1187117. [Google Scholar] [CrossRef] [Scilit]
  39. Fassina, V.; Benchiarin, S.; Molin, G. The decay of Nanto Stone in an outdoor-sheltered environment in the cloister of Saint Anthony Basilica in Padova. Egypt. J. Archaeol. Restor. Stud. 2019, 9, 115–127. [Google Scholar] [CrossRef] [Scilit]
  40. Zaccariello, G.; Tesser, E.; Piovesan, R.; Antonelli, F. The (building) stones of Venice under threat: A study about their deterioration between climate change and land subsidence. Sustainability 2024, 16, 4701. [Google Scholar] [CrossRef] [Scilit]
  41. Grassi Pietre SRL Downloads. CE Test and Declaration of Performance—Pietra di Vicenza. Available online: https://grassipietre.co.uk/dowload-marble-natural-stone-catalog/ (accessed on 23 April 2026).
  42. Liang, Y.Z.; Christy, A.A.; Nyhus, A.K.; Hagen, S.; Schanche, J.S.; Kvalheim, O.M. Pre-treatment of diffuse reflectance infrared spectra for quantitative analysis of macro porous polymer particles. Vib. Spectrosc. 1999, 20, 47–57. [Google Scholar] [CrossRef] [Scilit]
  43. White, W.B. The Carbonate Minerals. In The Infrared Spectra of Minerals; Farmer, V.C., Ed.; Mineralogical Society: London, UK, 1974; pp. 227–284. [Google Scholar]
  44. Miller, F.A. Infrared Spectra of Inorganic Materials. In Course Notes on the Interpretation of Infrared and Raman Spectra; Mayo, D.W., Miller, F.A., Hannah, R.W., Eds.; John Wiley & Sons: Hoboken, NJ, USA, 2004; p. 311. [Google Scholar]
  45. Ji, J.; Ge, Y.; Balsam, W.; Damuth, J.E.; Chen, J. Rapid identification of dolomite using a Fourier Transform Infrared Spectrophotometer (FTIR): A fast method for identifying Heinrich events in IODP Site U1308. Mar. Geol. 2009, 258, 60–68. [Google Scholar] [CrossRef] [Scilit]
  46. Neupane, B.B.; Sharma, A.; Giri, B.; Joshi, M.K. Characterization of airborne dust samples collected from core areas of Kathmandu Valley. Heliyon 2020, 6, e03791. [Google Scholar] [CrossRef] [Scilit]
  47. RRUFF Database. Record R050009. Available online: https://www.rruff.net/odr/rruff_sample#/odr/search/display/2010/eyJnZW4iOiJSMDUwMDA5IiwiZHRfaWQiOiI3MzgiLCJzb3J0X2J5IjpbeyJzb3J0X2RmX2lkIjoiNzA1MiIsInNvcnRfZGlyIjoiYXNjIn1dfQ (accessed on 7 April 2026).
  48. RRUFF Database. Record R050307. Available online: https://www.rruff.net/odr/rruff_sample#/odr/search/display/2010/eyJnZW4iOiJSMDUwMzA3IiwiZHRfaWQiOiI3MzgiLCJzb3J0X2J5IjpbeyJzb3J0X2RmX2lkIjoiNzA1MiIsInNvcnRfZGlyIjoiYXNjIn1dfQ (accessed on 7 April 2026).
  49. Theodosoglou, E.; Koroneos, A.; Soldatos, T.; Zorba, T.; Paraskevopoulos, K. Comparative Fourier Transform infrared and X-Ray power diffraction analysis of naturally occurred K-feldspars. Bull. Geol. Soc. Greece 2010, 43, 2752–2761. [Google Scholar] [CrossRef] [Scilit]
  50. Safatle, F.A.; de Oliveira, K.D.; de Ávila Neto, C.N. Potassium recovery from Brazilian Glauconitic siltstone by hydrothermal treatments. REM Int. Eng. J. 2020, 73, 213–224. [Google Scholar] [CrossRef] [Scilit]
  51. RRUFF Database. Record R060313. Available online: https://www.rruff.net/odr/rruff_sample#/odr/search/display/2010/eyI3MDUyIjoic2FuaWRpbmUiLCJnZW4iOiJSMDYwMzEzIiwiZHRfaWQiOiI3MzgiLCJzb3J0X2J5IjpbeyJzb3J0X2RmX2lkIjoiNzA1MiIsInNvcnRfZGlyIjoiYXNjIn1dfQ (accessed on 7 April 2026).
  52. De Benedetto, G.E.; Laviano, R.; Sabbatini, L.; Zambonin, P.G. Infrared spectroscopy in the mineralogical characterization of ancient pottery. J. Cult. Herit. 2002, 3, 177–186. [Google Scholar] [CrossRef] [Scilit]
  53. Makreski, P.; Jovanovski, G.; Kaitner, B. Minerals from Macedonia. XXIV. Spectra-structure characterization of tectosilicates. J. Mol. Struct. 2009, 924–926, 413–419. [Google Scholar] [CrossRef] [Scilit]
  54. Patel, H.A.; Somani, R.S.; Bajaj, H.C.; Jasra, R.V. Nanoclays for polymer nanocomposites, paints, inks, greases and cosmetics formulations, drug delivery vehicle and waste water treatment. Bull. Mater. Sci. 2006, 29, 133–145. [Google Scholar] [CrossRef] [Scilit]
  55. El Ouardi, M.; Laabd, M.; Oualid, H.A.; Brahmi, Y.; Abaamrane, A.; Elouahli, A.; Ait Addi, A.; Laknifli, A. Efficient removal of p-nitrophenol from water using montmorillonite clay: Insights into the adsorption mechanism, process optimization, and regeneration. Environ. Sci. Pollut. Res. 2019, 26, 19615–19631. [Google Scholar] [CrossRef] [Scilit]
  56. Saikia, B.J.; Parthasarathy, G.; Sarmah, N.C. Fourier transform infrared spectroscopic estimation of crystallinity in SiO2 based rocks. Bull. Mater. Sci. 2008, 31, 775–779. [Google Scholar] [CrossRef] [Scilit]
  57. Król, M.; Minkiewicz, J.; Mozgawa, W. IR spectroscopy studies of zeolites in geopolymeric materials derived from kaolinite. J. Mol. Struct. 2016, 1126, 200–206. [Google Scholar] [CrossRef] [Scilit]
  58. Zviagina, B.B.; Drits, V.A.; Dorzhieva, O.V. Distinguishing features and identification criteria for K-dioctahedral 1M micas (illite-aluminoceladonite and illite-glauconite-celadonite series) from middle-Infrared Spectroscopy data. Minerals 2020, 10, 153. [Google Scholar] [CrossRef] [Scilit]
  59. Ma, S.; Shi, M.; Zhang, C.; Cao, Q. Mineralogical characteristics and genetic types of pyrite with different occurrence: Constraints from spectroscopy, geochemistry and δ34 stable isotopes. Minerals 2024, 14, 52. [Google Scholar] [CrossRef] [Scilit]
  60. RRUFF Database. Record R050142. Available online: https://www.rruff.net/odr/rruff_sample#/odr/view/640608/2010/eyJkdF9pZCI6IjczOCIsIjcwNTIiOiJnb2V0aGl0ZSJ9/1 (accessed on 7 April 2026).
  61. Adrover Gracia, I. Prontuario della Spettrofotometria IR dei Pigmenti e Coloranti, 1st ed.; Aracne Editrice: Ariccia, Italy, 2018; p. 109. [Google Scholar]
  62. Cui, H.; Ren, W.; Lin, P.; Liu, Y. Structure control synthesis of iron oxide polymorph nanoparticles through an epoxide precipitation route. J. Exp. Nanosci. 2013, 8, 869–875. [Google Scholar] [CrossRef] [Scilit]
Figure 1. Representative samples of Soft Stone. From left to right, top: Bianco Avorio (bav1), Giallo Dorato (gid3), Grigio Alpi (gal1); bottom: Pietra di Villabalzana (vba2); Pietra di Nanto p.d. (nan); Pietra del Mare (pdm2).
Chemosensors 14 00130 g001
Figure 3. Profiles of the stone spectra in the non-carbonate region 900–1220 cm−1 (WV—red; CV—blue; yNL—purple; gNL—pink; hy—black; NN—green).
Chemosensors 14 00130 g003
Figure 4. PC3 vs. PC1 score plot of the DRIFT spectra of the Soft Stone specimens in the non-carbonate range 900–1220 cm−1. The labels of the representative points indicate the five stone varieties: WV—White Vicenza (red); CV—Coloured Vicenza (blue); yNL—Yellow Nanto-like (purple); gNL—Grey Nanto-like (pink); NN—Nanto p.d. (green).
Chemosensors 14 00130 g004
Figure 5. Loadings vs. wavenumbers of the first and third principal components.
Chemosensors 14 00130 g005
Figure 6. DRIFT spectrum of calcite compared to the cos4_2 one in the 900–1220 cm−1 range.
Chemosensors 14 00130 g006
Figure 7. 5° < 2θ < 65° range X-ray diffractograms of four representative samples of the main Soft Stone varieties: (a) bav1_1 for WV; (b) ggr_2 for NL; (c) vba4_3 for CV; (d) nan_1 for NN. The peaks characteristic of the minerals identified are marked by different colours: yellow—calcite; purple—montmorillonite; green—sanidine; blue—pyrite; red—goethite.
Chemosensors 14 00130 g007
Figure 8. Non-carbonate mineral contributions to the spectral range 900–1220 cm−1 (to highlight the different profiles, the spectra are amplified so that their intensities cannot be directly compared).
Chemosensors 14 00130 g008
Figure 9. Spectral details of some Soft Stone samples illustrating the presence of non-carbonate minerals in different spectral regions: (a) montmorillonite in the NL gig1_1 sample; (b) quartz in the CV vba2_2 sample; (c) kaolinite in the NN nan_1 sample; (d) glauconite (together with montmorillonite) in the NL gar1_3 sample.
Chemosensors 14 00130 g009
Table 1. Classification of the specimens of Soft Stones.
Stone
Label
Commercial/
Popular Name
Variety According to
Cattaneo et al. [1]
Variety According to Benchiarin [4]Present Work
Variety
bav1bianco avorioPietra di VicenzaWhite S. GottardoWhite Vicenza (WV)
bav2
bav3
bav4
cos3pietra di CostozzaWhite Costozza
cos4
pbipietra biancaWhite S. Gottardo
sgopietra di S.
Gottardo
cos1pietra di CostozzaWhite CostozzaColoured
Vicenza
(CV)
cos2
monpietra di Montecchion.c.
vba1pietra di VillabalzanaWhite Costozza
vba2
vba3
vba4
gid1giallo
dorato
Pietra di tipo NantoYellow S. GermanoYellow
Nanto-like
(yNL)
gid2
gid3
giggiallo di
Grancona
gisgiallo
dorato scuro
pgipietra gialla
gal1grigio AlpiGrey S. Germanohybrid
(hy)
gal2
gar1grigio argentoGrey
Nanto-like
(gNL)
gar2
ggrgrigio di Grancona
pdm1pietra del mareYellow S. Germanohybrid
(hy)
pdm2
pdm3
nanpietra di
Nanto
Pietra di Nanto p.d.Yellow NantoNanto p.d.
(NN)
Table 2. Average values of the silicate/carbonate ratio.
SpecimenIndexSpecimenIndexSpecimenIndexSpecimenIndex
bav173 ± 11cos1137 ± 16gid1279 ± 12nan564 ± 30
bav257 ± 6cos2320 ± 32gid2467 ± 21
bav379 ± 13mon212 ± 21gid3357 ± 9gal1490 ± 28
bav464 ± 9vba1102 ± 6gig436 ± 23gal2274 ± 23
cos345 ± 5vba2244 ± 23gis498 ± 20
cos450 ± 4vba3262 ± 16pgi353 ± 23pdm1157 ± 7
pbi60 ± 8vba4329 ± 17gar1433 ± 13pdm2305 ± 22
sgo44 ± 6 gar2363 ± 16pdm3224 ± 14
ggr434 ± 28
Table 3. Fit results of the PCA performed on each of the three stone groups.
ClassNumber of ObservationsNumber of PCsCumulative R2Cumulative Q2
WV class2450.9970.996
CV class2150.9980.995
NL class2740.9870.981
Table 4. Prediction results for the Nanto p.d., Grigio Alpi and Pietra del Mare spectra with respect to the three modelled classes—number of items recognized as members of each class.
Pietra di Nanto p.d.
(3 Observations)
Grigio Alpi
(6 Observations)
Pietra del Mare
(9 Observations)
WV class000
CV class000
NL class043
Disclaimer/Publisher’s Note: The statements, opinions and data contained in all publications are solely those of the individual author(s) and contributor(s) and not of MDPI and/or the editor(s). MDPI and/or the editor(s) disclaim responsibility for any injury to people or property resulting from any ideas, methods, instructions or products referred to in the content.