Abstract
The detection of blood by human remains detection (HRD) canines and blood detection dogs (BDDs) is crucial to both search and rescue (SAR) and crime scene investigation. They can be used to find both missing persons and to detect otherwise undetectable blood evidence at crime scenes. An added level of difficulty with training occurs as blood volatile organic compounds (VOCs) are drastically affected by time. Previous studies have shown this, with a focus on a longer timescale (weeks/months). Little data exists on the changes in the first 48 h, the most crucial time in SAR, something this study aims to rectify. Data was collected using headspace solid-phase microextraction/gas chromatography–mass spectrometry, which was then analyzed using chemometrics and confirmed with canine trials. The results of the laboratory analysis indicated that there were multiple, distinct odor profiles between the 1 h and 2-week time windows—namely, the fresh, intermediate, and aged stages of decomposition. The noted changes in the odor profiles were validated with HRD canine trials. Canines had difficulty detecting the fresh blood (1–2 h old) and had the greatest detection rate for the aged blood (34–36 h old). Both the chemical analysis and canine behavior data displayed a clear change in the odor profile within the first 48 h. This information will assist SAR, HRD, and BBD training to ensure they train on all distinct odor profiles.
1. Introduction
Canines have been utilized in law enforcement for many years; in fact, their use dates to ancient times, when the Egyptians, Assyrians, and Greeks used dogs to repel their enemies. Canines are a significant ally in combat because of their remarkable sense of acuteness, their loyalty towards their owners, their focus, and their speed [1]. Scent canines were once only employed as hunting tools, but in more recent years, many government and law enforcement organizations utilize them as detection tools as they can assist in the search for a range of target sources, including money, drugs, explosives, accelerants, and both living and dead individuals [2]. Human remains detection (HRD) canines or cadaver detection dogs (CDDs) are specialized in scent training to locate decomposing human bodies or other remains samples. Also, within this group, there is a subset of HRD canines known as blood detection dogs (BDDs), which are trained to detect blood evidence rather than full cadavers. These canines can be used in crime scenes as well as other instances such as search and rescue (SAR) scenarios or assault cases to locate a crime scene or pieces of evidence, such as potential weapons, suspects, or victims. While there is a great utility to these canines, BDDs are not known to be used throughout the US and are primarily used in the UK, Australia, and Italy [3].
Canines use the volatile organic compounds (VOCs) that make up the odor emanating from the target object for detection. With some targets, there is only one target odorant, or the VOC responsible for canine detection; for example, methyl benzoate is thought to be the target odorant for cocaine [2]. This is not the case for blood odor, however, as it consists of a large number of VOCs as potential odorants. Similarly to human remains odors, blood VOC profiles are complex, and it is unknown whether canines use the entire profile, specific classes of compounds, or maybe specific VOCs for identification [3,4]. Despite canines’ advanced detection capabilities, laboratory analysis is still necessary to characterize their target odor and to aid in understanding the limitations of current training protocols. Through the collection, separation, and detection of VOCs by headspace solid-phase microextraction (HS-SPME) and gas chromatography–mass spectrometry (GC-MS), specific target VOCs are identified and semi-quantitated. This allows for conclusions to be drawn on factors which may impact locating and revealing targets via canine olfaction.
Training canines to detect these samples proves even more difficult considering that decomposition is a dynamic process and changes over time. A few studies have tackled the dynamic VOC profile of blood from a chemical standpoint, where significant changes occurred in the VOC profile which made certain ages distinguishable from each other. DeGreeff et al. [5] conducted a study on these changes in blood VOCs, focusing on the VOC profiles over the course of multiple weeks as well as on canine detection capabilities during the same timeframe. The results of the chemical analysis indicated a distinction between fresh and aged blood and was supported by poor detection of fresh blood by canines trained solely to aged blood. The implication was that fresh and aged blood produced drastically different VOC profiles and that a lack of training on both types will result in a lack of detection of all blood samples by canines. This fundamental study, displaying these shifts in the VOC profiles, paved the way for further research on additional factors that could affect these profiles with time.
Notably, Forbes et al. [4] conducted a study to understand the effect of age and temperature on the VOC profile of blood, where VOC profiles were distinctly different after 3 weeks. VOCs detected after the first 48 h of collection were seen to consist predominantly of alcohols and ketones, with 1-octen-3-ol being the only compound detected immediately after blood collection. Degraded blood had more complex VOC profiles, including a larger range of chemical classes. The increased alkyl furans, such as 2-pentylfuran, and aldehyde compounds, were only found in degraded samples and could be used to distinguish fresh from degraded blood. Similarly, Rust et al. [3] conducted a study across a 12-month period, which also compared the chemical profile created from human blood, both fresh and aged, this time adding the surface—porous and non-porous—as a variable. Blood sampled from Day 0 and Day 1 had a large number of hydrocarbons and esters, while blood aged for longer than a week presented a large number of nitrogen-containing and sulfur-containing compounds on both surface materials. Both studies highlighted that blood odor profiles go through a chemical change which makes them distinguishable from each other.
Previous research has shown that blood VOC profiles change over time, which has implications for canine detection. Nevertheless, when it comes to SAR in mass disaster or missing persons cases, the first 24–48 h are the most vital to rescue efforts. As previous research primarily focused on decomposing blood on longer timescales, this study was conducted to chemically profile the headspace of blood samples within the first 48 h, sampling every few hours starting immediately after withdrawal. Such research can be applied in the development of more effective training protocols, enhancing the dogs’ ability to detect blood across the different stages of decomposition, and can lead to higher accuracy and efficiency in critical operations.
2. Materials and Methods
2.1. Overview
This study utilized HS-SPME with GC-MS to collect and analyze the odor profile of blood as it ages, starting immediately after collection. Frequent sampling was conducted within the first 48 h to assess whether there was an early divergence in the VOC composition. Statistical analyses, including principal component analysis (PCA), hierarchical cluster analysis (HCA), and multivariate curve resolution using a constrained alternating least squares algorithm (MCR-ALS), were performed on the resulting data to determine when there was differentiation in the VOC profiles. These results were validated with canine trials.
Blood collection was approved by the Florida International University Institutional Review Board (protocol #22-0408) and canine trials were approved by the Florida International University Institutional Animal Cares and Use Committee (protocol #22-085).
2.2. Sample Collection and Aging
Blood was collected by a trained phlebotomist via venipuncture into Vacutainers (plastic collection tube, 6.0 mL, BD Vacutainer®) containing no anticoagulant. Three subjects, aged 25–45 years, donated blood for this project. Volunteers were not asked to change any of their normal routine; diet, cleaning routines, and other factors that may affect blood and its odor were not considered.
Immediately after blood collection, the vacutainers were transported to the lab and 1.5 mL of blood was transferred into an 8 oz glass mason jar in triplicate, with an 8–10 min delay from withdrawal to sealing the jar for sample equilibrium after collection. Another mason jar was prepared with 1.5 mL of Nerl Blood Bank Saline (phosphate-buffered saline, 7.0–7.2 pH, Thermo Scientific) to serve as a negative control. The samples were aged for 2 weeks in an indoor laboratory environment.
VOC profiles were extracted from all blood samples at specific time points, with more frequent sampling within the first 48 h. During sampling times, the mason jars were closed to contain the odor, but between sampling the jars were left open to allow for exposure to air for natural decomposition at room temperature. The VOCs were extracted at hours 1, 2, 3, 4, 8, 16, 24, 32, 40, 48, 72, 96, 120, 168 (week 1), and 336 (week 2). Due to the equilibrium and extraction times, for the first four hours the jars were closed for the duration of the four hours.
2.3. Headspace Extraction and Instrumental Analysis
SPME was the chosen method for the collection of the headspace of blood. A 50/30 µm divinylbenzene/carboxen/polydimethylsiloxane (DVB/CAR/PDMS) (Supelco) fiber was selected based on the number of studies that have considered this fiber for blood, human remains, and human scent VOC collection [3,4,6,7,8,9,10,11,12]. An equilibrium time of 0.25 h and an extraction time of 1 h were selected based on maximum peak area and reproducibility.
1,4-dibromobenzene (98%, Thermo Fisher Scientific) was used as an externally sampled internal standard (ESIS) [13]. For this purpose, 10 mg of 1,4-dibromobenzene was added to a separate 8 oz canning jar (Ball), which was then closed for at least 5 min to reach equilibrium. The fiber was exposed to the ESIS for 10 s immediately following the blood headspace extraction. To ensure complete removal of the ESIS from the SPME fiber, it was directly immersed in methanol for 10 s after injection of the sample and thermally desorbed for two 4 min sessions at 270 °C to clean it.
After sample extraction via SPME, the fiber was thermally desorbed and analyzed by a GC/MS system (Agilent 8890 GC System/5977B MSD) using an Rtx-Volatiles column (30 m × 0.25 mmID × 1 µm df; Restek). The sample was thermally desorbed from the SPME fiber in the GC inlet in splitless mode and at a temperature of 250 °C for 4 min at a flowrate of 1.945 mL/min. The GC oven started at 35 °C and was held for 1 min, then it was ramped at a rate of 8 °C/min until 100 °C, ending with a ramp rate of 20 °C/min until 240 °C. The MSD transfer line was set to 250 °C and the mass range was m/z 50–550.
The data collected included the peak abundance of all VOCs present across all blood samples, excluding those found in blank samples, which was reported as a ratio of the peak area of the compound to that of the externally sampled internal standard (A/E). Peak areas were determined using the AMDIS software version 2.73, which deconvolutes complex chromatograms with overlapping peaks. All reported VOCs were initially identified by comparison to the NIST 20 Mass Spectral library. Compounds found in common between at least two subjects were confirmed by comparison to the retention time of chemical standards, including of 1-butene (10% in hexane, TCI), 2-ethyltoluene, 2,4,4-trimethyl-1-pentene, 2-methylpentane, 3-methylpentane, and valeraldehyde (≥97%, TCI), 2-heptanone, 6-methyl-5-hepten-2-one, benzaldehyde, decanal, ethylbenzene, hexanal, methylcyclopentane, nonanal, octanal, o-xylene, p-xylene (≥98%, Sigma-Aldrich), acetone and cyclohexanone (99%, Thermo Fisher Scientific), and (+)-limonene (97%, Acros Organics). One key compound (retention time 11.0391 min) present in all blood samples could not be identified using the available standards.
2.4. Chemometric Analysis
Chemometric analysis techniques, including principal component analysis (PCA), hierarchical cluster analysis (HCA), and multivariate curve resolution using the constrained alternating least squares algorithm (MCR-ALS), were applied to the data collected. A targeted approach to data analysis was employed on the datasets. The datasets were composed of matrices used for the chemometric analysis, which were of size M × N, where M (rows) was the sampling time and N (columns) was the relative abundance (A/E) of the identified compounds. This was carried out for four different datasets—one inter-subject dataset, which only included compounds that were in common between all subjects and was an average of all triplicate samples from all three subjects, and three intra-subject datasets for each subject, which included all compounds present in that subject’s blood headspace samples from all triplicate samples.
PCA was carried out using each of the matrices to identify trends and begin to group data points into clusters. This method was used for dimension reduction in these large matrices to determine categories of otherwise uncategorized data. Preprocessing was performed to auto-scale the relative abundance between the compounds of various relative amounts. Afterwards, PCA plots were generated for each dataset. HCA was then performed to cluster the data based on the distance between points and an elbow method, which plots the within-cluster sum of squares, was utilized to ascertain the optimal number of clusters in the PCA. Based on this information, each PCA plot was grouped into clusters to determine statistically significant changes in the VOC profile using the elbow method. This utilized the within-cluster sum of squares to assess the optimal number of clusters. Clusters were labeled considering at least two stages of decomposition—a minimum of one fresh and one aged VOC profile. Preprocessing and PCA were conducted using Solo, version 9.2.1 (Eigenvector Research Inc., Wenatchee, WA, USA), while HCA used R Studio (R version 2023.12.1+402).
Lastly, MCR-ALS was employed utilizing MCR-ALS Matlab Graphic User Interface (GUI) to determine the impact of the VOC profile stages over time [14]. It can be applied to a number of complex analytical samples with many components or chemical interferences, including but not limited to spectra, time profiles, or concentration profiles. MCR-ALS is a soft method that is used to resolve multicomponent data of unknown or complex mixtures based on the contribution of the pure components of the mixture. This technique uses information from the dataset to determine the pure components with Singular Value Decomposition (SVD), as well as using the Pure variable detection method and the Evolving Factor Analysis (EFA) method, without additional information. The components can be defined manually, if they are known, as was done in these cases [15,16]. Information from the PCA was used to select the pure components based on the stages of decomposition determined, which meant selecting one of the sampling time points within the cluster to represent the pure component (fresh—Hour 3, intermediate—Hour 24, aged—Hour 120). MCR-ALS treatment was carried out for each matrix and to display the evolution of the components in the headspace of blood. To produce decipherable results, ALS was enforced to optimize the data and constraints also needed to be enforced (non-negativity [negative elements are not allowed in profiles], closure equal to 1 [the mass balance condition is fulfilled]).
2.5. Canine Testing
To validate the results of the chemical analysis, canine trials were conducted using blood of four ages—fresh (1–2 h old), intermediate (10–12 h), aged (34–36 h), and very aged (3 and 4 months old). Four canines were utilized in this study, including both HRD and SAR disciplines (Table 1).

Table 1.
Canine Information.
Testing was divided into two trials, one taking place at the F1RST’s Hellen A. Rich K9 Research and Training Campus and the other at Florida International University. Despite the different locations, both trials were conducted in the same manner and were performed indoors (room temperature, no wind). During the trial, canines were presented with a total of nine line-ups, each consisting of five metal cans (1 quart, 10.20 cm × 12.25 cm), and divided into three groups of three line-ups. Each can contained a smaller metal tin (6.20 cm × 2.00 cm) with five holes drilled into the lid to allow the odor to escape but concealing the sample from view. Of the nine line-ups, one line contained no targets. The other eight line-ups contained one target odor (human blood of a given age), one negative control (saline aged for the same time as the blood), one non-target odor (listed below), and two blanks (cans and tins only). The order of these samples was determined using a random number generator.
To prepare the target odor samples, 3–4 drops of human blood were collected on gauze via finger prick using a lancet and placed in an open metal tin to allow a natural aging process before the trial. Very aged blood samples were not collected in the same manner—they were procured from leftover blood from the laboratory analysis (venipuncture into Vacutainers) and stored in the fridge for 15 days before the canine trial. All human blood samples consisted of two separate samples from different individuals for each age (fresh, intermediate, aged, and very aged), totaling to eight target samples from eight separate individuals for each trial.
Negative control samples were prepared in the same manner and time as blood samples, using 3–4 drops of saline. Non-target odor samples included aged cow blood (prepared the same as human blood); peanut butter—later replaced with vegan cookie after the first trial; sharpie ink on a sticky note; tape; clean gauze; nitrile gloves; cleaning wipes; and plastic pipettes. Blanks consisted of only empty metal tins.
The set up was maintained as double-blind where neither the handler nor the assessor was aware of the correct location of the targets. A test administrator was available out of sight of both the handlers and assessor to confirm a correct canine alert and allow the handler to reward their canine. Handlers were given the option to run their canines on or off-lead. All alerts were recorded by the assessor, which were used to calculate true positive (TP) rates of the blood samples and false positive (FP) rates of non-targets, determined by dividing the total number of alerts by the total number of samples per category—blood targets for TPs and non-targets/all other samples for FPs. The positive predictive value (PPV) for each blood age (fresh, intermediate, aged, and very aged) was also calculated using the TP and FP rates using the formula .
3. Results
The results of this study aim to provide a holistic view of early blood decomposition by assessing the presence and absence of specific VOCs and through statistical differentiation of stages of decomposition (e.g., fresh or aged). This was accomplished through both inter- and intra-subject VOC profiles derived from decomposing blood, which included VOCs in common between subjects or all VOCs found for a specific subject, respectively. Although discrimination between inter- and intra-subject VOCs was not the focus of this research, VOCs unique to specific subjects could have potential impacts on canine discrimination, particularly in early stages of decomposition where there is more disparity between subjects due to differing environmental and lifestyle influences [8].
3.1. VOC Analysis
During the 2-week aging period, all VOCs which were present across all experimental blood samples (not blanks) were recorded over the sampling period as either present or absent (Table 2) with an alternative version of the table indicating the relative abundance of each compound found in the Supplemental Materials (Table S1). These compounds were detected in at least one sample and those with a * were present in at least two samples. There were several compounds that recurred throughout the entire 2-week sampling period, which included octanal, nonanal, benzaldehyde, ethylbenzene, p-xylene, o-xylene, 1-ethyl-2-methylbenzene, d-limonene, hexane, 3-methylpentane, acetone, cyclohexanone, and 6-methyl-5-hepten-2-one. Several compounds appeared in nearly all sampling hours—2-methylpentane (not detected at Hour 24), acetophenone (Hours 24 and 32), an unknown aromatic compound (Hour 72), and methylcyclopentane (Hours 120 and 168).
Table 2.
Volatile organic compounds detected in the headspace of blood over time, organized by compound class.
In the early sampling points, some VOCs, primarily hydrocarbons and sulfides, were present and then no longer detected—decane (no longer detected after Hour 2), 2,2- dimethylpentane (Hour 3), 1-butene (Hour 4), tetrahydrofuran (Hour 8), dodecane (Hour 8), propylbenzene (Hour 16), 2,4,4-trimethyl-1-pentane (Hour 16), allyl methyl sulfide (Hour 16), cyclohexanol (Hour 24), carbon disulfide (Hour 24), and 2-heptanone (Hour 32). Meanwhile, there were other VOCs which appeared only in the later sampling times, which included hexanal (first detected at Hour 16), toluene (Hour 24), pentanal (Hour 24), 1-butanol (Hour 32), 1-pentanol (Hour 40), decanal (Hour 48), and 1-propanol (Hour 72).
The VOCs were also monitored semi-quantitatively to assess fluctuations in the relative abundance of the compounds (represented as a ratio between the peak area of the compound to the peak area of the internal standard) over time using only the compounds confirmed with standards. The stacked bar graph in Figure 1a illustrates the relative abundance of all inter-subject VOCs, which demonstrates a noticeable decrease between Hour 4 and Hour 8. This was likely due to opening containment after complete closure for the first four hours which allowed the headspace to build during the four hours. An alternative representation is shown in Figure 1b, which is a normalized stacked bar graph. There are some apparent visual changes in the composition of the VOC profiles as the blood ages, with three possible discernible stages from Hours 1–4, Hours 8–24, and Hours 32–336 (Figure 1b). The composition of the first four hours appeared very similar and were primarily dominated by o- and p-xylene, ethylbenzene, 2,4,4-trimethyl-1-pentene, methylcyclopentane, and hexane. These compounds, with the exception of 2,4,4-trimethyl-1-pentene, were present throughout the entire sample period, but no longer dominated the profile. In Hours 8, 16, and 24, they were seen to decrease in percentage. By Hour 32, the primary compounds were nonanal, cyclohexanone, and hexanal. Hexanal did not appear in the earlier samples, though nonanal and cyclohexanone were present the entire time.

Figure 1.
(a) Average peak area ratios and (b) relative abundance of inter-individual blood VOCs over time (n = 3).
3.2. Chemometric Analysis
Chemometric analysis was conducted to visualize patterns and determine statistically significant changes in the VOC profiles and thus define the stages of blood decomposition over the course of two weeks. PCA and MCR-ALS were used in tandem for both the inter-subject data and one intra-subject data, while the remaining intra-subject graphs can be found in the Supplementary Materials.
3.2.1. PCA
PCA was used to plot the VOC profiles at different time points. Clusters were determined using HCA and the elbow method, which indicated the optimal number of clusters (Figure S1).
Examination of inter-subject blood VOCs illustrated a clear separation of two distinct VOC profiles or decomposition stages—a fresh stage consisting of Hours 1–4 and an aged stage, Hours 8–336 (Figure 2a). Data points within both the fresh and aged clusters are spread apart, showing a large degree of variation between the time points. The loading plot conveys which variables contribute to the distinction between clusters, which in this case showed which VOCs had a higher concentration in the data points; the VOCs displayed in the loading plot have a higher concentration in the points that lie in the same zone. Based on the loading plot for the inter-subject VOCs, there are six VOCs which have a higher abundance in the aged cluster—pentanal, hexanal, 6-methyl-5-hepten-2-one, octanal, nonanal, and decanal—while the remaining VOCs are higher in the fresh cluster (Figure 2b).
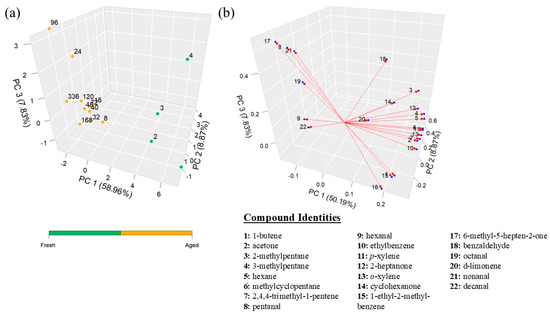
Figure 2.
Statistical analysis of inter-subject blood VOCs: (a) PCA plot in hours and (b) loadings plot. The numbers on the loading plot correspond to the VOC in the dataset listed to the right.
A slightly different result was obtained when the PCA was conducted on intra-subject datasets as additional VOCs only appearing in each subject were considered, which likely provided more variation in the timepoints. The PCA plot of Subject 2 contained four clusters based on HCA and thus was separated into four different stages—2 fresh stages (Fresh 1—Hours 1 and 2 and Fresh 2—Hours 3 and 4), an intermediate stage (Hours 8–40), and an aged stage (Hours 48–336) (Figure 3a). When examining the loading plot, there were specific groups of compounds associated with each stage (Table 3). Similar trends were also seen in the other individuals, with the only exception being differences in the split between the two fresh clusters (Figures S2 and S3).
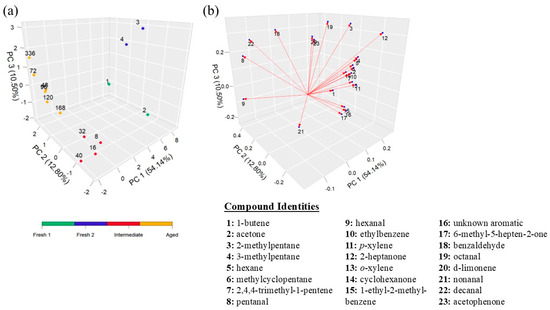
Figure 3.
Statistical analysis for Subject 2 blood VOCs: (a) PCA plot in hours and (b) loadings plot. The numbers on the loading plot correspond to the VOCs in the dataset listed to the right.
Table 3.
VOCs associated with clusters in PCA in Subject 2.
3.2.2. MCR-ALS
MCR-ALS was also carried out to further understand the transition from the VOC profile of fresh blood to aged blood. Pure components were assigned to an algorithm to assess the change in the relative composition of these stages of decomposition (fresh, intermediate, and aged) over time. Based on the time points that fell into each cluster in the PCA, stages were identified and pure components from each stage were selected during MCR-ALS analysis. There were two stages (fresh and aged) for the inter-subject data and three (fresh, intermediate, and aged) for intra-subject data. These pure components are composed of VOCs that were present at a specific time within the stage or cluster (Table 4). Since most VOCs are present in all stages, with a few exceptions, the algorithm also took into account the relative amount of each one. Pure components were assigned to fresh (Hour 3), intermediate (used for intra-subject comparisons only; Hour 24), and aged (Hour 120) profiles as these were the best time points in the previously mentioned clusters (Figure 4 and Figure 5). This was determined based on successive experimentation for appropriate and logical results.
Table 4.
VOCs associated with pure components for decomposition stages in MCR-ALS analysis, for inter-individual blood VOCs. (X inclusion of compound).
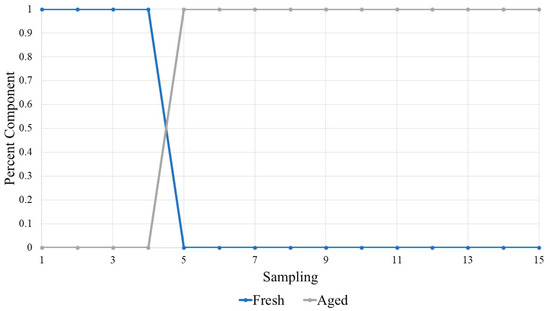
Figure 4.
MCR-ALS plot of inter-subject blood VOCs. Here, the x-axis is the sampling number, rather than time, so that the trend can be seen; Point 1 refers to Hour 1, Point 5 to Hour 8, and Point 15 to Hour 336. This illustrates the blood VOC profiles as a mixture of different aged components, with Hour 3 as a pure fresh component and Hour 120 as the pure aged component.

Figure 5.
MCR-ALS plot of intra-subject blood VOCs for Subject 1. Here, the x-axis is the sampling number rather than time so that the trend can be seen; Point 1 refers to Hour 1, Point 5 to Hour 8, and Point 15 to Hour 336. This illustrates the blood VOC profiles as a mixture of different ages, with Hour 3 as a pure fresh component, Hour 24 as a pure intermediate component, and Hour 120 as a pure aged component.
The analysis of inter-subject VOCs provided unambiguous evidence for the separation between fresh and aged stages (Figure 4). In this case, the graph demonstrates that the VOC profiles are dominated by the fresh component, while the aged component is at 0%, during the first four time points, or Hours 1–4. After which the fresh component drops to 0% and the aged component then is the most abundant for the remaining time points, Hours 8–336.
When considering intra-subject VOC profiles for Subject 1, the first four time points were also dominated by the fresh profile but then began to decrease and was no longer seen by Hour 24 (Point 7) (Figure 5). There was a peak in the intermediate profile from Hour 8 to 24 (Points 5–7), which decreased as the aged profile began to take over. Then, until approximately Hour 48, there was some mixture between the aged and intermediate profiles, after which the aged profile dominated (>70%) the time points from Hours 48–336 and the intermediate profile dropped to almost zero (<30%). Similar trends were seen in the other two subjects, except for Subject 2, as data for Hour 24 could not be collected, which would have been necessary for tracking the intermediate profile (Figures S4 and S5).
3.3. Canine Testing
Canine detection of varying ages of blood was essential to this study to assess whether their detection behavior could be correlated to the results of the chemical—i.e., that there is a fresh and aged odor profile, with an intermediate or mixture in between. Four canines trained to blood as part of their regular training were presented with varying ages of blood—fresh (1–2 h old), intermediate (10–12 h old), aged (34–36 h old), and very aged (3 and 4 months old). The results of the trial are given in Figure 6. False positive rates ranged from 6% to 9%, significantly lower than the rate of detection of the target samples, indicating the significance of the detection of the blood samples. Since PPVs closer to 100% are ideal, the most readily located sample was aged blood, with a detection rate of 75% and PPV of 67%, though not as close to 100% as would be desired. The intermediate-aged blood was located not much better than chance (PPV = 57%). All other samples were insignificant (PPV < 50%). Therefore, the canines were not able to recognize the fresh blood samples, compared to aged, after training solely on blood and remains materials more than 24 h in age. Despite this, the rate for the very aged samples was also lower than expected. Aged blood detection had the best results and best detection in the field, while the fresh, intermediate, and very aged (refrigerated) blood stages were unreliable.
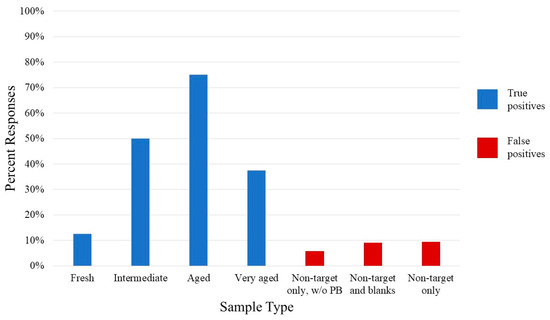
Figure 6.
Percentage of positive responses by HRD/SAR canines to blood samples. The blue bars represent the true positives to human blood samples of various ages, while the red bars represent the false positives for all other samples.
4. Discussion
Based on the results seen above, the evolution of VOCs from early blood decomposition in an indoor laboratory environment was evaluated to understand substantial shifts in VOC profiles with aging that may negatively affect canine detection of blood. Chemical and statistical analyses, as well as canine detection testing, were carried out to determine the point where there is a shift in the VOCs sufficient to cause differentiation. Despite variation on exact timeframes, laboratory analysis consistently identified two distinct odor profiles during the first 48 h of aging: an initial a fresh profile followed by an aged profile. A summary of the age groups determined by each technique used in this study as well as the overall conclusions can be seen in the table below (Table 5).
Table 5.
Summary and conclusions of early decomposition stages for blood based on orthogonal techniques—chemical analysis, chemometrics, and canine olfactory testing. Table gives approximate blood age in hours for each stage of early decomposition of blood under laboratory conditions—fresh, intermediate, and aged.
All techniques used in this study determined that the fresh stage of blood decomposition occurred during Hours 1–4. Additionally, they all identified a change in the VOC profile after the first four hours, resulting in a second, aged stage of decomposition; however, the exact point at which this change occurs is inconsistent. Most techniques also denoted that there was an evolution from fresh to aged, the evolution being an intermediate stage of decomposition, which is likely not a separate, unique VOC profile but a transitional period consisting of a mixture of fresh and aged components.
Despite a consistent, clear identification of a fresh VOC profile from Hours 1–4, these results may have been impacted by the experimental design. All samples had an equilibration time of one hour and the lid was not removed from the sample between the first four samples, while it was removed in between all other sampling times. This could account for the high relative abundance or similarities detected in Hours 1–4, which in turn likely impacted the chemometric results as well. From Hour 8 to Hour 336, there are only slight variations in abundance. Despite this, Hour 1, which had the same equilibrium time as the remaining time points, was still significantly higher in relative abundance as compared to Hours 8–336, suggesting that there is at least a distinct fresh VOC profile in Hour 1.
Separation between the fresh and aged VOC profiles in the chemical analysis was determined based on the percent composition of individual VOCs and presence or absence of VOCs. Merely the presence/absence did not demonstrate the full separation, as there were some VOCs in higher or lower concentrations in different stages which remained present throughout the entire 2-week sampling period. Fresh profiles were dominated more by aromatics and hydrocarbons, while alcohols, aldehydes, and ketones (specifically 6-methyl-5-hepten-2-one) were more indicative of aged profiles (Table 1, Figure 1b). This is validated through previous research that has established aldehydes and additional VOCs (sulfides and ketones) as being characteristic of degraded or aged blood [4,17,18]. The fresh stage is not as straightforward. Not only is this not as heavily researched, but there is a lot of variation in the classes of compounds detected, likely due to individual variation between the subjects tested. Fresh blood, around 0–1 days old, has been seen to predominantly contain acids, alcohols, ketones, and some hydrocarbons [3,4,17,18]. Additionally, research on early cadaver VOCs displays similar conclusions—aldehydes dominating in the middle stage of decomposition and hydrocarbons in the early stages [19]. Also important to note is the detection of 6-methyl-5-hepten-2-one, which has previously been reported as associated with human skin emissions, specifically from the oxidative degradation of squalene [20]. While this is likely still due to this degradation, this study proves it cannot be purely associated with human skin and can be detected in VOCs from blood decomposition.
The chemometric analysis in this study suggested an impact on decomposition stage separation when intra-subject specific VOCs were considered. Inter-subject VOCs revealed only two stages of decomposition (fresh and aged) while the intra-subject results showcased more stages (fresh, intermediate, and aged). While there was separation in all intra-subject PCAs in the fresh stage (fresh 1 and 2), this was identified only as individual variation and not a reason to consider separate stages within the first four hours. This was evident from two factors—an inconsistency regarding which time points fell into fresh 1 or 2 (Figure 3a, Figures S1 and S2), and most early VOCs only belonging to one subject (Table 2). It is theorized that most of the VOCs related to lifestyle, and thus more unique to the individual, are volatilizing off the sample first, within the first few hours, and are no longer present for the remainder of the time. This can also be confirmed by previous research by the lack of consistency in dominant chemical class, as stated above.
Both intra-subject PCA and MCR-ALS displayed a separation of the intermediate stage of blood decomposition. Despite this, it was variable between all subjects; all datasets indicated that this stage began at Hour 8, but the end of the stage fluctuated between Hours 32–40 and appeared as more of a mixture between the stages. The PCA plots illustrated an intermediate cluster falling in between the fresh and aged clusters, often shifting closer to the aged with each increase in hour (i.e., Hour 32 is closer to the aged cluster than Hour 8) (Figure 3a, Figures S1 and S2). While the MCR-ALS did include a separate intermediate component, it was seen as a mixture rather than being nearly pure intermediate like the fresh and aged components (Figure 5). Thus, there is an evolution of the profile over the course of the 2-week study, similar to the results from the VOC analysis, with a transformation from fresh blood to aged blood in between. Specifically, the profiles were nearly entirely composed of a pure fresh component for the first 4 h, a nearly pure aged component from Hours 48–336 (Figure 5 and Figure S4), and mixing in between.
Based on the chemometric results, there are two possible distinctions in VOC profiles during the 2-week aging which could affect canine detection—one which suggests only two VOC profiles and the other suggesting three. Should canines pick up on the odor profile as a whole (inter-subject data), considering even VOCs which do not consistently appear (VOCs unique to individuals, i.e., intra-subject data), then they might have difficulty detecting both fresh and intermediate-aged blood. Based on the intra-blood MCR-ALS plots, canine detection of pure aged blood (older than 48 h) may be better when only trained to aged blood and some possible detection of the intermediate/mixture phase due to the appearance of some aged components. If, however, canines generalize to only blood-specific VOCs (inter-subject data) and do not consider minute changes (intra-subject data), then they should be able to detect all time points except for the first 4 h. While there is fluctuation between the results seen in all three intra-subject datasets, some preliminary conclusions about what may be seen as the transition to distinct VOC profiles are provided. The conclusions drawn from this study, however, may have been affected by the limited number of subjects examined. Further inter-laboratory studies with more datasets from more than three donors would need to be conducted to confirm the results seen here.
Much like the chemometric analysis, canine trials results displayed two distinct odor profiles of blood, fresh (Hours 1–2) and aged (Hours 34–36), and a transition/mixture in between to form an intermediate profile. The high level of detection of aged blood and low detection of fresh blood strongly suggested that these are distinct odor profiles to canines, in agreement with the chemical analysis. Detection rates for the intermediate samples fell in between those for the fresh and aged, signifying more familiarity than fresh samples but not as much as the aged. This agrees with the MCR-ALS conclusions, which implied a mixture rather than completely one or the other. Detection of fresh and intermediate aged blood should theoretically improve if canines train with fresh blood samples.
The very aged samples in the canine trial had limited detection (below 50%), which was likely due to the storage of samples for the study; they were kept refrigerated for a prolonged period (3–4 months) in which they were not allowed to aerate periodically, which is different from canine training scenarios where aids are removed from storage periodically. This should not take away from implications that canines recognize fresh blood as dissimilar to aged. However, in order to determine that these results were impacted by this limitation, another trial would need to be conducted.
Overall, this study aimed to determine the transformation of VOCs during early decomposition, specifically in application for HRD, SAR, and BDDs. This provides a key piece of information for human remains decomposition, as these results could signify a similar early change and transformation of cadaver VOCs within the first 48 h after death. While previous research on early cadaver decomposition varies due to many factors (environment, donors, timeframe tested, etc.), early transitions in the VOC profile have similarly been detected. Two studies conducted by Patel et al. have tackled identification of early post-mortem VOC changes via two-dimensional GC, which has indicated transitions as early as 14 h all the way to 3 days after death. Though the results were not consistent, conclusions were drawn—decomposition is a dynamic and continuous process and thus can be characterized as an evolution rather than distinct stages [20,21]. This highlights the significance of these results as they can be paired to human remains. Though further research with similar sampling frequency would need to be conducted, there is likely a similar process which occurs in cadaver VOC profiles—distinct profiles early on with a transitional, dynamic change.
5. Conclusions
This study intended to evaluate the early evolution of blood VOC profiles following the first 48 h after removal to determine significant changes that may affect canine detection of blood with implications for the training and deployment for SAR or HRD canines. The PCA and MCR-ALS results both demonstrated a very clear distinction for inter-blood VOC profiles four hours after collection, resulting in a fresh VOC profile from Hours 1–4 following a blood draw which then evolved into an aged VOC profile. The stark difference in total peak area ratio between Hour 4 and Hour 8 is likely due to experimental design, but the ratios of VOCs remained consistent. While Hours 1–4 may be completely accurate in ratios, the first hour still falls into a fresh profile which is distinct from the aged VOC profiles. Key indicators of aged blood were determined by an increase in the abundance of aldehydes, whereas fresh blood had a higher peak area ratio of o- and p-xylene, ethylbenzene, 2,4,4-trimethyl-1-pentene, methylcyclopentane, and hexane. Intra-blood VOCs indicated slightly different results where there was an evolution between fresh and aged profiles. The addition of compounds unique to individuals displayed clustering of an intermediate VOC profile, one that is likely a mixture between fresh and aged components. Canine trials validated these observations with maximum detection of aged blood samples at 34–36 h old and almost no detection of fresh blood samples at 1–2 h old by canines not previously trained with fresh materials. This proves that while the laboratory experimental design might be flawed, blood only a few hours old has a different odor to canines than aged blood. Canines also showed moderate detection of intermediate blood samples, aged 10–12 h. Additional canine trials, where canines are trained to fresh blood only a few hours old, as well as chemical analysis of VOCs in varying environments (outdoor vs. indoor vs. location), should be conducted to better understand if training on fresh blood samples will improve canine detection of all ages of blood.
Supplementary Materials
The following supporting information can be downloaded at: https://www.mdpi.com/article/10.3390/chemosensors13090349/s1, Table S1: Relative abundance of volatile organic compounds detected in the headspace of blood over time, organized by compound class; Figure S1: Dendrogram from hierarchical cluster analysis with optimal number of clusters from Subject 2; Figure S2: Statistical analysis for Subject 1 blood VOCs: (a) PCA plot in hours and (b) loading plot. The numbers on the loading plot correspond to the VOCs in the dataset listed to the right; Figure S3: Statistical analysis for Subject 3 blood VOCs: (a) PCA plot in hours and (b) loading plot. The numbers on the loading plot correspond to the VOCs in the dataset listed to the right; Figure S4: MCR-ALS plot of intra-subject blood VOCs for Subject 2; and Figure S5: MCR-ALS plot of intra-subject blood VOCs for Subject 3.
Author Contributions
Conceptualization, F.W. and L.D.; Methodology, F.W. and L.D.; Software, FW., J.C., and L.D.; Validation, F.W., V.A., and L.D.; Formal Analysis, F.W., V.A., and J.C.; Investigation, F.W. and V.A.; Resources, J.C. and L.D.; Data Curation, F.W. and J.C.; Writing—Original Draft Preparation, F.W.; Writing—Review & Editing, J.C., R.D., and L.D.; Visualization, F.W., R.D., and L.D.; Supervision, L.D.; Project Administration, F.W. and L.D.; Funding Acquisition, L.D. All authors have read and agreed to the published version of the manuscript.
Funding
This research received no external funding.
Institutional Review Board Statement
The study was conducted according to the guidelines of the Declaration of Helsinki, and approved by the Institutional Review Board of Florida International University (protocol code #22-0408, approved September 1, 2022) and the Institutional Animal Care & Use Committee of Florida International University (protocol code #22-085, approved 12/16/22).
Informed Consent Statement
Informed consent was obtained from all subjects involved in the study.
Data Availability Statement
The data presented in this study are openly available in FigShare at: https://figshare.com/projects/Investigation_of_distinct_odor_profiles_of_blood_over_time_using_chemometrics_and_detection_canine_response/260198 (accessed on 13 August 2025).
Conflicts of Interest
The authors declare no conflicts of interest.
References
- Sloane, C.F. Dogs in War, Police Work and on Patrol. J. Crim. Law Criminol. Police Sci. 1995, 46, 385–395. [Google Scholar] [CrossRef]
- Lorenzo, N.; Wan, T.; Harper, R.J.; Hsu, Y.-L.; Chow, M.; Rose, S.; Furton, K.G. Laboratory and Field Experiments Used to Identify Canis Lupus Var. Familiaris Active Odor Signature Chemicals from Drugs, Explosives, and Humans. Anal. Bioanal. Chem. 2003, 376, 1212–1224. [Google Scholar] [CrossRef] [PubMed]
- Rust, L.; Nizio, K.; Forbes, S. The Influence of Ageing and Surface Type on the Odour Profile of Blood-Detection Dog Training Aids. Anal. Bioanal. Chem. 2016, 408, 6349–6360. [Google Scholar] [CrossRef] [PubMed]
- Forbes, S.L.; Rust, L.; Trebilcock, K.; Perrault, K.A.; McGrath, L.T. Effect of Age and Storage Conditions on the Volatile Organic Compound Profile of Blood. Forensic Sci. Med. Pathol. 2014, 10, 570–582. [Google Scholar] [CrossRef]
- DeGreeff, L.E. Use of Canines to Detect Dried Human Blood and Instrumental Methods for the Determination of Odor Profiles. In Proceedings of the American Academy of Forensic Science Meeting, Washington, DC, USA, 18–23 February 2013. [Google Scholar]
- Brown, J.S.; Prada, P.A.; Curran, A.M.; Furton, K.G. Application of Emanating Volatile Organic Compounds from Various Forensic Specimens for Individual Differentiation. Forensic Sci. Int. 2013, 226, 173–182. [Google Scholar] [CrossRef]
- DeGreeff, L.E.; Furton, K.G. Collection and Identification of Human Remains Volatiles by Non-Contact, Dynamic Airflow Sampling and SPME-GC/MS Using Various Sorbent Materials. Anal. Bioanal. Chem 2011, 401, 1295–1307. [Google Scholar] [CrossRef] [PubMed]
- Curran, A.M.; Rabin, S.I.; Prada, P.A.; Furton, K.G. Comparison of the Volatile Organic Compounds Present in Human Odor Using SPME-GC/MS. J. Chem. Ecol. 2005, 31, 1607–1619. [Google Scholar] [CrossRef] [PubMed]
- Caraballo, N.I. Identification of Characteristic Volatile Organic Compounds Released During the Decomposition Process of Human Remains and Analogues. Ph.D. Dissertation, Florida International University, Miami, FL, USA, 2014. [Google Scholar]
- Curran, A.M.; Rabin, S.I.; Prada, P.A.; Furton, K.G. On the Definition and Measurement of Human Scent: Response by Curran et Al. J. Chem. Ecol. 2006, 32, 1617–1623. [Google Scholar] [CrossRef]
- Curran, A.; Prada, P.; Furton, K.G. The Differentiation of the Volatile Organic Signatures of Individuals Through SPME-GC/MS of Characteristic Human Scent Compounds. J. Forensic Sci. 2010, 55, 50–57. [Google Scholar] [CrossRef] [PubMed]
- Gokool, V.; Holness, H.; Furton, K.G. The Influence of Intra-Personal Variations in Human Hand Odor on the Determination of Sample Donor. Forensic Sci. Int. 2022, 334, 111235. [Google Scholar] [CrossRef] [PubMed]
- MacCrehan, W.; Moore, S.; Schantz, M. Reproducible Vapor-Time Profiles Using Solid-Phase Microextraction with an Externally Sampled Internal Standard. J. Chromatogr. A 2012, 1244, 28–36. [Google Scholar] [CrossRef] [PubMed]
- Jaumot, J.; Gargallo, R.; De Juan, A.; Tauler, R. A Graphical User-Friendly Interface for MCR-ALS: A New Tool for Multivariate Curve Resolution in MATLAB. Chemom. Intell. Lab. Syst. 2005, 76, 101–110. [Google Scholar] [CrossRef]
- Sheikholeslami, M.N.; Vasough, M.; Esfahani, H.M. On the Performance of Multivariate Curve Resolution to Resolve Highly Complex Liquid Chromatography–Full Scan Mass Spectrometry Data for Quantification of Selected Immunosuppressants in Blood and Water Samples. Microchem. J. 2020, 152, 104298. [Google Scholar] [CrossRef]
- Juan, A.; Tauler, R. Multivariate Curve Resolution (MCR) from 2000: Progress in Concepts and Applications. Crit. Rev. Anal. Chem. 2007, 36, 163–176. [Google Scholar] [CrossRef]
- Chilcote, B.; Rust, L.; Nizio, K.D.; Forbes, S.L. Profiling the Scent of Weathered Training Aids for Blood-Detection Dogs. Sci. Justice 2018, 58, 98–108. [Google Scholar] [CrossRef] [PubMed]
- Rendine, M.; Fiore, C.; Bertozzi, G.; De Carlo, D.; Filetti, V.; Fortarezza, P.; Riezzo, I. Decomposing Human Blood: Canine Detection Odor Signature and Volatile Organic Compounds. J. Forensic Sci. 2018, 64, 587–592. [Google Scholar] [CrossRef] [PubMed]
- Thurn, B.; Deo, A.; Patel, D.; Sunnucks, E.; Forbes, S.; Stuart, B.H.; Su, S.; Ueland, M. Ante- and Post-Mortem Human Volatiles for Disaster Search and Rescue. Forensic Chem. 2024, 40, 100596. [Google Scholar] [CrossRef]
- Patel, D.; Burr, W.S.; Daoust, B.; Forbes, S. Identifying the Transition from Ante-Mortem to Post-Mortem Odor in Cadavers in an Outdoor Environment. Forensic Sci. Int. Synergy 2025, 11, 100616. [Google Scholar] [CrossRef] [PubMed]
- Patel, D.; Dargan, R.; Burr, W.S.; Daoust, B.; Forbes, S. Identifying the Early Post-Mortem VOC Profile from Cadavers in a Morgue Environment Using Comprehensive Two-Dimensional Gas Chromatography. Separations 2023, 10, 566. [Google Scholar] [CrossRef]
Disclaimer/Publisher’s Note: The statements, opinions and data contained in all publications are solely those of the individual author(s) and contributor(s) and not of MDPI and/or the editor(s). MDPI and/or the editor(s) disclaim responsibility for any injury to people or property resulting from any ideas, methods, instructions or products referred to in the content. |
© 2025 by the authors. Licensee MDPI, Basel, Switzerland. This article is an open access article distributed under the terms and conditions of the Creative Commons Attribution (CC BY) license (https://creativecommons.org/licenses/by/4.0/).