Article

Synthesis, Characterization, and Evaluation of Photocatalytic and Gas Sensing Properties of ZnSb2O6 Pellets

by
Jacob Morales-Bautista
1,
Héctor Guillén-Bonilla
1,*,
Lucia Ivonne Juárez-Amador
1,
Alex Guillén-Bonilla
2,
Verónica-María Rodríguez-Betancourtt
3,
Jorge Alberto Ramírez-Ortega
3,
José Trinidad Guillén-Bonilla
4 and
María de la Luz Olvera-Amador
5
1
Departamento de Ingeniería de Proyectos, Centro Universitario de Ciencias Exactas e Ingenierías, Universidad de Guadalajara, M. García Barragán 1421, Guadalajara 44410, Jalisco, Mexico
2
Departamento de Ciencias Computacionales e Ingenierías, Centro Universitario de los Valles, Universidad de Guadalajara, Carretera Guadalajara-Ameca Km 45.5, Ameca 46600, Jalisco, Mexico
3
Departamento de Física, Centro Universitario de Ciencias Exactas e Ingenierías, Universidad de Guadalajara, M. García Barragán 1421, Guadalajara 44410, Jalisco, Mexico
4
Departamento de Electro-Fotónica, Centro Universitario de Ciencias Exactas e Ingenierías, Universidad de Guadalajara, M. García Barragán 1421, Guadalajara 44410, Jalisco, Mexico
5
Departamento de Ingeniería Eléctrica-Seccion de Electronica del Estado Solido, Centro de Investigación y de Estudios Avanzados del Instituto Politécnico Nacional, Av Instituto Politécnico Nacional 2508, San Pedro Zacatenco, Gustavo A. Madero, Mexico City 07360, Mexico
*
Author to whom correspondence should be addressed.
Chemosensors 2025, 13(9), 329; https://doi.org/10.3390/chemosensors13090329
Submission received: 11 July 2025 / Revised: 15 August 2025 / Accepted: 29 August 2025 / Published: 2 September 2025
(This article belongs to the Special Issue Advanced Chemical Sensors for Gas Detection)

Abstract

This work reports a low-cost, microwave-assisted wet chemistry synthesis of zinc antimonate (ZnSb2O6) powders with a trirutile structure, yielding highly homogeneous, nanometric particles. X-ray diffraction (XRD) confirmed the formation of the trirutile phase with lattice parameters of a = 4.664 Å and c = 9.263 Å, and an estimated crystallite size of 42 nm. UV–vis spectroscopy revealed a bandgap of 3.35 eV. Scanning electron microscopy (SEM) showed that ethylenediamine, as a chelating agent, formed porous microstructures of microrods and cuboids, ideal for enhanced gas adsorption. Brunauer–Emmett–Teller (BET) analysis revealed a specific surface area of 6 m2/g and a total pore volume of 0.0831 cm3/g, indicating a predominantly mesoporous structure. The gas sensing properties of ZnSb2O6 pellets were evaluated in CO and C3H8 atmospheres at 100, 200, and 300 °C. The material exhibited high sensitivity at 300 °C, where the maximum responses were 5.86 for CO at 300 ppm and 1.04 for C3H8 at 500 ppm. The enhanced sensitivity at elevated temperatures was corroborated by a corresponding decrease in electrical resistivity. Furthermore, the material demonstrated effective photocatalytic activity, achieving up to 60% degradation of methylene blue and 50% of malachite green after 300 min of UV irradiation, with the process following first-order reaction kinetics. These results highlight that ZnSb2O6 synthesized by this method is a promising bifunctional material for gas sensing and photocatalytic applications.

1. Introduction

ZnSb2O6, also known as ordoñezite, is a mineral first discovered by G. Switzer and W. F. Foshag at the Santín mine, Guanajuato, Mexico [1,2]. This compound has been synthesized and reported as an n-type semiconductor oxide due to its electron (e) charge carrier mobility [3,4]. ZnSb2O6 fits the general formula AB2O6 for trirutile-type crystal structures [5], where A can be substituted with divalent ions such as Mg2+, Ca2+, Mn2+, Co2+, Cu2+, and Zn2+, while B can be occupied by pentavalent cations like Sb5+ or Ta5+ [6]. Specifically for ZnSb2O6, site A is occupied by the divalent zinc ion (Zn2+) and site B by the pentavalent antimony cation (Sb5+) [7,8]. ZnSb2O6 belongs to the antimonate family characterized by trirutile crystal structures [9]. It is isomorphous with MgSb2O6 (Byströmite) [1], as both belong to the P4/mnm space group with cell parameters of a = 4.68 Å and c = 9.21 Å [9]. According to references [10,11], the crystal structure of ZnSb2O6 is composed of SbO6 octahedra that share edges along the c-axis. These, in turn, share corners with other SbO6 octahedra, and both Zn and Sb atoms are octahedrally coordinated by six oxygen atoms [11,12]. This electronic arrangement gives rise to interesting physical and chemical properties that depend on the oxide’s synthesis process [12,13].
Various wet chemistry processes, which are simple and easy to implement, have been employed to prepare ZnSb2O6. Roper et al. [1] prepared the oxide using the Bystrom method, obtaining the parameters mentioned above. However, other authors have synthesized the compound through alternative routes such as the colloidal method [13], solid-state reaction (ceramic method) [14], sol–gel [15], microwave-assisted solution method [16], hydrothermal method [17], precipitation method [18], and a simple sonochemical process [11]. Despite this variety, many of these routes require high calcination temperatures, often exceeding 800 °C, which increase energy consumption and can lead to undesirable particle sintering, thereby reducing the effective surface area for sensing and photocatalytic applications. According to such reports, those preparation routes enable the production of particle sizes smaller than 100 nm and various morphologies, including nanoparticles, nanorods, nanowires, nanospheres, and nanodiscs [7,19,20,21], among others.
Overall, chemical methods have enabled the synthesis of nanostructures with specific morphological characteristics at relatively low temperatures (below 1000 °C). These methods limit excessive particle growth by increasing the specific surface area of the material [7,19]. This results in better particle dispersion and greater uniformity in size distribution, which are fundamental aspects for improving the material’s efficiency in applications such as chemical gas sensors and photocatalysis [19,20,21,22].
These microstructural features significantly impact the properties of ZnSb2O6, including its electrical, thermal, optical, and carrier density properties [4,11,23]. As a result, ZnSb2O6 emerges as a promising candidate in photocatalysis, since the limited literature suggests that its unique properties could be effectively exploited for such applications [10,11]. Due to this, the oxide has also been applied in anti-static agents for plastics, in lithium-ion batteries (LIBs), in supercapacitors (SCs), and in solar cells [4,7,8,11,23].
On the other hand, ZnSb2O6 has also been reported as a potential gas sensor. For instance, in reference [15], thick films made from nanostructured ZnSb2O6 powders were successfully tested in CO, O2, and CO2 atmospheres. In that study, a good dynamic response is reported by applying frequencies from 0.1 to 100 kHz at 400 °C. In contrast, in reference [16], pellets were fabricated and subjected to static atmospheres of CO and C3H8. Good thermal stability and high sensitivity (6.66 for CO and 1.2 for C3H8) were reported at a concentration of 300 ppm and a temperature of 250 °C. Similarly, in reference [24], thick films of ZnSb2O6 were prepared via the dip-coating method, yielding good stability and selectivity in H2S concentrations; the favorable response was attributed to the porosity of the films. Considering these findings, the good dynamic response, high sensitivity, and thermal stability of ZnSb2O6 in various atmospheres are attributed to the microstructure obtained during the preparation process.
To overcome the challenge of high calcination temperatures, this work reports a microwave-assisted wet chemistry method that successfully yields the pure trirutile phase of ZnSb2O6 at a significantly lower calcination temperature of 600 °C. This process is not only cost-effective but also utilizes ethylenediamine to control the growth of unique porous microstructures, which are ideal for enhancing functional performance. The powders generated from the synthesis were microstructurally characterized. Subsequently, pellets were prepared and subjected to varying concentrations of carbon monoxide and propane at temperatures of 100, 200, and 300 °C. As expected, the compound showed a high sensitivity, capacity, and thermal stability as the concentration of the test gases and the operating temperature increased.
As a relatively new and less-explored material, ZnSb2O6 holds significant potential for advancing gas sensing and photocatalysis technologies. Studying and optimizing its properties through efficient synthesis can lead to more sensitive, stable, and sustainable devices, thereby expanding the possibilities for environmental applications and material innovation.

2. Experimental

2.1. Synthesis of ZnSb2O6 Particles

ZnSb2O6 powders were synthesized using an easy and cost-effective microwave radiation-assisted method. The synthesis involved the use of reagent-grade chemicals, including zinc nitrate hexahydrate (Zn(NO3)2•6H2O), antimony trichloride (SbCl3), ethylenediamine (C2H8N2), and ethanol (C2H6O). Initially, three separate solutions were simultaneously prepared. These included a 2 M solution of antimony trichloride, a 1 M solution of zinc nitrate hexahydrate, and a 7.5 M solution of ethylenediamine, each dissolved in 5 mL of ethanol. These solutions were stirred for 10 min. Subsequently, the zinc nitrate solution was added dropwise to the ethylenediamine solution, followed by the addition of antimony trichloride solution to the mixture. The resulting solution was kept under vigorous magnetic stirring at room temperature for 24 h to ensure homogeneity. The ethanol solvent was then removed via microwave irradiation at 1 min intervals, with 3 min cooling periods between each cycle, over a total irradiation time of 20 min, until a dried paste was obtained. This paste was further dried in air for eight hours at 200 °C. Finally, the dried material was calcined in air at 600 °C for five hours to achieve the trirutile phase of ZnSb2O6.

2.2. Physical Characterization

The crystal structure of the calcined ZnSb2O6 powders was characterized by X-ray diffraction (XRD) using a Panalytical Empyrean diffractometer with Cu Kα radiation (λ = 1.541 Å). The diffraction patterns were recorded over a 2θ range of 10° to 90°, with a scan step size of 0.02° and a time of 30 s per step.
The optical bandgap of the ZnSb2O6 powders was determined by diffuse reflectance spectroscopy. Spectra were acquired in the wavelength range of 250 to 800 nm using a Jasco V-670 UV–vis spectrophotometer equipped with an integrating sphere. The Kubelka–Munk transformation was applied to estimate the bandgap energy.
The main Raman spectroscopy vibrational modes of the calcined powders were analyzed using a Thermo Scientific DXR Raman microscope with a 633 nm excitation source. The spectra were recorded from 200 to 800 cm−1 with an exposure time of 60 s. Additionally, the microstructure of the calcined ZnSb2O6 powders was examined by scanning electron microscopy (SEM) using a Jeol model JSM-6390LV microscope, operated at an accelerating voltage of 20 kV. The BET analysis was carried out using the ASAP 2020 Micromeritics instrument.

2.3. Gas Sensing Measurements

For the gas detection experiments, 0.39 g of ZnSb2O6 powders was first pressed into pellets using an Ital-Mexicana manual hydraulic press. The pellets were prepared by applying a pressure of 5 tons for 20 min to ensure mechanical integrity. The resulting pellets had a diameter of 9 mm and a thickness of 2 mm.
For electrical characterization, two ohmic contacts were manually applied (and verified using a curve tracer) to the pellet surfaces using colloidal silver paint (Alfa Aesar, 99%). The pellets were placed on a heater located inside a vacuum chamber. A low vacuum of 10 3 Torr was set within the chamber, and the concentration of the test gases was controlled by gradually increasing the chamber pressure with the respective gases, monitored via a Leybold TM20 Vacuum Controller.
Gas sensing measurements were conducted using C3H8 (1, 5, 50, 100, 200, 300, 400, and 500 ppm) and CO (1, 5, 50, 100, 200, and 300 ppm) at three operating temperatures (100, 200, and 300 °C). The gases used for the measurements were separate mixtures of 1000 ppm of CO and C3H8 in N2. The final gas concentrations in the chamber were calculated based on the partial pressures using the ideal gas law. The variation in electrical resistance of the pellets was recorded using a Keithley digital multimeter (model 2001). A schematic diagram of the sensing measurement setup is illustrated in Figure 1.

2.4. Photocatalytic Activity Test

The photocatalytic activity of the ZnSb2O6 powders was evaluated through the degradation of three organic dyes: malachite green, methylene blue, and methyl orange. Initially, 0.3 g of the ZnSb2O6 powders was pressed into pellets with a diameter of 9 mm and a thickness of 1 mm using an Ital-Mexicana manual hydraulic press.
Subsequently, each pellet was immersed in a quartz cell containing 3.5 mL of an aqueous dye solution at a concentration of 1 × 10 5 M. To establish adsorption–desorption equilibrium, the suspensions were kept in the dark for 30 min. Following this period, the samples were transferred to an annular photoreactor equipped with a 15 W UV-254 nm lamp, with the samples positioned 5 cm from the light source. The samples were then irradiated for 300 min. The decolorization of each dye solution was monitored at 60 min intervals by measuring the absorbance spectra using a JASCO V-670 UV–vis spectrophotometer.

3. Results

3.1. XRD Analysis

The X-ray diffraction pattern of the crystalline phase of ZnSb2O6 powders calcined at 600 °C is shown in Figure 2. Based on PDF 96-900-4698, peaks associated with the crystalline phase of the oxide were located at points 2θ = 19.35°, 21.31°, 27.10°, 33.37°, 35.04°, 38.50°, 40.11°, 43.23°, 44.38°, 48.12°, 52.97°, 55.72, 60.03°, 66.82°, 73.55°, 80.55°, 82.79°, 86.38°, and 88.96°. A tetragonal phase structure was identified, with cell parameters a = 4.6640 and c = 9.2630, and a space group of P42/mnm. These parameters are characteristic of a trirutile structure. In the diffractogram, the crystalline phase of the ZnSb2O6 is observed without the presence of any secondary phase. In addition, the diffractogram shows broad peaks, indicating a very small particle size (in the nanometer range), while the peak intensity indicates a high purity of the material. This result can be attributed to the synthesis method and calcination temperature employed.
Our results were consistent with those reported by other research groups, which synthesized the same compound by different processes [8,11,13].
To calculate the crystallite size of ZnSb2O6 (Figure 2), Scherrer’s equation was used as follows [25]:
t = 0.9 λ β   c o s θ
where λ is the wavelength of the radiation (Cu = 1.5406 Å), β is the peak full width at half maximum (FWHM), and θ is the Bragg angle. To determine the crystallite size, all the peaks in the diffractogram of Figure 2 were used. The estimated crystallite size was approximately 42 nm.
The crystallite’s nanoscale size is mainly attributed to the synthesis method. The size is crucial for gas sensor applications, as reduced particle sizes increase the surface area, thereby enhancing chemical reactions between the test gas and the oxide surface [25,26]. Our results, obtained with a calcination temperature of 600 °C and a muffle residence time of only five hours, compare well with those reported for ZnSb2O6 synthesized by the coprecipitation (or wet chemistry) method [8,11,13]. For example, Junming Li et al. [8] obtained the crystalline phase of ZnSb2O6 by a facile coprecipitation method and post-annealing at 800 °C. Michel et al. [13] reported the crystalline phase of ZnSb2O6, ZnO, and SbO2 at 500 °C, employing the colloidal method. According to reference [11], the material was obtained by heating it in a furnace at 900 °C for six hours in air. Therefore, our method favored the production of phase powders at low temperatures and with crystallite sizes of the nanometer order (42 nm).

3.2. UV Analysis

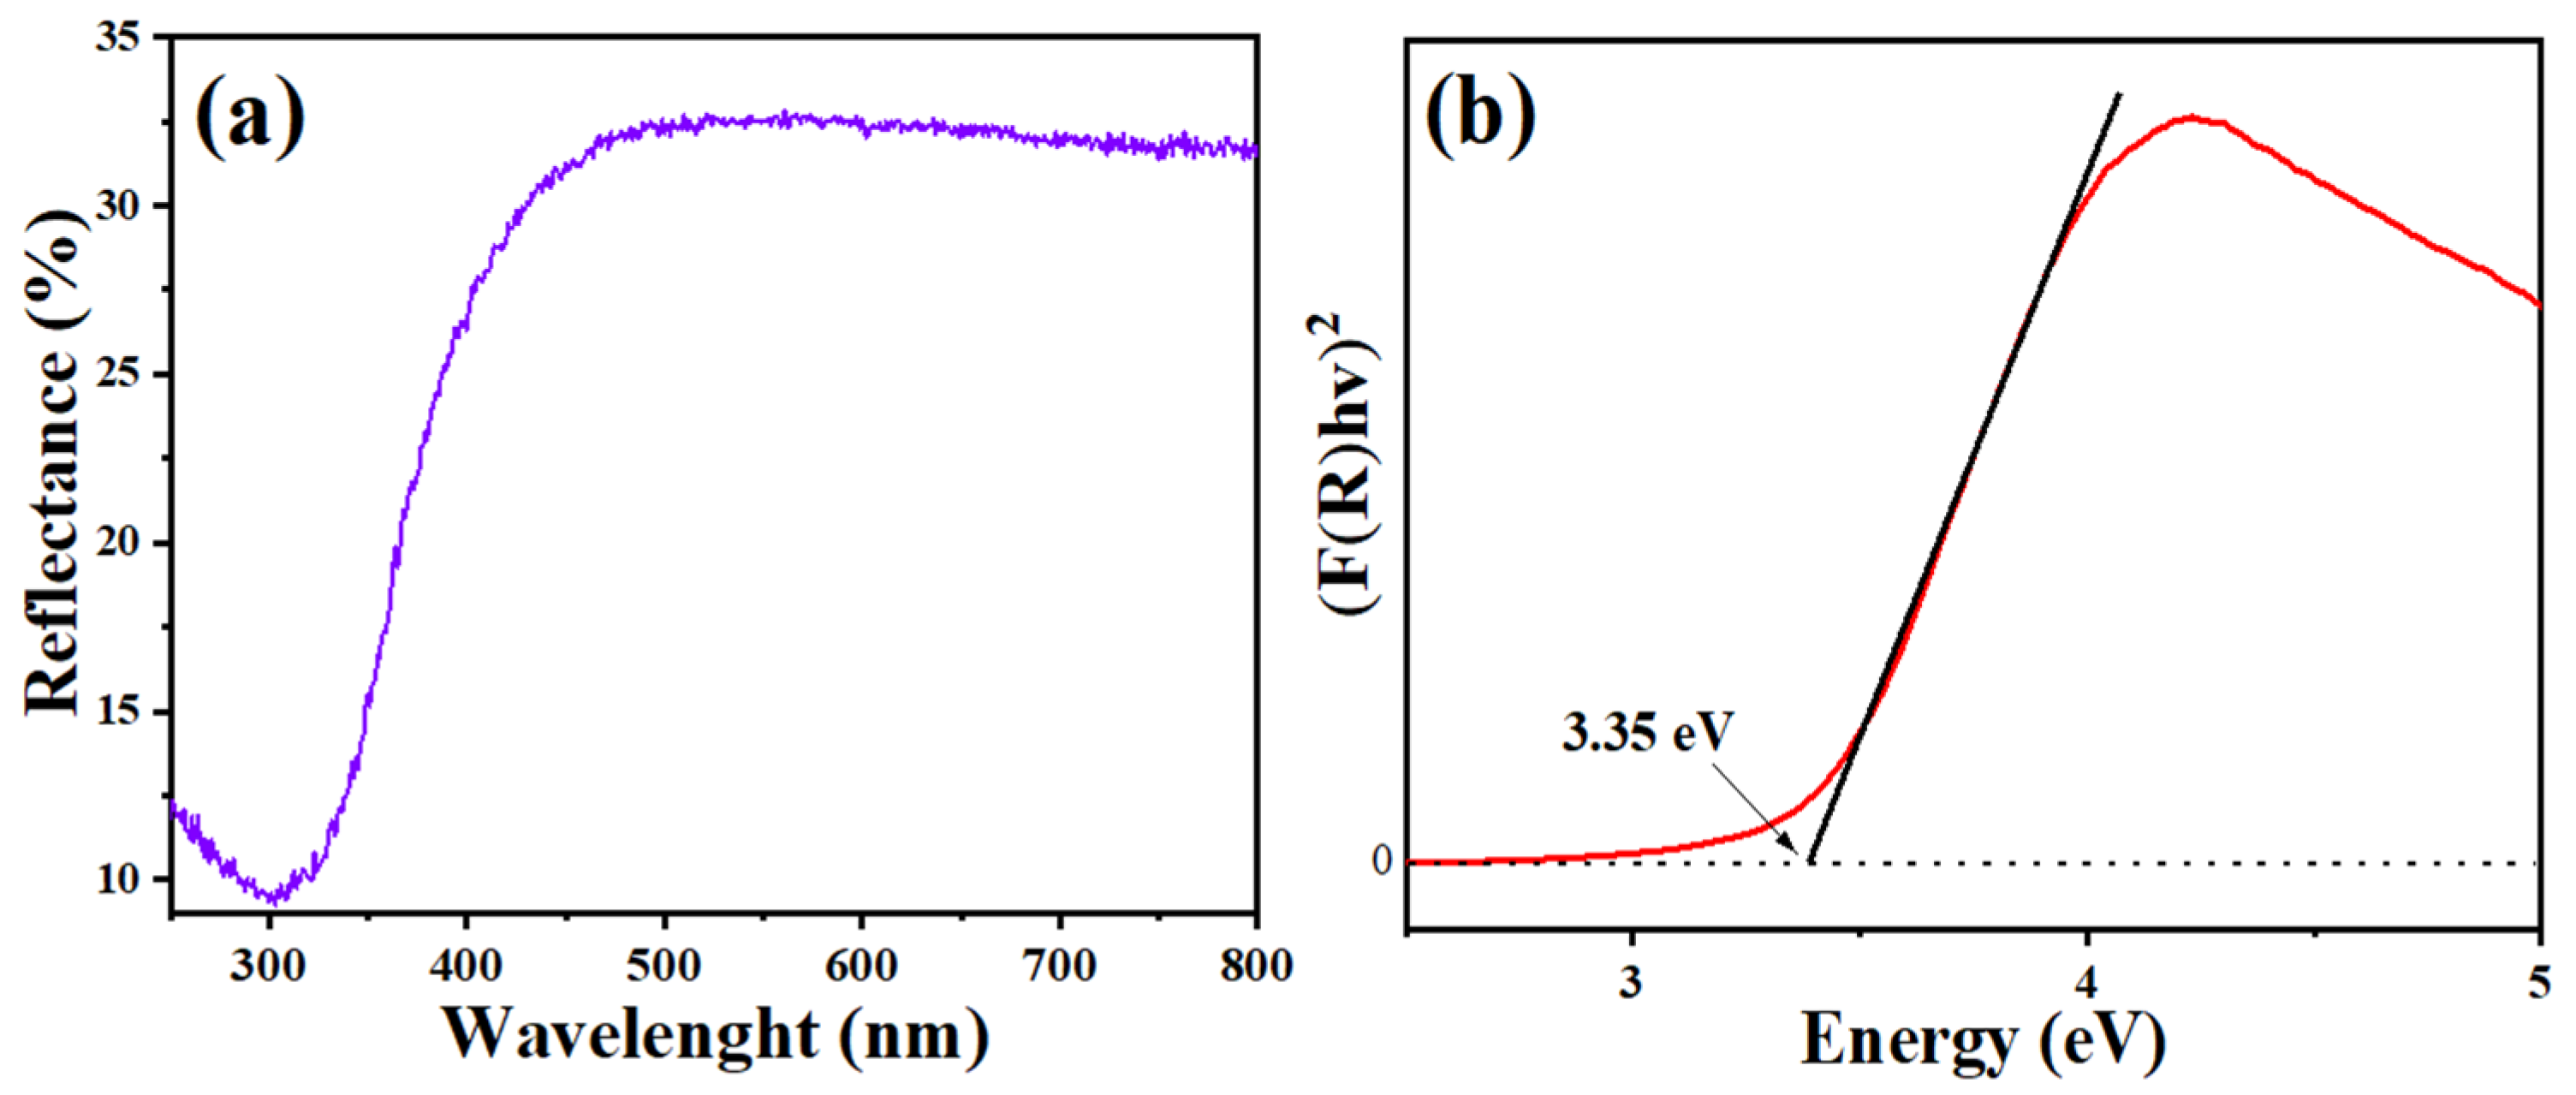
Figure 3 shows the diffuse reflectance UV–vis spectrum of ZnSb2O6 along with Tauc’s plot which was used to estimate the bandgap of the oxide. The diffuse reflectance spectrum is commonly employed to study the optical properties of materials in powder form. In this case, wavelengths ranging from 200 to 800 nm were employed for the analysis.
To determine the bandgap, the Kubelka–Munk function was applied to convert diffuse reflectance data into an absorption coefficient (α), allowing the use of Tauc’s method as follows:
F R = 1 R 1 n 2 R
where R is the reflectance and n is a factor that depends on the type of electronic transition, equal to 1/2 for direct transitions and 2 for indirect transitions. By plotting ( F R h v ) 2 vs. energy (E) we estimated the bandgap [27]: 3.35 eV. Bandgap values for gas sensors typically range from 1.0 to 3.5 eV [11,17].

3.3. Raman Analysis

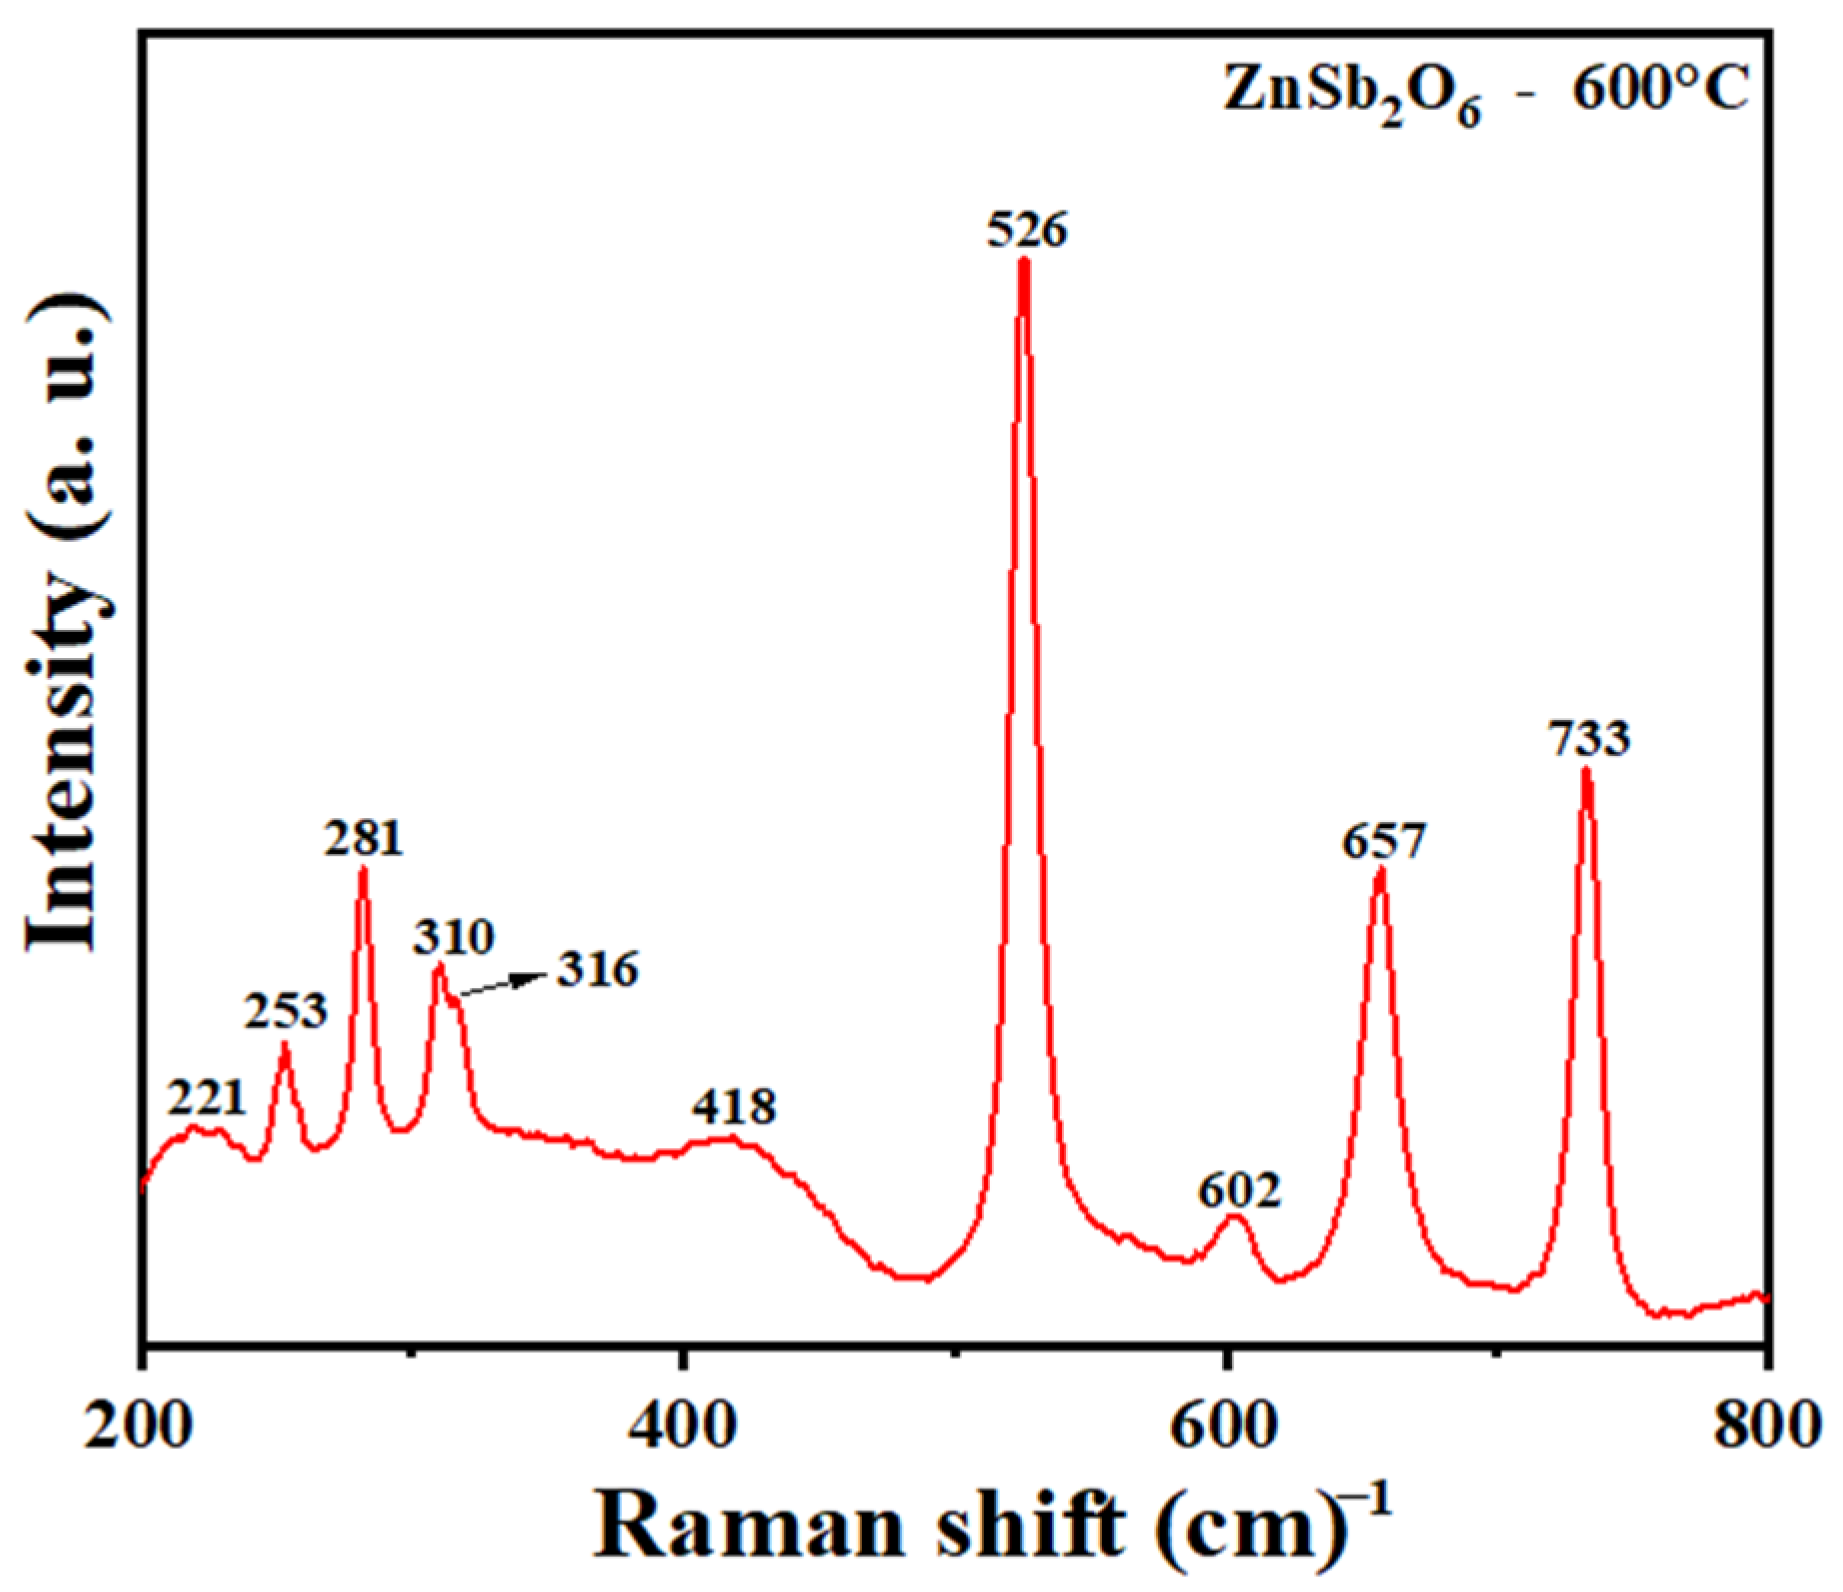
The Raman spectrum of the oxide is depicted in Figure 4. In general, previous studies have reported that the ZnSb2O6 crystallizes in a trirutile-type structure with space group P42/mnm ( D 14 4 h ). The Raman spectrum exhibits vibrations in the energy range of 200–800 cm−1, indicating the single-phasic nature of the products [10,16]. The bands appearing in the range of 500–800 cm−1 are characteristic of vibrational modes associated with the Sb2O10 bonds [16]. In the range 600–800 cm−1, the stretching modes of the Sb–Op bonds predominate [10]. The deformation modes of the Sb–Op bonds, coupled to the vibrations of the Zn–O bonds, are dominant in the range 400–600 cm−1 [10,16]. This analysis supports the results obtained by XRD.

3.4. SEM Analysis

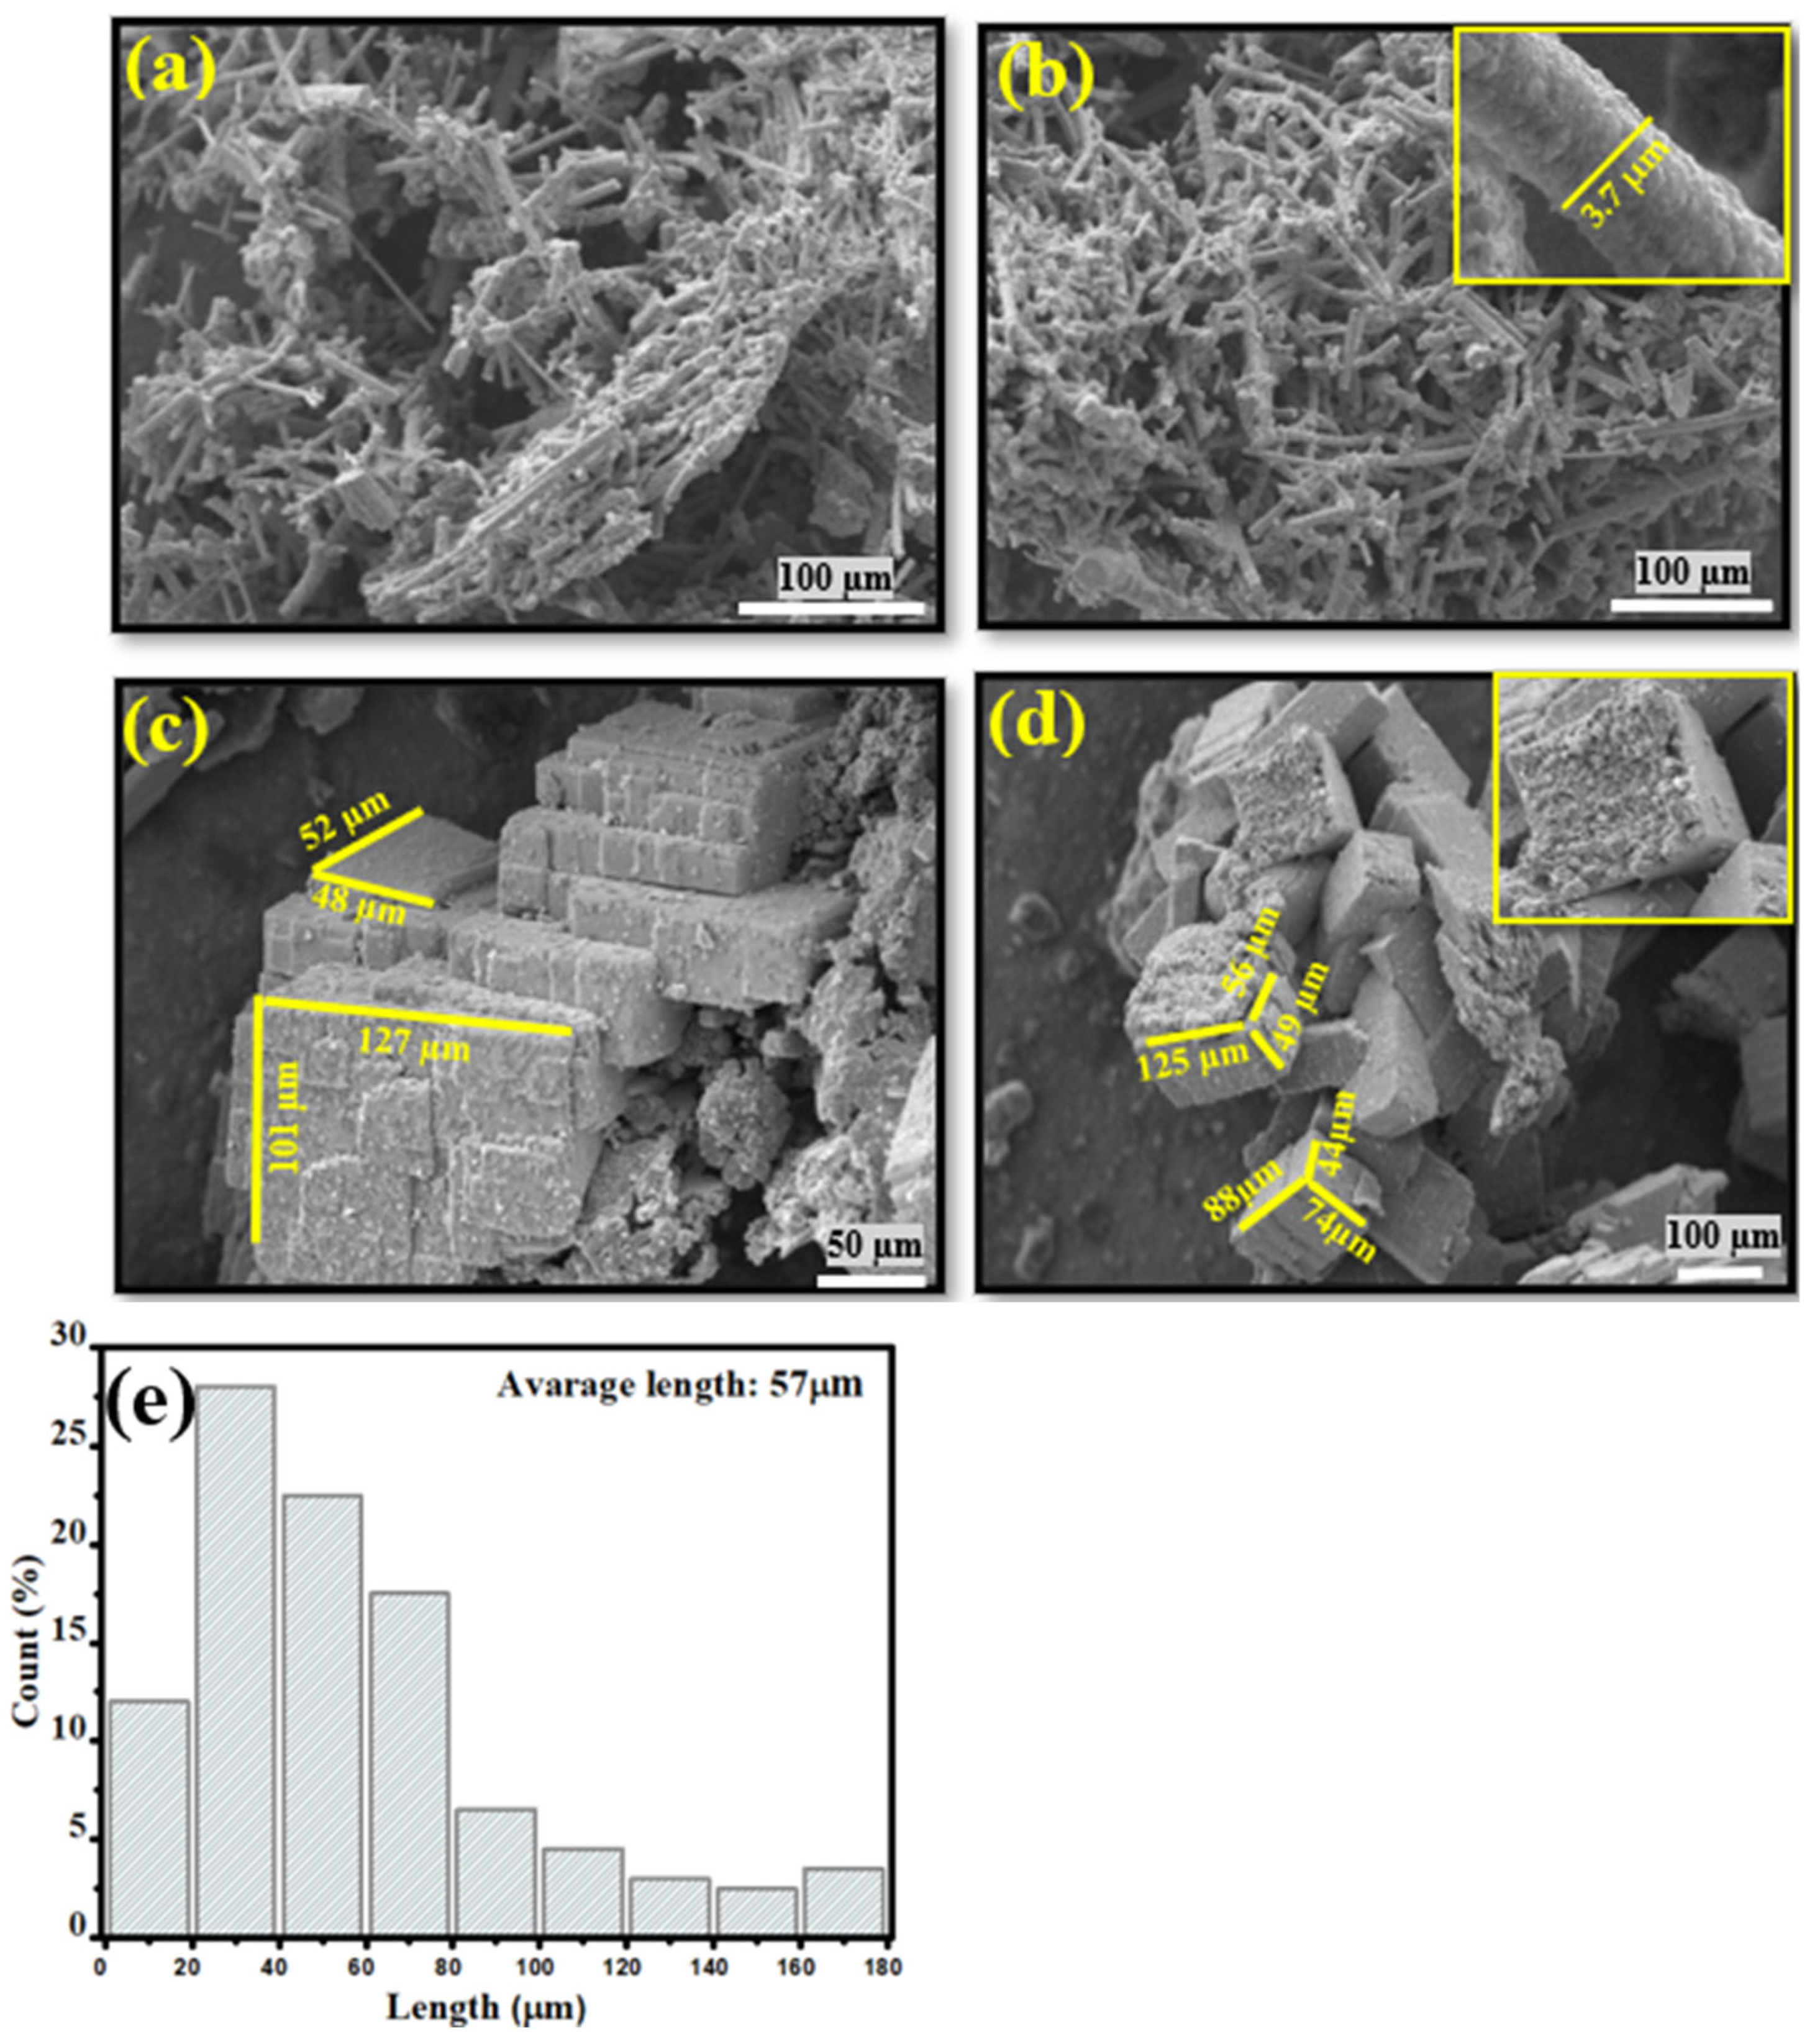
Figure 5 shows scanning electron microscopy (SEM) images of ZnSb2O6 powders calcined at 600 °C. Figure 5a,b reveal the growth of well defined microstructures, with a rod-like agglomerate morphology, having an approximate diameter of 3.7 µm. The histogram in Figure 5e was generated using ImageJ 1.52a software. It is based on 200 measurements taken from images in Figure 5a,b. This histogram depicts the length size distribution of the rods within the sample, whose average length was 57 μm. Additionally, porosity and surface area measurements obtained by using BET equipment indicate that the material possesses a mesoporous structure [28], with a total pore volume of 0.0831 cm3/g, predominantly consisting of pores in the range of 10 to 40 nm, and a specific surface area of 6 m2/g. The porous nature resulting from the arrangement of the microrods (Figure 5a,b) suggests the oxide’s potential applications as a gas sensor, as porosity enhances gas diffusion over a larger active surface area, thereby improving sensing performance [29]. Conversely, Figure 5c,d show the formation of microstructures in the form of compact cuboids, averaging approximately 75 µm on each side. It is essential to clarify that all these microstructures correspond to the same sample, and the variations in morphologies are due to the specific synthesis conditions, which highlight the importance of the experimental parameters. The morphology of these structures, as shown in the zoomed-in image in Figure 5d and supported by the BET measurements, indicates a porosity that increases the surface-to-volume ratio. This characteristic facilitates gas diffusion and adsorption, which are essential for sensing and photocatalytic applications.
According to the literature, ethylenediamine plays a key role in the formation of microstructures such as microrods and microcuboids, primarily due to its function as a coordination agent [30,31]. Its ability to bind to metal ions, like Zn2+ in our system, through its two nitrogen atoms, allows it to chelate these ions effectively. This chelating action is crucial because it enables ethylenediamine to regulate the metal ion concentration within the reaction, thereby exerting significant control over the nucleation and growth processes that determine the final microstructure morphology [31].
The formation of microrods analogous to those observed in this study (Figure 5a,b) has been documented in the literature. For example, Liu et al. [30] reported the growth of rod-shaped microstructures achieved by varying the concentration of ethylenediamine. Deng et al. [32] observed the formation of microstructures with rectangular morphologies, like those obtained in this work (see Figure 5c,d), attributing these specific morphologies to the use of ethylenediamine. They proposed that ethylenediamine influences the nucleation and growth mechanisms during synthesis, thereby determining the resulting microstructure. These findings suggest that the concentration of ethylenediamine plays a crucial role in controlling the morphological characteristics of the synthesized materials [33].
The surface area of a material is a fundamental parameter in gas sensing and photocatalytic applications. A higher surface area provides more active sites for molecule adsorption, thereby facilitating greater interaction between the target analyte and the sensor material. As shown, microrods and microcubes, morphologies that can enhance the active surface area, were obtained in this work. According to the literature, such cuboidal microstructures can improve sensor response. For example, in [34], the authors demonstrated that cubic-shaped Fe2O3 structures enhance the detection of organic vapors. In [35], an increased sensing response was reported for Co3O4 cuboid structures in ethanol atmospheres. Additionally, in [36], ZnO microrods showed a high response to CO, ethanol, and acetaldehyde. These findings highlight the significance of microstructural morphology, including microrods and microcubes, in enhancing the sensing performance of materials.

3.5. Gas Sensing Tests

To investigate the potential application of zinc antimonate powders calcined at 600 °C as sensors for CO and C3H8 atmospheres, measurements were conducted using the two-point probe method with direct current (DC) signals. For these tests, the concentrations used were 1, 50, 100, 200, and 300 ppm for CO, and 1, 5, 50, 100, 200, 300, 400, and 500 ppm for the C3H8. The experiments were performed at temperatures of 100, 200, and 300 °C for both gases. The sensing tests in static CO and C3H8 atmospheres involved four basic steps. In the first step, the pellets fabricated with powders calcined at 600 °C were placed inside the chamber, which was equipped with two electrodes (a two-point probe), positioned on the ohmic contacts on the pellets’ surface. As a second step, the chamber was evacuated to a high vacuum for the electrical tests. The third step involved conducting the experiments in air at temperatures of 100, 200, and 300 °C. At each temperature, the pellets were allowed to stabilize for 5 min, after which the different concentrations of the test gases were alternately injected. Upon contact between the pellet surface and the test gases, changes in electrical resistance were recorded at each applied temperature. Finally, in the fourth step, the response was calculated as a function of gas concentration and operating temperature using the following equation [37,38,39]:
R e s p o n s e = R O R g a s
where RO is the chamber’s reference electrical resistance in vacuum and Rgas is the electrical resistance in the presence of the test gas, with the experiments conducted in static CO and C3H8 atmospheres at 100, 200, and 300 °C. The results are shown in Figure 6 and Figure 7.
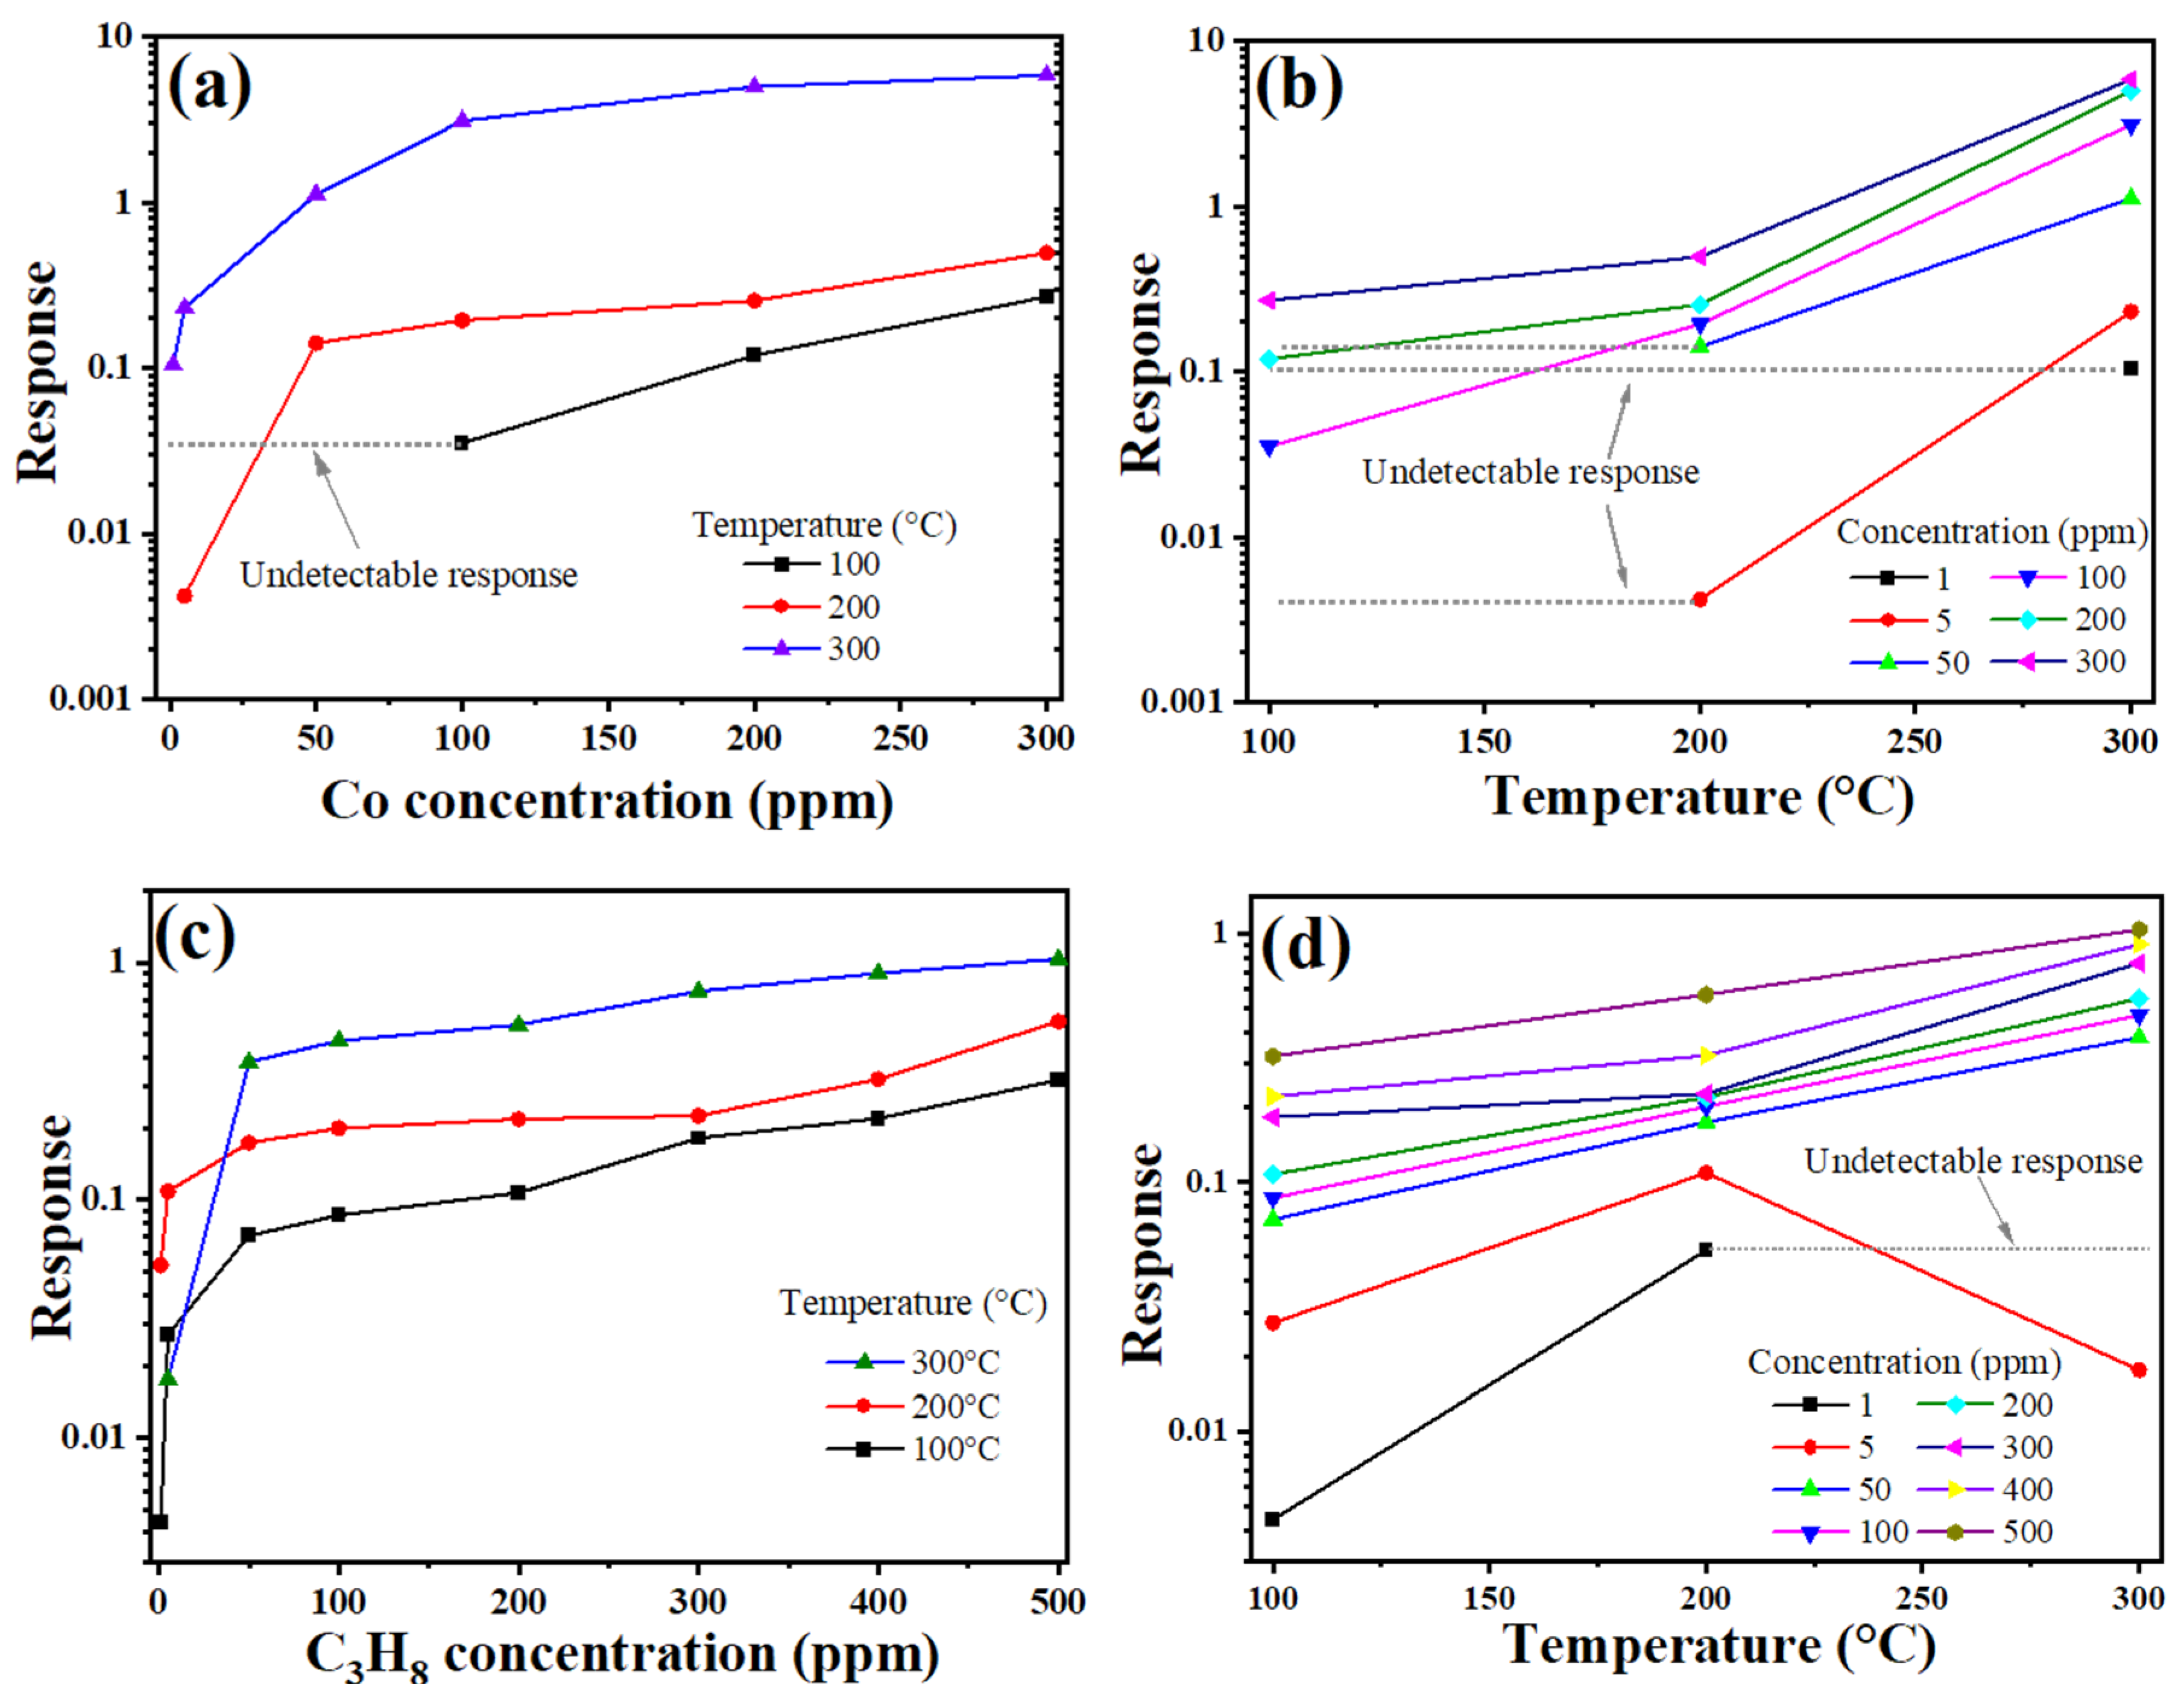
According to Figure 6, measurements at 100 °C showed that the pellets had a maximum response of 0.27 in 300 ppm of CO (Figure 6a,b), while a maximum response of 0.32 was recorded in 500 ppm of C3H8 (Figure 6c,d). We observed that increasing the temperature to 200 °C significantly raised the compound’s maximum response to 0.5 for 300 ppm of CO (Figure 6a). Meanwhile, in C3H8 atmospheres, a maximum response of 0.56 was obtained (Figure 6c,d). The increasing response trend of ZnSb2O6 was corroborated when the operating temperature was raised to 300 °C for both test gases (Table 1). It is essential to mention that the undetectable responses shown in Figure 6 were due to the resistance changes being negligible; therefore, the multimeter used could not detect them.
We verified that as the operating temperature and test gas concentration increased, the pellets’ ability to detect both test gases improved substantially, with the best performance observed at 300 °C. The operating temperature plays a crucial role in promoting the chemical reaction between the test gases and the oxygen species ( O ) present on the pellet’s surface, leading to an increase in the gas sensing response. The enhanced response of semiconductor oxides at elevated temperatures is widely reported in the literature [40,41]. Therefore, the high response of the oxide is attributed to the oxygen adsorption and desorption processes ( O 2 , O , or O 2 ) on the pellets’ surface, enhanced by the rising operating temperature [29,42]. The results are summarized in Table 1.
The maximum responses obtained at 300 °C were 5.86 for 300 ppm of CO and 1.04 for 500 ppm of C3H8. As previously discussed, the increase in response is attributed to the enhanced oxygen adsorption and desorption process at higher temperatures [43,44,45]. The elevated temperature promotes a strong interaction between the test gas molecules and highly reactive oxygen species ( O and O 2 [46,47,48]) on the pellets’ surface. It has been documented that these reactive oxygen species cause the oxidation of test gases, contributing to an increase in sensitivity [19,49,50], which aligns with our results (Figure 6).
In general, at 300 °C, a physicochemical equilibrium exists between the adsorption of CO and the previously adsorbed oxygen species. It has been reported that at temperatures below 300 °C, the sensor’s response decreases significantly because the operating temperature is insufficient to promote redox reactions between reducing gases like CO and the oxygen on the sensor’s surface [40,42,44]. But, at temperatures above 300 °C, the response could also decrease [38,45]. This phenomenon is primarily attributed to the following: (1) a reduction in available catalytic sites due to the desorption of oxygen species from the sensor’s surface, (2) possible sensor instability at elevated temperatures, (3) a decreased interaction time between molecules due to the greater desorption of the target gas (CO) [29,43,45]. The excellent response to CO (5.86 at 300 ppm) at 300 °C is attributed to a higher efficiency in the reaction kinetics between the reducing gas and the oxygen species (O and O2−) adsorbed onto the material’s surface [44,45]. The equilibrium established between these gases favors greater charge transfer and, consequently, a larger change in the sensor’s response. Furthermore, the mobility of charge carriers in the material is notably increased, which contributes significantly to an improvement in the electrical signal due to the gas–solid interactions that take place [45].
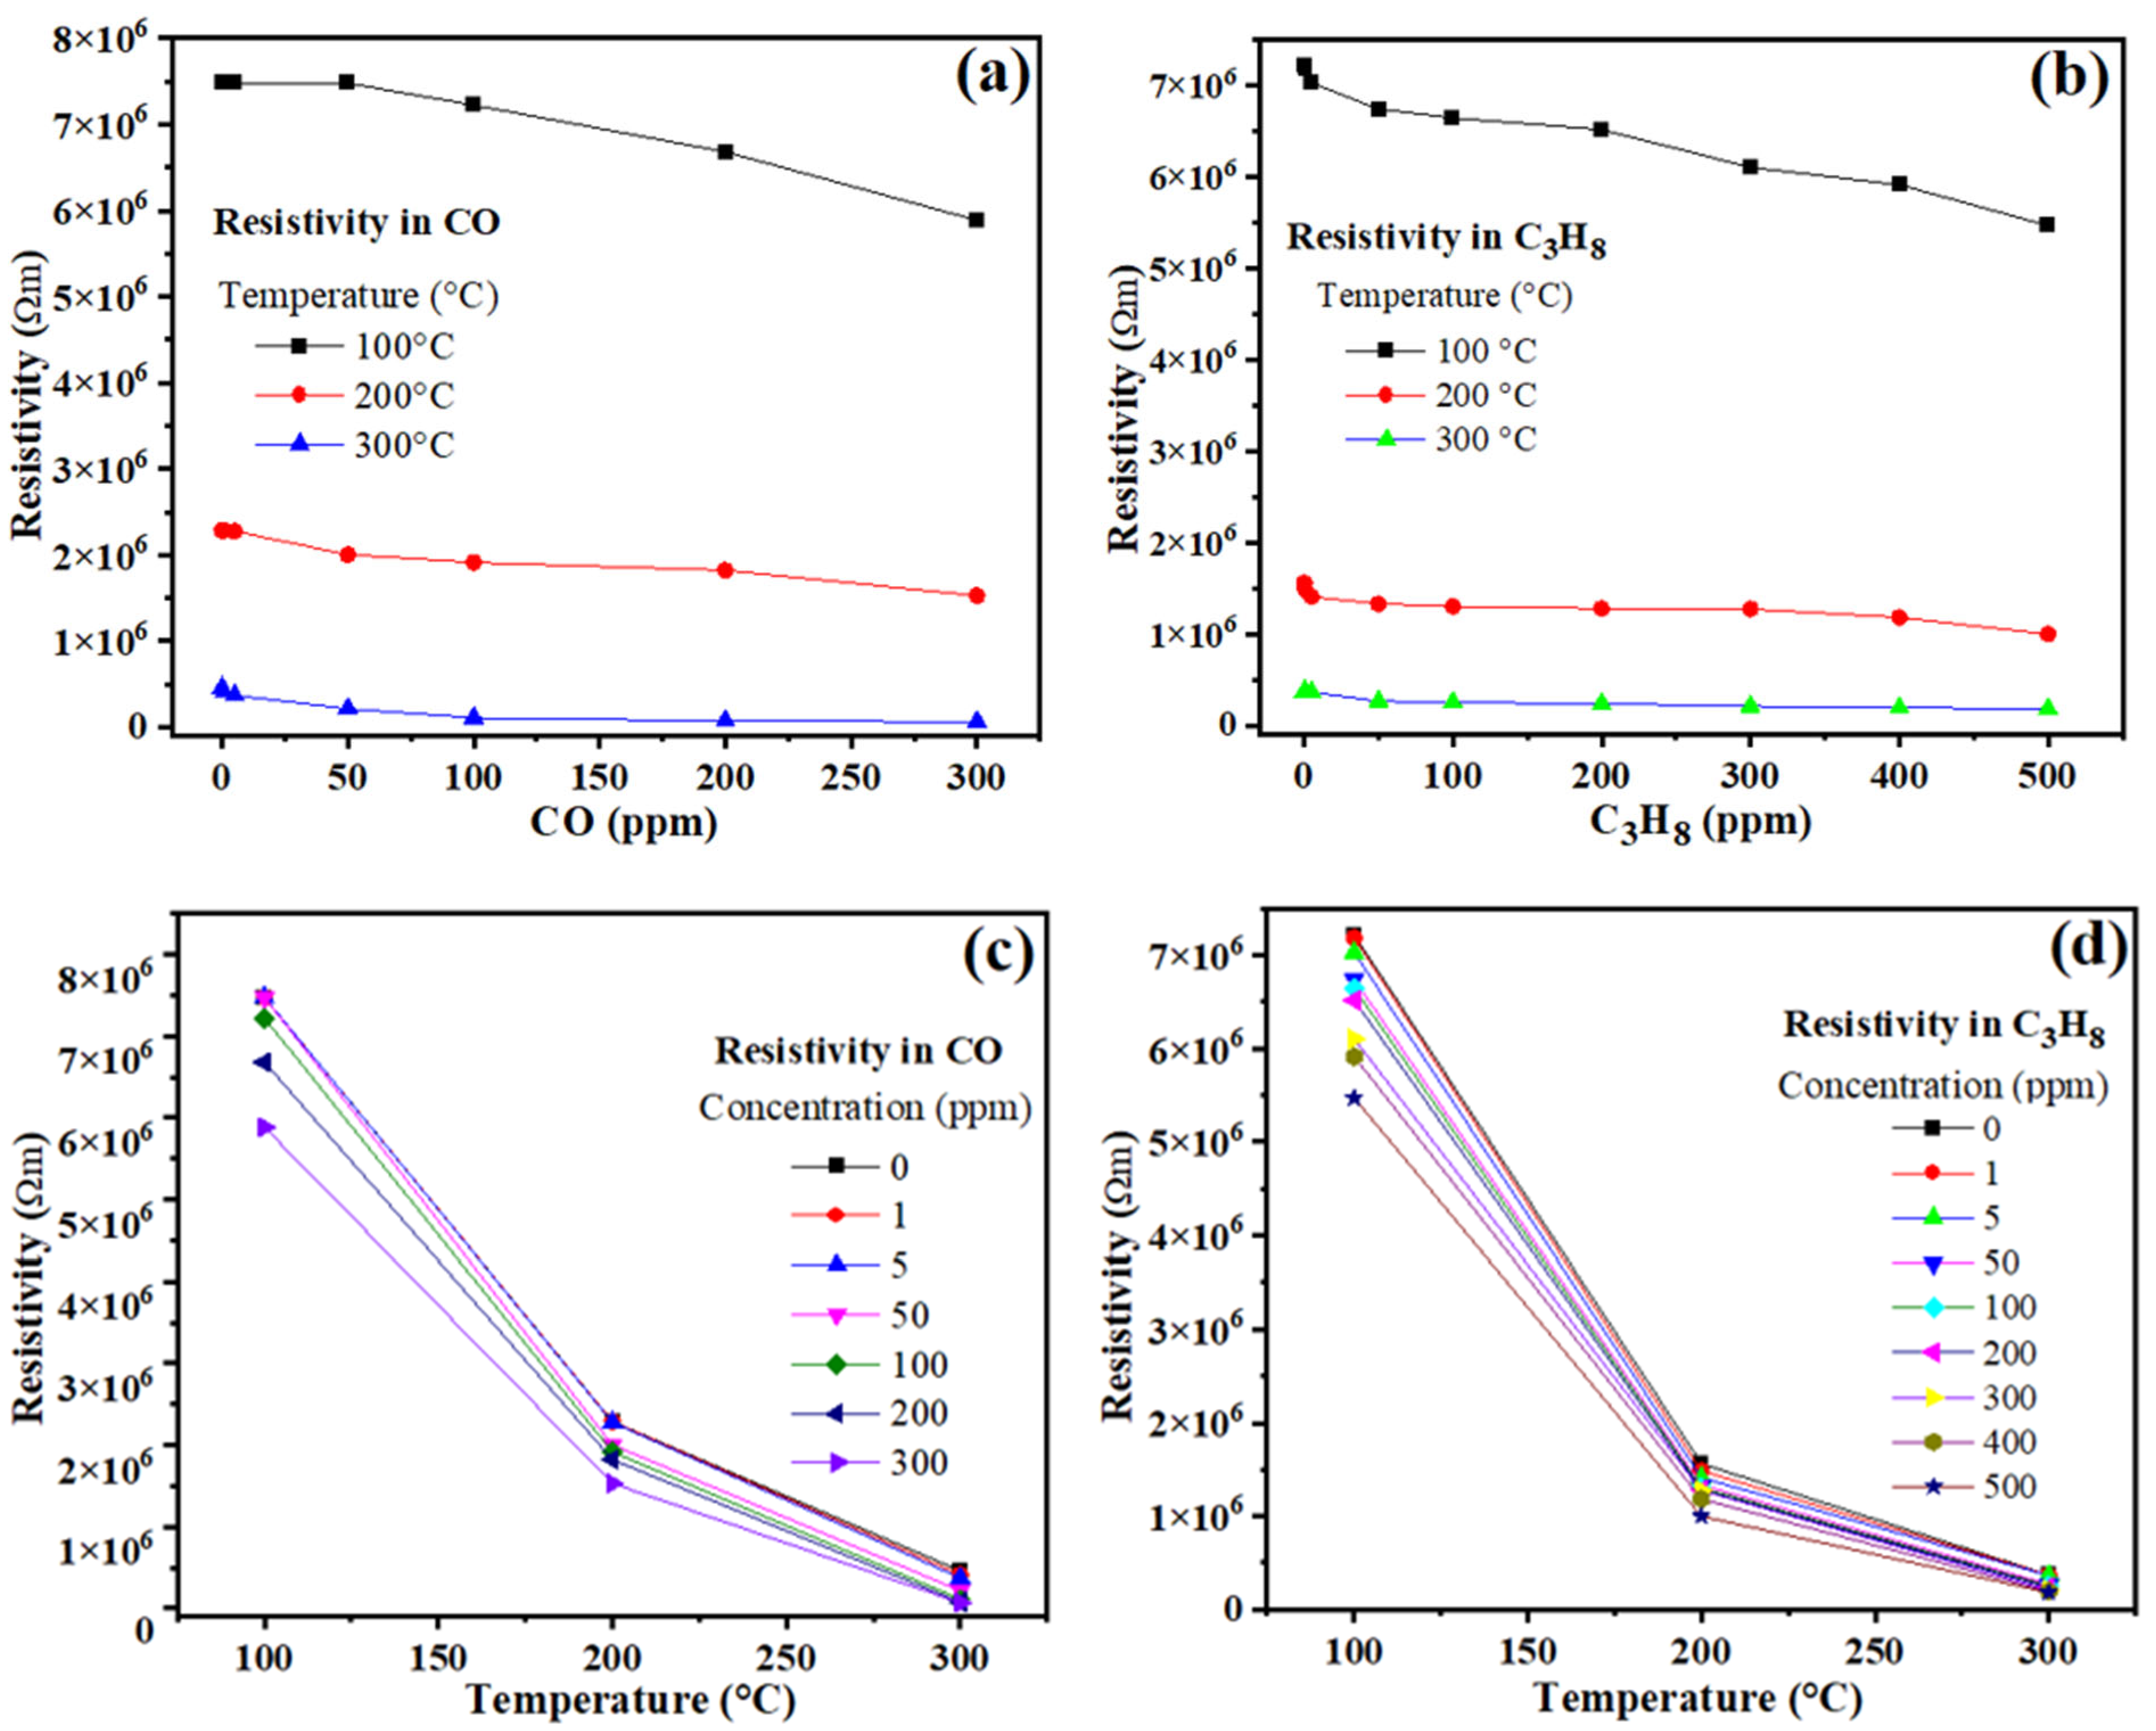
On the other hand, a crucial parameter for the application of a semiconductor oxide as a gas sensor is the variation in electrical resistivity (ρ). We calculated the resistivity as a function of the gas concentration and the operating temperature using the following expression [51]:
ρ = R A t
where R is the pellets’ electrical resistance in the test gases, A is the pellets’ cross-sectional area, and t is their thickness (=2 mm; diameter = 9 mm). Figure 7 shows the variation in resistivity as a function of CO and C3H8 concentrations and operating temperature.
As depicted in Figure 7, and as expected, at 100 °C, the material exhibits high electrical resistivity, regardless of the test gas concentration (Figure 7a,b). Upon increasing the temperature to 200 °C, a decrease in resistivity was recorded for both gases. At 100 and 200 °C, the resistivity remains relatively linear. It shows little dependence on the concentration of either gas, which is attributed to the temperature having the dominant effect on the resistivity variation [48]. This was corroborated by increasing the temperature to 300 °C, at which the most significant decrease in resistivity was observed (Figure 7c,d).
The observed trends are attributed mainly to the fact that with an increasing temperature, the mobility of charge carriers (electrons) is enhanced due to the available higher energy at the pellet’s surface, which contributes to an increase in the material’s conductivity as its resistivity decreases [33,42,43,44,47].
The temperature-enhanced oxygen adsorption, which subsequently reacts with the test gases on the pellets’ surface, causes a decrease in resistivity and, consequently, an increase in the material’s response. These trends are commonly reported for ternary semiconductor oxides used as gas sensors, particularly for trirutile-type antimonate oxides [19,37,48,52,53]. The values for resistivity are listed in Table 1.

3.6. Reaction Mechanism

The mechanism explaining the response of zinc antimonate in CO and C3H8 atmospheres is based on the chemical reaction on the pellets’ surface between the test gases and the oxygen species ( O 2 , O , or O 2 ) present at temperatures above 150 °C. For an n-type semiconductor like ZnSb2O6, an electron transfer is induced on the material’s surface in CO and C3H8 atmospheres, driven by the oxygen adsorption–desorption phenomenon [42]. The literature reports that this transfer of charge carriers (electrons) is reflected in changes in electrical resistivity (or electrical response), which depends on both the reaction between the adsorbed oxygen and the gases [19,37,52], and the movement of free electrons on the pellets’ surface. Therefore, at 300 °C in high vacuum, oxygen species adsorb onto the material due to the temperature, trapping electrons from the conduction band [19,43,44,49], a process that ultimately results in an increased response from the ZnSb2O6.
Chemical reactions that occur during the chemisorption of CO and C3H8 at 300 °C on the surface of a semiconductor have been widely studied by various authors [39,40,41,46,54]. In our CO experiments, when the gas was injected into the measurement system, it immediately reacted with the oxygen on the surface of the pellets, producing CO2 and releasing electrons. According to the literature, a possible chemical reaction for the chemisorption of CO at 300 °C on the ZnSb2O6 pellets is as follows [43,44]:
2 C O + O 2 a d s 2 C O 2 + e C O + O a d s C O 2 + e C O + O 2 ( a d s ) C O 2 + 2 e
where the suffix (ads) represents the adsorbed species [43,44]. These reactions release thermal energy that promotes greater charge carrier displacement, thus increasing the compound’s response. A similar reaction may occur during the chemisorption of C3H8 at 300 °C. According to the literature, the reaction of adsorbed C3H8 molecules with highly reactive oxygen species ( O and O 2 above 150 °C, [33,43,46,47,48,55]) is the most probable cause for the variation in electrical resistance and increased response to C3H8 at moderate temperatures (300 °C in our case). As the operating temperature increased, the highly reactive oxygen ions exhibited an enhanced solid–gas interaction [46], which favored an increase in the sensor’s response.
According to references [29,44,45], the adsorption of oxygen ions that react with the test gas leads to faster oxidation at 300 °C. The oxidation reaction that may occur is reported in references [19,37,56] and is as follows:
C 3 H 8 + 10 O 3 CO 2 + 4 H 2 O + 10 e
which indicates that when C3H8 molecules are adsorbed on the pellets’ surface, they dissociate before reacting with the ionosorbed oxygen [46], producing CO2, H2O, and free electrons [56], which favors an increase in the pellets’ response, as observed in Figure 6 and Figure 7. Such results are commonly reported in the literature for binary (ZnO and SnO) [39,40,57] or ternary oxides with perovskite (LaCoO3, LaFeO3) [58], spinel (ZnAl2O4, AlCo2O4) [46,59], and trirutile (MgSb2O6, ZnSb2O6) [19,37,47] structures.
Beyond its promising capabilities in gas detection, the bifunctional nature of the synthesized ZnSb2O6 was further explored. The material’s calculated bandgap of 3.35 eV indicates activation by UV light, while its high surface area morphology is ideal for facilitating surface reactions. Therefore, to fully characterize its potential for environmental remediation applications, the material’s photocatalytic performance in degrading organic dyes was systematically evaluated.

3.7. Photocatalytic Tests

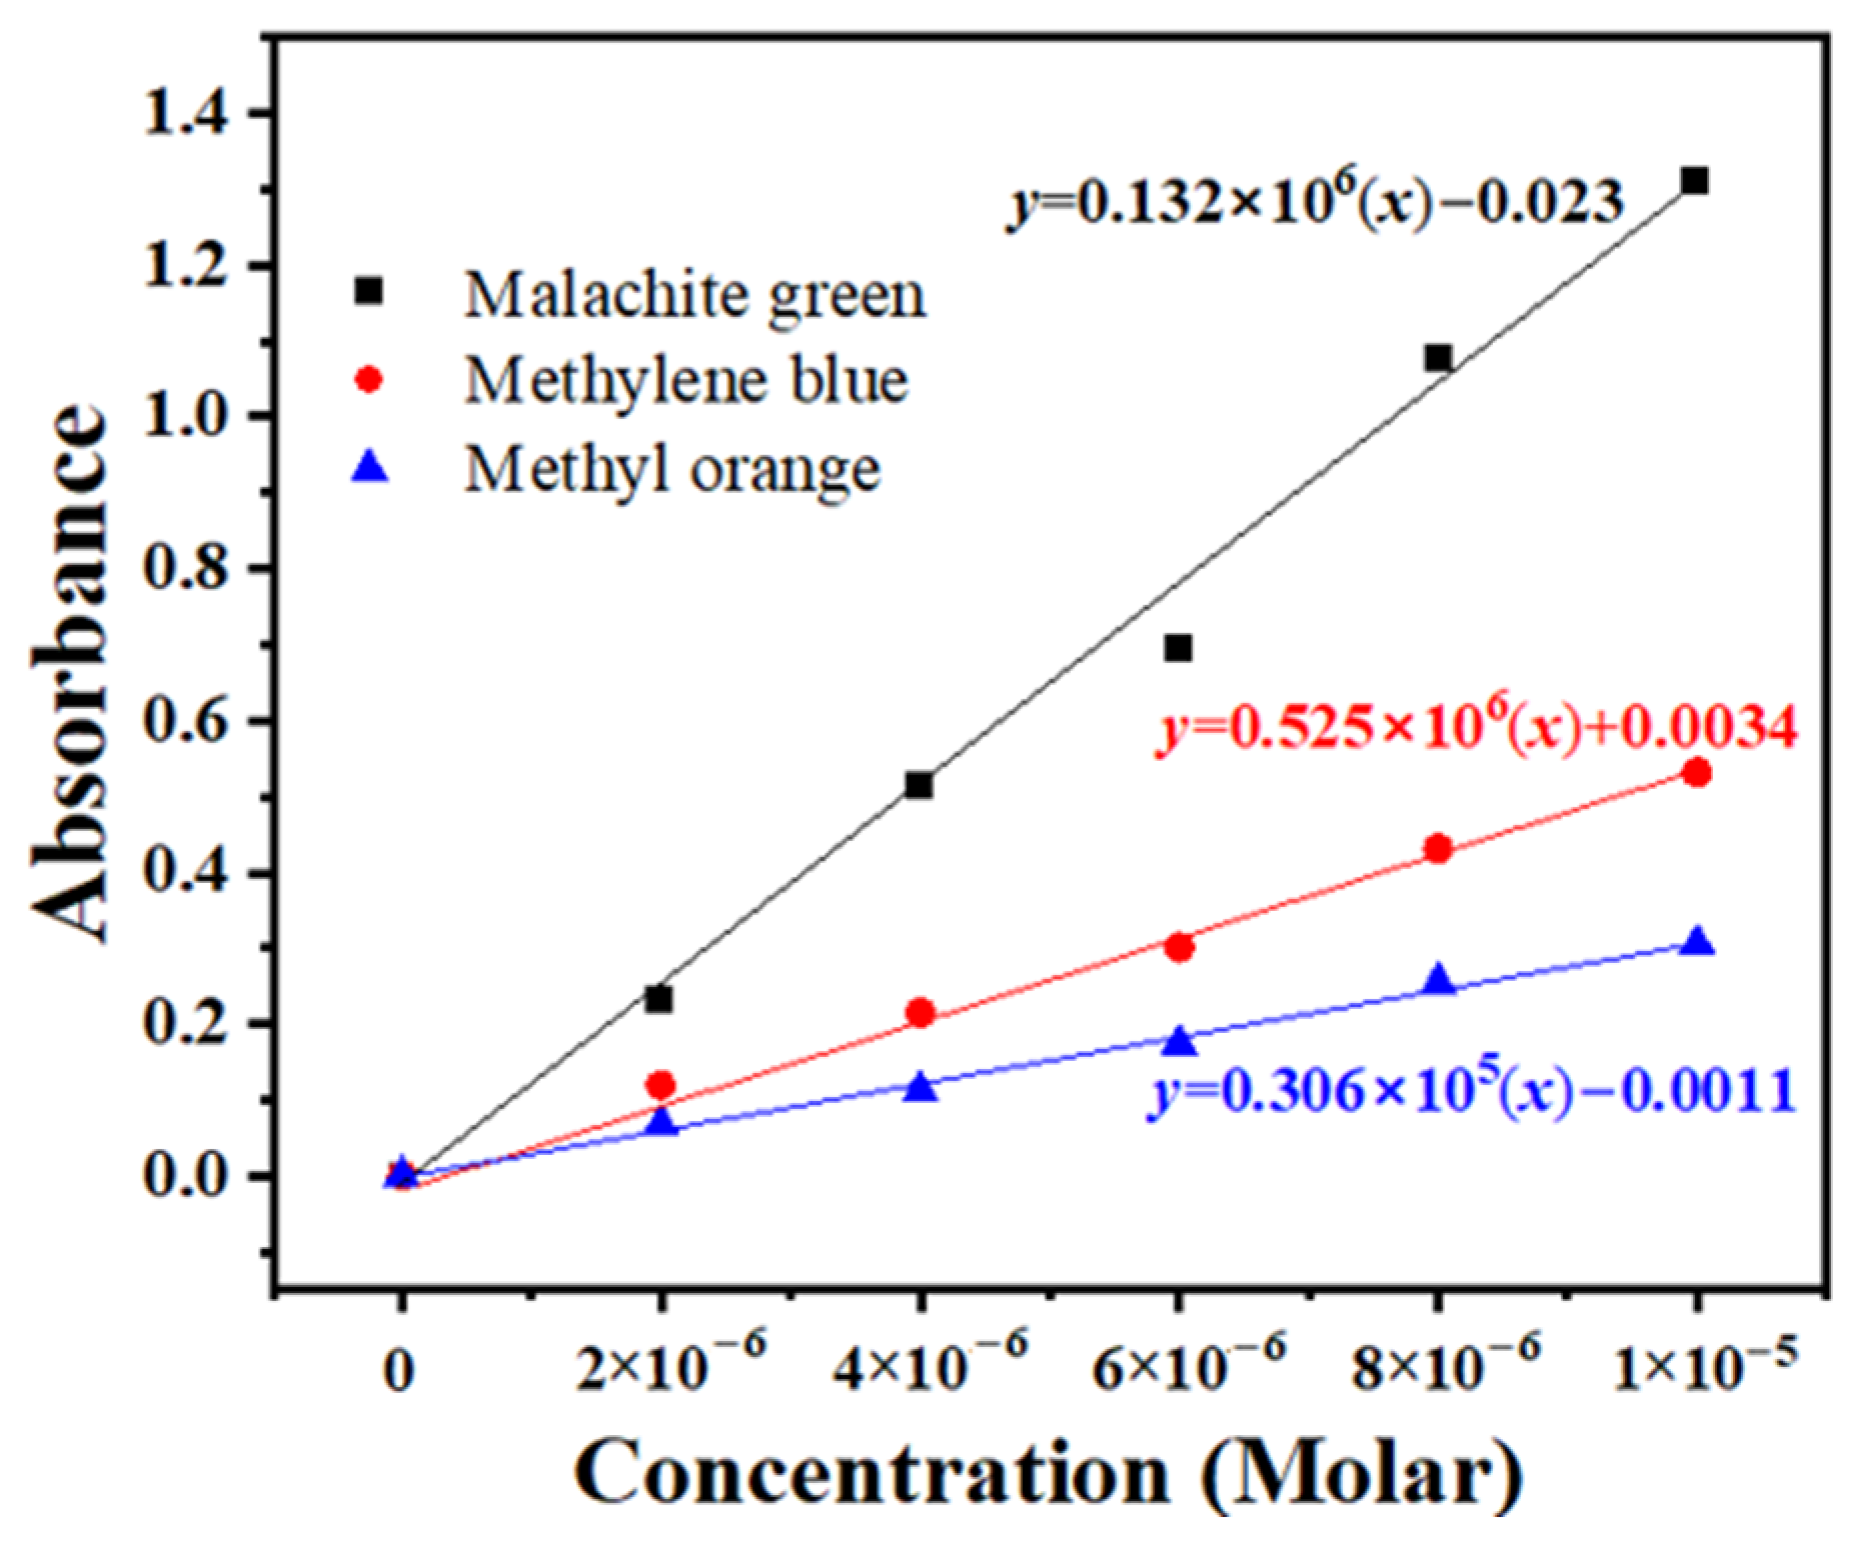
The photocatalytic performance of ZnSb2O6 pellets was evaluated using photodecolorization tests with aqueous solutions of dyes as model pollutants: malachite green (MG), methylene blue (MB), and methyl orange (MO). To determine the concentration of the dyes in the samples, calibration curves were constructed by measuring the absorbance at specific wavelengths corresponding to the maximum absorption of each dye (664 nm for MB, 617 nm for MG, and 465 nm for MO).
The calibration curves were generated using serial dilutions of standard solutions, covering a relevant concentration range for each dye. The resulting correlation coefficients (R) demonstrated excellent linearity, with values of 0.9933 for malachite green (MG), 0.9974 for methylene blue (MB), and 0.9947 for methyl orange (MO), indicating strong linear relationships between absorbance and concentration. Figure 8 presents the calibration curves for each dye, along with their respective linear equations, which were used to accurately quantify the dye concentrations in the samples.
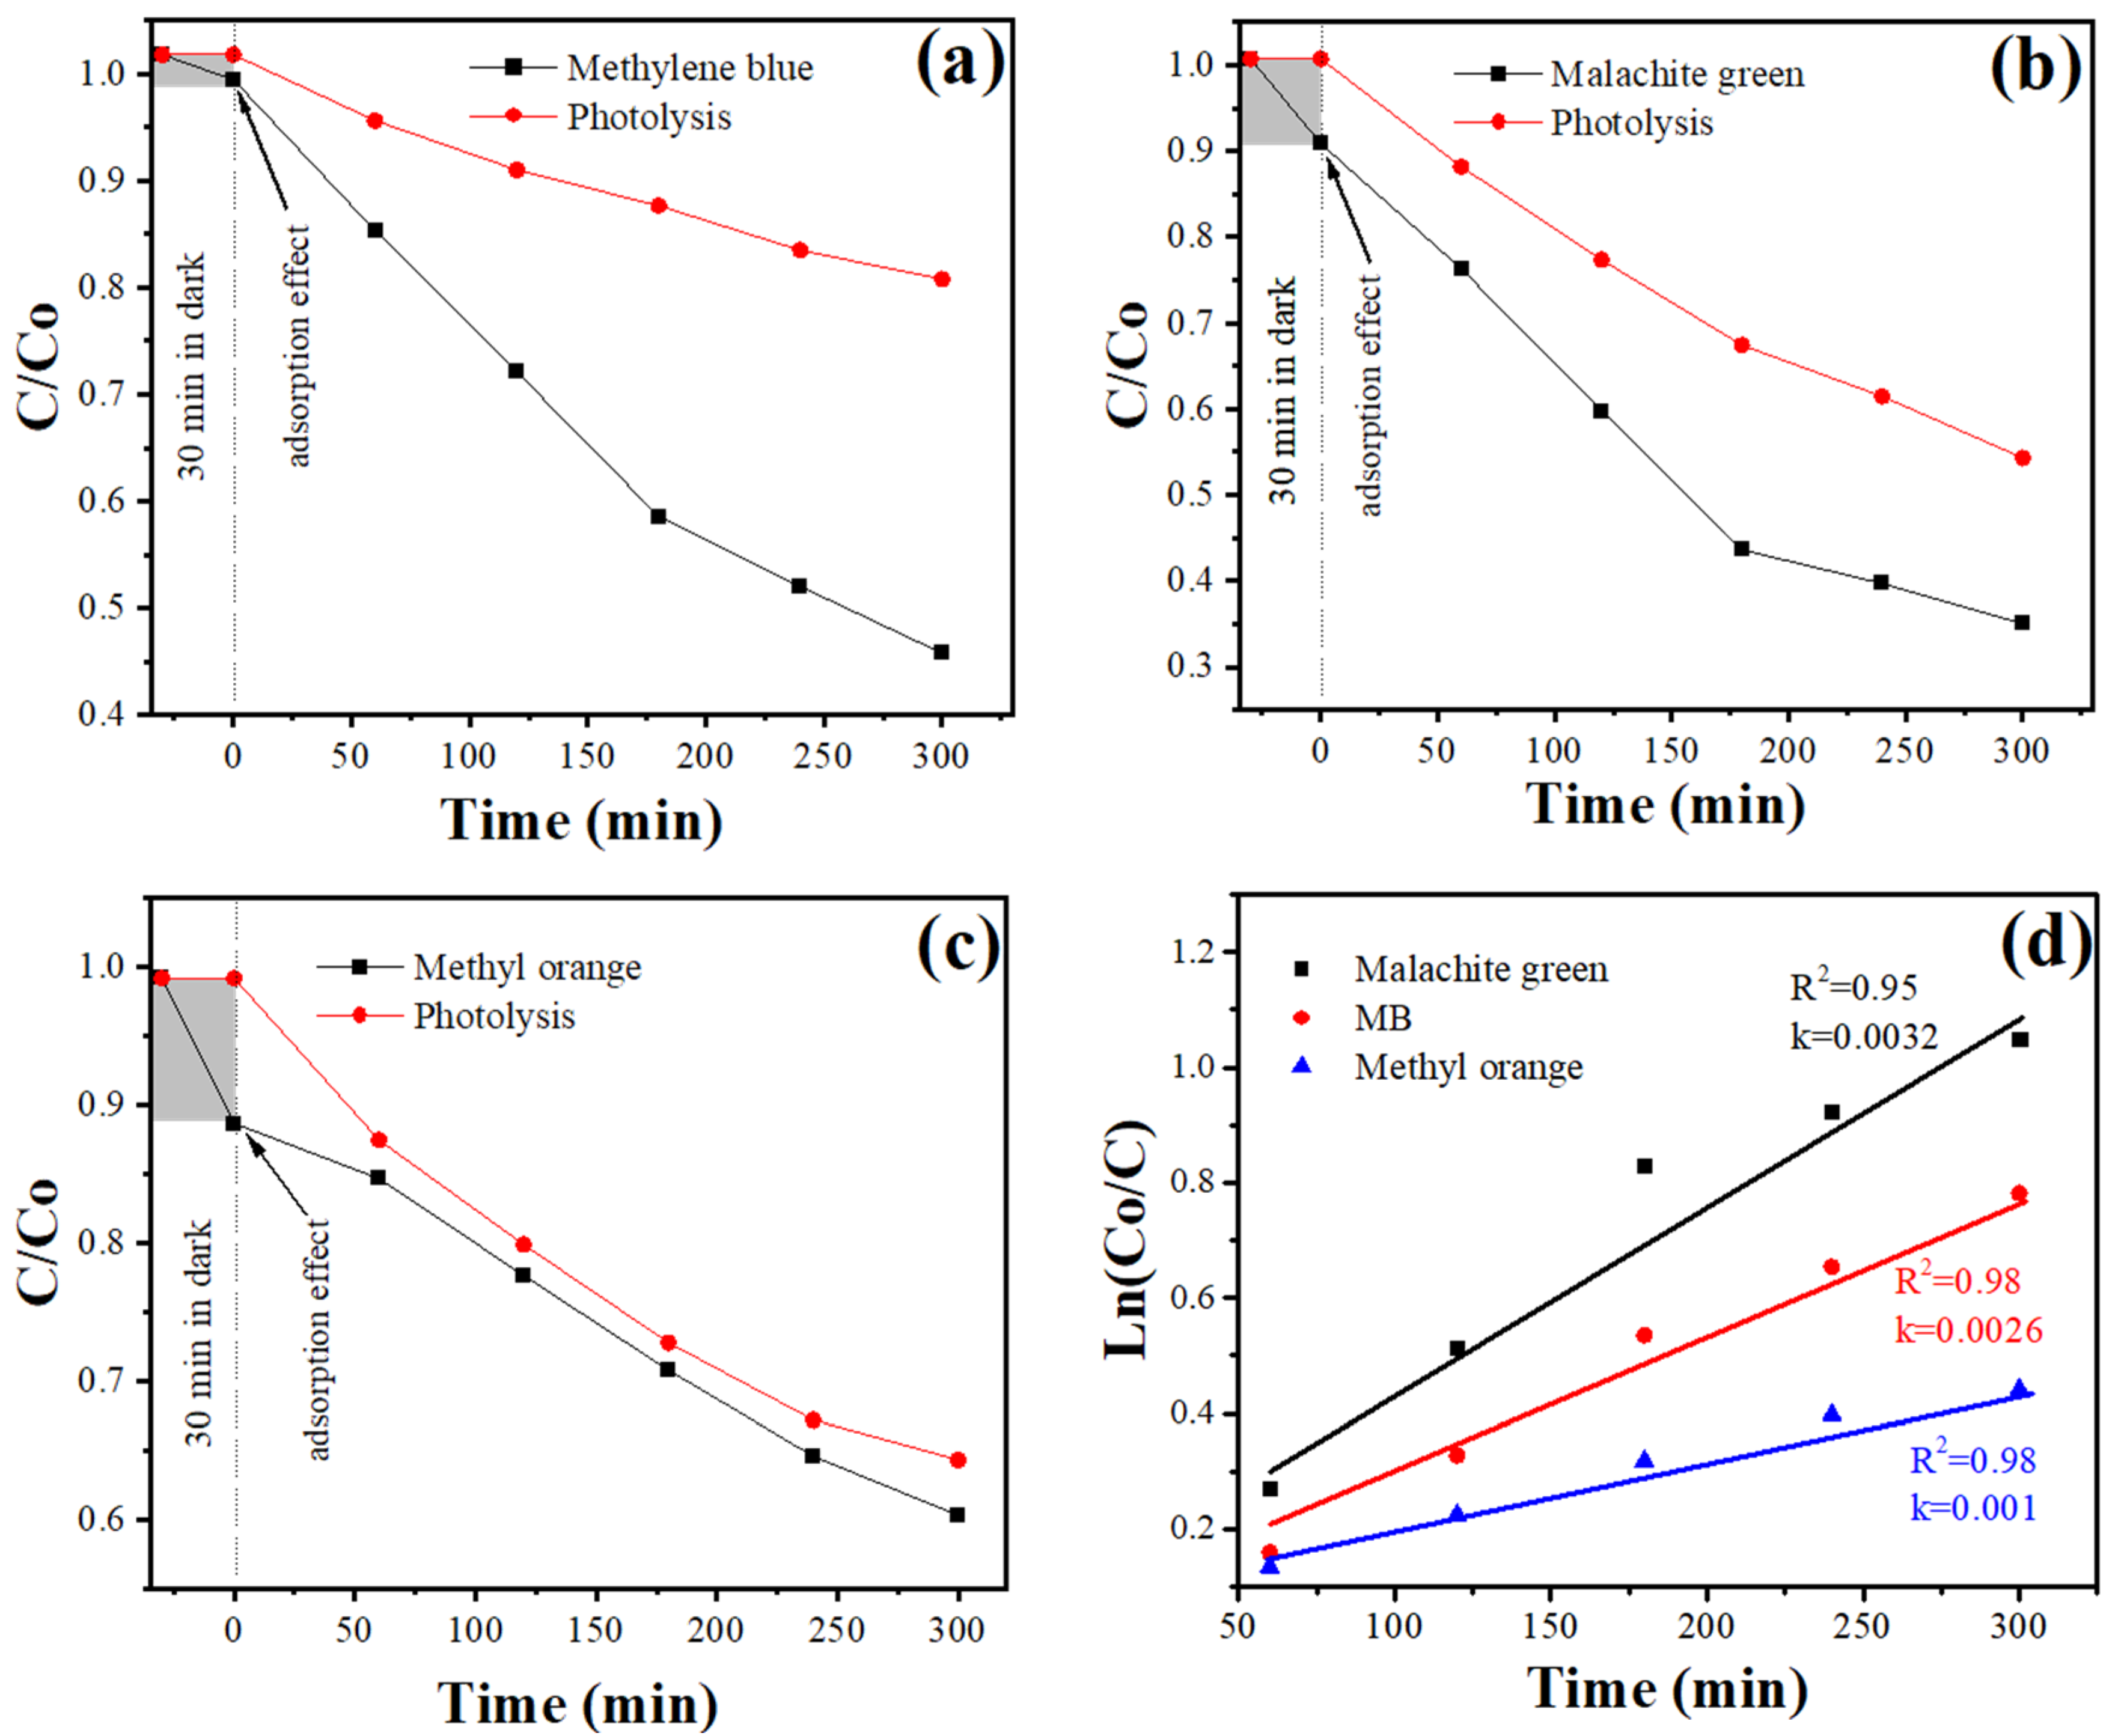
As shown in Figure 9a–c, after a 30 min dark adsorption period, the ZnSb2O6 pellets adsorbed approximately 1% of MB, 9% of MG, and about 11% of MO. These values reflect the adsorption effects, which help distinguish the photocatalytic contribution observed in the shaded area of Figure 9. When exposed to UV light irradiation, the concentration of MG decreased significantly, indicating effective photocatalytic degradation. Specifically, up to 50% of MG was decolorized after 300 min of irradiation, and approximately 60% of MB was degraded, while methyl orange showed no notable degradation throughout the experiment. These results demonstrate the promising photocatalytic potential of ZnSb2O6, similar to other antimoniates that have been investigated in photocatalytic applications [9,10,11,12].
Table 2 presents a literature review of the photocatalytic performance of ZnSb2O6, comparing our results with those in the literature. As observed, our results demonstrate competitive activity, highlighting the potential and versatility of ZnSb2O6 for photocatalytic applications. Table 2 also indicates that the use of multiple light sources, particularly multiple UV sources, correlates with higher degradation efficiencies. Moreover, the incorporation of dopants into ZnSb2O6 consistently leads to enhanced photocatalytic performance, likely due to improved charge separation and increased carrier mobility. Therefore, it is essential to emphasize the critical roles of light source energy and material modification in optimizing photocatalytic efficiency. Consequently, further investigation into these parameters will be undertaken in the future to maximize the performance of our results.
Materials with photocatalytic properties possess specific key properties and parameters that enable them to catalyze chemical reactions under the action of light. These parameters determine their efficiency in processes such as the photodegradation of pollutants. Among the main parameters are bandgap, light absorption capacity, and surface area [62,63]. According to the literature, antimoniates with a trirutile crystalline structure have demonstrated good light absorption capacity [64,65], and their bandgap values typically range between 2 and 3.5 eV, making them suitable for photocatalytic applications [64]. In our case, we obtained a bandgap value of 3.35 eV. Additionally, the relative ease of controlling the morphology and, consequently, the surface area of these materials, makes them promising candidates for photocatalytic applications [9,10,11,12]. The observed microrod and microcuboid morphologies (Figure 5) suggest a high surface area and porosity, which is supported by BET measurements. This increased surface area plays a key role in the photocatalytic activity of the synthesized ZnSb2O6.
To describe the kinetics of the photo-discoloration process and estimate the kinetic parameter kap, the following first-order kinetic model was applied [61,66]:
ln C 0 C = k a p t
where kₐₚ is the apparent rate constant, C0 denotes the initial dye concentration, and C represents the dye concentration at any irradiation time t. Figure 9d shows that the photocatalytic reaction of ZnSb2O6 pellets fits well with a first-order model. The kₐₚ for MB, MG, and MO were 0.0026, 0.0032, and 0.001, respectively.
The estimated bandgap for the synthesized ZnSb2O6 powders was 3.35 eV, indicating that the material requires radiation with wavelengths equal to or less than 372 nm to initiate photocatalytic reactions. Consequently, the synthesized ZnSb2O6 powders are activated by UV light. This activation energy promotes the formation of electron–hole pairs, which are primarily responsible for generating highly reactive oxidizing species such as hydroxyl radicals ( OH ) and superoxide anions ( O 2 ). These radicals play a crucial role in the degradation of pollutants [67].
The photocatalytic reactions involve a series of processes initiated by the absorption of UV radiation in ZnSb2O6, leading to the generation of electron–hole pairs (see Equation (8)). The holes ( h + ) oxidize water, producing OH radicals (Equation (9)), while the electrons ( e ) reduce dissolved oxygen, forming O 2 radicals (Equation (10)). These reactive species participate in subsequent reactions: O 2 radicals can react with H + to generate more radicals (Equation (11)), facilitating chain reactions that promote the mineralization of organic contaminants. Additionally, H O 2 , and O 2 radicals react to form hydrogen peroxide H2O2 (Equation (12)), which can be reduced by electrons to produce more OH radicals (Equation (13)). Furthermore, O H radicals can interact with holes ( h + ) to form more OH radicals (Equation (14)). As mentioned, collectively, these processes lead to the degradation and mineralization of organic pollutants [9,66,68,69], such as the dyes studied in this work.
Z n S b 2 O 6 + h v e + h +
h + + H 2 O OH + H +
O 2 + e O 2
O 2 + H + H O 2
H O 2 + O 2 H 2 O 2 + O 2
H 2 O 2 + e OH + O H
O H + h + OH

4. Discussion and Limitations

While this study successfully demonstrates the synthesis of ZnSb2O6 and its promising bifunctional properties, it is essential to acknowledge certain limitations that provide avenues for future research.
A key parameter for any practical gas sensor is its selectivity—the ability to respond to a target gas in the presence of other interfering gases. In this study, while the sensor demonstrated a high sensitivity to CO and C3H8, its response to other common reducing gases (e.g., H2, ethanol) or oxidizing gases (e.g., NO2) was not evaluated. Future work should focus on comprehensive selectivity tests to determine the practical applicability of ZnSb2O6. Furthermore, long-term stability, response, and recovery times are critical for real-world performance. The current study provides a snapshot of the material’s sensitivity, but further investigations are needed to assess its stability over extended periods and multiple sensing cycles. Quantifying the response and recovery times would also provide a more complete picture of the sensor’s dynamic performance.
On the other hand, in the photocatalytic evaluation, the material effectively degraded the cationic dyes malachite green and methylene blue. However, it showed no notable degradation of the anionic dye, methyl orange. This suggests that surface charge interactions may influence the photocatalytic activity. It is plausible that the surface of ZnSb2O6 under the experimental conditions is negatively charged, leading to the electrostatic repulsion of the anionic methyl orange molecules. This hypothesis warrants further investigation through zeta potential measurements and testing with other anionic pollutants. Additionally, to better contextualize the photocatalytic efficiency, a direct comparison against a standard benchmark material, such as TiO2 P25, under identical experimental conditions would be highly valuable. Additionally, the material can be further optimized through the strategies explored in recent electrocatalytic studies [70], which have demonstrated that enhancing oxidation reaction efficiency by controlling the interaction between metal centers and modifying the electronic structure can significantly enhance the catalytic mechanism in water oxidation and, consequently, improve photocatalysis. This would enable a more objective evaluation of the material’s performance regarding the current state-of-the-art techniques.

5. Conclusions

This study successfully demonstrated the synthesis of ZnSb2O6 pellets using a microwave-assisted wet chemistry method, resulting in microstructures with high homogeneity and a low production cost. Structural characterization confirmed the formation of a tetragonal trirutile phase of the ZnSb2O6 semiconductor. UV–vis spectroscopy revealed a bandgap of 3.35 eV, indicating that the material is activated by UV light. Morphological analysis revealed porous microstructures in the form of microrods and cuboids. Additionally, porosity and surface area measurements obtained using BET equipment indicated that the material possesses a mesoporous structure, with a total pore volume of 0.0831 cm3/g, predominantly consisting of pores in the range of 10 to 40 nm, and a specific surface area of 6 m2/g. These characteristics contribute significantly to the material’s effectiveness in gas sensing and photocatalytic activity. The gas sensing tests indicated that ZnSb2O6 pellets exhibit a high sensitivity to CO and C3H8, with maximum responses of 5.86 and 1.04 at 300 °C. The response increased with both temperature and gas concentration, attributable to the enhanced adsorption and desorption processes of surface oxygen species at elevated temperatures. The observed decrease in electrical resistivity with rising temperature further corroborates the effective material charge transfer mechanisms during gas detection. Photocatalytic evaluations demonstrated that ZnSb2O6 degrades organic dyes such as malachite green and methylene blue under UV irradiation, following first-order kinetics. The bandgap and surface properties facilitate the generation of reactive oxygen species, which supports its photocatalytic activity. Overall, the synthesized ZnSb2O6 exhibits promising properties for dual applications in toxic gas sensing and photocatalysis, combining low-cost synthesis and functional performance. These findings support the further development and optimization of ZnSb2O6-based devices for environmental monitoring and the degradation of water pollutants.

Author Contributions

Conceptualization, J.M.-B., H.G.-B., L.I.J.-A., A.G.-B., V.-M.R.-B., J.A.R.-O., J.T.G.-B., and M.d.l.L.O.-A.; methodology, H.G.-B., V.-M.R.-B., and J.A.R.-O.; software, A.G.-B., and J.T.G.-B.; validation, H.G.-B., A.G.-B., V.-M.R.-B., and J.T.G.-B.; formal analysis, L.I.J.-A., A.G.-B., J.M.-B., M.d.l.L.O.-A., J.T.G.-B., and J.A.R.-O.; investigation, H.G.-B., J.M.-B., J.A.R.-O., V.-M.R.-B., L.I.J.-A., and A.G.-B.; resources, H.G.-B., A.G.-B., V.-M.R.-B., and J.T.G.-B.; data curation, H.G.-B., A.G.-B., and J.T.G.-B.; writing—original draft preparation, J.M.-B., J.A.R.-O., M.d.l.L.O.-A., and H.G.-B.; writing—review and editing, H.G.-B., J.M.-B., V.-M.R.-B., A.G.-B., L.I.J.-A., J.T.G.-B., and J.A.R.-O.; visualization, H.G.-B., J.M.-B., V.-M.R.-B., A.G.-B., L.I.J.-A., J.T.G.-B.; supervision, H.G.-B., A.G.-B., V.-M.R.-B., and J.T.G.-B.; project administration, H.G.-B., A.G.-B., V.-M.R.-B., and J.T.G.-B.; funding acquisition, H.G.-B., and V.-M.R.-B. All authors have read and agreed to the published version of the manuscript.

Funding

This research received no external funding.

Acknowledgments

The authors thank Mexico’s Secretary of Science, Humanities, Technology and Innovation (Secihti), and the University of Guadalajara for the support granted. Jacob Morales-Bautista thanks Secihti for the scholarships received. Likewise, we thank Darío Pozas Zepeda, Víctor-Manuel Soto–García, René Morán Salazar, Sergio Gómez Salazar, and Miguel–Ángel Luna-Arias for their technical assistance. This research was carried out following the line of research “Nanostructured Semiconductor Oxides” of the academic group UDG–CA–895 “Nanostructured Semiconductors” of CUCEI, University of Guadalajara.

Conflicts of Interest

The authors declare no conflicts of interest.

References

  1. Roper, A.; Leverett, P.; Murphy, T.; Williams, P. Stabilities of byströmite, MgSb2O6, ordoñezite, ZnSb2O6 and rosiaite, PbSb2O6, and their possible roles in limiting antimony mobility in the supergene zone. Mineral. Mag. 2015, 79, 537–544. [Google Scholar] [CrossRef]
  2. Webmineral. Ordonezite. Available online: https://www.webmineral.com/data/Ordonezite.shtml (accessed on 21 May 2025).
  3. Jackson, A.J.; Parrett, B.J.; Willis, J.; Ganose, A.M.; Leung, W.W.; Liu, Y.; Williamson, B.A.D.; Kim, T.K.; Hoesch, M.; Veiga, L.S.I.; et al. Computational Prediction and Experimental Realization of Earth-Abundant Transparent Conducting Oxide Ga-Doped ZnSb2O6. ACS Energy Lett. 2022, 7, 3807–3816. [Google Scholar] [CrossRef]
  4. Dąbrowska, G. Reactivity of ZnSb1O6 with ZnTa2O6 and some properties of new limited ZnSb2-xTaxO6 solid solution with tri-rutile structure. Thermochim. Acta 2015, 614, 62–67. [Google Scholar] [CrossRef]
  5. Hussoyn, E.; Repelin, Y.; Brussrt, H.; Cerez, A. Spectres de vibration et calcul du champ de force des antimoniates et des tantalates de structure trirutile. Spectrochim. Acta 1979, 35A, 1177–1187. [Google Scholar] [CrossRef]
  6. Haeuseler, H. Infrared and Raman spectra and normal coordinate calculations on trirutile-type compounds. Spectrochim. Acta Part A 1981, 37, 487–495. [Google Scholar] [CrossRef]
  7. Balasubramaniam, M.; Balakumar, S. Nanostructuring of a one-dimensional zinc antimonate electrode material through a precipitation strategy for use in supercapacitors. New J. Chem. 2018, 42, 6613–6616. [Google Scholar] [CrossRef]
  8. Li, J.; Du, K.; Lai, Y.; Chen, Y.; Zhang, Z. ZnSb2O6: An advanced anode material for Li-ion batteries. J. Mater. Chem. A 2017, 5, 10843–10848. [Google Scholar] [CrossRef]
  9. Nagarajan, A.; Naraginti, S. Facile synthesis of N-MgSb2O6 trirutile antimonate and its enhanced photocatalytic performance. Int. J. Environ. Anal. Chem. 2020, 102, 7938–7952. [Google Scholar] [CrossRef]
  10. Nagarajan, A.; Vijayaraghavan, R. Enhanced photocatalytic activity of nanocrystalline N-doped ZnSb2O6: Role of N doping, cation ordering, particle size and crystallinity. RSC Adv. 2014, 4, 65223–65231. [Google Scholar]
  11. Dutta, D.P.; Ballal, A.; Singh, A.; Fulekar, M.H.; Tyagi, A.K. Multifunctionality of rare earth doped nano ZnSb2O6, CdSb2O6 and BaSb2O6: Photocatalytic properties and white light emission. Dalton Trans. 2013, 42, 16887–16897. [Google Scholar] [CrossRef] [PubMed]
  12. Nagarajan, A. Band gap engineering and photocatalytic activity of new trirutile structure Zn1-xMgxSb2O6 (0 < x < 1) solid solution. Indian J. Chem. 2021, 60A, 220–227. [Google Scholar]
  13. Michel, C.R.; Lopez Contreras, N.L.; Lopez-Alvarez, M.A.; Martinez-Preciado, A.H. Gas selectivity of nanostructured ZnSb2O6 synthesized by a colloidal method. Sens. Actuators B Chem. 2012, 171–172, 686–690. [Google Scholar] [CrossRef]
  14. Mizoguchi, H.; Woodward, P.M. Electronic structure studies of main group oxides possessing edge-sharing octahedra: Implications for the design of transparent conducting oxides. Chem. Mater. 2004, 16, 5233–5248. [Google Scholar] [CrossRef]
  15. Jiang, L.; Dong, C.; Lai, Y.; Chen, Y.; Zhang, Z.; Lv, S.; Wang, J.; Pan, S.; Wang, C.; Sun, P.; et al. Mixed potential type methanol gas sensor based on Gd2Zr2O7 solid state electrolyte and ZnSb2O6 sensing electrode. Sens. Actuators B Chem. 2023, 397, 134630. [Google Scholar] [CrossRef]
  16. Guillen-Bonilla, H.; Rodríguez-Betancourtt, V.-M.; Guillén-Bonilla, J.-T.; Reyes-Gómez, J.; Gildo-Ortiz, L.; Flores-Martínez, M.; Olvera-Amador, M.L. CO and C3H8 Sensitivity Behavior of Zinc Antimonate Prepared by a Microwave-Assisted Solution Method. J. Nanomater. 2015, 2015, 979543. [Google Scholar] [CrossRef]
  17. Manasa, S.; Gundeboina, R.; Perala, V.; Kammara, V.; Vithal, M. Carbon nanospheres supported visible-light-driven ZnSb2O6: Synthesis, characterization and photocatalytic degradation studies. SN Appl. Sci. 2019, 1, 1046. [Google Scholar]
  18. Balasubramaniam, M.; Balakumar, S. Contribution of Tin in Electrochemical Properties of Zinc Antimonate Nanostructures: An Electrode Material for Supercapacitors. AIP Conf. Proc. 2018, 1942, 140013. [Google Scholar] [CrossRef]
  19. Singh, S.; Singh, A.; Singh, A.; Tandon, P. A stable and highly sensitive room-temperature liquefied petroleum gas sensor based on nanocubes/cuboids of zinc antimonate. RSC Adv. 2020, 10, 20349–20357. [Google Scholar] [CrossRef] [PubMed]
  20. Ding, W.; Wang, X.; Yang, C.; Wang, P.; Tian, W.; Zhao, K.; Zhang, K. Machine Learning-Motivated Trace Triethylamine Identification by Bismuth Vanadate/Tungsten Oxide Heterostructures. J. Colloid Interface Sci. 2025, 682, 1140–1150. [Google Scholar] [CrossRef]
  21. Teymourian, H.; Salimi, A.; Hallah, R. An Electrochemical Sensor Based on Gold Nanoparticle Decorated Carbon Nanotubes for Simultaneous Determination of Hydrazine and Hydroquinone. Int. J. Electrochem. Sci. 2019, 14, 6267–6275. [Google Scholar]
  22. Liu, K.; Xu, Y.; Tian, X.; Zhou, W.; Chen, H.; Zhang, X.; Li, Y.; Wang, M.; Yang, L.; Liu, F. Stacking Growth of Ionically Conductive MOF on Biofabrics Enables Reliable NH3 Sensor for Hepatic Encephalopathy Diagnosis. NPJ Flex. Electron. 2025, 9, 67. [Google Scholar] [CrossRef]
  23. Balasubramaniam, M.; Balakumar, S. A review on multifunctional attributes of zinc antimonate nanostructures towards energy and environmental applications. Chem. Pap. 2020, 74, 55–75. [Google Scholar] [CrossRef]
  24. Tamaki, J.; Yamada, Y.; Yamamoto, Y.; Matsuoka, M.; Ota, I. Sensing properties to dilute hydrogen sulfide of ZnSb2O6 thick-film prepared by dip-coating method. Sens. Actuators B Chem. 2000, 66, 70–73. [Google Scholar] [CrossRef]
  25. Biswas, A.; Bayer, I.S.; Biris, A.S.; Wang, T.; Dervishi, E.; Faupel, F. Advances in top–down and bottom–up surface nanofabrication: Techniques, applications & future prospects. Adv. Colloid Interface Sci. 2012, 170, 2–27. [Google Scholar] [CrossRef]
  26. Dhand, C.; Dwivedi, N.; Loh, X.J.; Jie Ying, A.N.; Verma, N.K.; Beuerman, R.W.; Lakshminarayanan, R.; Ramakrishna, S. Methods and strategies for the synthesis of diverse nanoparticles and their applications: A comprehensive overview. RSC Adv. 2015, 5, 105003–105037. [Google Scholar] [CrossRef]
  27. Anbuvannan, M.; Ramesh, M.; Viruthagiri, G.; Shanmugam, N.; Kannadasan, N. Synthesis, characterization and photocatalytic activity of ZnO nanoparticles prepared by biological method. Spectrochim. Acta Part A Mol. Biomol. Spectrosc. 2015, 143, 304–308. [Google Scholar] [CrossRef] [PubMed]
  28. Sing, S.W. Characterization of Porous Solids: An Introductory Survey. Stud. Surf. Sci. Catal. 1991, 62, 1–9. [Google Scholar]
  29. Lin, T.; Lv, X.; Li, S.; Wang, Q. The Morphologies of the Semiconductor Oxides and Their Gas-Sensing Properties. Sensors 2017, 17, 2779. [Google Scholar] [CrossRef]
  30. Qi, X.; Zhu, X.; Wu, J.; Wu, Q.; Li, X.; Gu, M. Controlled synthesis of BiVO4 with multiple morphologies via an ethylenediamine-assisted hydrothermal method. Mater. Res. Bull. 2014, 59, 435–441. [Google Scholar] [CrossRef]
  31. Mo, M.-S.; Wang, D.; Du, X.; Ma, J.; Qian, X.; Chen, D.; Qian, Y. Engineering of nanotips in ZnO submicrorods and patterned arrays. Cryst. Growth Des. 2009, 9, 2. [Google Scholar] [CrossRef]
  32. Deng, Z.-X.; Wang, C.; Sun, X.-M.; Li, Y.-D. Structure-directing coordination template effect of ethylenediamine in formations of ZnS and ZnSe nanocrystallites via solvothermal route. Inorg. Chem. 2002, 41, 869−873. [Google Scholar] [CrossRef]
  33. Gao, X.; Li, X.; Yu, W. Flowerlike ZnO nanostructures via hexamethylenetetramine-assisted thermolysis of zinc-ethylenediamine complex. J. Phys. Chem. B 2005, 109, 1155–1161. [Google Scholar] [CrossRef]
  34. Shen, X.; Liu, Q.; Ji, Z.; Zhu, G.; Zhou, H.; Chen, K. Controlled synthesis and gas sensing properties of porous Fe2O3/NiO hierarchical nanostructures. CrystEngComm 2015, 17, 5522–5529. [Google Scholar] [CrossRef]
  35. Jamil, S.; Jing, X.; Wang, J.; Li, S.; Liu, J.; Zhang, M. The synthesis of porous Co3O4 micro cuboid structures by solvothermal approach and investigation of its gas sensing properties and catalytic activity. Mater. Res. Bull. 2013, 48, 4513–4520. [Google Scholar] [CrossRef]
  36. Prabhakar Rai, H.; Song, H.-M.; Kim, Y.-S.; Song, M.-K.; Oh, P.-R.; Yoon, J.-M.; Yu, Y.-T. The synthesis and characterization of layered double hydroxides with enhanced thermal stability. Mater. Lett. 2012, 68, 90–93. [Google Scholar]
  37. Juárez-Amador, L.I.; Guillén-Bonilla, H.; Guillén-Bonilla, A.; Guillén-Bonilla, J.T.; Morales-Bautista, J.; Casillas-Zamora, A.; Rodríguez-Betancourtt, V.M.; Olvera-Amador, M.L. Photocatalytic and sensing properties in propane atmospheres of MgSb2O6 nanoparticles synthesized by a chemical method. J. Mater. Sci. Mater. Electron. 2024, 35, 1857. [Google Scholar] [CrossRef]
  38. Carbajal-Franco, G.; Tiburcio-Silver, A.; Domínguez, J.M.; Sánchez-Júarez, A. Thin film tin oxide-based propane gas sensors. Thin Solid Films 2000, 373, 141–144. [Google Scholar] [CrossRef]
  39. Gómez-Pozos, H.; Karthik, T.V.; Olvera, M.d.l.L.; Barrientos, A.G.; Pérez Cortés, O.; Vega-Pérez, J.; Maldonado, A.; Pérez-Hernández, R.; Rodríguez-Lugo, V. ZnO thin films as propane sensors: Band structure models to explicate the dependence between the structural and morphological properties on gas sensitivity. J. Phys. Chem. Solids 2017, 106, 16–28. [Google Scholar] [CrossRef]
  40. Karthik, T.V.K.; Olvera-Amador, M.L.; Maldonado, A.; Hernandez, A.G.; Gómez-Pozos, H. Propane gas-sensing properties of pure and Pd-doped tin oxide nanostructures. J. Mater. Sci. Mater. Electron. 2023, 34, 228. [Google Scholar] [CrossRef]
  41. Singh, S.; Singh, A.; Singh, A.; Rathore, S.; Yadav, B.C.; Tandon, P. Nanostructured cobalt antimonate: A fast responsive and highly stable sensing material for liquefied petroleum gas detection at room temperature. RSC Adv. 2020, 10, 33770–33781. [Google Scholar] [CrossRef]
  42. Meena, D.; Jain, M.; Bhatnagar, M.C. Resistive gas sensors based on nanostructured ternary metal oxide: A review. J. Mater. Sci. 2024, 59, 12177–12218. [Google Scholar] [CrossRef]
  43. Hsiao, C.-C.; Luo, L.-S. A Rapid Process for Fabricating Gas Sensors. Sensors 2014, 14, 12219–12232. [Google Scholar] [CrossRef]
  44. Baraton, M.-I.; Merhari, L. Electrical behavior of semiconducting nanopowders versus environment. Adv. Mater. Sci. 2003, 4, 15–24. [Google Scholar]
  45. Gao, X.; Zhang, T. An overview: Facet-dependent metal oxide semiconductor gas sensors. Sens. Actuators B Chem. 2018, 277, 604–633. [Google Scholar] [CrossRef]
  46. Gildo-Ortiz, L.; Rodríguez-Betancourtt, V.-M.; Ramírez Ortega, J.A.; Blanco-Alonso, O. An Alternative Approach for the Synthesis of Zinc Aluminate Nanoparticles for CO and Propane Sensing Applications. Chemosensors 2023, 11, 105. [Google Scholar] [CrossRef]
  47. Guillen Bonilla, J.T.; Jiménez Rodríguez, M.; Bonilla, H.G.; Bonilla, A.G.; Padilla, E.H.; Morales, M.E.S.; Flores Jiménez, A.B.; Gutiérrez, J.C.E. The Design, Simulation, and Construction of an O2, C3H8, and CO2 Gas Detection System Based on the Electrical Response of MgSb2O6 Oxide. Technologies 2025, 13, 79. [Google Scholar] [CrossRef]
  48. Guillén-Bonilla, A.; Guillén-Bonilla, J.T.; Guillén-Bonilla, H.; Huízar-Padilla, E.; Zamora, A.C.; Olvera Amador, M.d.L.L.; Rodríguez-Betancourtt, V.M. A theoretical and experimental study on the dynamic response in propane atmospheres of sensors made from trirutile magnesium antimonate powders. J. Mater. Sci. Mater. Electron. 2024, 35, 1849. [Google Scholar] [CrossRef]
  49. Yu, S.; Jia, X.; Zhang, J.; Yang, W.; Song, H. Recent advances in different materials for moisture resistance of metal oxide-based gas sensors: A review. Chem. Eng. J. 2025, 505, 159639. [Google Scholar] [CrossRef]
  50. Sheng, H.; Li, H.; Huang, Y.; Zhang, B.; Liang, J.; Zhou, X.; Tian, Y.; Li, Q. The Sensing Selectivity of Gas Sensors Based on Different Sn-Doped Indium Oxide Films. Chemosensors 2025, 13, 169. [Google Scholar] [CrossRef]
  51. Kita, J.; Engelbrecht, A.; Schubert, F.; Groß, A.; Rettig, F.; Moos, R. Some practical points to consider with respect to thermal conductivity and electrical resistivity of ceramic substrates for high-temperature gas sensors. Sens. Actuators B Chem. 2015, 213, 541–546. [Google Scholar] [CrossRef]
  52. Zhang, R.; Wang, Y.; Zhang, Z.; Cao, J. Highly Sensitive Acetone Gas Sensor Based on g-C3N4 Decorated MgFe2O4 Porous Microspheres Composites. Sensors 2018, 18, 2211. [Google Scholar] [CrossRef]
  53. Michel, G.; Martínez, A.H.; Jiménez, S. Gas sensing response of nanostructured trirutile-type CoSb2O6 synthesized by solution-polymerization method. Sens. Actuators B 2008, 132, 45–51. [Google Scholar] [CrossRef]
  54. Wang, C.; Yin, L.; Zhang, L.; Xiang, D.; Gao, R. Metal Oxide Gas Sensors: Sensitivity and Influencing Factors. Sensors 2010, 10, 2088–2106. [Google Scholar] [CrossRef]
  55. Rama Murthy, S.A.; Prabhu, E.; Clinsha, P.C.; Ravindranath Nair, A.; Gnanasekar, K.I.; Jayaraman, V. Role of oxygen species towards chemical sensing by semiconducting oxides. Appl. Surf. Sci. 2019, 487, 362–368. [Google Scholar]
  56. Srivastava, J.K.; Pandey, P.; Mishra, V.N.; Dwivedi, R. Sensing mechanism of Pd-doped SnO2 sensor for LPG detection. Solid State Sci. 2009, 11, 1602–1605. [Google Scholar] [CrossRef]
  57. Yang, X.; Zhang, S.; Yu, Q.; Zhao, L.; Sun, P.; Wang, T.; Liu, F.; Yan, X.; Gao, Y.; Liang, X.; et al. One step synthesis of branched SnO2/ZnO heterostructures and their enhanced gas-sensing properties. Sens. Actuators B 2019, 281, 415–423. [Google Scholar] [CrossRef]
  58. Gildo-Ortiz, L.; Reyes-Gómez, J.; Flores-Álvarez, J.M.; Guillén-Bonilla, H.; Olvera, M.; Rodríguez Betancourtt, V.M.; Verde-Gómez, Y.; Guillén-Cervantes, A.; Santoyo-Salazar, J. Synthesis, characterization and sensitivity tests of perovskite-type LaFeO3 nanoparticles in CO and propane atmospheres. Ceram. Int. 2016, 42, 18821–18827. [Google Scholar] [CrossRef]
  59. Kapse, V.D. Preparation of Nanocrystalline Spinel-type oxide Materials for Gas sensing Applications. Res. J. Chem. Sci. 2015, 5, 7–12. [Google Scholar]
  60. Wu, S.; Li, G.; Zhang, Y.; Zhang, W. Surface photoelectric and visible light driven photocatalytic properties of zinc antimonate-based photocatalysts. Mater. Res. Bull. 2013, 48, 1117–1121. [Google Scholar] [CrossRef]
  61. Liu, W.; Lin, P.; Jin, H.; Xue, H.; Zhang, Y.; Li, Z. Nanocrystalline ZnSb2O6: Hydrothermal synthesis, electronic structure and photocatalytic activity. J. Mol. Catal. A Chem. 2011, 349, 80–85. [Google Scholar] [CrossRef]
  62. Gnanaprakasam, A.; Sivakumar, V.M.; Thirumarimurugan, M. Influencing parameters in the photocatalytic degradation of organic effluent via nanometal oxide catalyst: A review. Indian J. Mater. 2015, 2015, 601827. [Google Scholar] [CrossRef]
  63. Jabbar, Z.H.; Graimed, B.H. Recent developments in industrial organic degradation via semiconductor heterojunctions and the parameters affecting the photocatalytic process: A review study. J. Water Process Eng. 2022, 47, 102671. [Google Scholar] [CrossRef]
  64. Charif, R.; Makhloufi, R.; Chaba Mouna, S.; Chadli, A.; Barkat, A.; Nouiri, M. Structural, electronic, optical, mechanical, and phononic bulk properties of tetragonal trirutile antimonate MSb2O6 (M = Fe, Co, Ni, or Zn): A first-principles prediction for optoelectronic applications. Phys. Scr. 2024, 99, 125909. [Google Scholar] [CrossRef]
  65. Ham, K.; Hong, S.; Kang, S.; Cho, K.; Lee, J. Extensive active-site formation in trirutile CoSb2O6 by oxygen vacancy for oxygen evolution reaction in anion exchange membrane water splitting. ACS Energy Lett. 2021, 6, 364–370. [Google Scholar] [CrossRef]
  66. Tran, H.D.; Nguyen, D.Q.; Do, P.T.; Tran, U.N.P. Kinetics of photocatalytic degradation of organic compounds: A mini-review and new approach. RSC Adv. 2023, 13, 16915. [Google Scholar] [CrossRef]
  67. Shaikh, B.; Ali Bhatti, M.; Ahmed Shah, A.; Tahira, A.; Karim Shah, A.; Usto, A.; Aftab, U.; Bukhari, S.I.; Alshehri, S.; Shah Bukhari, S.D.U.; et al. Mn3O4@ZnO Hybrid Material: An Excellent Photocatalyst for the Degradation of Synthetic Dyes Including Methylene Blue, Methyl Orange and Malachite Green. Nanomaterials 2022, 12, 3754. [Google Scholar] [CrossRef]
  68. Kaur, H.; Hippargi, G.; Pophali, G.R.; Bansiwal, A.K. Treatment methods for removal of pharmaceuticals and personal care products from domestic wastewater. In Pharmaceuticals and Personal Care Products: Waste Management and Treatment Technology; Elsevier: Amsterdam, The Netherlands, 2019; pp. 129–150. [Google Scholar]
  69. Gouvea, C.A.K.; Wypych, F.; Moraes, S.G.; Duran, N.; Nagata, N.; Peralta-Zamora, P. Semiconductor-assisted photocatalytic degradation of reactive dyes in aqueous solution. Chemosphere 2000, 40, 433–440. [Google Scholar] [CrossRef] [PubMed]
  70. Liu, Y.; Li, L.; Li, X.; Xu, Y.; Wu, D.; Sakthivel, T.; Guo, Z.; Zhao, X.; Dai, Z. Asymmetric tacticity navigates the localized metal spin state for sustainable alkaline/sea water oxidation. Sci. Adv. 2025, 11, eads0861. [Google Scholar] [CrossRef] [PubMed]
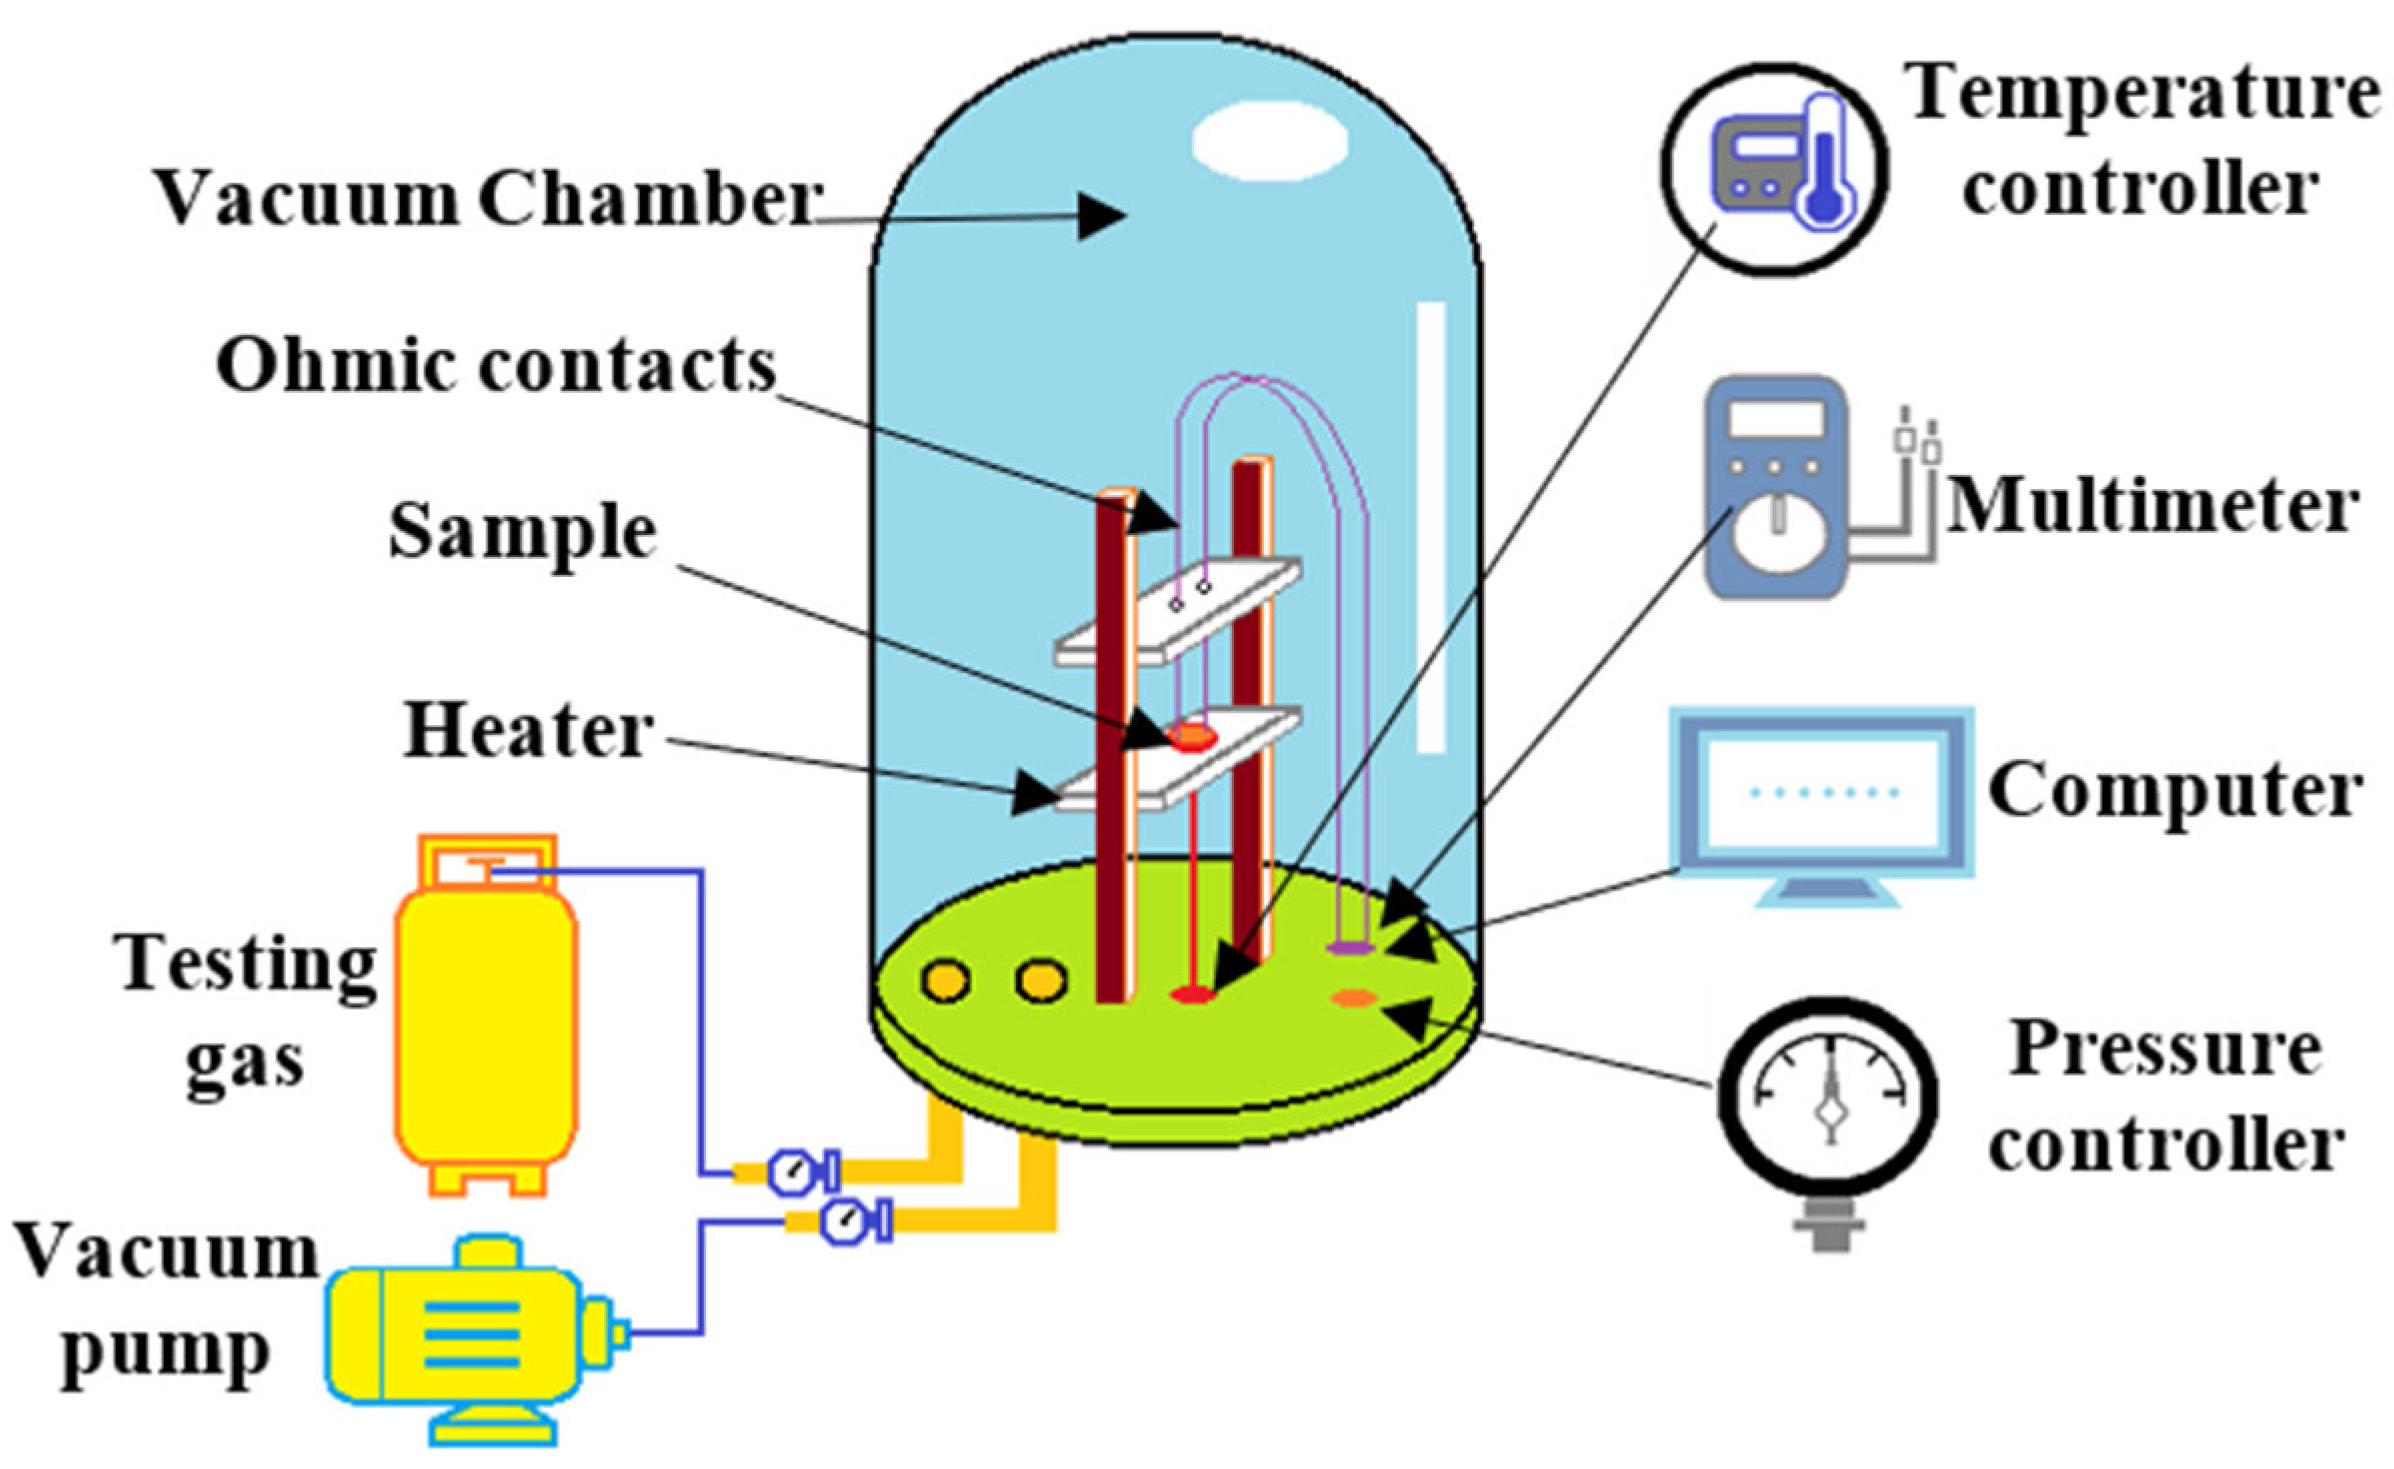
Figure 1. Diagram of the gas sensing equipment used to monitor the electrical resistance change in the sensing materials.
Chemosensors 13 00329 g001
Figure 2. X-ray diffraction (XRD) pattern of ZnSb2O6 powders calcined at 600 °C.
Chemosensors 13 00329 g002
Figure 3. (a) Reflectance spectrum of ZnSb2O6 obtained at 600 °C, (b) graph to determine its bandgap value.
Chemosensors 13 00329 g003
Figure 4. Raman spectrum of ZnSb2O6 with a trirutile-type structure calcined at 600 °C.
Chemosensors 13 00329 g004
Figure 5. (a,b) SEM micrographs showing microrods, (c,d) microcuboids, and (e) length distribution of the microrods.
Chemosensors 13 00329 g005
Figure 6. (a) Response of the zinc antimonate (ZnSb2O6) pellets as a function of CO concentration, (b) response in CO as a function of temperature, (c) response as a function of C3H8 concentration, (d) response in C3H8 as a function of temperature.
Chemosensors 13 00329 g006
Figure 7. Electrical resistivity variation of zinc antimonate (ZnSb2O6) pellets as a function of (a) CO concentration at various temperatures, (b) C3H8 concentration at various temperatures, (c) temperature for various CO concentrations, (d) temperature for various C3H8 concentrations.
Chemosensors 13 00329 g007
Figure 8. Calibration curve for aqueous solutions of malachite green (MG), methylene blue (MB), and methyl orange (MO).
Chemosensors 13 00329 g008
Figure 9. Photocatalytic discoloration of (a) methylene blue, (b) malachite green, (c) methyl orange, and (d) kinetic model of discoloration.
Chemosensors 13 00329 g009
Table 1. Electrical characterization results of ZnSb2O6 pellets.
CO (300 ppm)C3H8 (500 ppm)
Temp. (°C)Resistance (MΩ)Resistivity (Ω·m)Sensor ResponseTemp. (°C)Resistance (MΩ)Resistivity (Ω·m)Sensor Response
23250 7.95 × 10 6 023250 7.95 × 10 6 0
100185 5.88 × 10 6 0.27100172 5.47 × 10 6 0.32
20048.1 1.52 × 10 6 0.520031.4 0.99 × 10 6 0.56
3002.1 0.06 × 10 6 5.863005.7 0.18 × 10 6 1.04
Table 2. Literature review of the photocatalytic performance of ZnSb2O6.
Light SourceAnalyteDopingDegradation Percentage (%)Degradation Time (min)Reference
6 UV lampsRhodamine b-~95180[10]
6 UV lampsRhodamine bN~9780
4 UV lampsRhodamine b-~9595[11]
4 UV lampsRhodamine bTb/Eu~9595
Tungsten lampMethyl violet-~40180[17]
Tungsten lampMethyl violetCarbon ~92180
Xe lampRhodamine b-~10120 [60]
Xe lampRhodamine bN~70120
Full arc Xe lampRhodamine b-~10120
Full arc Xe lampRhodamine bN~95120
4 UV lampsMethyl orange-~80180[61]
4 UV lampsRhodamine b-~9960
UV lamp Methylene blue-~60300This work
UV lampMalachite green-~50300
Disclaimer/Publisher’s Note: The statements, opinions and data contained in all publications are solely those of the individual author(s) and contributor(s) and not of MDPI and/or the editor(s). MDPI and/or the editor(s) disclaim responsibility for any injury to people or property resulting from any ideas, methods, instructions or products referred to in the content.