Abstract
Escherichia coli (E. coli) is one of the most common strains that produce Shiga toxin, which can contaminate food and water, causing serious diseases and even endangering life. Therefore, the detection of E. coli is crucial for protecting public health. At present, most traditional methods have disadvantages such as long detection cycles, high cost, and complex operations. This article proposed a novel commercial Rayleigh surface acoustic wave (R-SAW) biosensor for the detection of trace amounts of E. coli, which utilized the coordination reaction between carboxyl (-COOH) groups and aluminum ions (Al3+) to form the bio-enhanced probes, enabling the 5-terminal -COOH-modified aptamers to be preferentially enriched and directionally immobilized on the electrode surface. The biosensor could complete the detection within 100 s, with a linear detection range of 103–108 cells/mL, a limit of detection (LOD) as low as 732 cells/mL, and a selectivity ratio of 3270:1. This article conducted spiked detection on six types of food, indicating that the biosensor had the advantages of rapid speed, high sensitive, wide detection range, low LOD, strong specificity, and low cost, providing an economical and convenient solution for detecting trace amounts of E. coli in food.
1. Introduction
Foodborne diseases are one of the most widespread and common public health issues in the world today [1,2]. The World Health Organization (WHO) reports that approximately 600 million people suffer from diseases, and 420,000 people die due to eating contaminated food each year globally, which includes about 220 million sick children and 96,000 dead children [1,3]. Unsafe food causes productivity losses and medical costs of about USD 95 billion a year in low- and middle-income countries [3]. As a common bacterium, Escherichia coli (E. coli) is widely present in the gastrointestinal tracts of many warm-blooded mammals, with most strains being harmless [4]. However, enterohemorrhagic E. coli exhibits high infectivity and pathogenicity in bacterial strain classifications, which can produce Shiga toxin, and belongs to a type of Shiga toxin-producing E. coli (STEC). The Shiga toxin can cause severe damage to intestinal cells by attacking small blood vessels, which is one of the important pathogens for causing foodborne diseases [1,4,5,6]. Normally, only 1–10 infectious units of E. coli can cause infection [7,8]. The potent toxicity can cause several diseases ranging from mild diarrhea to fatal hemorrhagic colitis (HC), hemolytic uremic syndrome (HUS), and thrombotic thrombocytopenic purpura (TTP). Children under 5 years old, the elderly, and immunocompromised individuals are more susceptible to developing severe diseases [1,2,9,10,11]. It is estimated that there are approximately 2.8 million cases of STEC infection each year globally [12]. According to the WHO, up to 10% of individuals infected with E. coli will develop fatal diseases such as HUS, with a mortality rate of 3–5% in severe cases, and even higher in pediatric cases [13]. E. coli is primarily transmitted through undercooked meat, unpasteurized dairy products, and contaminated fruits, vegetables, and water sources [9]. For example, in 1999, an outbreak of E.coli caused by contaminated livestock occurred in Jiangsu Province, China, resulting in 95 cases of HUS and 83 deaths, with a mortality rate of 87.37% [14]. In 1996, schools in Sakai City, Japan, provided students with lunches made from radish sprouts containing E.coli, resulting in over 9400 infections and 12 deaths. Among the infected people, there were large-scale cases of HUS, and most of them were children [15]. In 2000, the drinking water in Walkerton, Canada, was infected with E. coli, resulting in seven deaths and over 2000 infections [4]. In general, the appropriate microbiological quality for E. coli in food is <20 CFU/g, with the acceptable range of 20–<100 CFU/g [1]. But if the content of E. coli in ground beef is less than 0.1 CFU/g, it may cause an epidemic [16]. Safe milk must be essentially free of E. coli [17]. Thus, most countries, such as China, the United States, Japan, and countries under the European Commission, have mandatory regulations that prohibit the presence of E. coli in the above-mentioned foods [18]. Therefore, there is an urgent need to develop a fast, effective, and accurate method for detecting E. coli in food and water sources, which is of great significance for ensuring human health and safety and reducing the probability of E. coli infection.
At present, the detection of E. coli in the food industry still mainly adopts the plate counting method based on enrichment culture, which is low in cost and highly sensitive [19]. However, during the enrichment culture process, E. coli can enter a viable but non-culturable status, resulting in false-negative results. Additionally, this method has a long detection cycle, high labor intensity, and delayed results, typically taking about 4–7 days to complete the detection [20,21]. Enzyme-linked immunosorbent assay (ELISA) and polymerase chain reaction (PCR) are also commonly used to detect E. coli. Both methods exhibit high sensitivity, reliability, and reproducibility, but they are costly, involve complex operation processes, require specialized equipment and skilled technicians, and have detection times ranging from several hours to a full day [10,22]. The linear detection range of ELISA is generally 105–107 CFU/mL, which is relatively narrow, while the limit of detection (LOD) of PCR can only reach a minimum of 104 CFU/mL, which is relatively high [10,23]. Based on the shortcomings of traditional detection methods that cannot quickly and accurately detect trace amounts of E. coli in food and water sources, researchers have carried out extensive improvement work and searched for new detection methods to improve the detection efficiency of E.coli. Biosensors, as an efficient, fast, low-cost, highly sensitive, specific, and easy-to-operate method, are a real alternative to traditional methods because biosensors can provide label-free online analysis of the interaction between biometric elements and target detection molecules and offer multiple detection forms, thereby improving sensitivity and specificity [24]. When applied to the detection of E. coli in food and water, acoustic wave biosensors allow for rapid, real-time, and multiple analyses, with additional advantages of cost-effectiveness and ease of use.
An acoustic wave biosensor is a kind of mass sensor based on mechanical acoustic waves as the transduction mechanism. According to the process of acoustic wave guidance, acoustic wave biosensors can be divided into surface acoustic wave (SAW), bulk acoustic wave (BAW), and acoustic plate mode (APM) sensors [24]. Among them, the SAW biosensor can operate at higher frequencies, which means better sensitivity due to the reduced penetration depth of the acoustic wave into adjacent media [24,25]. Simultaneously, the acoustic wave of the SAW biosensor propagates along a single surface of the substrate with or without guidance, and the acoustic energy is limited to the surface of the sensor [24]. The series of advantages makes SAW biosensors highly sensitive to any changes that occur on the substrate surface, such as mass loading, viscosity, and conductivity changes [26]. Therefore, the SAW biosensor is considered to have an excellent signal transduction mechanism and is widely used to detect biomarkers such as proteins, DNA, large cells, and bacteria [22,27,28,29]. In addition, the SAW biosensor has the advantages of short detection time, low cost, simple operation, low requirements for laboratory equipment and technicians, high selectivity and sensitivity, and easy integration and miniaturization, making it one of the effective tools for detecting E. coli [9,22].
The SAW biosensors can be classified into shear horizontal/Love wave SAW (SH-SAW), Rayleigh wave SAW (R-SAW), and Lamb wave SAW (L-SAW) biosensors based on the type of acoustic wave propagation [22,30]. The laboratory prepared SH-SAW and L-SAW biosensors are usually used to detect various biomarkers in existing studies. The sensitive areas of these biosensors are covered with guiding layers, which can be directly used for liquid detection. However, these biosensors prepared under laboratory conditions have disadvantages, such as complex preparation processes, high cost, low success rate, significant performance differences between different batches, inability to mass produce, and poor repeatability and practicality [9,22]. In contrast, the R-SAW biosensor has higher mass loading sensitivity and does not require a guiding layer, which can induce acoustic streaming in liquids, accelerate the capture process of analytes on the surface of biosensors, reduce or remove non-specifically adsorbed molecules without damaging biological activity, and improve the signal-to-noise ratio of measurement signals [30,31,32]. Meanwhile, the R-SAW biosensor used in this article has a high degree of commercialization, mature manufacturing processes, mass production, high-frequency performance, low cost, low loss, miniaturization, good performance consistency, high reliability, and strong practicality. However, due to the damping effect of R-SAW, it cannot directly detect samples in liquid environments. Simoni et al. and Agostini et al. proposed a biosensor based on R-SAW in 2015 and 2018, respectively, which detected the binding of biotin–streptavidin through the measurement scheme of “dip and dry”, avoiding the interference of liquids to the sensor [30,33]. These studies provide new ideas for the application of a commercial R-SAW sensor in detecting biomolecules.
The immobilization of biological probes on a sensitive substrate of the biosensor is crucial for the specificity, sensitivity, repeatability, and recycling ability [24]. Among the probes for identifying bacteria, the aptamers are a type of functional RNA or DNA sequences that are artificially screened or designed, featuring high physical and temperature stability [34]. The aptamers have a high affinity for the targets and can fold into three-dimensional structures in solution, forming binding sites with the targets, which can specifically recognize specific nucleic acid areas on the targets and specifically bind to the targets to form aptamer–target complexes [17,34]. Meanwhile, the aptamers can be developed in vitro for almost an infinite number of different targets, and they are non-immunogenic and more stable than antibodies [17,34,35]. Once the aptamer oligonucleotide sequence is developed, it can be replicated with high precision using standard oligonucleotide synthesis techniques. In addition, the aptamers can be modified with various compounds that increase the stability for nuclease cleavage and allow them to be immobilized on different surfaces [17,35]. Therefore, the selection and appropriate modification of the aptamer are conducive to further enhancing the application of commercial R-SAW in biosensors.
In this work, we selected the aptamer modified with a carboxyl (-COOH) group at the 5-terminal as the biological probe and modified the commercial R-SAW chip to detect E. coli, which had two aluminum interdigital transducers (IDTs) on the piezoelectric ceramic substrate and the aluminum interdigital electrodes on the sensitive area surface. The IDTs served as a reflector to establish a resonant cavity, limiting acoustic energy to the sensitive area. Meanwhile, the interdigital electrodes in the sensitive area could increase the contact area with the solution, facilitating the immobilization of more biological probes during functionalization and improving the detection efficiency. The strong interaction between Al3+ and -COOH groups caused the modified aptamers to undergo the coordination reaction with Al3+ in the sensitive area, forming the bio-enhanced probes. The aptamers would be preferentially enriched and directionally immobilized on the electrode surface, and the effect would be significantly better than random immobilization, thereby further improving the incubation effect of the aptamers and having stronger recognition ability for E. coli [36,37,38,39,40,41]. In this work, the commercial modified R-SAW biosensor only required 15 μL of sample and could detect the presence of E. coli within 100 s, with a linear detection range of 103–108 cells/mL, a low LOD of 732 cells/mL, and a cost control of about USD 1. This article selected four non-target bacterial strains (two Gram-positive bacteria and two Gram-negative bacteria) for selective experiments, with a selectivity ratio of 3270:1, indicating that the R-SAW biosensor had good specificity. At the same time, six types of food were subjected to spiked detection, and the results showed that compared with traditional methods, the commercial R-SAW biosensor used in this article had the advantages of large detection range, low LOD, easy operation, low cost, and short detection time, providing an economical and convenient solution for detecting trace amounts of E. coli in food.
2. Materials and Methods
2.1. Materials and Equipments
The commercial R-SAW resonator chips were purchased from AVX Corporation (Fountain Inn, SC, America) with a resonant frequency of 418 MHz. Trypticase soy broth (TSB) and acetone were purchased from Nantong Kinghunt Biology Technological Development Co., Ltd. (Jiangsu, China) and Changshu Hongsheng Fine Chemical Co., Ltd. (Jiangsu, China), respectively. Isopropanol was purchased from Shanghai Yien Chemical Technology Co., Ltd. (Shanghai, China). Phosphate-buffered saline (10 × PBS) was purchased from Beijing Labgic Technology Co., Ltd. (Beijing, China). The Ecoil-C aptamer was purchased from Sangon Biotech Co., Ltd. (Shanghai, China), and the peptide nucleic acids probe sequence is CCG GAC GCT TAT GCC TTG CCA TCT ACA GAG CAG GTG TGA CGG [42]. E. coli, Staphylococcus aureus (SAU), Pseudomonas aeruginosa (PA), Salmonella typhimurium (S.typhimurium), and Klebsiella pneumoniae (KP) were purchased from Shanghai Luwei Technology Co., Ltd. (Shanghai, China). The 10 × PBS was diluted with deionized water to 0.1 × PBS and 0.05 × PBS for sample preparation. The aptamer was diluted with 0.05 × PBS to 2.5 μmol/mL and stored at −20 °C for future use. Under aerobic conditions, the strains were shaken (120 rpm, 37 °C) and cultured in TSB for 24 h before being stored at 4 °C. As shown in Figure S1, the cultured bacteria were counted by the plate counting method, and the highest concentration of E. coli was determined to be 2.9 × 10⁹ cells/mL, while the original concentrations of other bacteria were also approximately 109 cells/mL. Subsequently, all the bacteria were continuously diluted with 0.1 × PBS, and the plate counting method was repeated three times to take the average values to determine whether the diluted bacteria were at the target concentration level (102–108 cells/mL).
The biosensor detection platform of this experiment was mainly composed of the N5224A PNA microwave network analyzer (10 MHZ–43.5 GHz), computer, and commercial R-SAW chips. The microwave network analyzer was purchased from Agilent Technologies, Inc. (Santa Clara, CA, USA). The electrochemical impedance spectroscopy (EIS) testing system mainly consists of a digital bridge (LCR, TH2829C) and a four-terminal testing fixture, which was purchased from Changzhou Tonghui Electronics Co., Ltd (Changzhou, China) to characterize the surface condition of the biosensor. The aptamer modification and bacterial capture in the sensitive area of the biosensor were observed and characterized by field emission scanning electron microscopy (SEM) (JEOL, JSM-7001F, Tokyo, Japan). The ultrasonic cleaning machine (SN-QX-32D) and centrifuge (LC-Mini-12KSP) were also used for sample pretreatment in the experiment.
2.2. Optimization of the Aptamer
Existing studies suggest that the stability and affinity of the aptamers can be enhanced by modifying functional groups and other methods [35]. The binding force between the -COOH groups and the aluminum electrode surface is higher than that of the amino (-NH2) groups [36,43]. Therefore, this article used the -COOH group to modify the 5-terminal of the aptamer. When the -COOH-modified aptamers come into contact with the surface of aluminum electrodes, the highly acidic -COOH groups would lose the protons (H+) in aqueous solution and become the negatively charged carboxylate (-COO−) groups [36,37,38,39]. As a light metal, an aluminum surface would undergo an oxidation reaction, forming a dense protective layer of aluminum oxide (Al2O3), which contains aluminum ions (Al3+) [36]. The -COO− groups would form a stable electrostatic attraction with the positively charged Al3+ on the Al2O3 layer, thereby forming a strong bond and immobilizing on the Al2O3 layer. Meanwhile, the oxygen atoms of the -COOH groups could provide lone pair electrons to share with Al3+ on the Al2O3 layer, forming stable coordination bonds and further enhancing the binding force of -COOH-modified aptamers on the Al2O3 layer [36,37,38,39,41]. In addition, the -COOH groups, as the hydrophilic groups, carried a large number of negative charges and would also actively adsorb on the electrode surface to undergo reactions [36,37,44]. However, -NH2 groups without H+ would transform into the amino cation (-NH3+) groups in aqueous solution, resulting in reduced electrophilicity, weaker coordination ability compared to the oxygen atoms of the -COOH groups, and weaker binding ability with aluminum surfaces than -COOH groups [37,39,43]. Therefore, the 5-terminal of the aptamers modified the -COOH groups and would preferentially bind to the Al2O3 layer on the sensitive area, forming the bio-enhanced probes, eventually enabling the aptamers to be preferentially enriched and directionally immobilized on the electrode surface. Its stability and binding performance to the target would be significantly better than random immobilization.
2.3. Pretreatment of the Biosensor
This work obtained biosensors with a resonant frequency of 418 MHz by modifying the commercial R-SAW chips. As shown in Figure S2, when preparing the sensors, the commercial chips first needed the upper metal encapsulation layers to be removed to expose the internal structure, and the metal casings around the chips (5 mm × 3.5 mm × 1 mm = 17.5 μL) were used as a microchamber for holding the sample solution. The sensors were repeatedly cleaned with acetone and isopropanol and then ultrasonically cleaned in deionized water for 10 min to remove organic matter and impurities. The cleaned sensors were placed in a drying oven with nitrogen gas until dry and then irradiated with ultraviolet light for 40 min to increase the hydrophilicity of the electrode surface and make them easier to bind with the aptamers.
2.4. Functionalization and Detection of the Biosensor
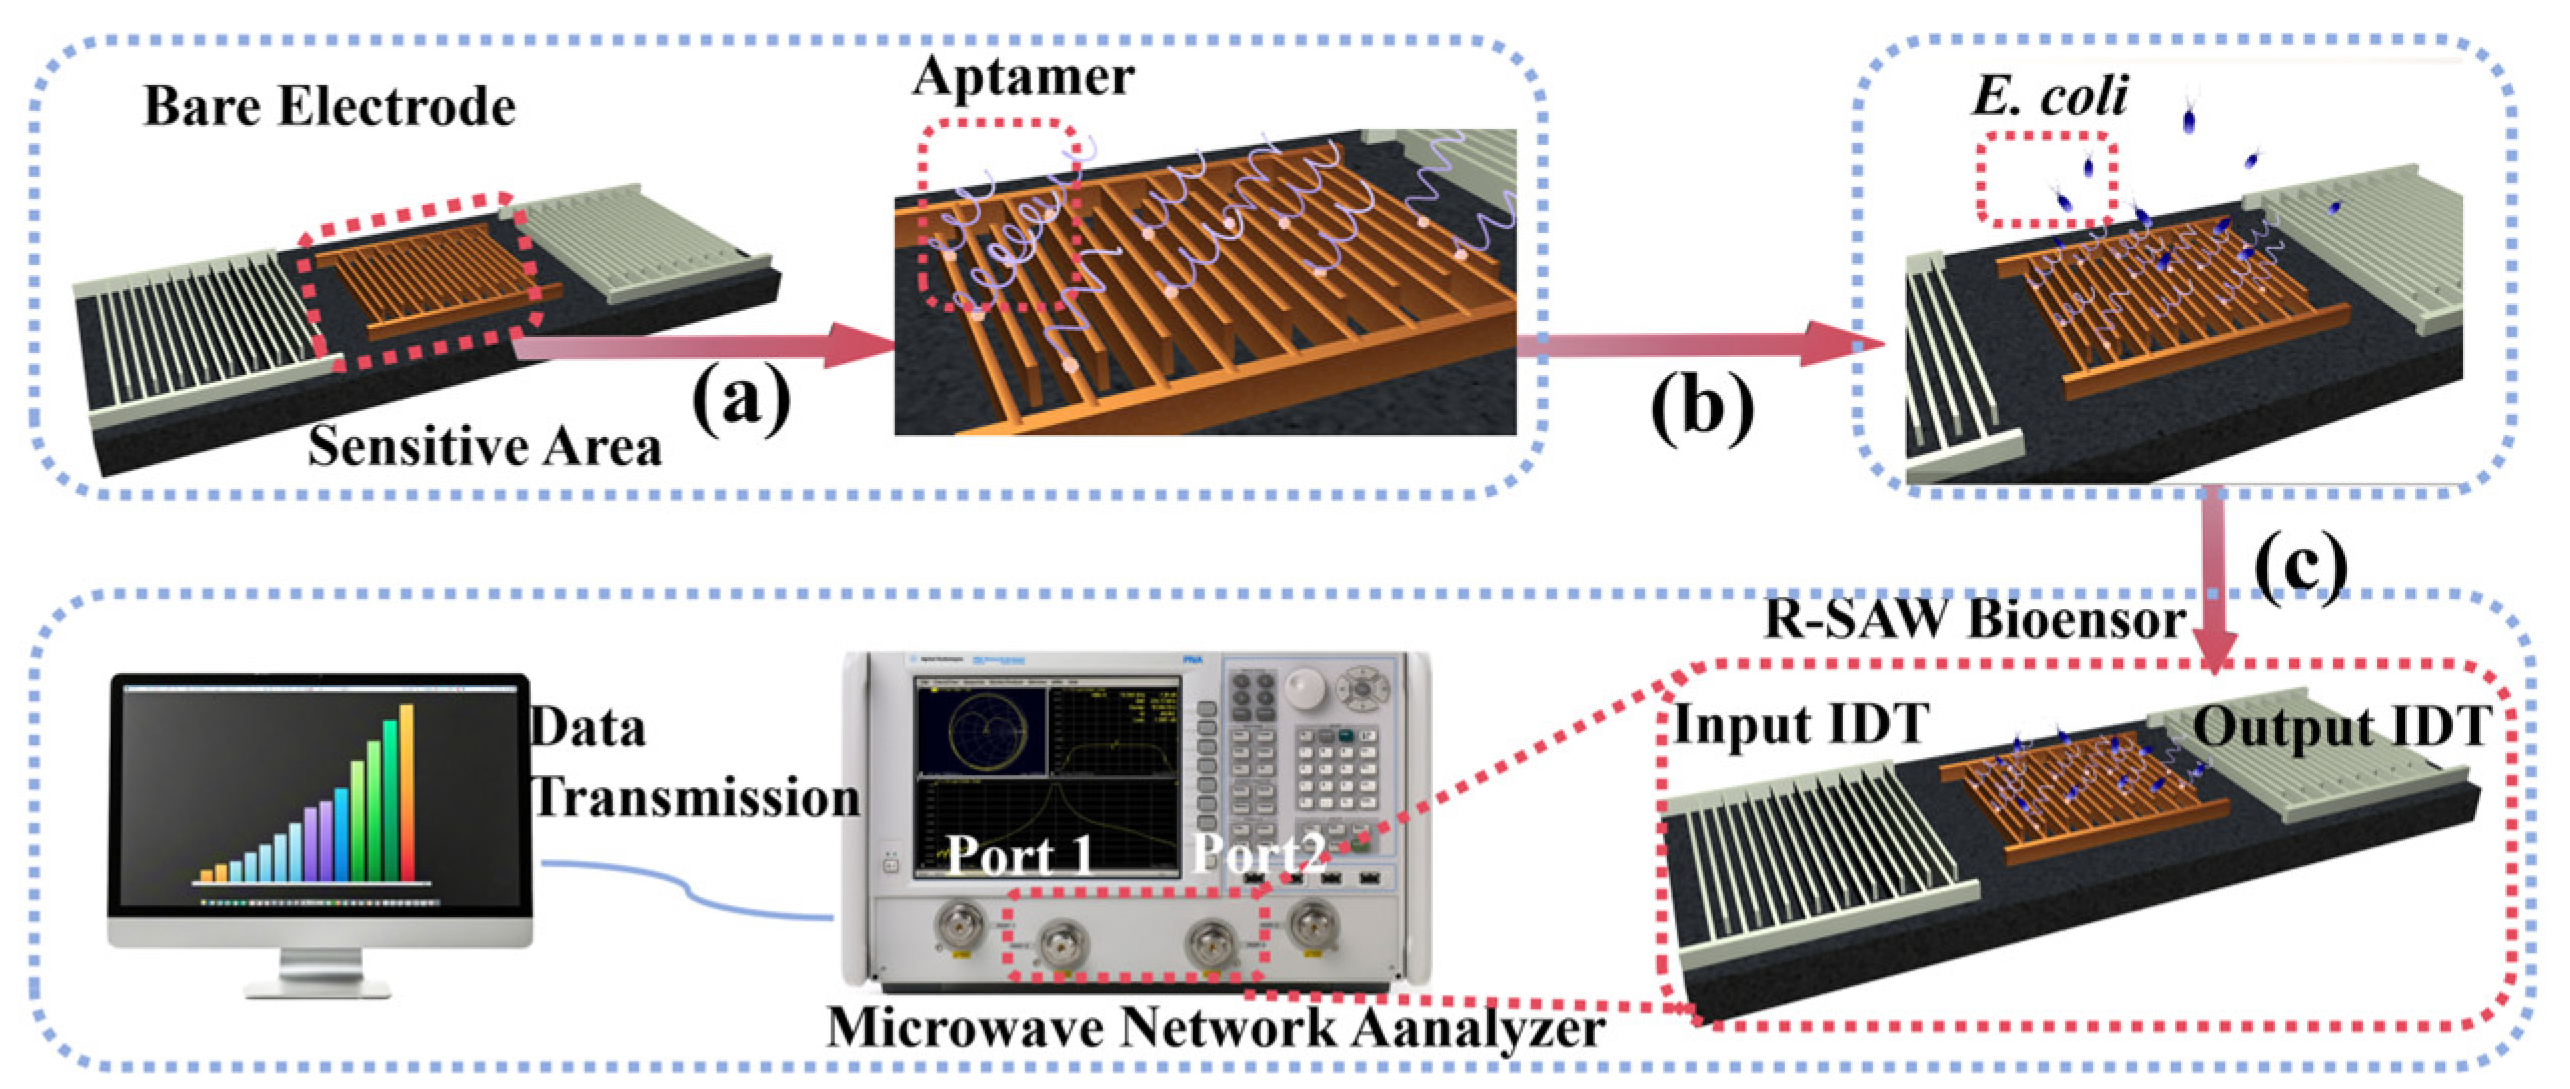
As shown in Figure 1a, 15 μL of the aptamer solution was dropped into the prepared sensor microcavity and incubated for 8 h to immobilize the biological probes on the surface of the sensitive area. As shown in Figure S3, with the extension of incubation time, the poorly conductive aptamers gradually bound to the electrode surface, resulting in a significant thickening of the dielectric layer on the electrode surface and an increase in impedance. When the incubation time was extended to 8, 10, and 12 h, the change in impedance was not significant, indicating that the incubation of the aptamers had reached a relatively stable state at 8 h. Subsequently, the redundant aptamers were removed by washing the microchamber of the sensors with deionized water, and the sensors were dried under nitrogen conditions for 30 min before use.
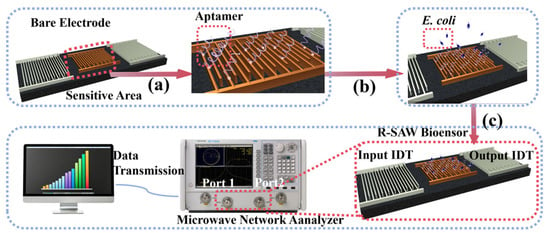
Figure 1.
(a) Functionalization of the commercial R-SAW biosensor; (b) addition and incubation of E. coli; (c) measurement process of the commercial R-SAW biosensor.
The insertion loss (IL) of the R-SAW biosensor was measured by the N5224A PNA microwave network analyzer. Port 1 of the microwave network analyzer was connected to the input IDT of the R-SAW, and the alternating current (AC) signals were applied to generate Rayleigh waves by the inverse piezoelectric effect. These waves propagated through the sensitive area to the output IDT and were converted into electrical signals through the piezoelectric effect. At this point, the output IDT was connected to port 2 of the microwave network analyzer to obtain IL. The IL was mainly affected by the surface load of the sensitive area. When the aptamer specifically bound to the target, the “aptamer–target” complexes were formed on the surface of the sensitive area, which could change the viscoelasticity of the sensitive area surface and cause a change in IL. The target concentration in the sample could be obtained by calculating ΔIL, which could be determined by measuring the IL values before and after adding bacteria.
The functionalized R-SAW biosensor was first connected to the N5224A PNA microwave network analyzer to measure the initial IL, which was recorded as IL1. As shown in Figure 1b,c, 15 μL of E. coli solution with a concentration of 102–108 cells/mL was added and captured at 37 °C for 4 h, respectively. After washing to remove excess bacteria and drying, the IL was measured again at room temperature as the final value IL2, where ΔIL = IL2–IL1. To further demonstrate that 4 h was the optimal capture time for E. coli, different capture times were set up under the same conditions for comparison. As shown in Figure S4, within 2–4 h, ΔIL showed an upward trend, indicating that the capture efficiency of the sensor for E. coli also monotonically increased. The peak in ΔIL was reached at 4 h, and there was almost no change in ΔIL during the subsequent time, indicating that the aptamers were able to stably capture E. coli at 4 h, which was the optimal time for capturing E. coli. To obtain reliable results, the IL data were continuously measured for 100 s after the signal stabilized, and then the average values were taken. The detection was repeated three times for each concentration of the sample.
2.5. Pretreatment of the Actual Samples
The actual samples were taken from local supermarkets, including six different types of food, such as watermelon (only the flesh), spinach, beef, milk, juice, and pure water. The solid food samples were ground to prepare liquid samples and uniformly mixed with 0.05 × PBS at a weight ratio of 1:9, which were centrifuged (10,000 rpm, 10 min) to collect the intermediate clear liquids of the samples. The milk was also centrifuged (10,000 rpm, 10 min) to remove some proteins. As shown in Figure S5, E. coli was added to the actual samples to prepare spiked samples with concentrations of 2.9 × 10⁴ cells/mL, 2.9 × 10⁶ cells/mL, and 2.9 × 10⁸ cells/mL, which were stored at –20 °C for future use.
3. Results and Discussion
3.1. Characterization of the R-SAW Biosensor
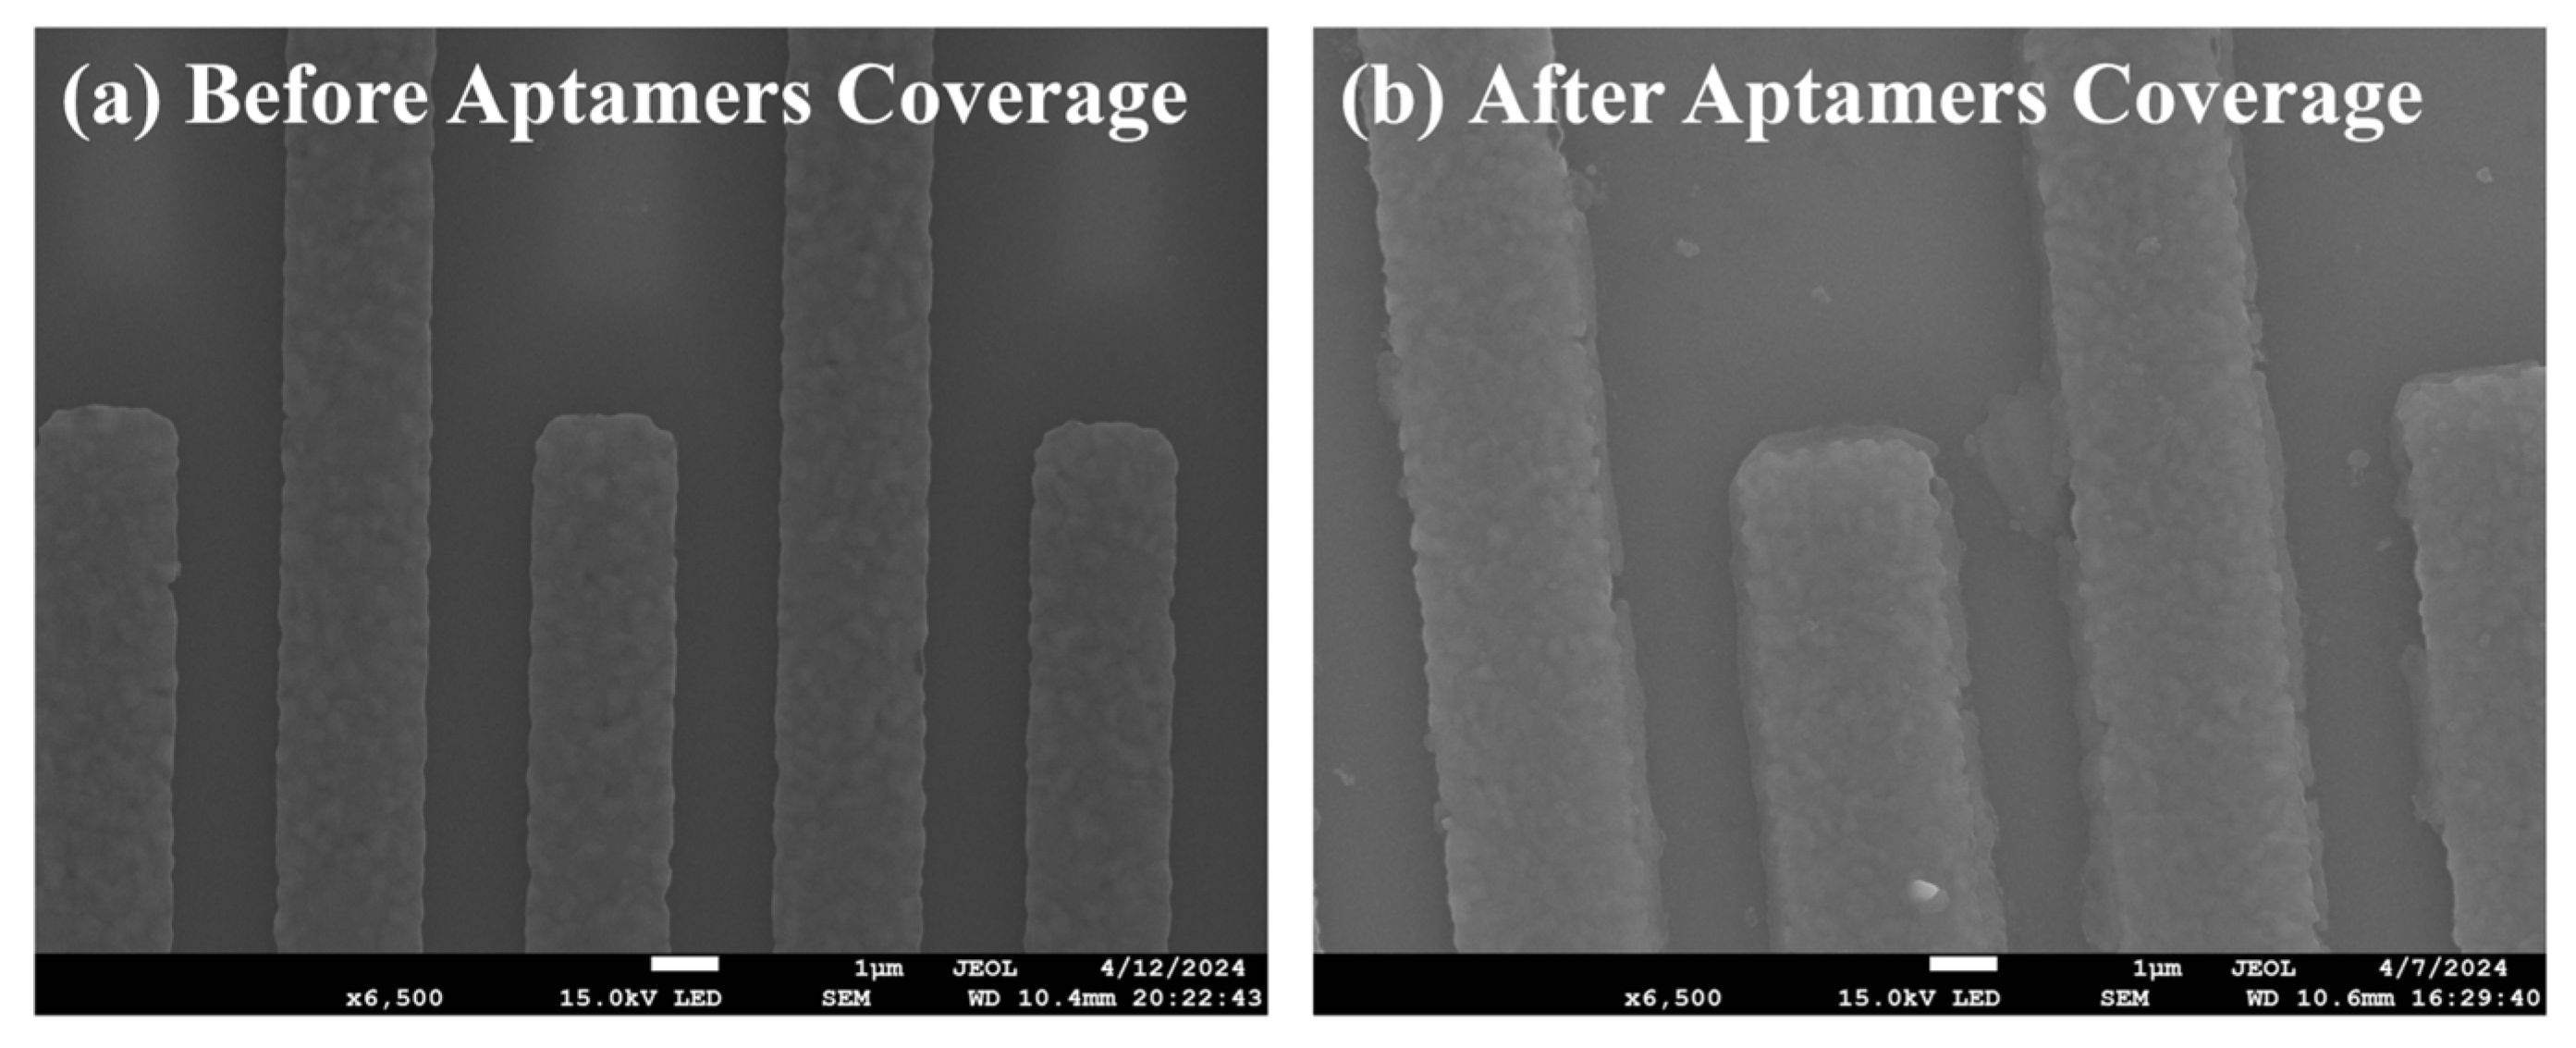
The electrode surface changes of the biosensor before and after functionalization were characterized by SEM. As shown in Figure 2a, the SEM image showed that the sensor without modified aptamers had no obvious impurities on the surface of the sensitive area, and the presence of the interdigital electrodes could effectively increase the contact area with the solution, which was beneficial for immobilizing more aptamers during functionalization. As shown in Figure 2b, a uniformly distributed coating could be observed on the surface of the sensitive area, indicating successful immobilization of the aptamers and significant thickening of the dielectric layer on the surface of the interdigital electrodes. Since the impedance response is very sensitive to the thickness and properties of the biomolecular layer, when AC impedance spectroscopy is selected to characterize the surface changes of the biosensor, it was found that the impedance would significantly increase.
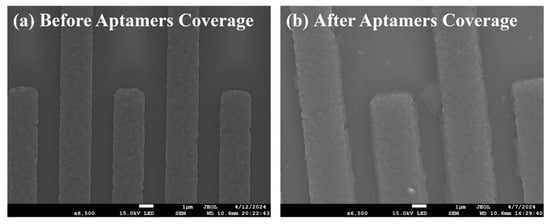
Figure 2.
Electrode changes (a) before and (b) after aptamers coverage.
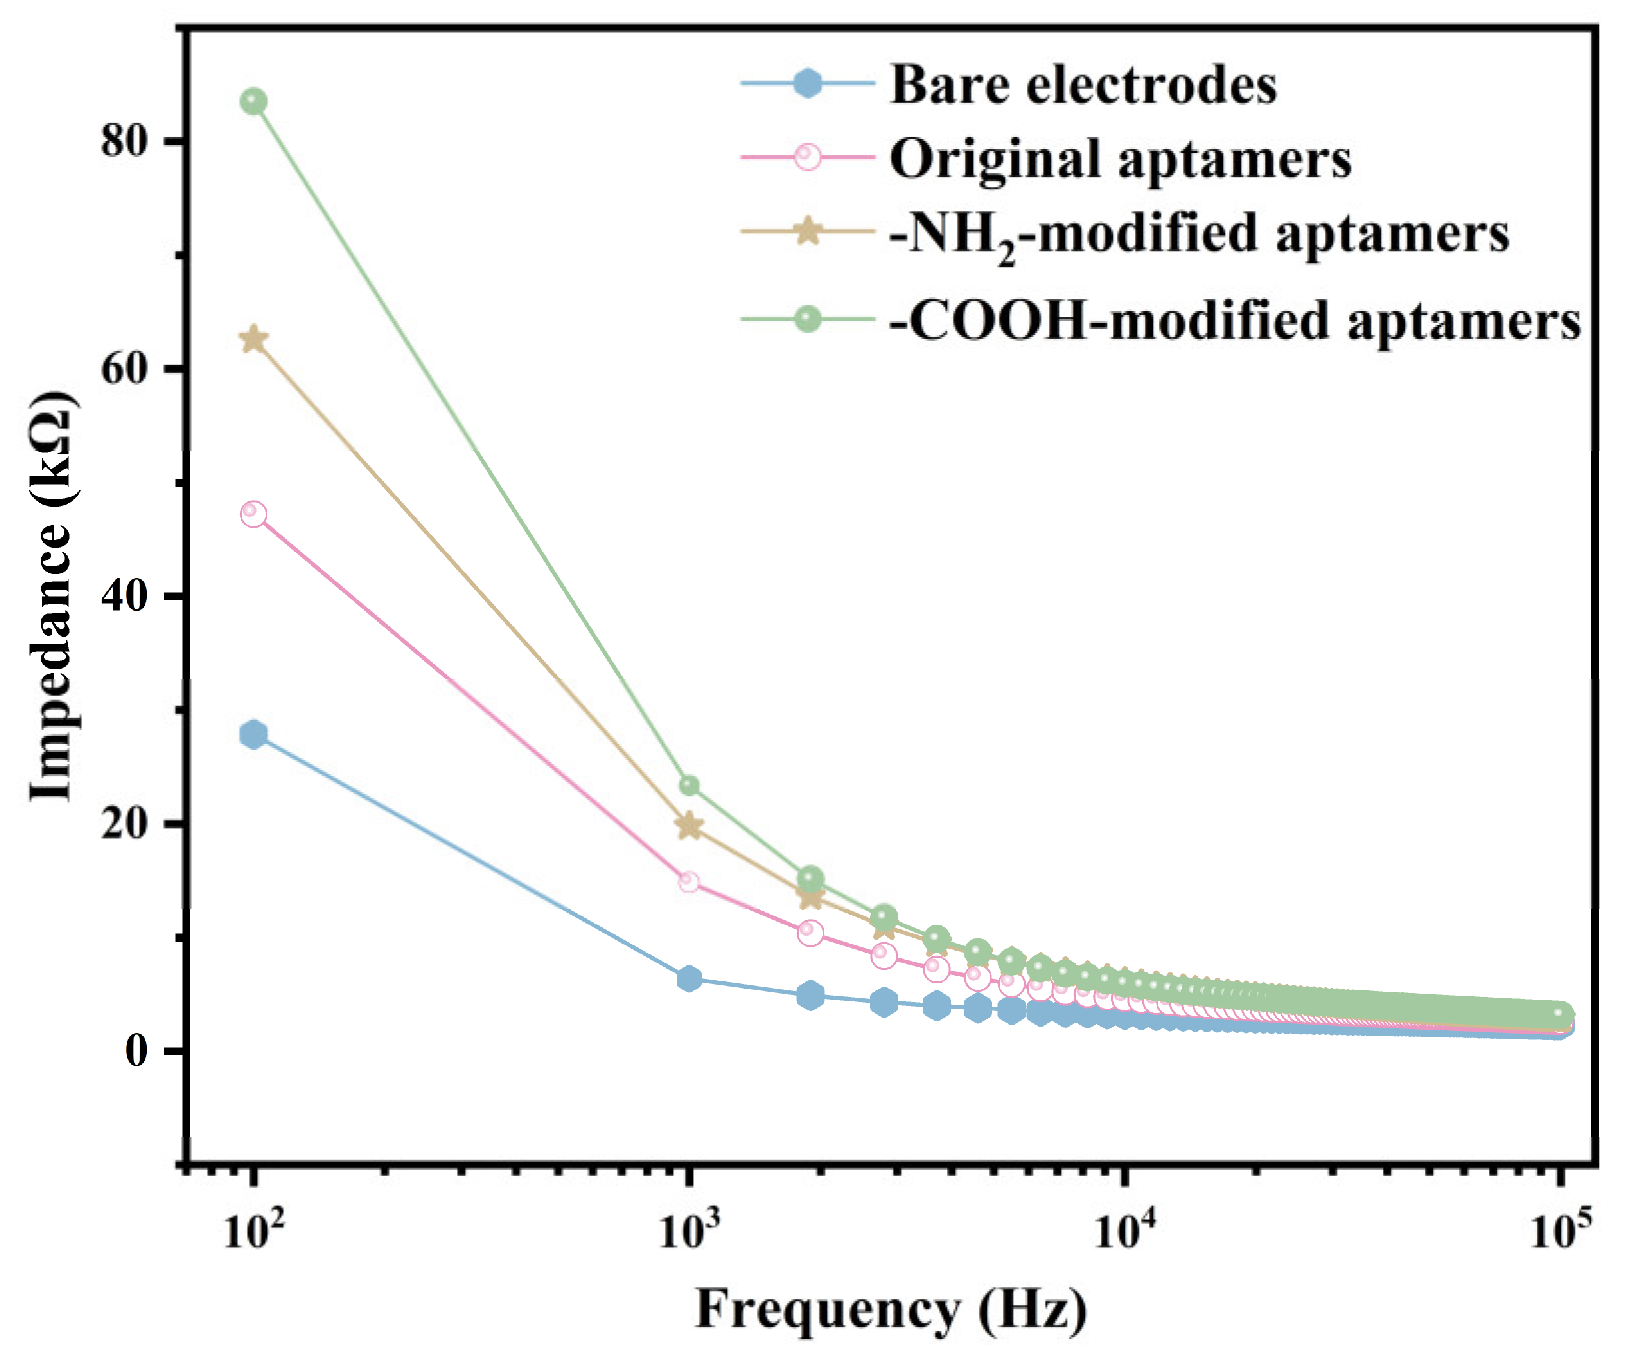
The EIS testing system was used to characterize the surface condition of the R-SAW biosensors after functionalization. The biosensors were functionalized using the original aptamer, the -NH2-modified aptamer, and the -COOH-modified aptamer with the same concentration (2.5 μmol/mL), respectively. As shown in Figure S6, the functionalized R-SAW biosensor was connected to the EIS testing system, with port 1 connected to the input IDT and port 2 connected to the output IDT of R-SAW. Simultaneously, 15 μL of 0.05 × PBS was dropped into the chamber of the sensor. The excitation voltage of the instrument was set to 5 mV, and the Bode plots of the impedance within the range of 102–105 Hz were obtained to reflect the changes on the surface of the interdigital electrodes before and after functionalization. As shown in Figure 3, the impedance of the sensor decreased with increasing frequency. At the same frequency, the most significant increase in impedance after functionalization was the -COOH-modified aptamer, followed by the -NH2-modified aptamer, with lower changes in the original aptamer and the lowest changes in bare electrodes. The results indicated that the -COOH-modified aptamers resulted in the thickest dielectric layer on the electrode surface, and most of the added aptamers had already bound to the biosensor surface, resulting in the highest number of aptamers. The 5-terminal of the -COOH-modified aptamers were most tightly bound with the interdigital electrodes in the sensitive area.
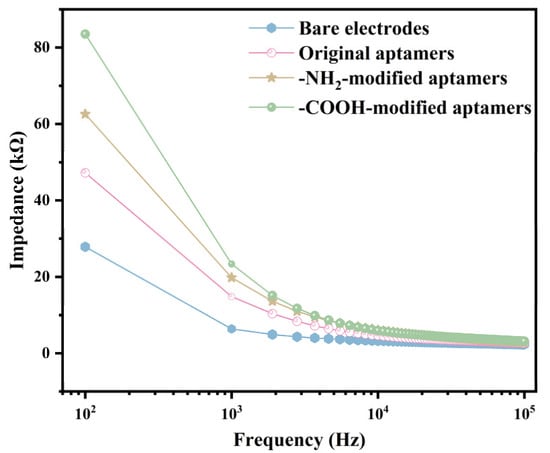
Figure 3.
Bode plots of impedance changes caused by the three types of aptamers after sensor functionalization.
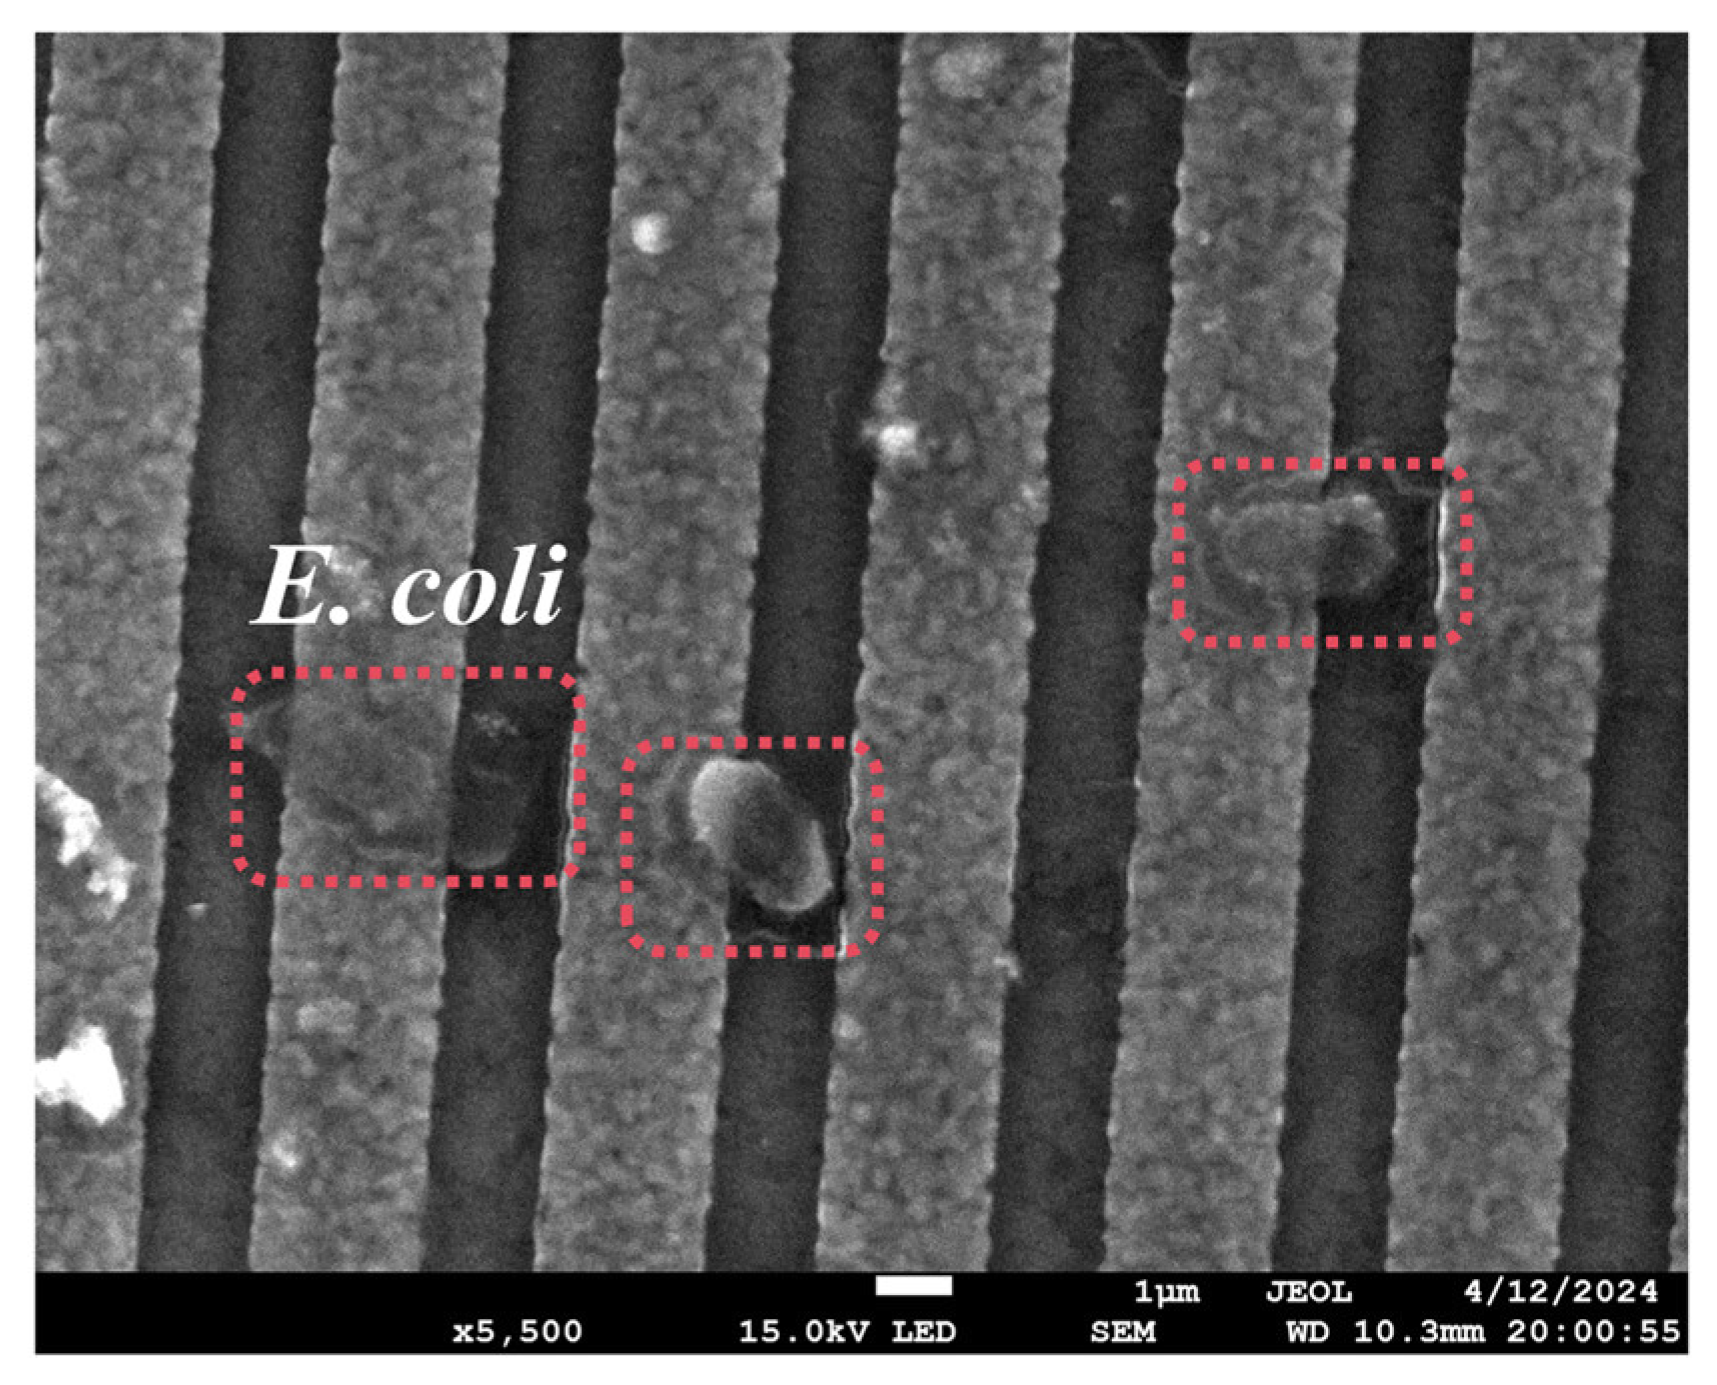
To prove that the aptamer used in this article could capture E. coli, the R-SAW sensor was functionalized and dropped into a certain concentration (2.9 × 10⁷ cells/mL) of E. coli solution, which was characterized by SEM after drying. As shown in Figure 4, the immobilized E. coli could be clearly observed on the surface of the Al electrodes, indicating that the -COOH-modified aptamer could specifically capture E. coli.
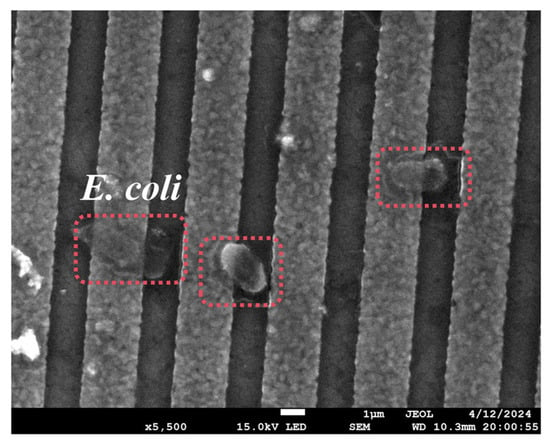
Figure 4.
Electrode surface after specific binding of aptamers to E. coli.
3.2. Dose Response of the R-SAW Biosensor
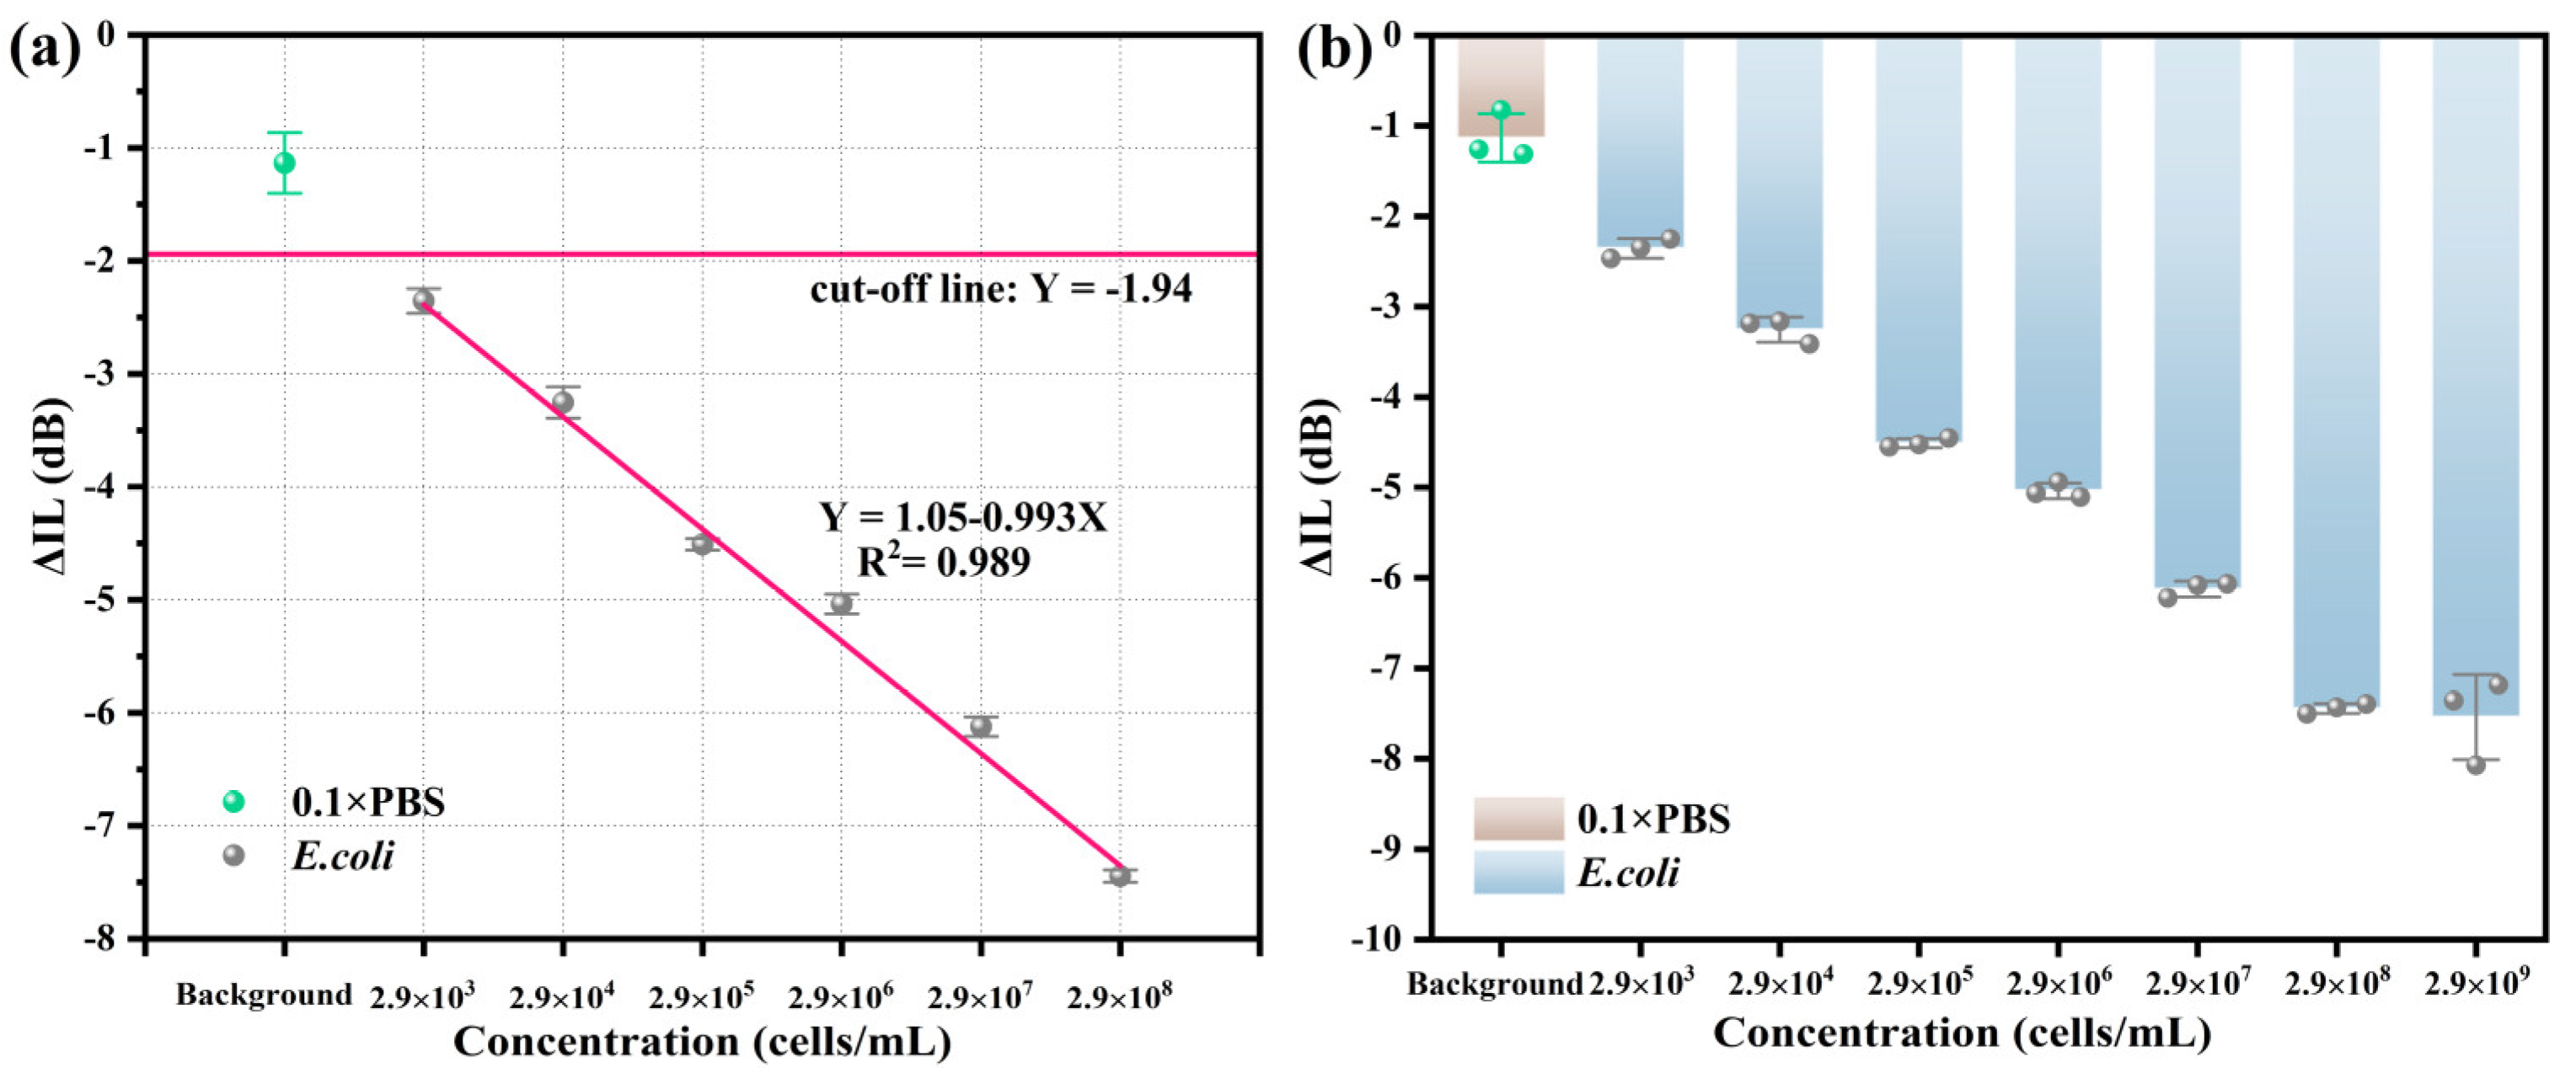
Under the same conditions, the R-SAW biosensors were used to detect the performance of E. coli at different concentrations (background, 103–109 cells/mL). As shown in Figure 5a, the background response measured in 0.1 × PBS was −1.13 dB. The cut-off line represented the theoretical minimum response that could be achieved for detecting E. coli, which was −1.94 dB. This value was obtained by the formula cut-off line = average background response (−1.13 dB)−3 × standard errors of background response (0.27 dB). When the concentration of E. coli increased from 103 cells/mL to 108 cells/mL, ΔIL increased accordingly and showed a good linear relationship with the concentration changes. The linear regression equation was Y = 1.05−0.993X, where X was the logarithm of the concentration of E. coli. The LOD of E. coli calculated by the formula LOD = 3σ/k was 732 cells/mL, indicating that the LOD of this biosensor was relatively low. As shown in Figure 5b, in the dose response diagram, ΔIL reached its maximum value at the concentration of 2.9 × 10⁸ cells/mL for E. coli and decreased at 2.9 × 10⁹ cells/mL, which was due to the complete occupation of the aptamer binding sites on the biosensor surface, resulting in excess E. coli being unable to bind to the aptamers. Therefore, at different concentrations, ΔIL values and standard errors were −1.13 ± 0.27 dB, −2.36 ± 0.11 dB, −3.25 ± 0.14 dB, −4.51 ± 0.05 dB, −5.04 ± 0.09 dB, −6.12 ± 0.09 dB, −7.45 ± 0.05 dB, and −7.72 ± 0.50 dB, respectively.
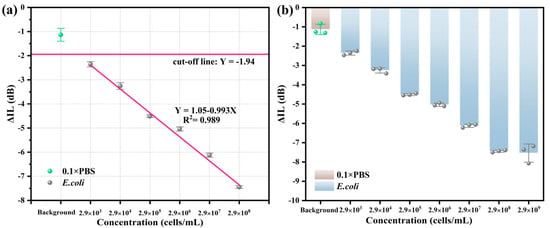
Figure 5.
(a) Fitting curves and (b) dose response diagram of E. coli at different concentrations.
3.3. Specificity of the R-SAW Biosensor
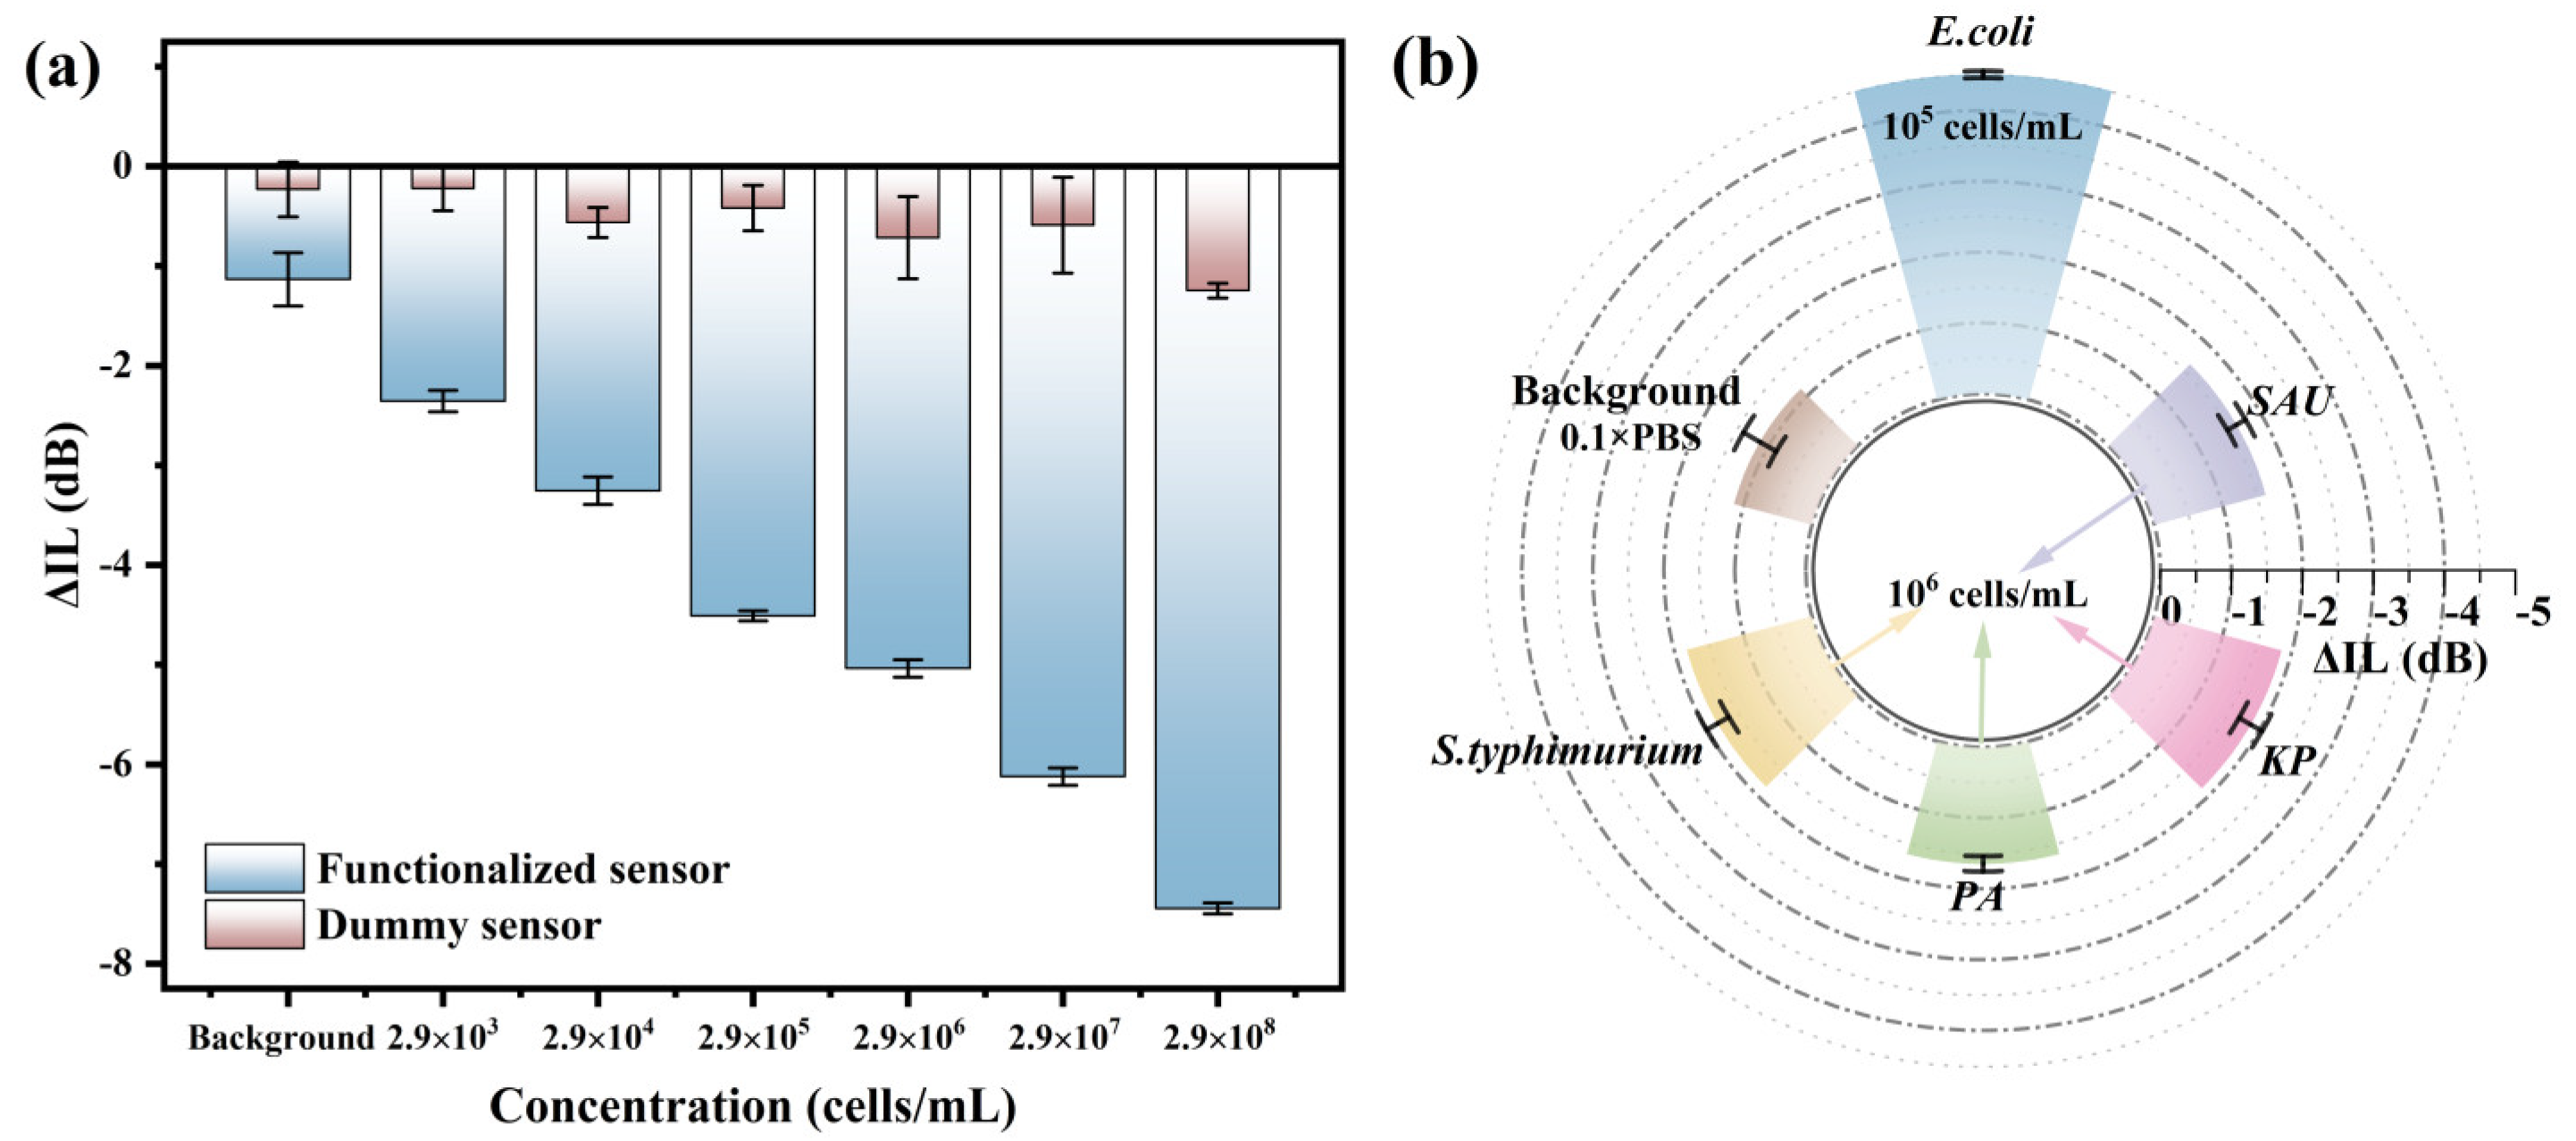
Specificity is one of the important performance indicators of biosensors. As shown in Figure 6a, to verify the specificity of the biosensor for E. coli in this work, the unfunctionalized biosensor was used to detect the E. coli in the concentration range of 103–108 cells/mL, and the responses of the dummy sensor to E. coli were less than or close to the background response (−1.13 dB). The response of the functional sensor increased with the rise of E. coli concentration and showed a good linear relationship, indicating that the R-SAW sensor had good specificity for E. coli. The specificity of the R-SAW biosensor was further verified by detecting four non-target bacteria. The aptamer of E. coli was incubated on the R-SAW sensor, and then SAU, PA, S.typhimurium, and KP with the concentration of 106 cells/mL were detected under the same condition, while the concentration of E. coli was 2.9 × 10⁵ cells/mL. As shown in Figure 6b, when the concentration of non-target bacteria was one order of magnitude higher than that of the E. coli, the ΔIL values were much lower than those of the E. coli, approaching the background response. The highest selectivity ratio between E. coli and non-target bacteria could reach 3270:1, which further indicated that the biosensor had good specificity and anti-interference ability.
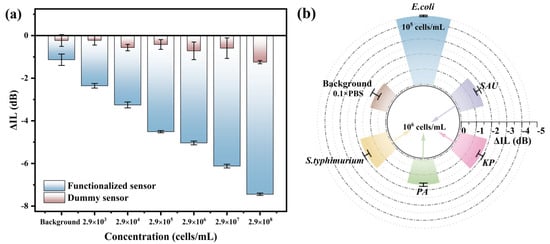
Figure 6.
(a) Sensor specificity detection before and after functionalization; (b) specificity detection between E. coli and four interferents.
3.4. Stability and Actual Sample Detection of the R-SAW Biosensor
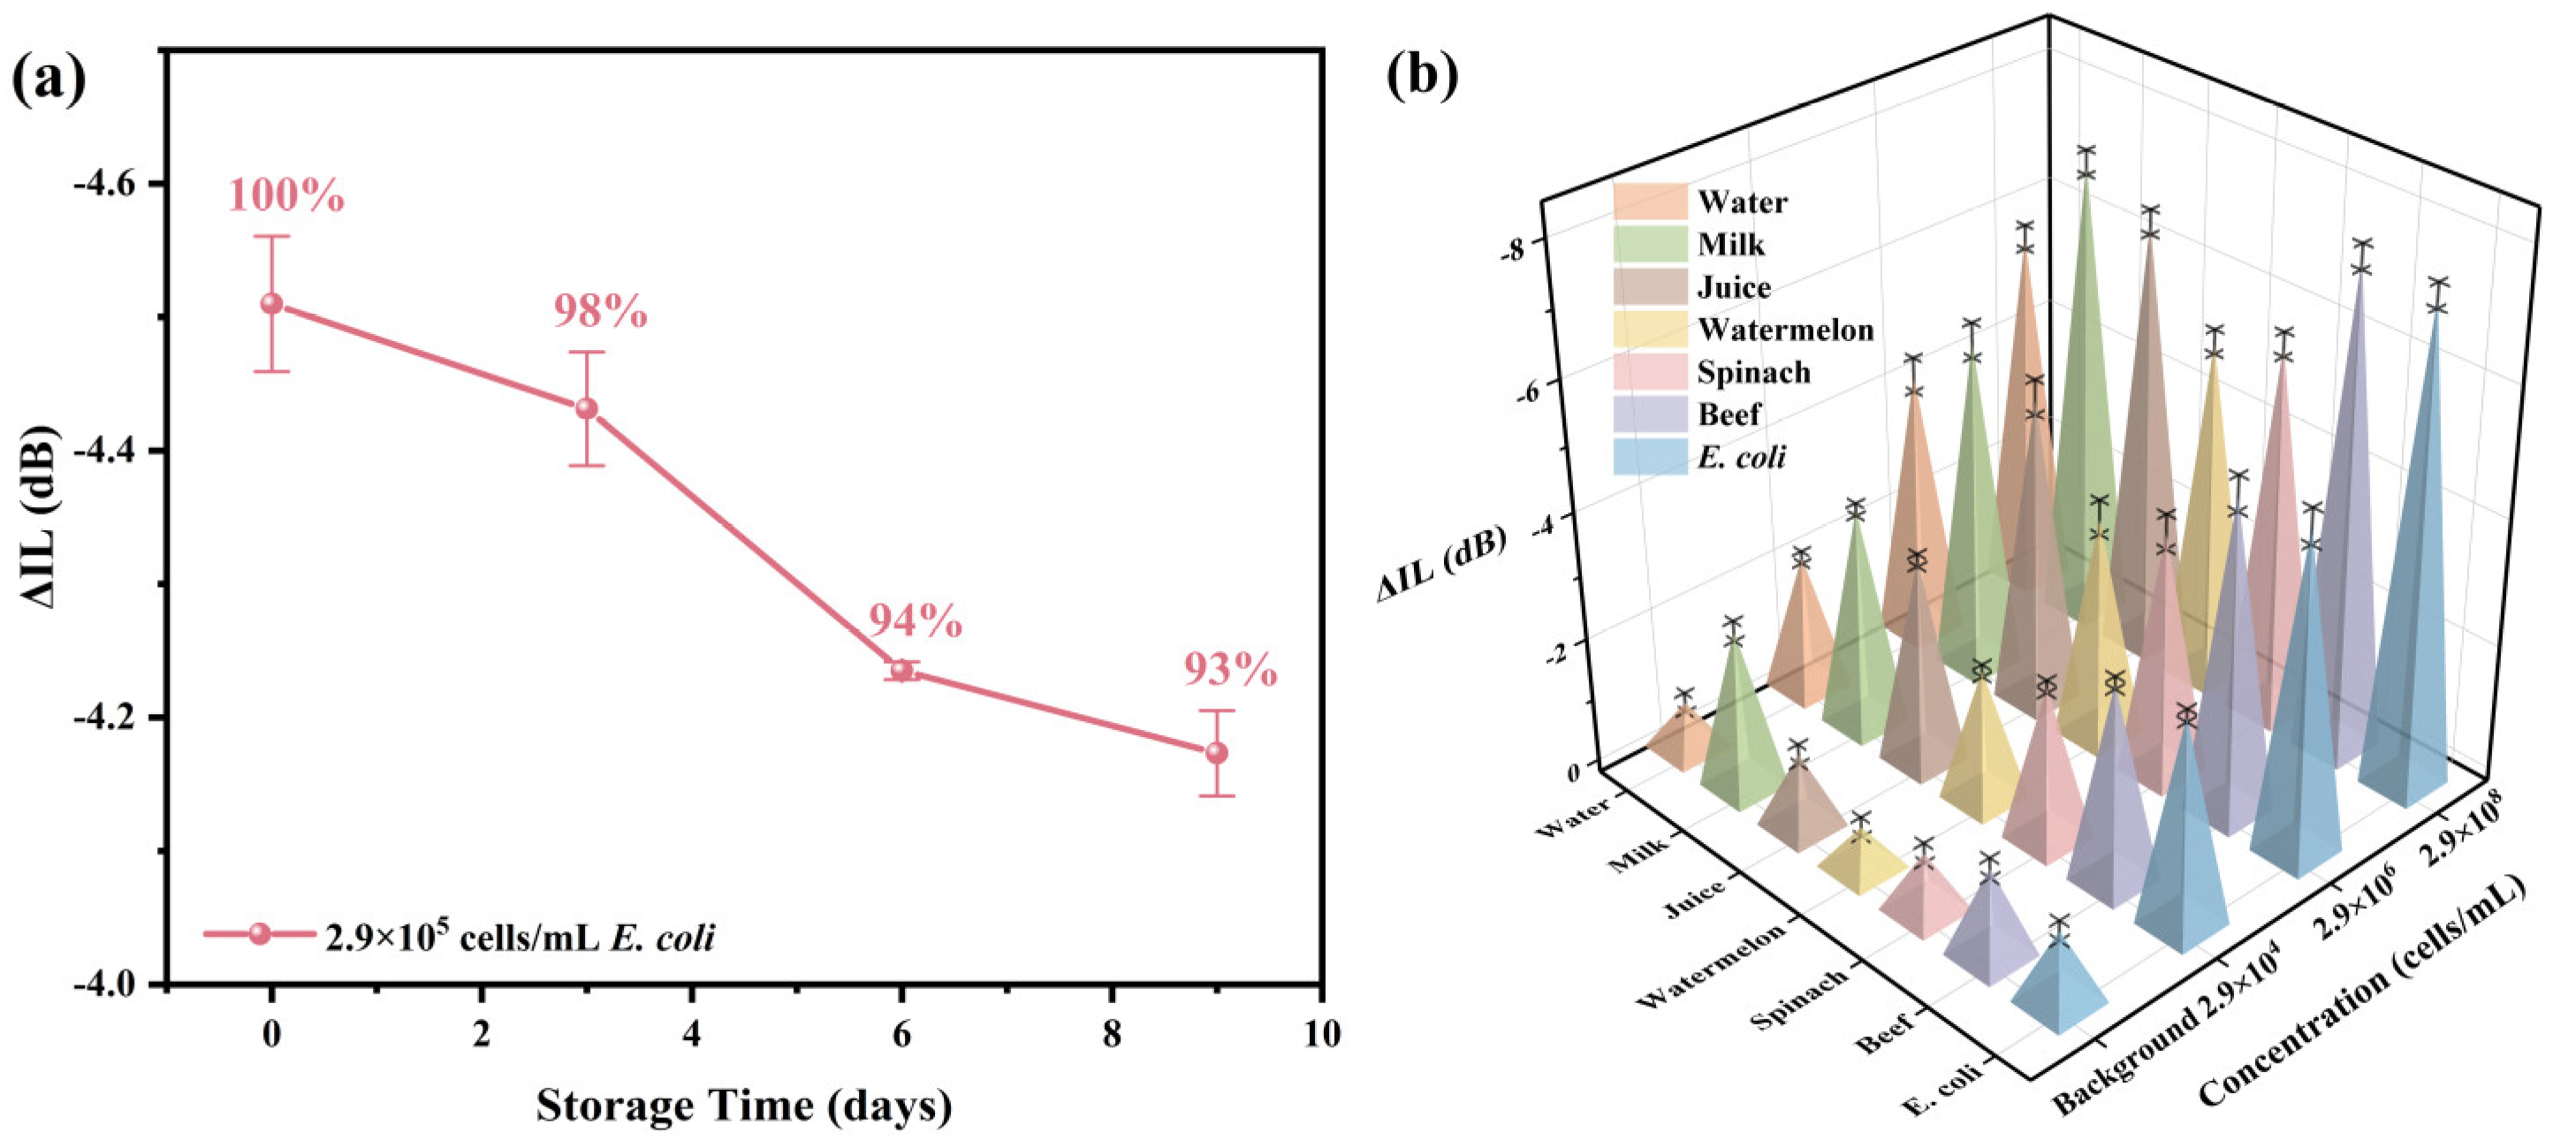
Stability seriously affects the practical application ability of biosensors. To detect the stability of the R-SAW biosensors, the prepared biosensors were stored in a thermostat at 22 °C, and they were taken out every three days to detect E. coli at a concentration of 2.9 × 10⁵ cells/mL and observe whether the sensors could effectively maintain the original response. As shown in Figure 7a, the response amplitude of the sensor could still reach 93% of the original response value after being placed for 9 days, indicating that the biosensor had certain stability within 9 days and could effectively measure the E. coli. Multiple actual spiked samples (watermelon, spinach, beef, milk, juice, pure water) were detected with detection concentrations of 2.9 × 10⁴ cells/mL, 2.9 × 10⁶ cells/mL, and 2.9 × 10⁸ cells/mL, respectively, to further evaluate the application ability of this work in practical scenarios. As shown in Figure 7b, the measurement results of the actual spiked samples had high consistency with the same concentration of E. coli, and the linear relationships were also very similar to that of E. coli. Therefore, the R-SAW biosensor prepared in this work had good practicality and could be used for the actual detection of E. coli in food.
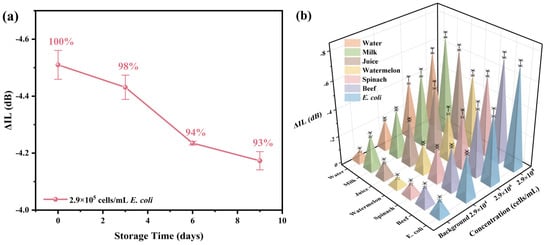
Figure 7.
(a) The stability of the biosensor after being stored at 22 °C for 9 days; (b) the response of the biosensor to the actual spiked samples at different concentrations.
As shown in Table 1, several acoustic methods for detecting E. coli were compared with the performance of the biosensor developed in this article. The biosensor developed in this article had the advantages of rapid speed, wide detection range, low LOD, strong specificity, and low cost, and it can effectively detect trace amounts of E. coli in food.

Table 1.
Performance comparison of the SAW biosensors for detecting E. coli.
4. Conclusions
In summary, we introduced a commercially modified R-SAW biosensor that was fast, sensitive, highly specific, easy to operate, low-cost, and consistent, and it was used for the detection of trace amounts of E. coli. The aptamers were directly modified on the interdigital electrode of the biosensor, and the interdigital structure increased the contact area with the solution, which helped immobilize more biological probes during functionalization. Meanwhile, the -COOH-modified aptamers were preferentially enriched and directionally immobilized on the electrode surface by utilizing the coordination reaction between -COOH and Al3+, forming bio-enhanced probes to enhance the stability of the sensor after functionalization. The commercially modified R-SAW biosensor used in this article only required 15 μL of the sample and could detect the presence of E. coli within 100 s, with a linear detection range of 103–108 cells/mL, a LOD as low as 732 cells/mL, and a selectivity ratio of 3270:1. And the ΔIL values had a good linear relationship with E. coli concentration. This article conducted spiked detection on six foods, including watermelon, beef, pure water, and so on. The results showed that this article had achieved a miniaturized trace E. coli detection sensor that was rapid, highly sensitive, and had a wide detection range, low LOD, strong specificity, easy operation, and low cost. Moreover, other targets can be detected by changing the aptamer, which has great potential in the detection of trace amounts of biomarkers in clinical and home environments.
Supplementary Materials
The following supporting information can be downloaded at https://www.mdpi.com/article/10.3390/chemosensors13080308/s1, Figure S1: Determination of the highest concentration of various bacteria by the plate counting method: (a) E. coli; (b) SAU; (c) PA; (d) S.typhimurium; (e) KP; Figure S2: (a) External and (b) internal structural diagrams of the commercial R-SAW chips; Figure S3: The changes in electrode impedance at different incubation times; Figure S4: The variation trend of ΔIL under different capture times; Figure S5: Spiked samples of actual foods: (a) watermelon; (b) spinach; (c) beef; (d) milk; (e) juice; (f) pure water; Figure S6: The schematic, physical, and impedance testing diagrams of the R-SAW sensor.
Author Contributions
Conceptualization, H.Q., X.Z. and J.W.; methodology, H.Q. and X.Z.; software, Z.X. and Y.Z.; validation, Z.X. and Y.Z.; formal analysis, L.L., H.Q. and X.Z.; investigation, Z.X. and Y.Z.; resources, H.Q. and X.Z.; data curation, Z.X. and Y.Z.; writing—original draft preparation, L.L. and Y.Z.; writing—review and editing, J.W. and X.Z.; visualization, L.L. and Z.X.; supervision, X.Z.; project administration, H.Q. and X.Z.; funding acquisition, L.L. and H.Q. All authors have read and agreed to the published version of the manuscript.
Funding
This research was funded by the National Natural Science Foundation of China, grant number 62074047; the Open Project of Key Laboratory of Architectural Acoustic Environment of Anhui Higher Education Institutes of China, grant number AAE2022KF01; the Zhejiang Provincial Natural Science Foundation of China, grant number LQ24F040004; the Research Project of Zhejiang Provincial Department of Education, grant number Y202351740; and Wenzhou Basic Scientific Research Projects of China, grant number G20240024, G20240049.
Institutional Review Board Statement
Not applicable.
Informed Consent Statement
Not applicable.
Data Availability Statement
The original contributions presented in this study are included in the article/Supplementary Materials. Further inquiries can be directed to the corresponding authors.
Conflicts of Interest
The authors declare no conflict of interest.
References
- Zeng, Y.J.; Yuan, R.; Fu, H.; Xu, Z.L.; Wei, S. Foodborne pathogen detection using surface acoustic wave biosensors: A review. RSC Adv. 2024, 14, 37087–37103. [Google Scholar] [CrossRef] [PubMed]
- Abbas, N.; Song, S.H.Y.; Chang, M.-S.; Chun, M.-S. Point-of-care diagnostic devices for detection of Escherichia coli O157:H7 using microfluidic systems: A focused review. Biosensors 2023, 13, 741. [Google Scholar] [CrossRef] [PubMed]
- Jaffee, S.; Henson, S.; Unnevehr, L.; Grace, D.; Cassou, E. The Safe Food Imperative: Accelerating Progress in Low and Middle-Income Countries; Agriculture and Food Series; World Bank: Washington, DC, USA, 2019. [Google Scholar] [CrossRef]
- Cui, W.J.; Wang, J.; Ding, C.; Van Cappellen, P.; Ho, E.A.; Ren, C.L. A functionalized microwave biosensor for rapid, reagent-free detection of E. coli in water samples. Biosens. Bioelectron. 2025, 278, 117334. [Google Scholar] [CrossRef]
- Ahmed, M.W.; Gul, K.; Mumtaz, S. Recent advances in cold atmospheric pressure plasma for E. coli decontamination in food: A review. Plasma 2025, 8, 18. [Google Scholar] [CrossRef]
- Basu, D.; Tumer, N.E. Do the a subunits contribute to the differences in the toxicity of Shiga toxin 1 and Shiga toxin 2? Toxins 2015, 7, 1467–1485. [Google Scholar] [CrossRef]
- Zhuang, L.L.; Gong, J.S.; Zhao, Y.; Yang, J.B.; Liu, G.F.; Zhao, B.; Song, C.L.; Zhang, Y.; Shen, Q.P. Progress in methods for the detection of viable Escherichia coli. Analyst 2024, 149, 1022–1049. [Google Scholar] [CrossRef]
- Jin, C.H.; Xiao, Y.H.; Wu, H.; Ji, X.F.; Li, G.; Shuai, J.B.; Yang, P.F.; Xiong, L.N. Human-model interaction-based decision support system for optimizing food safety assessment. Food Res. Int. 2025, 208, 116156. [Google Scholar] [CrossRef]
- Ten, S.T.; Hashim, U.; Gopinath, S.C.B.; Liu, W.W.; Foo, K.L.; Sam, S.T.; Rahman, S.F.A.; Voon, C.H.; Nordin, A.N. Highly sensitive Escherichia coli shear horizontal surface acoustic wave biosensor with silicon dioxide nanostructures. Biosens. Bioelectron. 2017, 93, 146–154. [Google Scholar] [CrossRef] [PubMed]
- Zaidan, L.A.; Novodchuk, I.; Xu, A.H.; Nica, A.; Takaloo, S.; Lloyd, C.; Karimi, R.; Sanderson, J.; Bajcsy, M.; Yavuz, M. Rapid, selective, and ultra-sensitive field effect transistor-based detection of Escherichia coli. Materials 2024, 17, 3648. [Google Scholar] [CrossRef]
- Pan, B.F.; El-Moghazy, A.Y.; Norwood, M.; Nitin, N.; Sun, G. Rapid and ultrasensitive colorimetric biosensors for onsite detection of Escherichia coli O157:H7 in fluids. ACS Sens. 2024, 9, 912–922. [Google Scholar] [CrossRef]
- Majowicz, S.E.; Scallan, E.; Jones-Bitton, A.; Sargeant, J.M.; Stapleton, J.; Angulo, F.J.; Yeung, D.H.; Kirk, M.D. Global incidence of human Shiga toxin-producing Escherichia coli infections and deaths: A systematic review and knowledge synthesis. Foodborne Pathog Dis. 2014, 11, 447–455. [Google Scholar] [CrossRef]
- WHO. E. coli. 2018. Available online: https://www.who.int/news-room/fact-sheets/detail/e-coli (accessed on 22 May 2024).
- Zhu, Y.F.; Gu, L.; Yu, J.X.; Yang, J.C.; Zhai, X.J.; Dong, C.; Qian, H.M.; Tan, Z.M.; Pan, H.X.; Liu, J.B.; et al. Analysis on the epidemiological characteristics of Escherichia coli O157: H7 infection in Xuzhou, Jiangsu, China, 1999. J. Nanjing Med. Univ. 2009, 23, 20–24. [Google Scholar] [CrossRef]
- Ishikawa, K.; Yamaguchi, S.; Tsukaoka, T.; Tsunoda, M.; Furuta, K.; Kaito, C. Sulphur-acquisition pathways for cysteine synthesis confer a fitness advantage to bacteria in plant extracts. Environ. Microbiol. 2025, 27, e70126. [Google Scholar] [CrossRef]
- Gill, A.; Huszczynski, G. Enumeration of Escherichia coli O157:H7 in outbreak-associated beef patties. J. Food Prot. 2016, 79, 1266–1268. [Google Scholar] [CrossRef]
- Spagnolo, S.; de la Franier, B.; Davoudian, K.; Hianik, T.; Thompson, M. Detection of E. coli bacteria in milk by an acoustic wave aptasensor with an anti-fouling coating. Sensors 2022, 22, 1853. [Google Scholar] [CrossRef]
- Fu, J.M.; Zhou, Y.F.; Huang, X.L.; Zhang, W.J.; Wu, Y.H.; Fang, H.; Zhang, C.Z.; Xiong, Y.H. Dramatically enhanced immunochromatographic assay using cascade signal amplification for ultrasensitive detection of Escherichia coli O157:H7 in milk. J. Agric. Food Chem. 2020, 68, 1118–1125. [Google Scholar] [CrossRef] [PubMed]
- Tsougeni, K.; Kaprou, G.; Loukas, C.M.; Papadakis, G.; Hamiot, A.; Eck, M.; Rabus, D.; Kokkoris, G.; Chatzandroulis, S.; Papadopoulos, V.; et al. Lab-on-Chip platform and protocol for rapid foodborne pathogen detection comprising on-chip cell capture, lysis, DNA amplification and surface-acoustic-wave detection. Sens. Actuators B 2020, 320, 128345. [Google Scholar] [CrossRef]
- Zhou, W.Q.; Wang, K.; Hong, W.; Bai, C.Y.; Chen, L.; Fu, X.; Huang, T.Y.; Liu, J.Y. Development and application of a simple “easy to operate” propidium monoazide-crossing priming amplification on detection of viable and viable but non-culturable cells of O157 Escherichia coli. Front. Microbiol. 2020, 11, 569105. [Google Scholar] [CrossRef] [PubMed]
- Kim, J.E.; Shin, J.H.; Park, J.P. An engineered antimicrobial peptide as an alternative bioreceptor for the detection of pathogenic Escherichia coli O157:H7. J. Electroanal. Chem. 2024, 953, 118003. [Google Scholar] [CrossRef]
- Lamanna, L.; Rizzi, F.; Bhethanabotla, V.R.; De Vittorio, M. Conformable surface acoustic wave biosensor for E-coli fabricated on PEN plastic film. Biosens. Bioelectron. 2020, 163, 112164. [Google Scholar] [CrossRef] [PubMed]
- Xia, J.F.; Bu, T.; Jia, P.; He, K.Y.; Wang, X.; Sun, X.Y.; Wang, L. Polydopamine nanospheres-assisted direct PCR for rapid detection of Escherichia coli O157:H7. Anal. Biochem. 2022, 654, 114797. [Google Scholar] [CrossRef] [PubMed]
- Rapp, B.E.; Voigt, A.; Dirschka, M.; Rapp, M.; Länge, K. Surface acoustic wave resonator chip setup for the elimination of interfering conductivity responses. Micromachines 2024, 15, 501. [Google Scholar] [CrossRef]
- Wang, T.; Murphy, R.; Wang, J.; Mohapatra, S.S.; Mohapatra, S.; Guldiken, R. Perturbation analysis of a multiple layer guided Love wave sensor in a viscoelastic environment. Sensors 2019, 19, 4533. [Google Scholar] [CrossRef]
- Zhao, Z.; Yin, Y.N.; Cui, B.L.; Hu, F.B.; Wang, W. Low-loss SAW devices for sensing liquid phase based on acoustic model conversion. IEEE Sens. J. 2025, 25, 4341–4349. [Google Scholar] [CrossRef]
- Tretjakov, A.; Syritski, V.; Reut, J.; Boroznjak, R.; Opik, A. Molecularly imprinted polymer film interfaced with surface acoustic wave technology as a sensing platform for label-free protein detection. Anal. Chim. Acta 2016, 902, 182–188. [Google Scholar] [CrossRef]
- Liu, X.; Wang, J.Y.; Mao, X.B.; Ning, Y.; Zhang, G.J. Single-shot analytical assay based on graphene-oxide-modified surface acoustic wave biosensor for detection of singlenucleotide polymorphisms. Anal. Chem. 2015, 87, 9352–9359. [Google Scholar] [CrossRef]
- Han, S.B.; Lee, S.S. Isolation and characterization of exosomes from cancer cells using antibody-functionalized paddle screw-type devices and detection of exosomal miRNA using piezoelectric biosensor. Sensors 2024, 24, 5399. [Google Scholar] [CrossRef] [PubMed]
- Agostinia, M.; Greco, G.; Cecchini, M. A Rayleigh surface acoustic wave (R-SAW) resonator biosensor basedon positive and negative reflectors with sub-nanomolar limit of detection. Sens. Actuators B. 2018, 254, 1–7. [Google Scholar] [CrossRef]
- Zhang, L.; Zhang, S.; Floer, C.; Kantubuktha, S.A.R.; Velasco, M.J.G.R.; Friend, J. Surface acoustic wave-driven enhancement of enzyme-linked immunosorbent assays: ELISAW. Anal. Chem. 2024, 96, 9676–9683. [Google Scholar] [CrossRef] [PubMed]
- Pouya, C.; Nash, G.R. Metamaterial control of the surface acoustic wave streaming jet. J. Phys. D Appl. Phys. 2024, 57, 195303. [Google Scholar] [CrossRef]
- De Simoni, G.; Signore, G.; Agostini, M.; Beltram, F.; Piazza, V. A surface-acoustic-wave-based cantilever bio-sensor. Biosens. Bioelectron. 2015, 68, 570–576. [Google Scholar] [CrossRef]
- Ali, M.H.; Elsherbiny, M.E.; Emara, M. Updates on aptamer research. Int. J. Mol. Sci. 2019, 20, 2511. [Google Scholar] [CrossRef] [PubMed]
- Elskens, J.P.; Elskens, J.M.; Madder, A. Chemical modification of aptamers for increased binding affinity in diagnostic applications: Current status and future prospects. Int. J. Mol. Sci. 2020, 21, 4522. [Google Scholar] [CrossRef]
- Wan, H.X.; Song, D.D.; Li, X.G.; Zhang, D.W.; Gao, J.; Du, C.W. Failure mechanisms of the coating/metal interface in waterborne coatings: The effect of bonding. Materials 2017, 10, 397. [Google Scholar] [CrossRef]
- Badsha, M.A.H.; Khan, M.; Wu, B.L.; Kumar, A.; Lo, I.M.C. Role of surface functional groups of hydrogels in metal adsorption: From performance to mechanism. J. Hazard. Mater. 2021, 408, 124463. [Google Scholar] [CrossRef]
- Song, J.N.; Jin, X.; Wang, X.C.C.; Jin, P.K. Preferential binding properties of carboxyl and hydroxyl groups with aluminium salts for humic acid removal. Chemosphere 2019, 234, 478–487. [Google Scholar] [CrossRef] [PubMed]
- Hu, S.C.; Wang, H.Y.; Li, X.K.; He, W.B.; Ma, J.; Xu, Y.J.; Xu, Y.P.; Ming, W.Y. Recent advances in bioleaching and biosorption of metals from waste printed circuit boards: A review. J. Environ. Manag. 2024, 371, 123008. [Google Scholar] [CrossRef] [PubMed]
- Gao, S.P.; Guisán, J.M.; Rocha-Martin, J. Oriented immobilization of antibodies onto sensing platforms-A critical review. Anal. Chim. Acta 2021, 1189, 338907. [Google Scholar] [CrossRef]
- Zhu, R.Q.; Song, J.P.; Ma, Q.; Zhou, Y.; Yang, J.; Shuang, S.M.; Dong, C.A. A colorimetric probe for the detection of aluminum ions based on 11-mercaptoundecanoic acid functionalized gold nanoparticles. Anal. Methods 2016, 8, 7232–7236. [Google Scholar] [CrossRef]
- Wu, W.H.; Zhang, J.; Zheng, M.Q.; Zhong, Y.H.; Yang, J.; Zhao, Y.H.; Wu, W.P.; Ye, W.; Wen, J.; Wang, Q.; et al. An aptamer-based biosensor for colorimetric detection of Escherichia coli O157:H7. PLoS ONE 2012, 7, e48999. [Google Scholar] [CrossRef]
- Ma, X.C.; Fei, H. The use of metal coordination in peptide and protein research. Prog. Chem. 2016, 28, 184–192. [Google Scholar] [CrossRef]
- He, W.; Ren, X.H.; Liu, J.Y. Corrosion inhibition performance of RNC-n on aluminum alloy surface in alkaline solution. J. Mol. Struct. 2024, 1317, 139107. [Google Scholar] [CrossRef]
- Chang, K.S.; Chang, C.K.; Chen, C.Y. A surface acoustic wave sensor modified from a wireless transmitter for the monitoring of the growth of bacteria. Sens. Actuators B 2007, 125, 207–213. [Google Scholar] [CrossRef]
- Chang, Y.H.; Jang, H.D.; Hsu, C.L.; Chang, K.S. Quantitative determination of Escherichia coli in water sources in the environment using a surface acoustic wave impedance system modified with a syringe filter. Anal. Lett. 2012, 45, 1485–1494. [Google Scholar] [CrossRef]
- Moll, N.; Pascal, E.; Dinh, D.H.; Pillot, J.P.; Bennetau, B.; Rebière, D.; Moynet, D.; Mas, Y.; Mossalayi, D.; Pistré, J.; et al. A Love wave immunosensor for whole E-coli bacteria detection using an innovative two-step immobilisation approach. Biosens. Bioelectron. 2007, 22, 2145–2150. [Google Scholar] [CrossRef] [PubMed]
Disclaimer/Publisher’s Note: The statements, opinions and data contained in all publications are solely those of the individual author(s) and contributor(s) and not of MDPI and/or the editor(s). MDPI and/or the editor(s) disclaim responsibility for any injury to people or property resulting from any ideas, methods, instructions or products referred to in the content. |
© 2025 by the authors. Licensee MDPI, Basel, Switzerland. This article is an open access article distributed under the terms and conditions of the Creative Commons Attribution (CC BY) license (https://creativecommons.org/licenses/by/4.0/).

