Article

Predicting Adsorption Performance Based on the Properties of Activated Carbon: A Case Study of Shenqi Fuzheng System

1
Pharmaceutical Informatics Institute, College of Pharmaceutical Sciences, Zhejiang University, Hangzhou 310058, China
2
Zhuhai Livzon Modernized Traditional Chinese Medicine Technology Co., Ltd., Zhuhai 519060, China
3
Guangdong Province Enterprise Key Laboratory for R&D and Industrialization of High-End Liquid Pharmaceutical Preparations, Shaoguan 512028, China
4
Livzon Group Limin Pharmaceutical Factory, Shaoguan 512028, China
5
Jinhua Institute of Zhejiang University, Jinhua 321016, China
6
National Key Laboratory of Chinese Medicine Modernization, Zhejiang University, Hangzhou 310058, China
*
Authors to whom correspondence should be addressed.
Chemosensors 2025, 13(8), 279; https://doi.org/10.3390/chemosensors13080279
Submission received: 21 June 2025 / Revised: 21 July 2025 / Accepted: 30 July 2025 / Published: 1 August 2025
(This article belongs to the Section Analytical Methods, Instrumentation and Miniaturization)

Abstract

This work aims to solve the problem of product quality fluctuations caused by batch-to-batch variations in the adsorption capacity of activated carbon during the production of traditional Chinese medicine (TCM) injections. In this work, Shenqi Fuzheng injection was selected as an example. Diluted Shenqi Extract (DSE), an intermediate in the production process of Shenqi Fuzheng injection, was adsorbed with different batches of activated carbon. The adsorption capacities of adenine, adenosine, calycosin-7-glucoside, and astragaloside IV in DSE were selected as evaluation indices for activated carbon absorption. Characterization methods such as nitrogen adsorption, X-ray photoelectron spectrum (XPS), and Fourier transform infrared (FTIR) were chosen to explore the quantitative relationships between the properties of activated carbon (i.e., specific surface area, pore volume, surface elements, and spectrum) and the adsorption capacities of these four components. It was found that the characteristic wavelengths from FTIR characterization, i.e., 1560 cm−1, 2325 cm−1, 3050 cm−1, and 3442 cm−1, etc., showed the strongest correlation with the adsorption capacities of these four components. Prediction models based on the transmittance at characteristic wavelengths were successfully established via multiple linear regression. In validation experiments of models, the relative errors of predicted adsorption capacities of activated carbon were mostly within 5%, indicating good predictive ability of the models. The results of this work suggest that the prediction method of adsorption capacity based on the mid-infrared spectrum can provide a new way for the quality control of activated carbon.

1. Introduction

Activated carbon is included in the 2025 Edition of the Pharmacopoeia of the People’s Republic of China, Volume 4, and is prepared from materials such as wood, fruit shells, and coal through physical and chemical methods [1]. In the pharmaceutical industry, activated carbon is a commonly used adsorbent with good physical and chemical adsorption capabilities, frequently applied in decolorization [2,3], impurity removal [4,5], and pyrogen elimination [6,7,8].
At present, the main methods for pyrogen removal in the production of traditional Chinese medicine (TCM) injections are activated carbon adsorption [9] and ultrafiltration. While activated carbon removes pyrogens and decolors, it can also affect the contents of active components in the system. Due to the diverse raw materials and production processes of activated carbon, significant batch-to-batch quality performance differences of activated carbon have been found in the production of TCM injections. Such differences in adsorption capacity easily lead to quality fluctuations in injection products [10,11,12]. Therefore, it is necessary to find a characterization method to quantitatively predict the adsorption capacity of activated carbon, which can improve batch-to-batch consistency of products.
Numerous characterization methods for activated carbon have been reported [13]. Conventional indicators mainly include iodine adsorption value, methylene blue adsorption value, phenol adsorption value, etc. [14,15,16]. For physical properties such as specific surface area, pore volume, and average pore size of activated carbon, the nitrogen isothermal adsorption method can be used for detection [17,18]. Common chemical properties can be characterized using techniques including Fourier transform infrared spectrum (FTIR) [19,20,21] and X-ray photoelectron spectrum (XPS) [22]. However, there are few reports on the quantitative relationships between activated carbon’s characteristics and its adsorption performance in TCM injection systems.
Based on previous work [23], this work takes the Shenqi Fuzheng system as an example to find out the relationships between activated carbon characteristics and its adsorption performance. Shenqi Fuzheng injection is made from Astragali Radix and Codonopsis Radix. These two medicinal herbs are processed with water extraction, concentration, ethanol precipitation, filtration, and ethanol recovery, respectively [24,25]. After ethanol recovery, Astragali Radix extract and Codonopsis Radix extract are obtained, respectively. Astragali Radix extract and Codonopsis Radix extract are then mixed and form Shenqi Extract. Diluted Shenqi Extract (DSE) is then obtained after dilution of Shenqi Extract with water. Activated carbon is used to treat DSE.
Many researchers have shown that Shenqi Fuzheng injection contains multiple active ingredients, such as adenine, which is involved in purine metabolism, adenosine with potential roles in energy transfer, calycosin-7-glucoside, which may contribute to the anti-tumor effects, and astragaloside IV, which can inhibit the vitality and invasion of triple-negative breast cancer cells [26,27,28,29]. The structures of these active ingredients are shown in Figure 1. Therefore, in this work, the adsorption capacities of these four active ingredients in DSE were selected as evaluation indices for activated carbon treatment. Nitrogen adsorption was used to characterize the specific surface area and pore volume of activated carbon. XPS and FTIR were used to analyze surface elements and surface functional groups of activated carbon, respectively. Quantitative models between different characterization features and the four indices were established. After establishing the quantitative models, validation experiments were further carried out.

2. Materials and Methods

2.1. Reagents and Materials

Adenine (lot: D09S10S97125, ≥98%), adenosine (lot: J08HB173656, ≥99%), calycosin-7-glucoside (lot: J19HB174062, ≥98%), and astragaloside IV (lot: N13HB201030, ≥98%) were all purchased from Shanghai Yuanye Bio-Technology Co., Ltd. (Shanghai, China). Acetonitrile (chromatographic grade, MERCK, Darmstadt, Germany), formic acid (analytical grade, Sinopharm Chemical Reagents Co., Ltd., Shanghai, China), methanol (analytical grade, Sinopharm Chemical Reagents Co., Ltd., Shanghai, China), ammonia solution (analytical grade, Shanghai Aladdin Biochemical Technology Co., Ltd., Shanghai, China), C18 solid phase extraction cartridges (2 g/12 mL, Welch, Shanghai, China), and Shenqi Extract (batch number 230222, Livzon Group Limin Pharmaceutical Factory, Shaoguan, China) were used. The information about the activated carbons used is listed in Table 1.

2.2. Experimental Methods

2.2.1. Adsorption Method

For this study, 25 mL of Shenqi Extract was taken and diluted 20-fold with purified water to obtain DSE. Approximately 0.11 g of each batch of activated carbon was weighed and added to 500 mL of DSE. Magnetic stirring was conducted at room temperature with a stirring speed of 250 r/min. Samples were taken at 0 min, 10 min, 20 min, 30 min, 40 min, 50 min, 1 h, 2 h, 3 h, 4 h, and 5 h. The total adsorption duration was 5 h. Samples were filtered through a 0.45 µm membrane and collected for HPLC analysis.

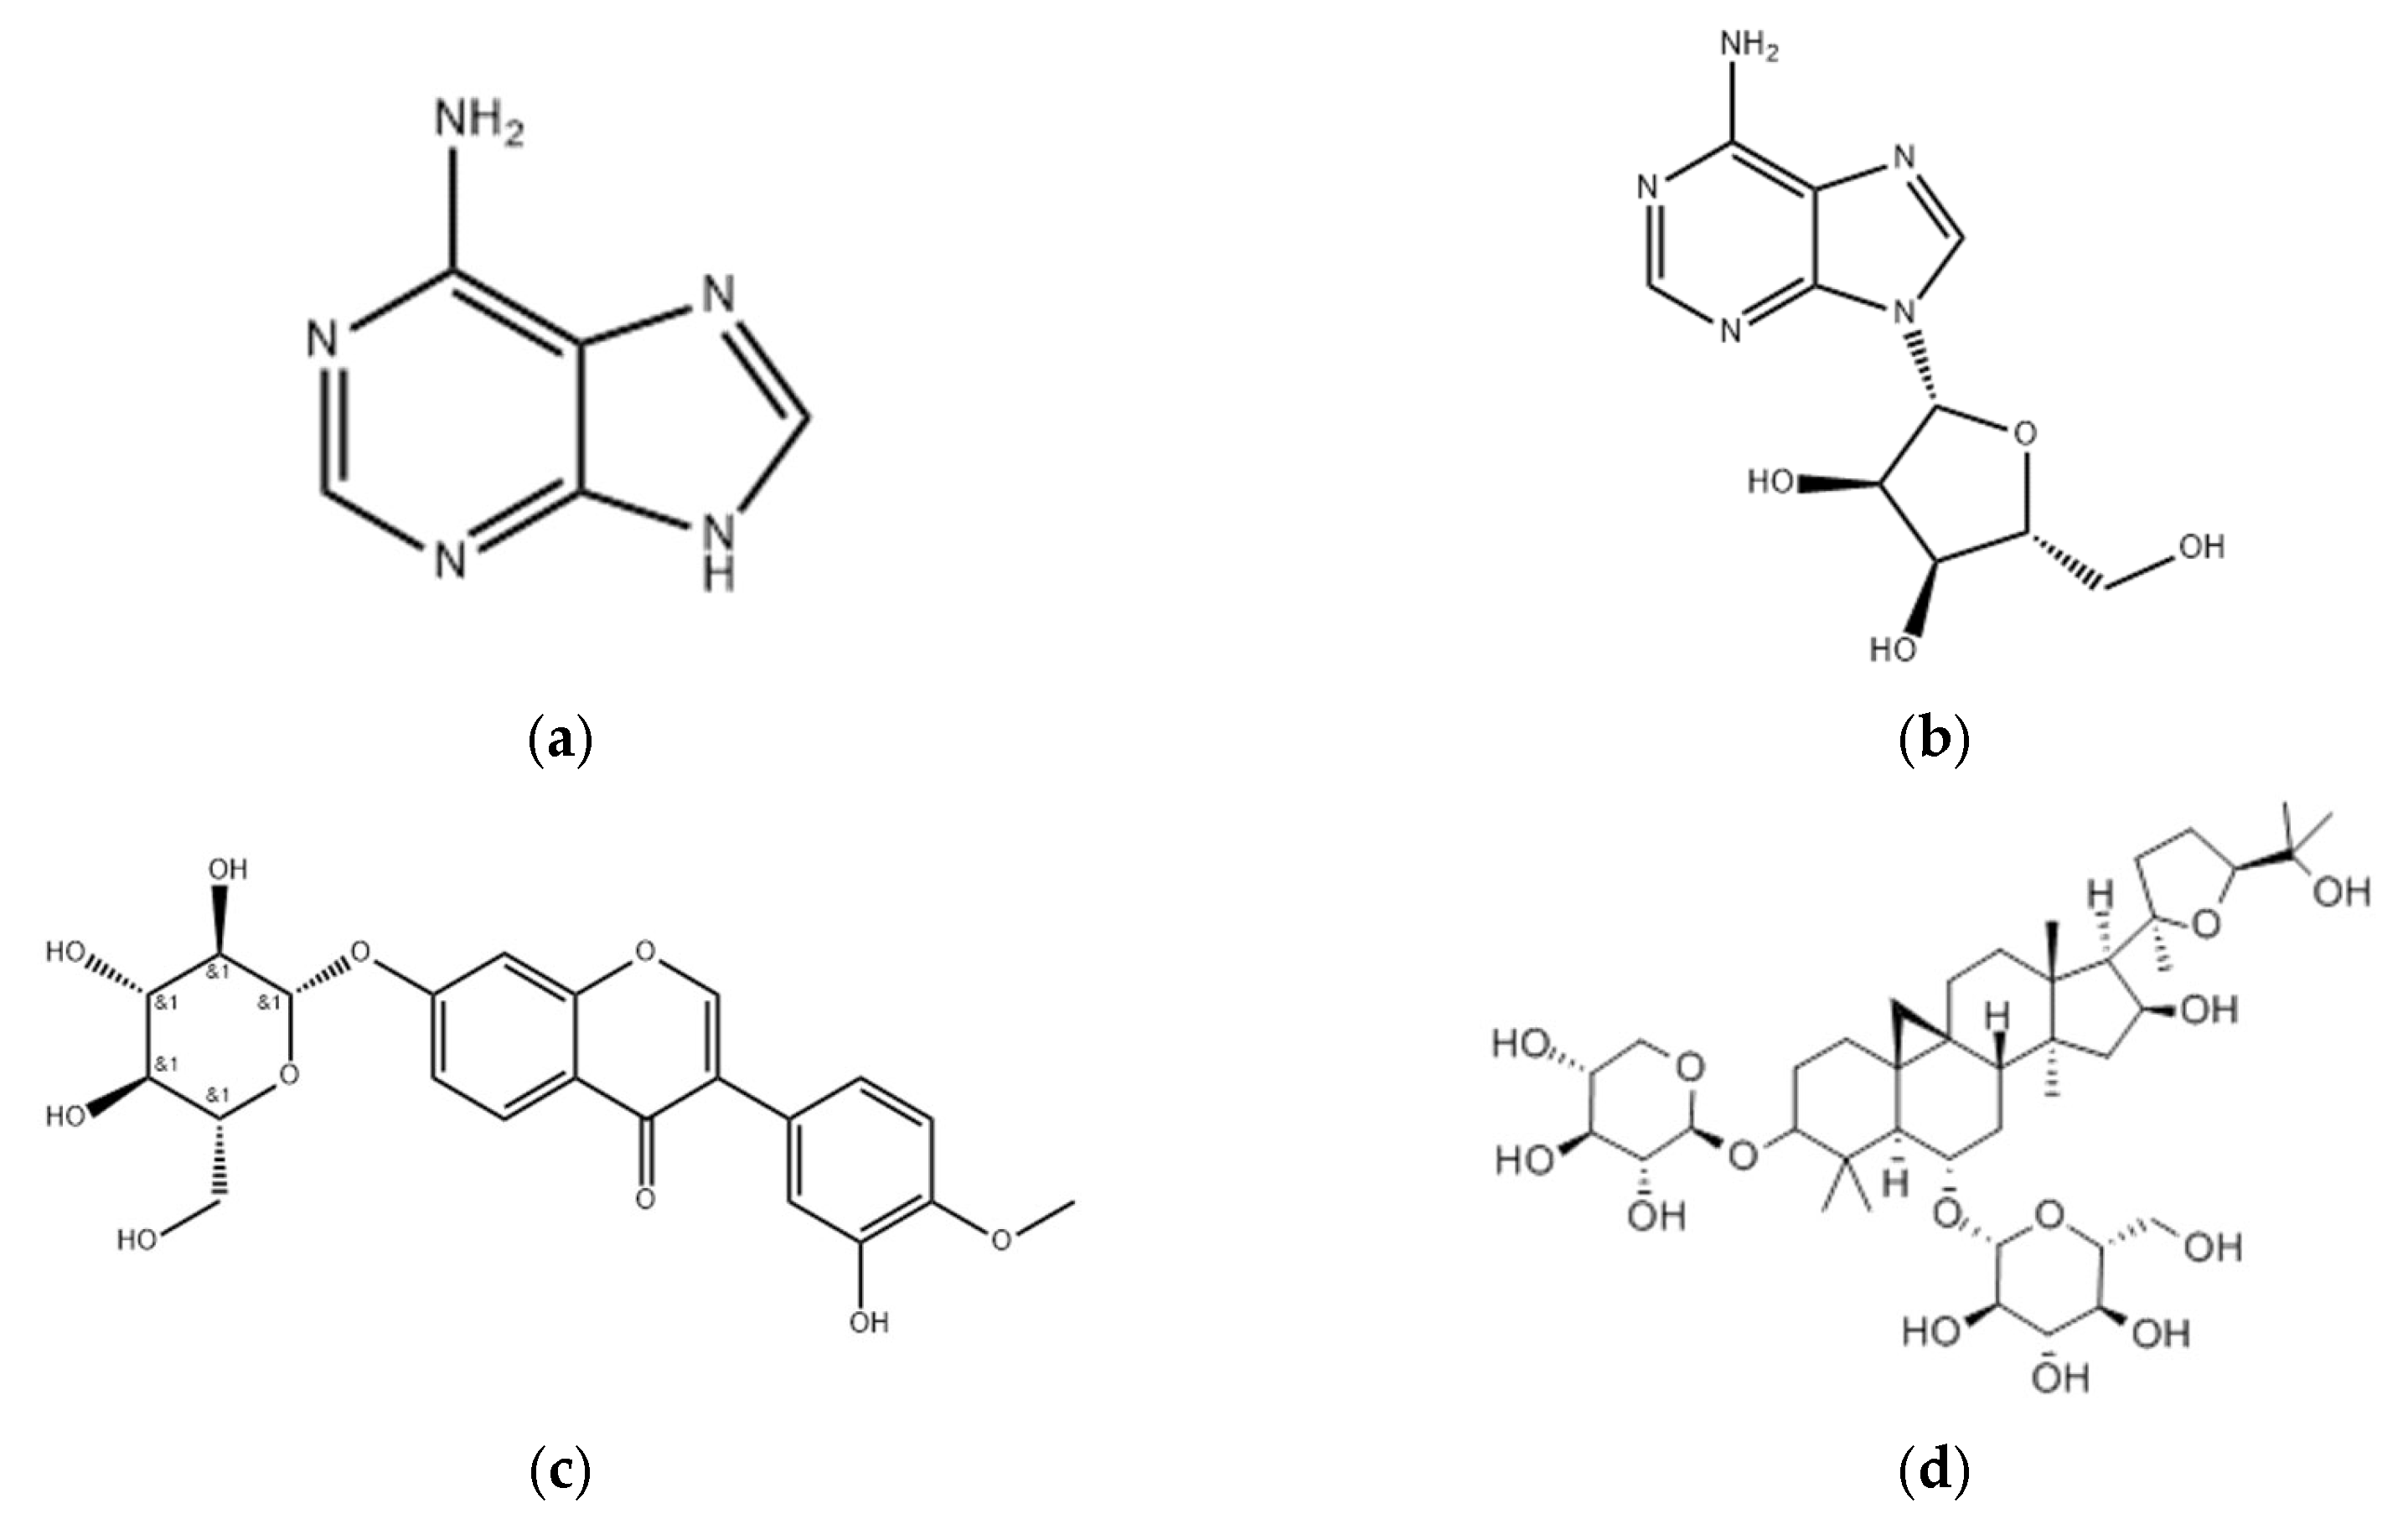
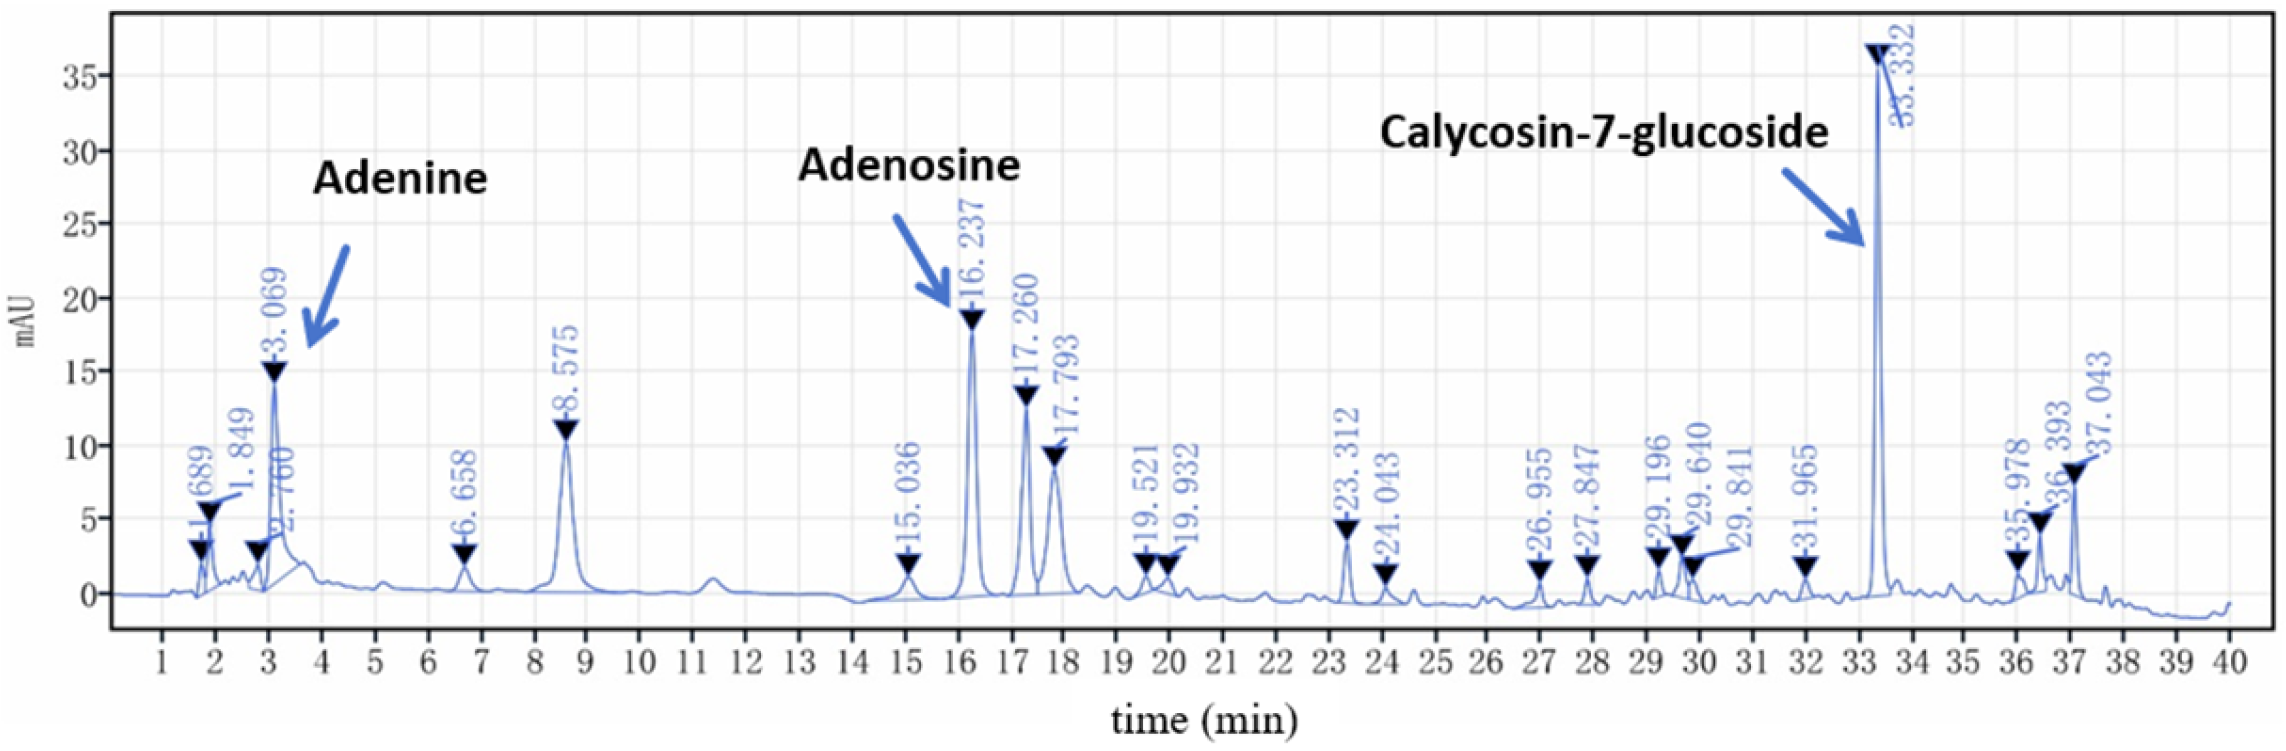
2.2.2. Determination of the Contents of Adenine, Adenosine, and Calycosin-7-glucoside by HPLC

Preparation of Reference Solution
Appropriate amounts of adenine, calycosin-7-glucoside, and adenosine reference substances were precisely weighed and dissolved in water to prepare solutions containing 5 µg, 10 µg, 15 µg, 20 µg, 30 µg of calycosin-7-glucoside and adenosine per 1 mL, and 2.5 µg, 5 µg, 7.5 µg, 10 µg, 15 µg of adenine per 1 mL as reference solutions. All reference solutions were analyzed by HPLC to obtain the calibration curve.
Preparation of Test Solution
Appropriate amounts of DSE before adsorption and the sample after adsorption in Section 2.2.1 were taken and filtered through a 0.45 µm membrane to obtain the test solution.
Chromatography Conditions
The analytical method described in the literature [23] was adopted. The chromatographic column was Waters Atlantis T3 (100 mm × 2.1 mm, 3 μm); the mobile phase was 0.05% formic acid solution (A) and acetonitrile (B); the flow rate was 0.25 mL/min; the detection wavelength was 260 nm; the column temperature was 30 °C; the injection volume was 5 μL. Gradient elution conditions were as follows: 0–7 min, 100% A; 7–15 min, 100–95% A; 15–20 min, 95–90% A; 20–30 min, 90–75% A; 30–35 min, 75–50% A; 35–40 min, 50–5% A; 40–50 min, 5% A. Adenine, adenosine, and calycosin-7-glucoside showed good linear relationships in the ranges of 2.5–15 µg/mL, 5–30 µg/mL, and 5–30 µg/mL, respectively. And the R2 was 0.9936, 0.9906, and 0.9989, respectively. The limits of detection (LOD) of adenine, adenosine, and calycosin-7-glucoside were 0.268 µg/mL, 0.390 µg/mL, and 0.447 µg/mL, respectively. The limits of quantification (LOQ) were 0.811 µg/mL, 1.18 µg/mL, and 1.36 µg/mL, respectively. The chromatogram of DSE before adsorption is shown in Figure 2. The concentrations of adenine, adenosine, and calycosin-7-glucoside in DSE were 6.45 μg/mL, 13.72 μg/mL, and 15.73 μg/mL, respectively.

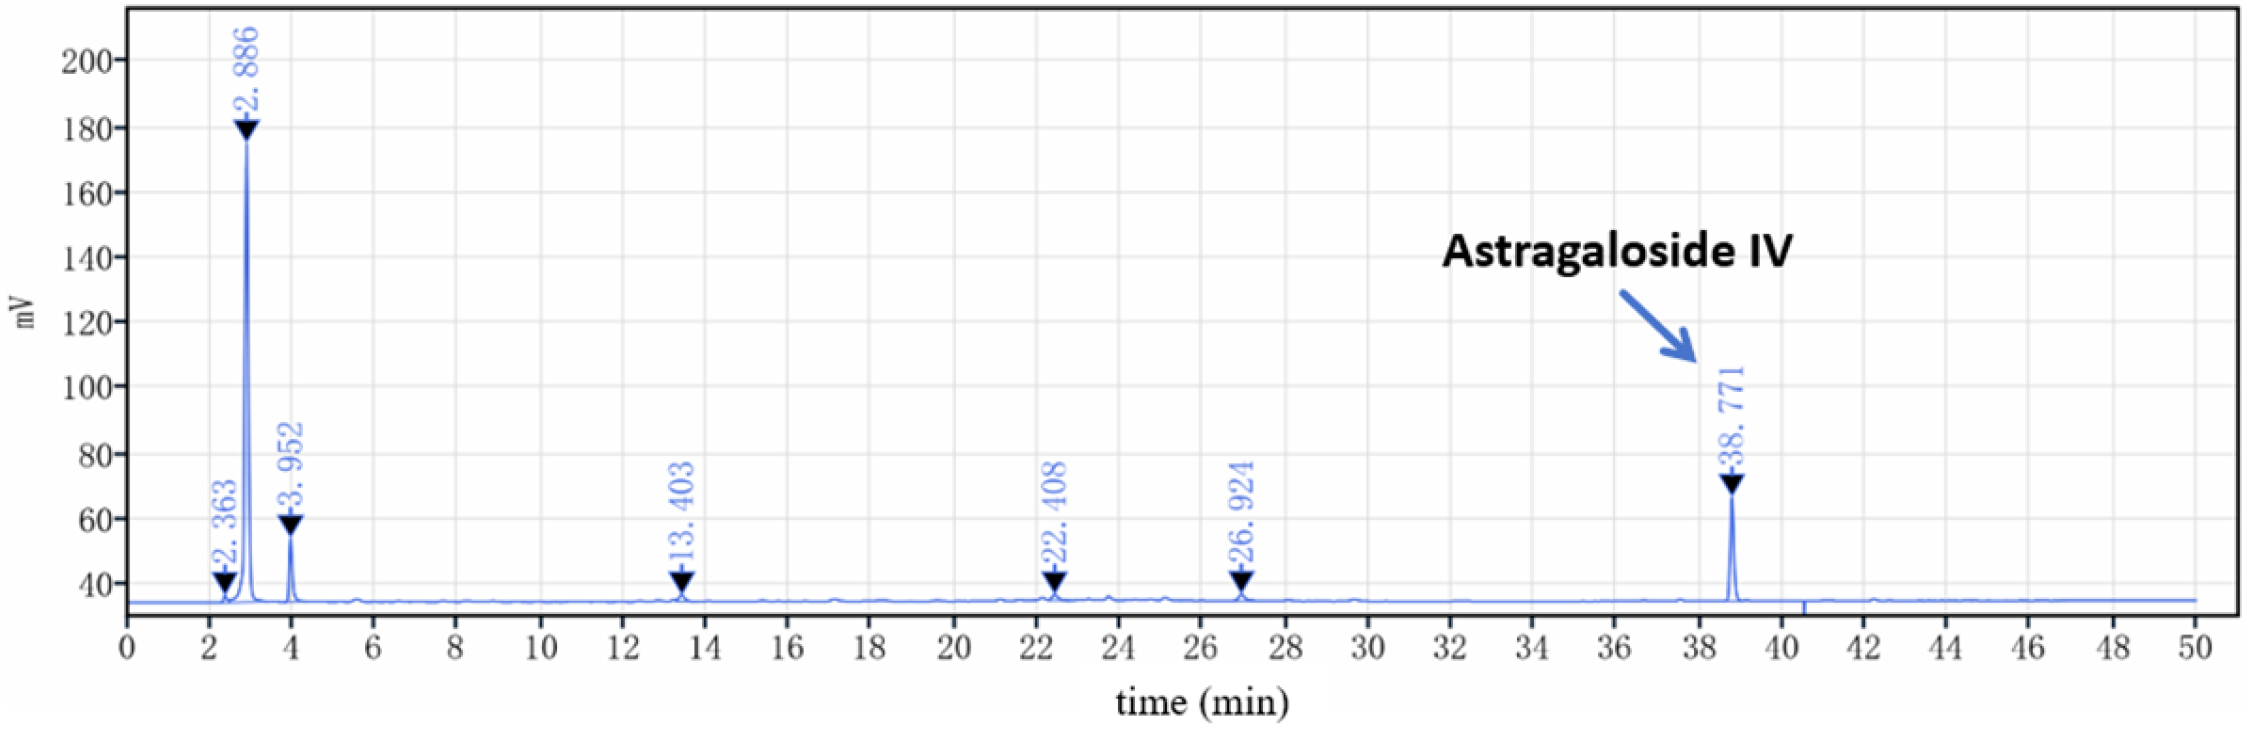
2.2.3. Determination of the Content of Astragaloside IV by HPLC

Preparation of Reference Solution
An appropriate amount of astragaloside IV reference substance was taken, precisely weighed, and dissolved in methanol to prepare solutions containing 0.1 mg, 0.2 mg, 0.4 mg, and 0.8 mg of astragaloside IV per 1 mL as reference solutions. All reference solutions were analyzed by HPLC to obtain the calibration curve.
Preparation of Test Solution
To activate the solid-phase extraction cartridge, the C18 solid-phase extraction cartridge was sequentially treated with 12 mL of methanol and 12 mL of purified water. Then, 12 mL of the sample solution was taken, 0.5 mL of ammonia solution was added, and the mixture was mixed well for standby. The alkali-adjusted sample was added to the activated solid phase extraction cartridge and adsorbed for 30 min. Then, the cartridge was washed with water for 2 column volumes, followed by elution with methanol until the eluate color no longer changed, and the methanol eluate was collected. The methanol eluate was evaporated to dryness in a water bath and dissolved in 1 mL of methanol to obtain the test solution.
Chromatography Conditions
The analytical method described in the literature [23] was adopted. The chromatographic column was ZORBAX SB-C18 (250 mm × 4.6 mm, 5 μm); the mobile phase was 0.2% formic acid–water (A) and acetonitrile (B); the column temperature was 30 °C; the injection volume was 10 μL; the flow rate was 0.8 mL/min. Due to the weak ultraviolet absorption of astragaloside IV, an evaporative light scattering detector (ELSD) was employed for detection, with an atomization temperature of 30 °C, drift tube temperature of 80 °C, and nitrogen flow rate of 1.6 L/min. Gradient elution conditions were as follows: 0–16 min, 85–77% A; 16–20 min, 77–72% A; 20–25 min, 72–70% A; 25–30 min, 70% A; 30–40 min, 70–45% A; 40–50 min, 45–5% A. Astragaloside IV showed good linear relationships in the ranges of 0.1–0.8 mg/mL, and the R2 was 0.9957. The limit of detection (LOD) of astragaloside IV was 0.533 µg/mL. The limit of quantification (LOQ) was 1.61 µg/mL. The chromatogram of DSE before adsorption is shown in Figure 3. The concentration of astragaloside IV in DSE was 0.165 mg/mL.

2.2.4. Characterization of Specific Surface Area and Pore Volume

Approximately 20 mg of each sample of activated carbon batches A1–A5 was weighed, degassed at 120 °C for 7 h, and then detected using a specific surface area and porosity analyzer (ASAP 2020 Plus HD88, Micromeritics, Norcross, GA, USA) at −196 °C with nitrogen as the adsorption medium. The specific surface area was calculated by the Brunauer–Emmett–Teller (BET) method, and the mesoporous and microporous volumes were calculated by the Barrett–Joyner–Halenda (BJH) method. The total pore volume of activated carbon was calculated by single-point adsorption based on the nitrogen adsorption amount at relative pressure P/P0 = 0.99.

2.2.5. FTIR Characterization

An appropriate amount of dried activated carbon was weighed, mixed with spectrally pure dried KBr powder at a mass ratio of 1:100, pressed into a pellet, and then sent to an infrared spectrometer (NICOLET iS50 FT-IR, Thermo Scientific, Waltham, MA, USA) for detection. The test band was 400–4000 cm−1, the spectral resolution was 4 cm−1, and the number of scans was 32.

2.2.6. XPS Characterization

XPS was performed using an AXIS Supra (SHIMADZU, Fukuoka, Japan) with aluminum target power of 120 W; UPS (HeI), binding energy (Eb) + kinetic energy (Ek) = 21.22 eV. The Fermi level was Eb = 0 eV. Activated carbons of batches A1-A5 were all scanned across the full spectrum (0–1200 eV) to determine the elemental composition of the activated carbon surface. High-resolution spectra of C (272–292 eV), N (388–408 eV), O (520–540 eV), and S (150–175 eV) were detected to quantify the atomic percentages of different chemical states of elements. Data processing was performed using CasaXPS Version 2.3.17 (Casa Software Ltd., Teignmouth, UK). Data of batches A1–A5 were all corrected according to the C 1s pollution carbon to shift the carbon peak position to 284.8 eV. The atomic percentage of each element was calculated based on the intensity ratio using the Scofield sensitivity factor built into Casa XPS software. The half-peak width of each peak for C 1s peak fitting was set to 0.7–2.5 eV, and that for O 1s peak fitting was set to 0.5–2.5 eV.

2.3. Data Processing

2.3.1. Determination of Equilibrium Adsorption Capacity

In the static adsorption experiment, samples were taken at regular intervals to detect the contents of active components for calculating adsorption capacities. Data were processed using an empirical method; when the time interval between two sampling points was more than 1 h, and the deviation between the adsorption capacity at this sampling point and that at the next sampling point was no more than 5%, the adsorption capacity at this sampling point was considered as the equilibrium adsorption capacity. The calculation formula for the equilibrium adsorption capacities of the four components (adenine, adenosine, calycosin-7-glucoside, and astragaloside IV) is shown in Equation (1).
Q i = C i , 0 C i , t × V × 1 m
where Q i represents the equilibrium adsorption capacity (mg/g) of component i, C i , 0 represents the concentration (mg/mL) of component i in DSE before adsorption, C i , t represents the concentration (mg/mL) of component i in DSE at adsorption equilibrium, V represents the volume (mL) of DSE, and m represents the mass (g) of added activated carbon.

2.3.2. Linear Regression Modeling

Based on the adsorption capacities of different batches of activated carbon for different components, linear regression modeling was performed on the specific surface area, pore volume data, and XPS data of activated carbon. A quantitative model was established with Formula (2).
Y i = b 0 + i = 1 n b i X i
where Y i represents the adsorption capacity of component i, b 0 is the constant term, b i is the partial regression coefficient, n is the number of input variables of specific surface area, pore volume, or XPS of activated carbon, and X i is an input variable. Stepwise regression modeling was used, with the p-value threshold for inclusion and deletion of items set to 0.01.
In this work, according to the peak characteristics of the mid-infrared spectrum of activated carbon and the information of groups represented by specific wavelengths, the transmittance values at 465 cm−1, 715 cm−1, 750 cm−1, 785 cm−1, 821 cm−1, 916 cm−1, 1103 cm−1, 1480 cm−1, 1560 cm−1, 1680 cm−1, 2315 cm−1, 2325 cm−1, 3050 cm−1, 3442 cm−1, and 4000 cm−1 were selected as the input variables of the model. Due to noise interferences such as fluctuations in the weighing mass ratio during mid-infrared spectrum detection of different batches of activated carbon, the transmittance values at the above wavenumbers were corrected. The wavenumber of 4000 cm−1 was selected as the baseline correction point because it lies outside the main functional group absorption region (typically below 3700 cm−1), where minimal molecular vibration information is present. The transmittance and corrected transmittance at characteristic wavenumbers of activated carbon were subjected to multiple linear regression with the equilibrium adsorption capacities of activated carbon for the four indicator components, as shown in Equation (3).
Y i = b 0 + i = 1 n b i X i f + j = 1 m b j X j f
where b j is the partial regression coefficient, n and m are the numbers of selected wavenumbers and corrected wavenumbers, respectively; X i f and X j f are the transmittance and corrected transmittance at characteristic wavenumbers of activated carbon, respectively. Stepwise regression modeling was used, the outlier A4 was eliminated according to the normality test result, and the p-value threshold for inclusion and deletion of specific items was set to 0.01. Data were analyzed using Design Expert (Stat-Ease Inc., Minneapolis, MN, USA, Version 12.0).

2.3.3. Modeling Validation

The equilibrium adsorption capacities of validation batches C1–C3 of activated carbon were predicted based on the established statistical prediction models, and the models were evaluated according to the experimental values. The evaluation index used was relative error, and the calculation formula is shown in Equation (4).
R e l a t i v e   e r r o r = P r e d i c t e d   v a l u e E x p e r i m e n t a l   v a l u e E x p e r i m e n t a l   v a l u e × 100 %

3. Results

3.1. Optimization of Activated Carbon Characterization Methods

3.1.1. Equilibrium Adsorption Capacity of Batches A1–A5

The equilibrium adsorption capacities of different batches of activated carbon for adenine, adenosine, calycosin-7-glucoside, and astragaloside IV are shown in Table 2. The equilibrium adsorption capacity of calycosin-7-glucoside ranged from 31.6 to 65.1 mg/g, that of adenine ranged from 9.28 to 17.85 mg/g, that of adenosine ranged from 18.23 to 30.85 mg/g, and that of astragaloside IV ranged from 98.14 to 179.9 mg/g. Analysis of variance (ANOVA) was conducted on the adsorption capacity of different batches of activated carbon for each component, and the results showed that the p-values were all less than 0.01, indicating significant differences in the adsorption capacities of different batches of activated carbon in terms of indicator components.

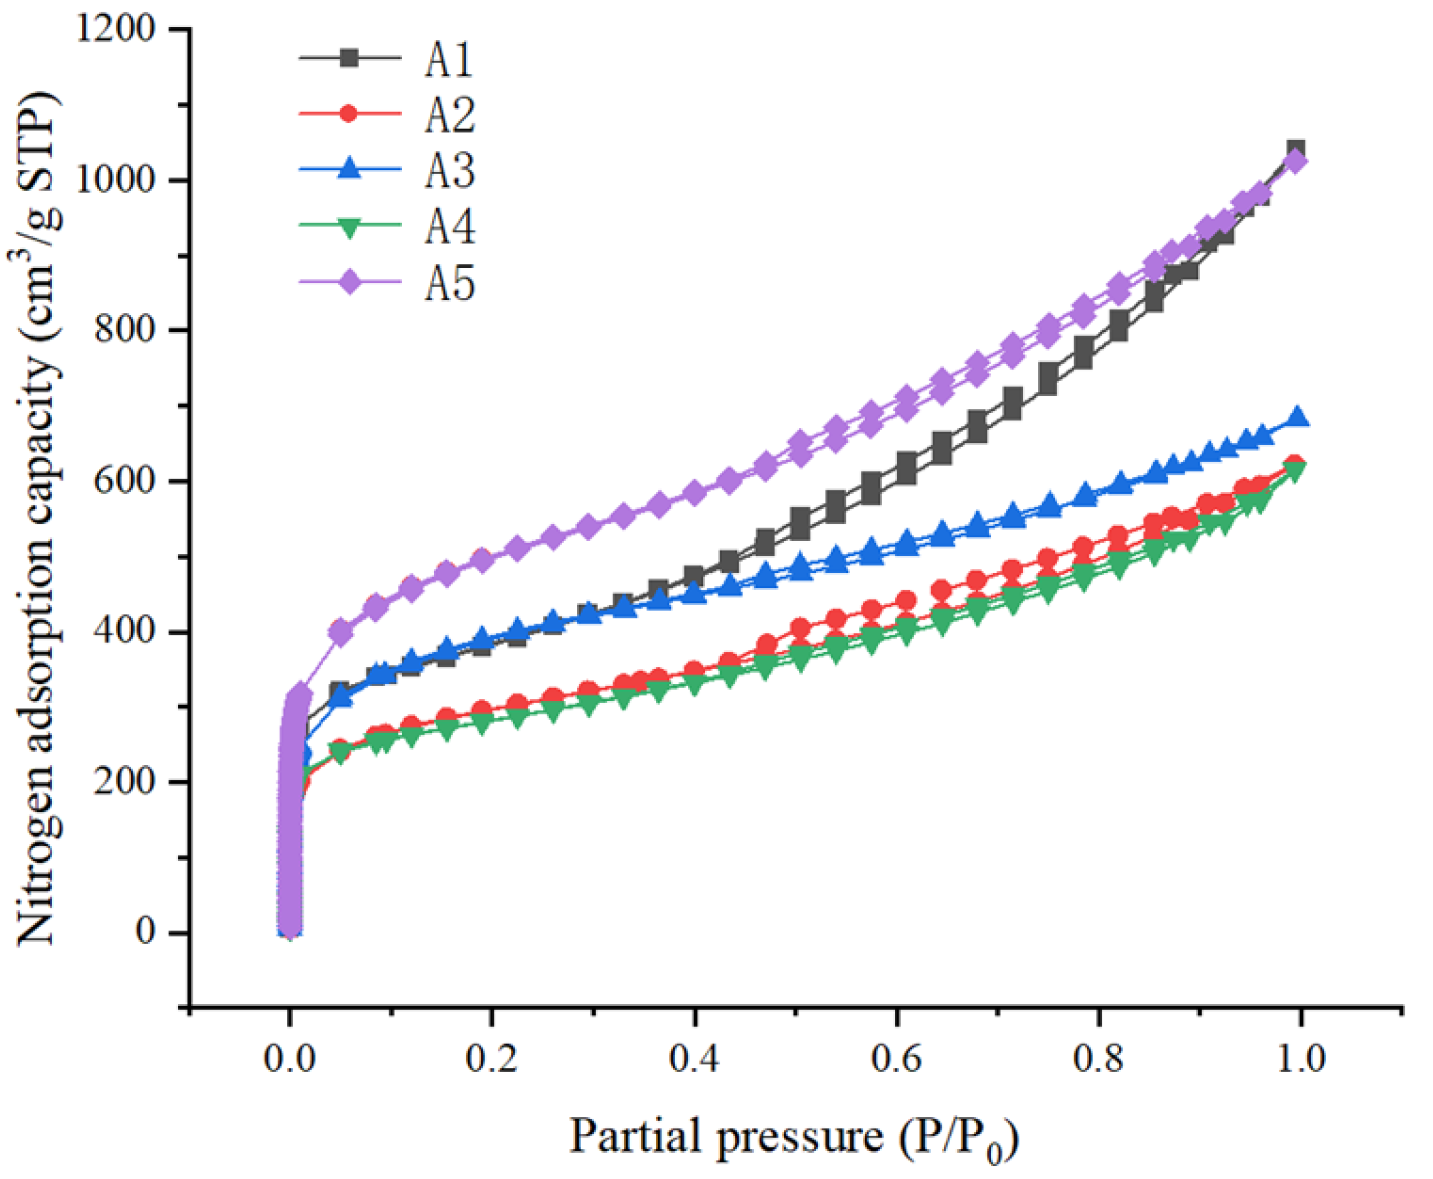
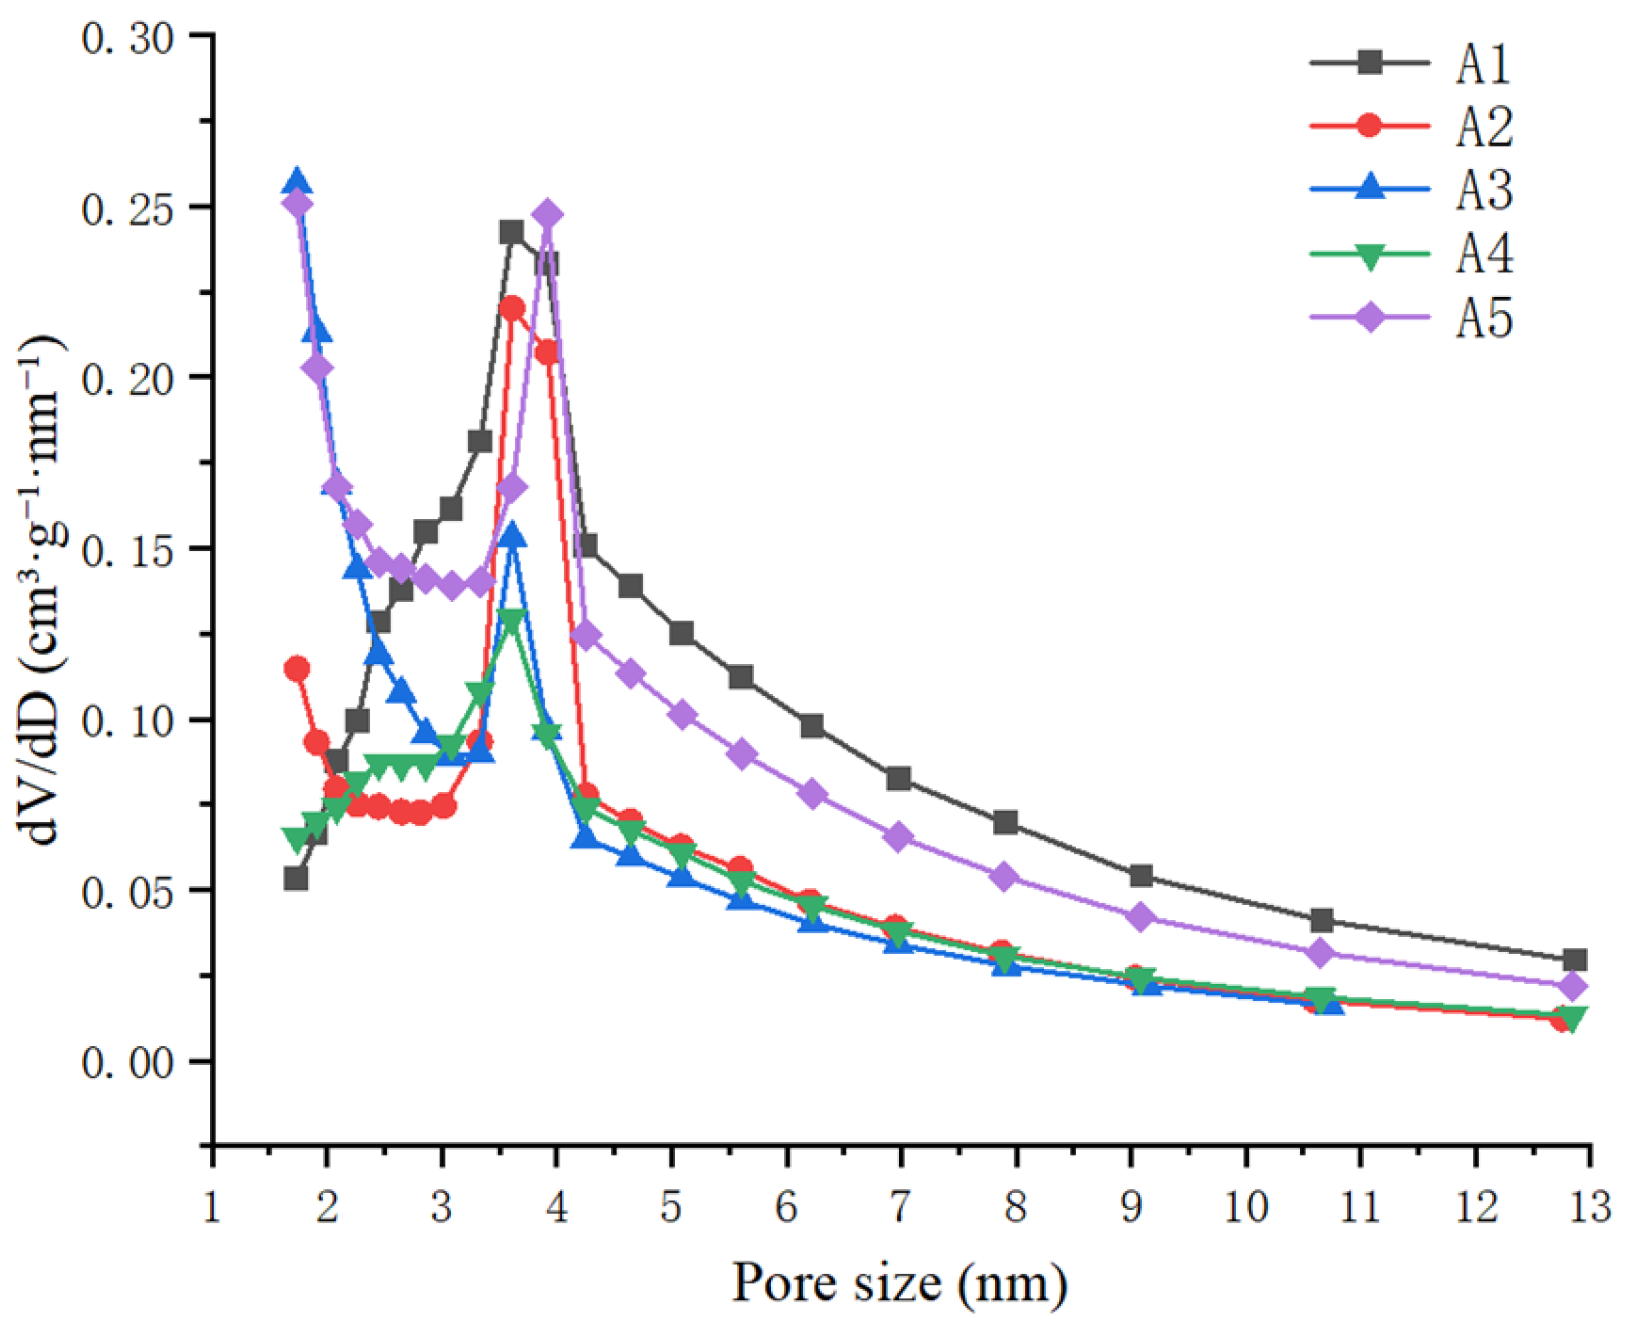
3.1.2. Results of Specific Surface Area and Pore Volume Characterization

The nitrogen adsorption/desorption isotherms of batches A1–A5 used in the experiment are shown in Figure 4. Points within the partial pressure P/P0 range of 0.05–0.30 were taken for calculation, and the specific surface area (SBET) and pore volume calculation results of the five batches are shown in Table 3. The SBET ranged from 916 to 1668 m2/g. The total pore volume, microporous volume and mesoporous volume ranged from 0.9537 to 1.613 cm3/g, 0.1738 to 0.2591 cm3/g and 0.6914 to 1.279 cm3/g, respectively. There were significant differences in specific surface area and pore volume among the five batches of activated carbon.
Figure 5 shows the pore distribution of activated carbon. Five batches of activated carbon all had a peak near 3.7 nm, indicating a large number of pore channels of corresponding sizes. Two batches of activated carbon, A3 and A5, also had an obvious peak near 1.7 nm, suggesting that these two batches had more micropores than the other three batches, which could lead to larger SBET.

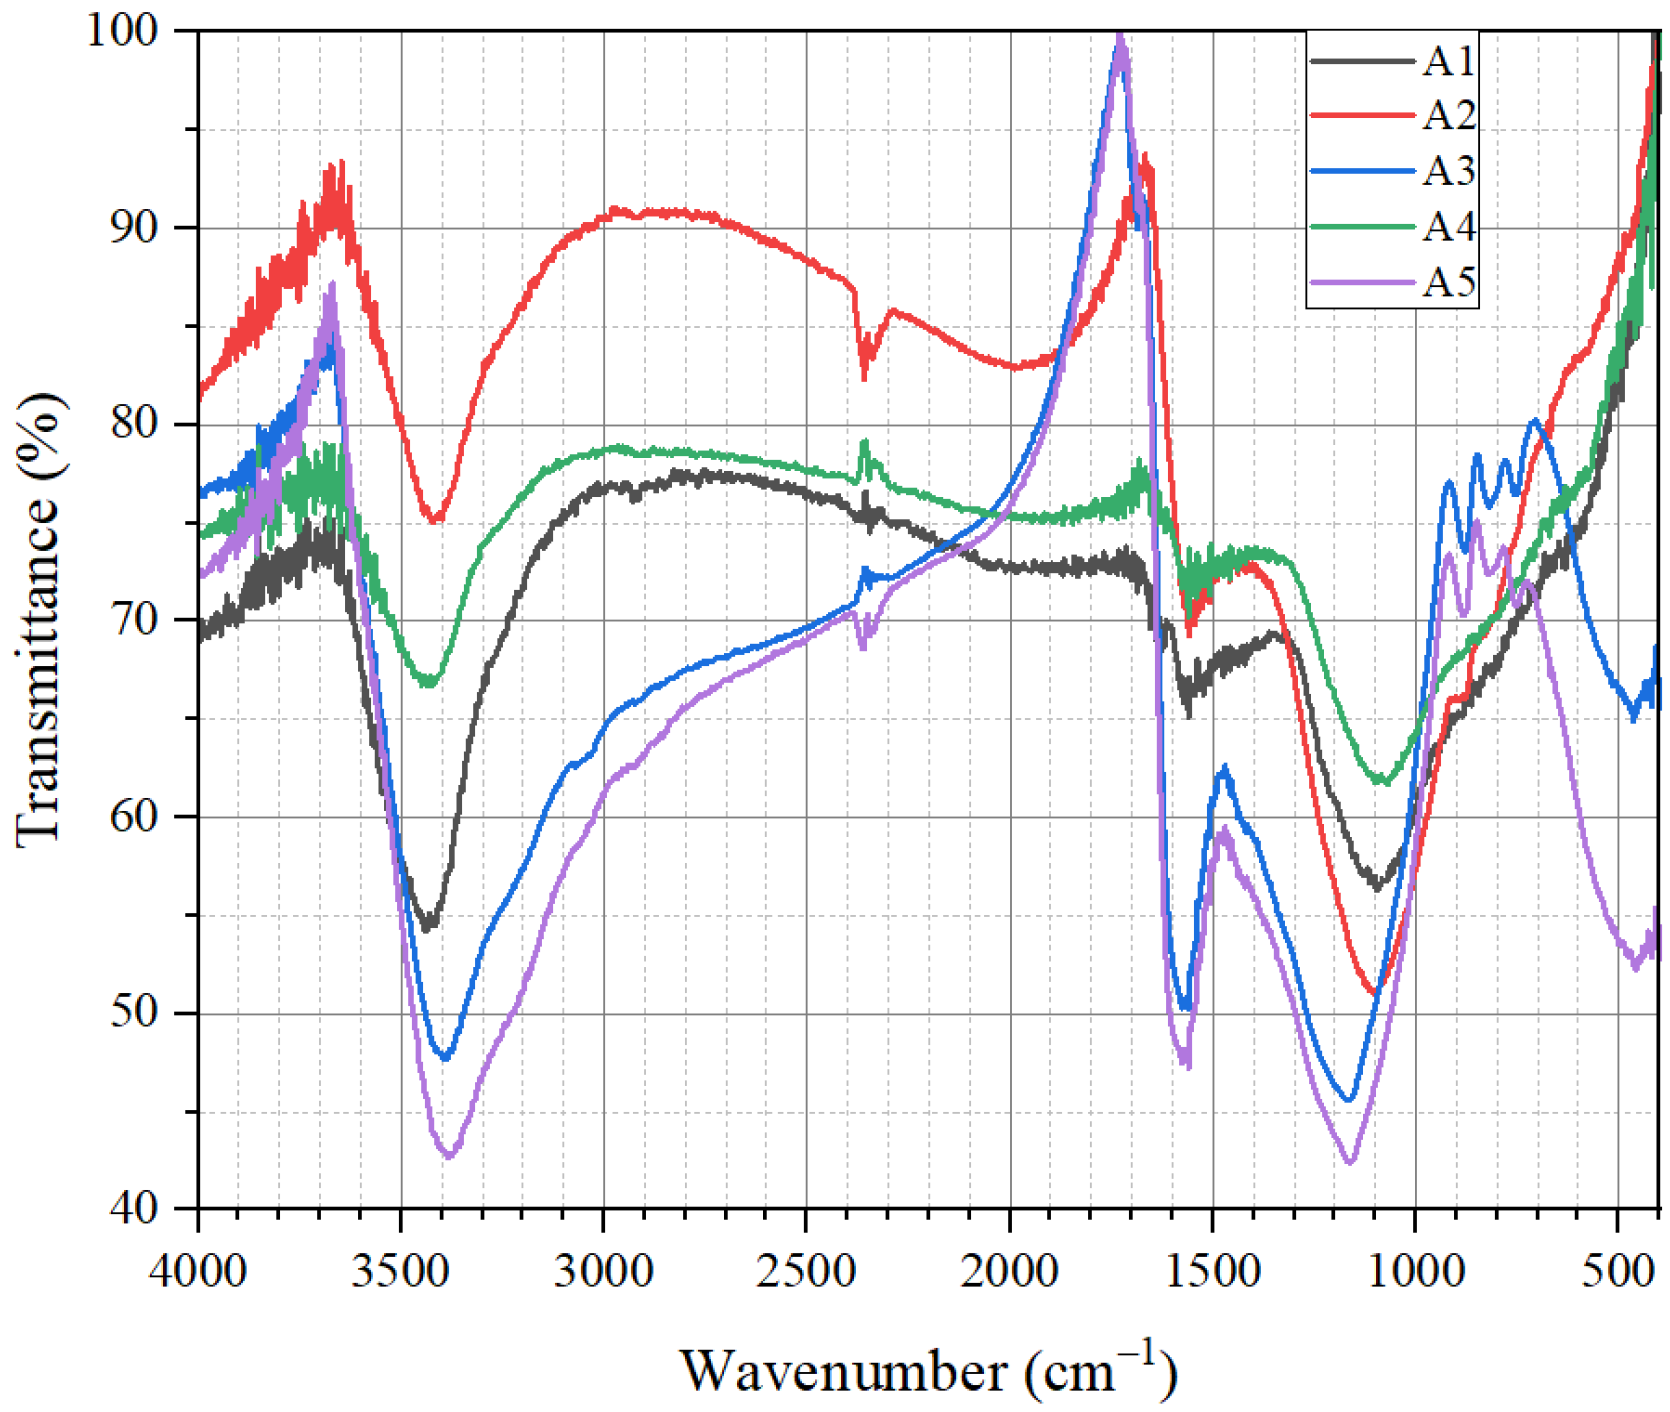
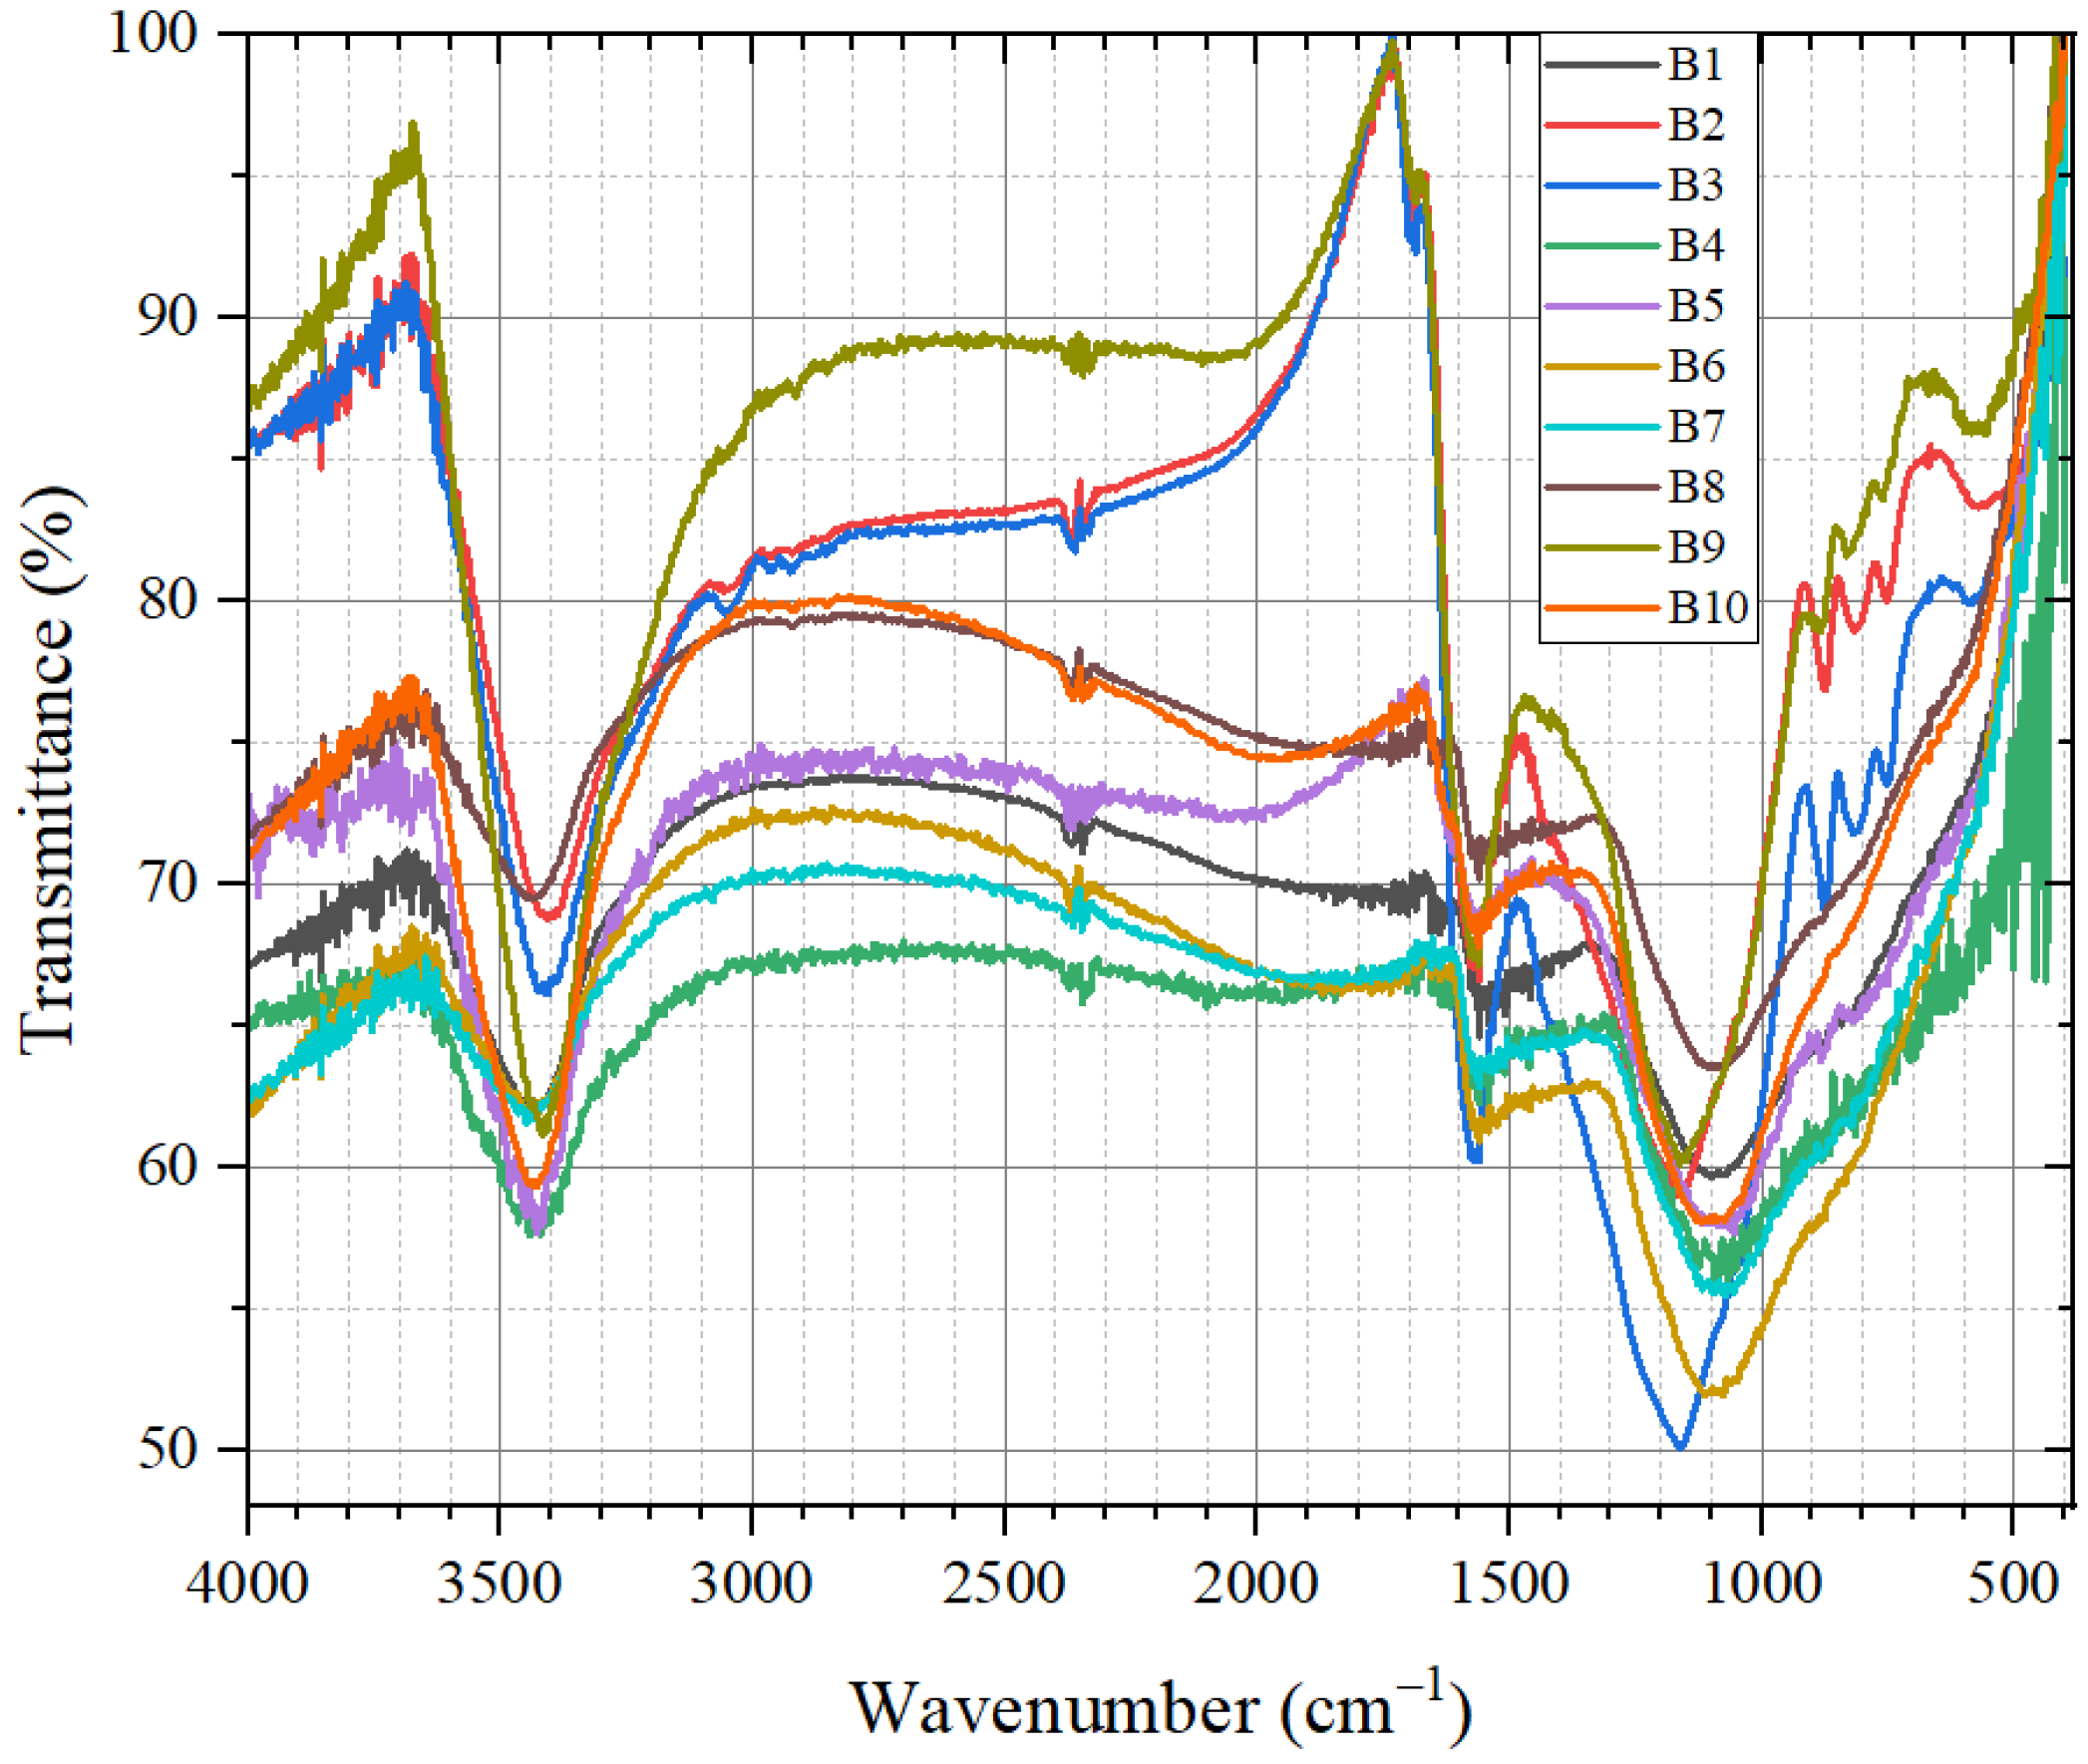
3.1.3. Results of Mid-Infrared Spectrum Characterization

The mid-infrared spectra of activated carbon batches A1–A5 are shown in Figure 6. The transmittance and corrected transmittance at the characteristic wavelengths selected in Section 2.3.2 are shown in Tables S1 and S2, respectively. It can be seen from Figure 6 that the absorption peak signals of activated carbon batches A3 and A5 were stronger, indicating a larger number of surface functional groups on activated carbon of these two batches. Furthermore, the absorption peak shapes of batches A3 and A5 of activated carbon were similar, which can explain the phenomenon of similar adsorption capacity of all components. A1 and A4 were the same.

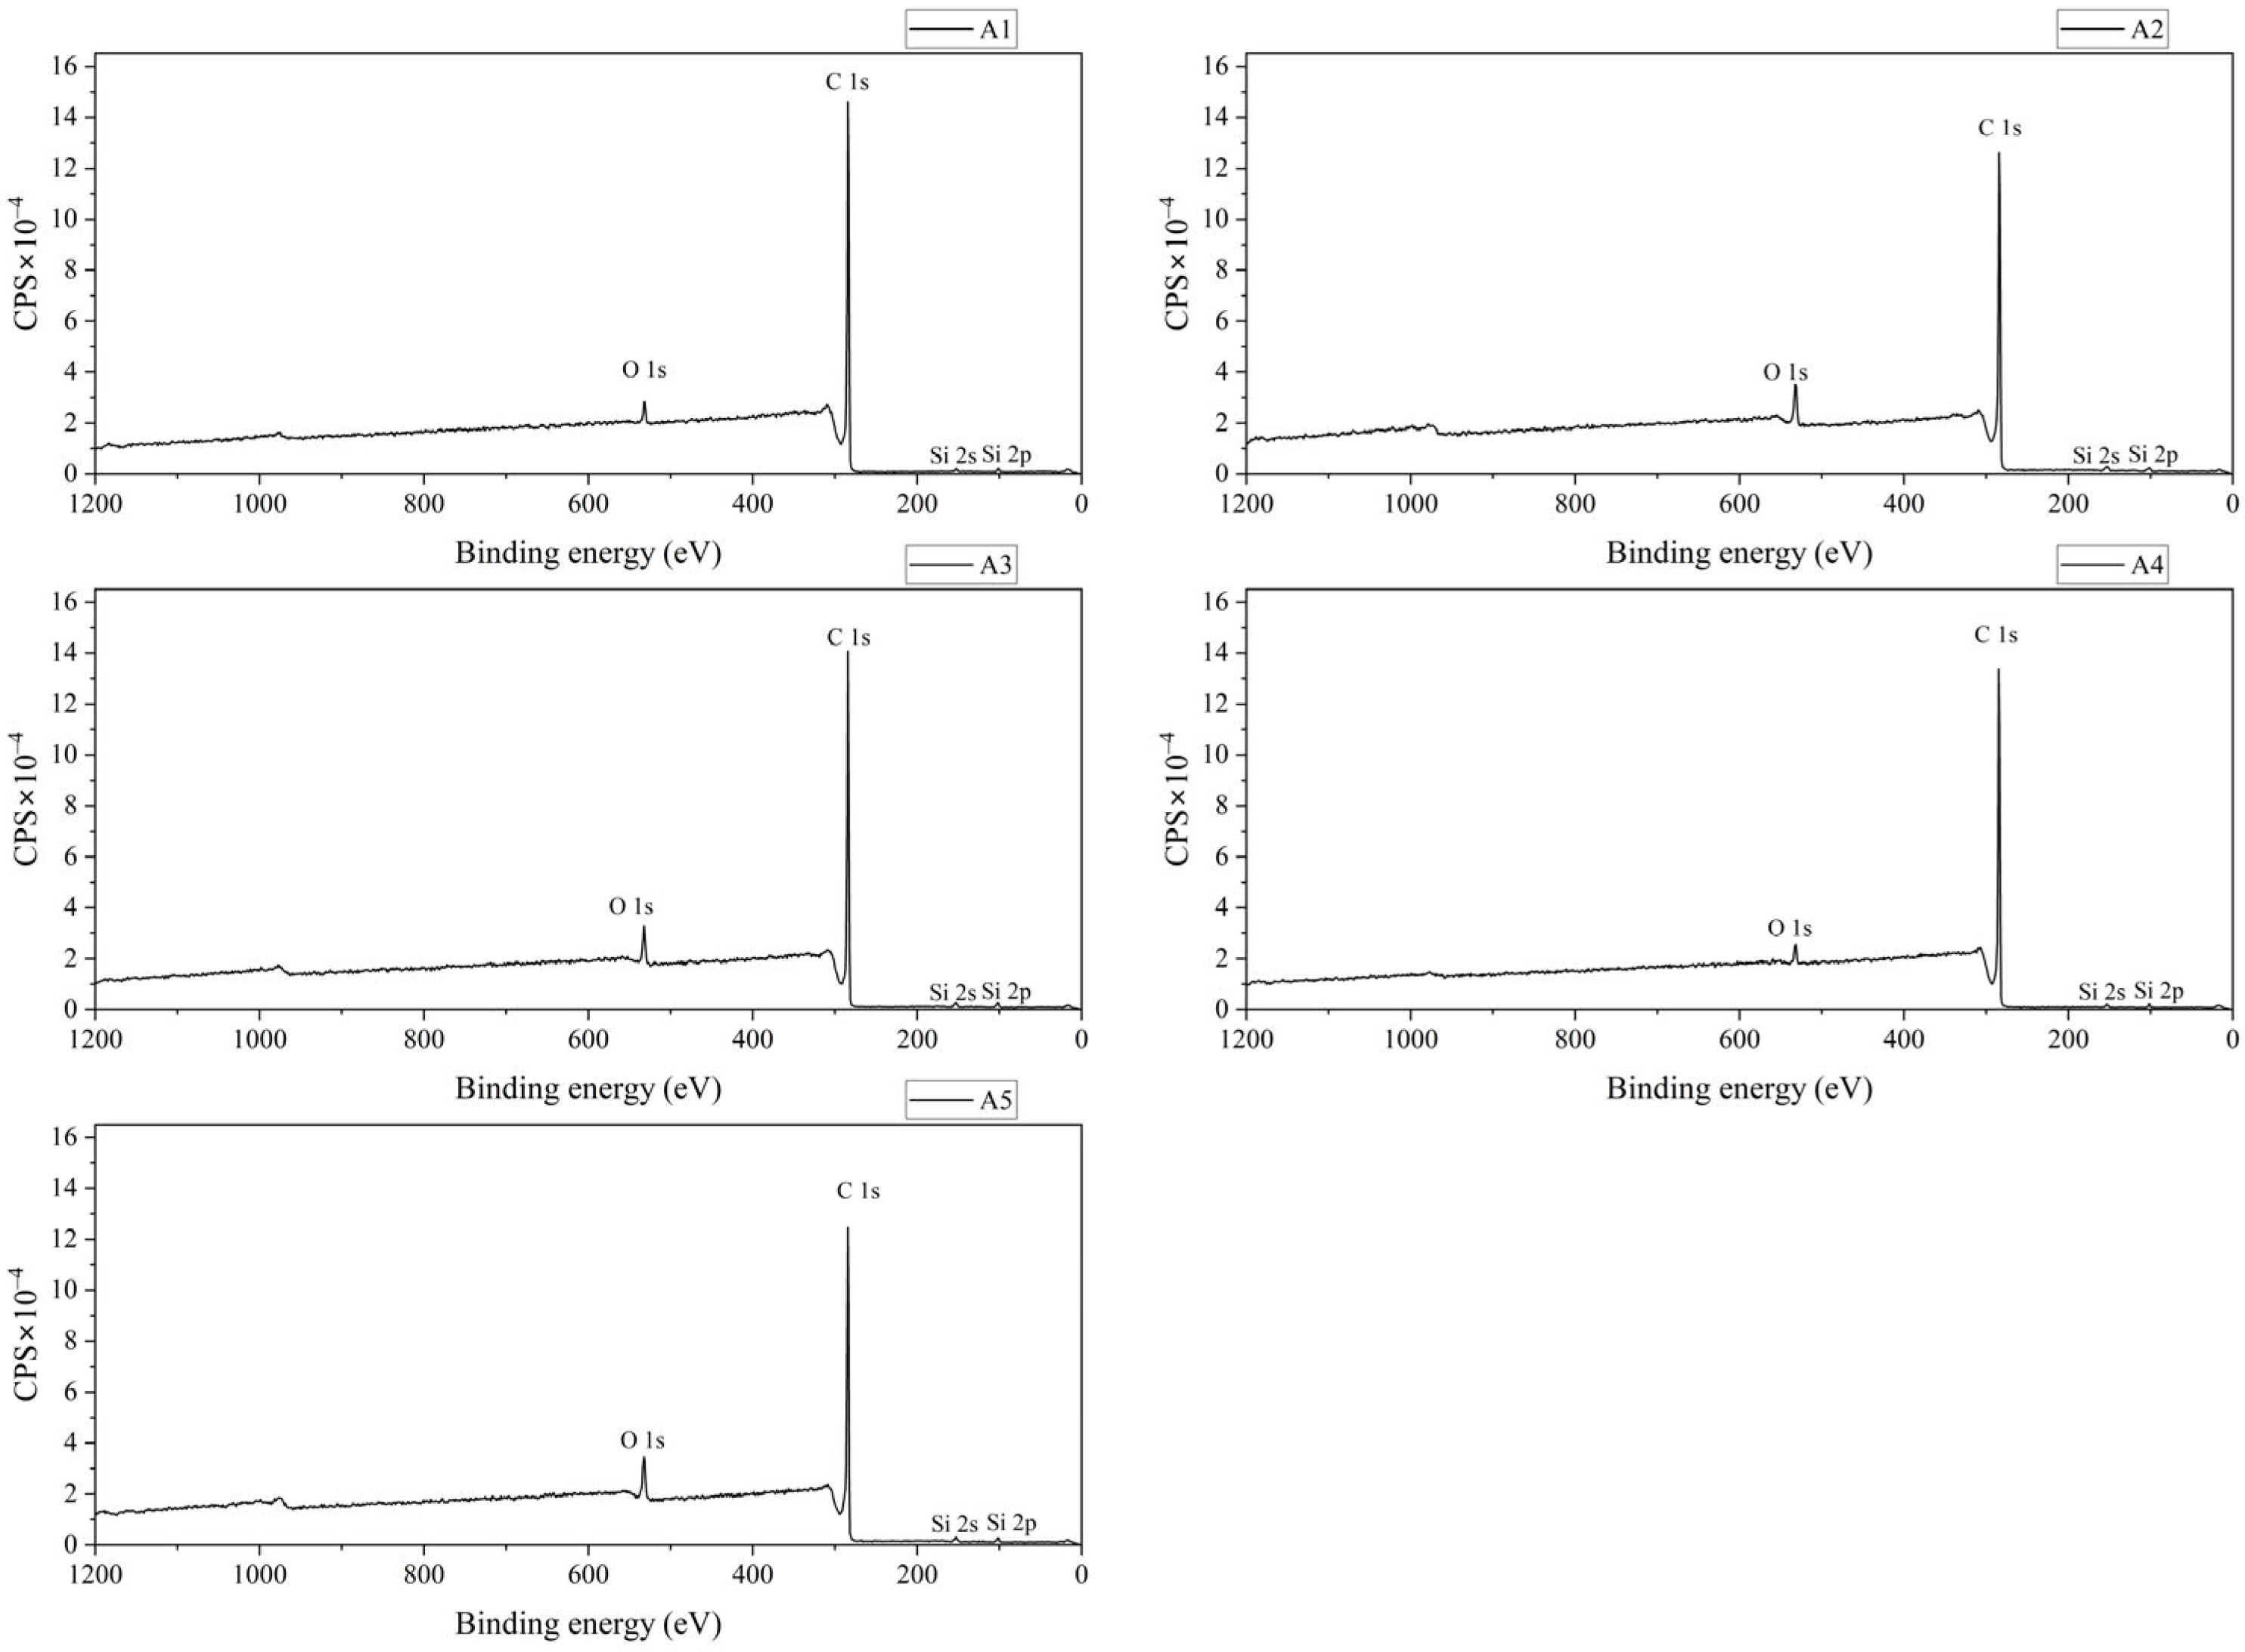
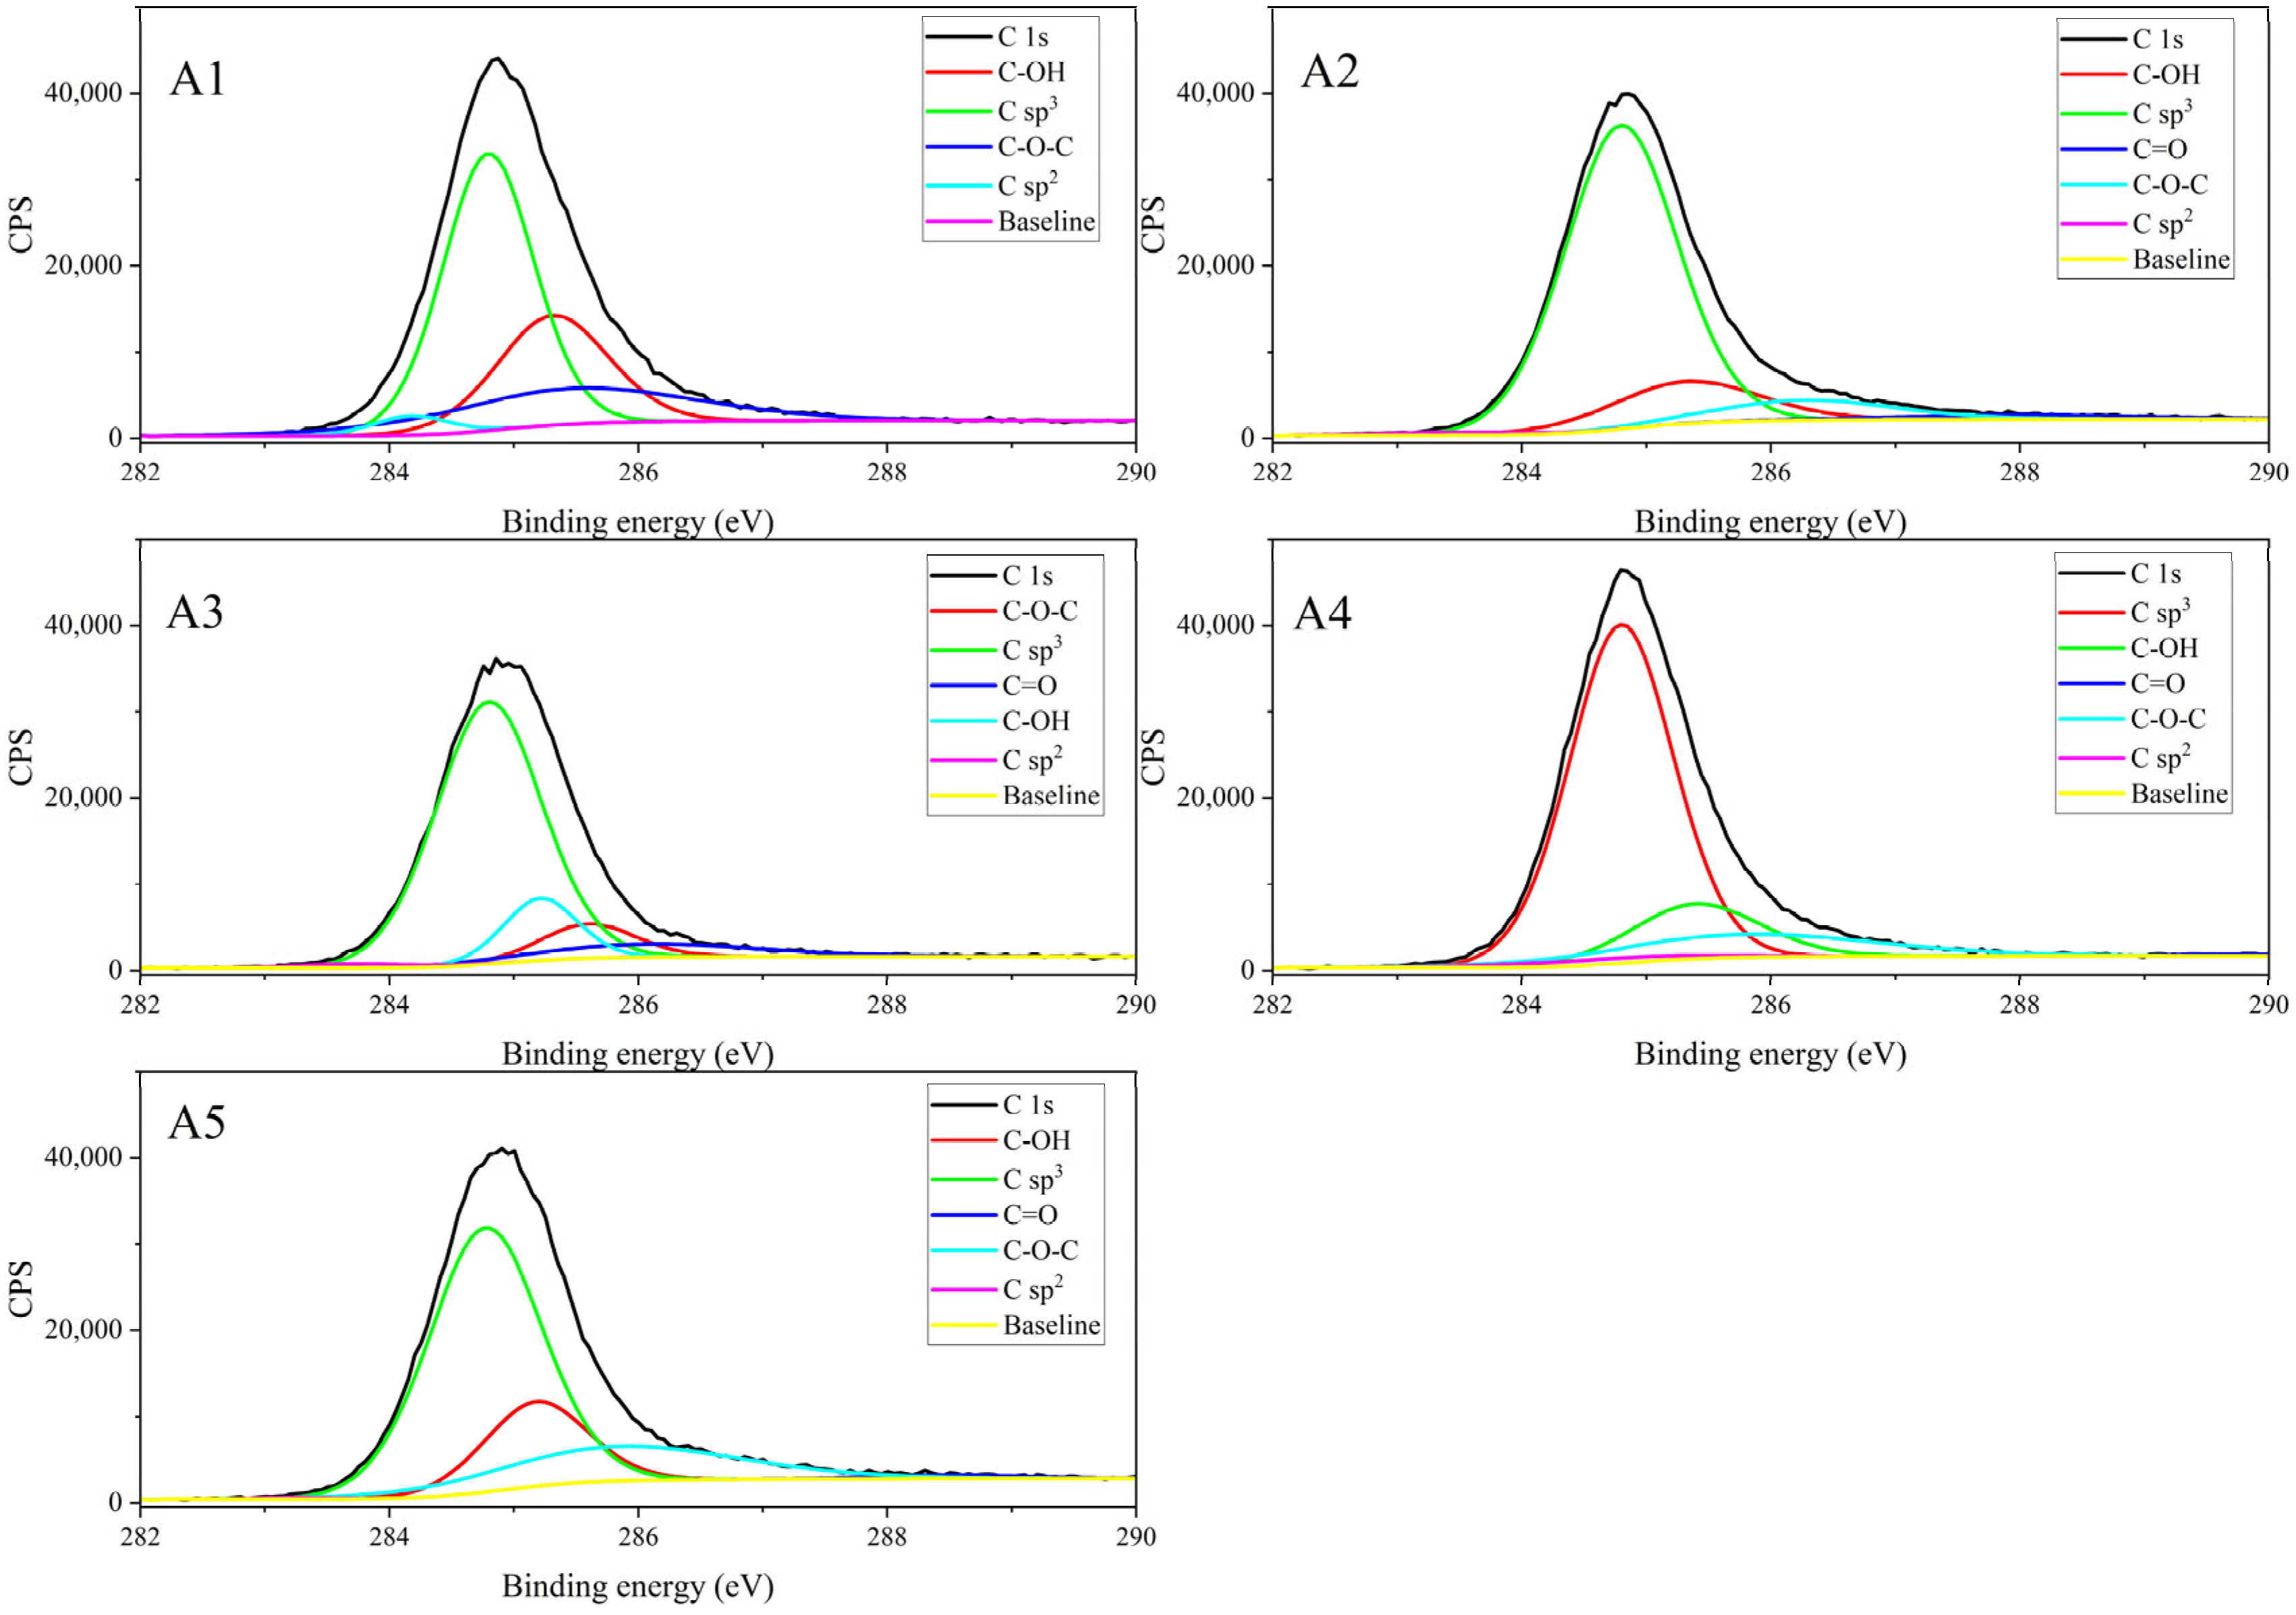
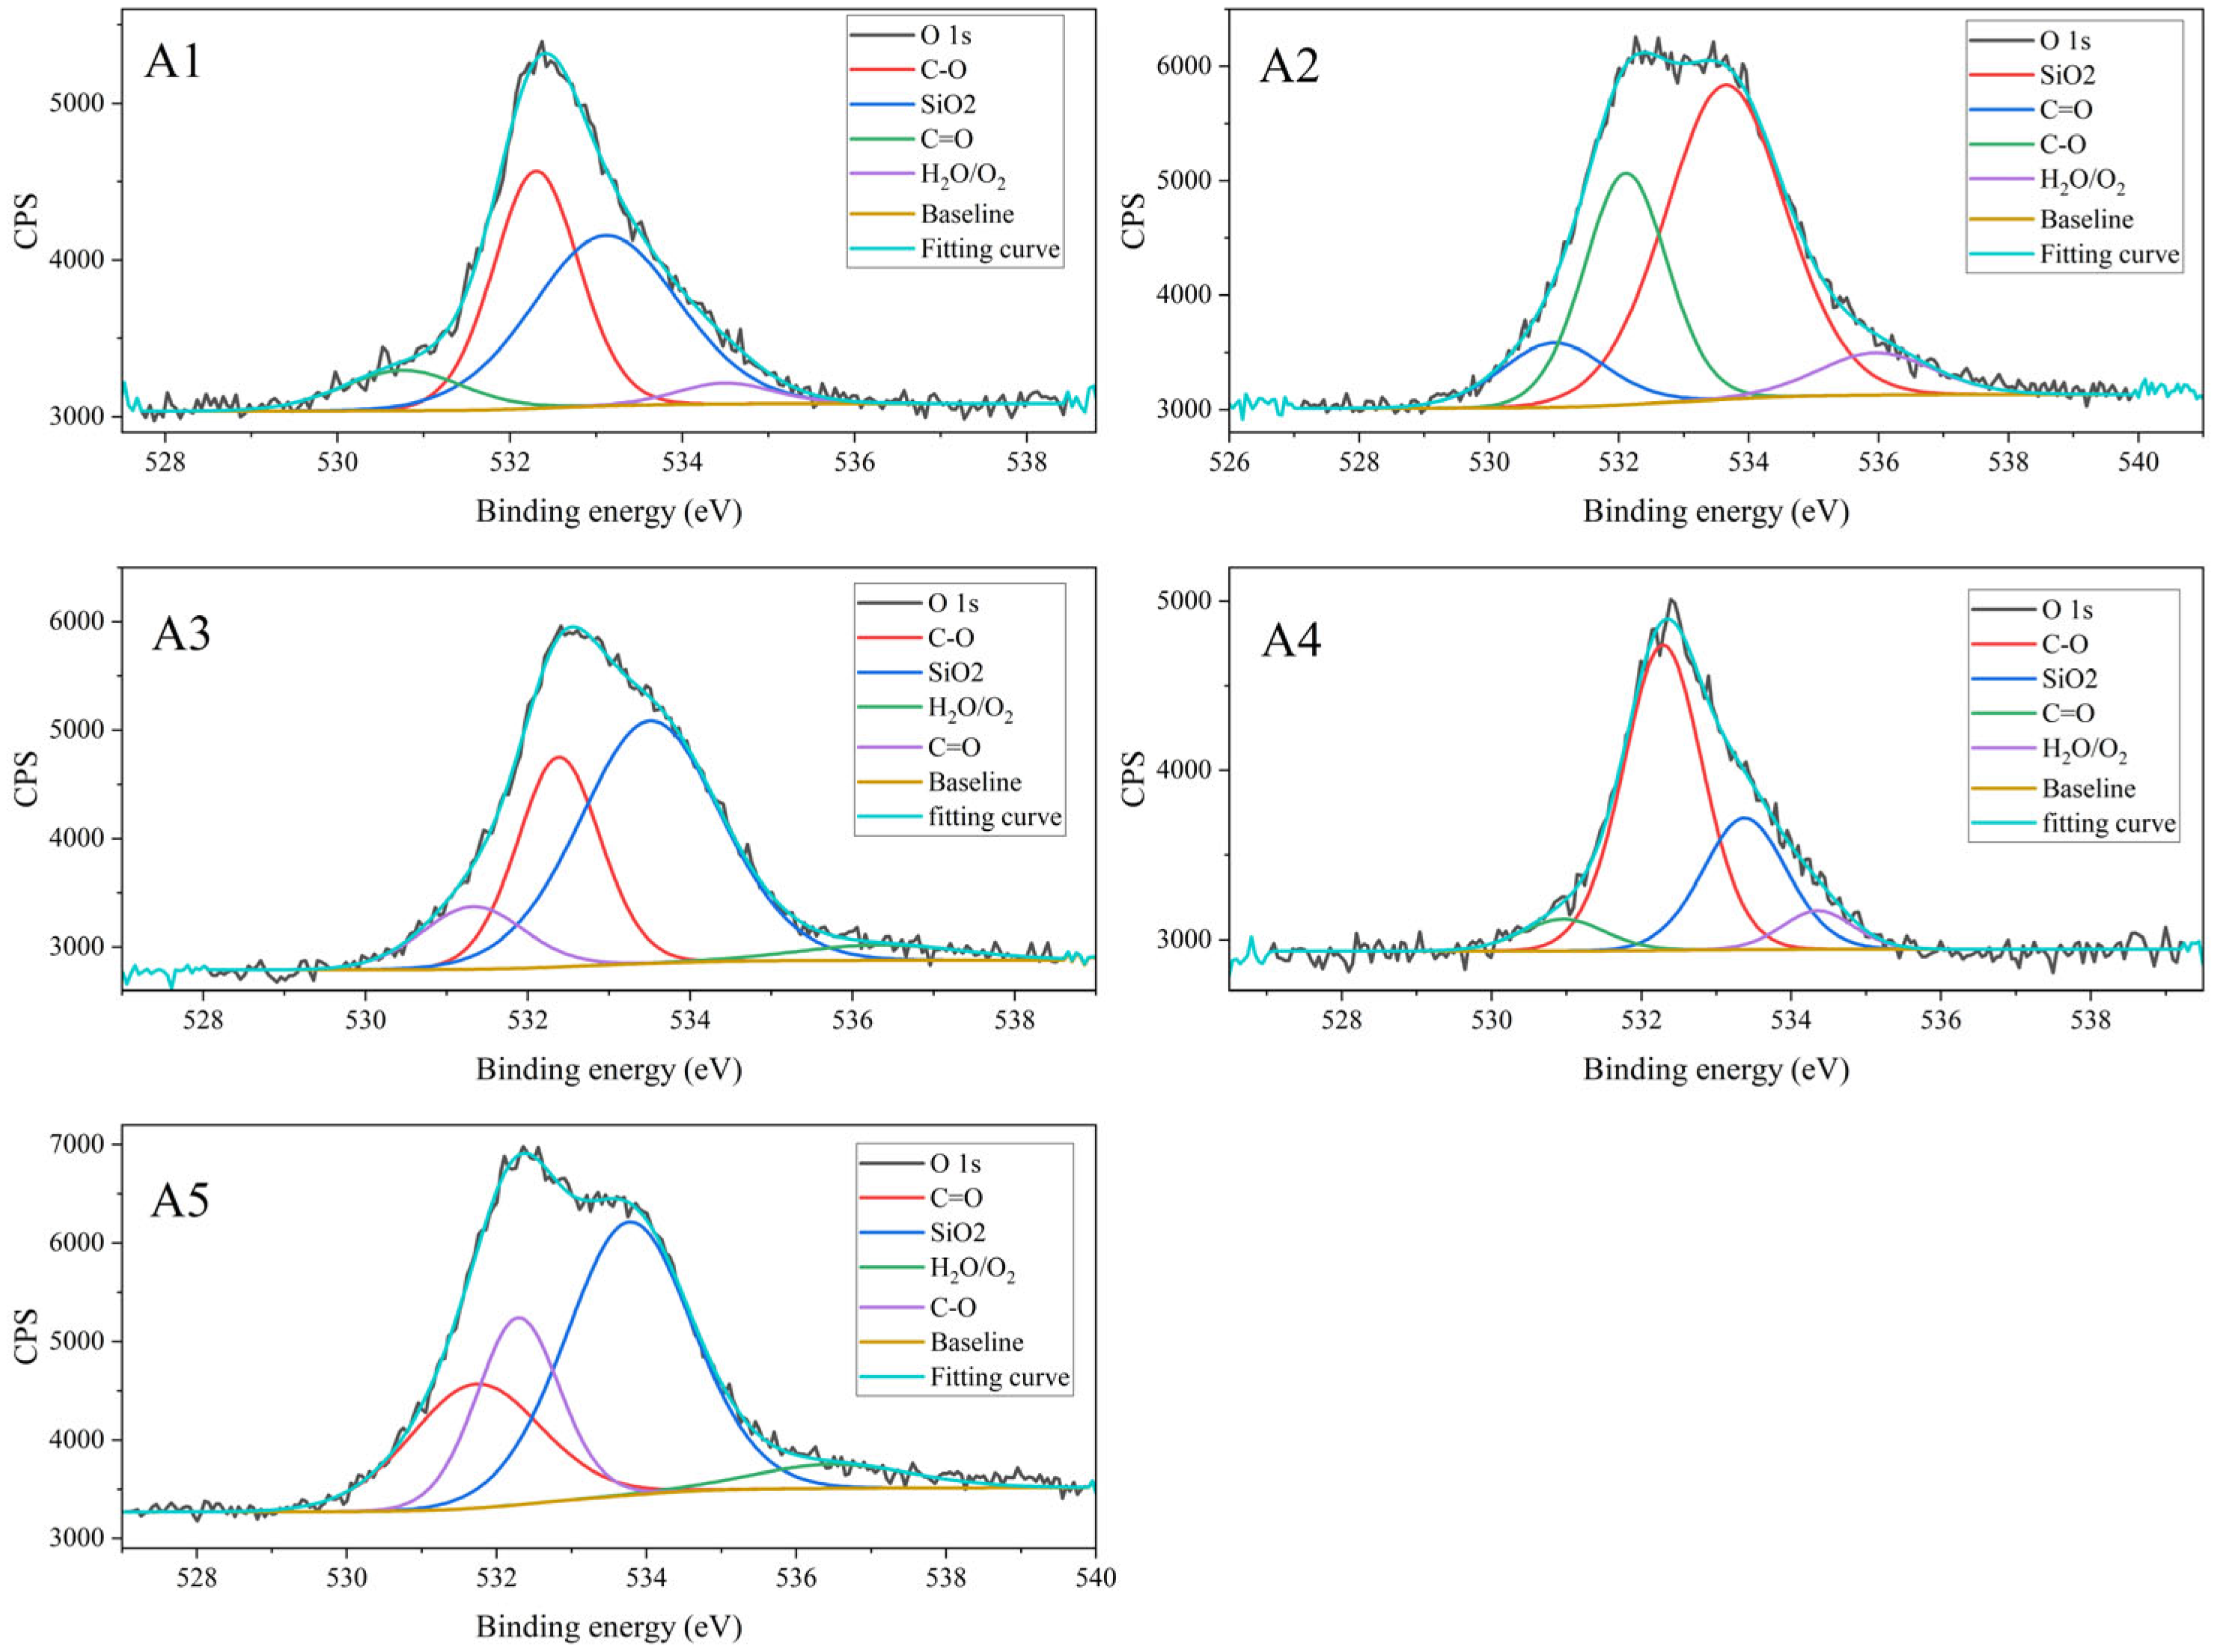
3.1.4. Results of XPS Characterization

The relative contents of each element on activated carbon (batches A1–A5) are shown in Table 4. The full XPS spectra of five batches of activated carbon are shown in Figure 7. According to the full spectra, the surface of the five batches contained only three elements, i.e., a large amount of carbon, a small amount of oxygen, and trace silicon, without nitrogen and sulfur elements. This result indicates that the surface of the activated carbon was mainly composed of functional groups containing carbon, oxygen, and silicon elements.
As confirmed by the mid-infrared spectra, the surface of activated carbon has C-OH, C=O, C-O-C, and C=C or cumulative double bonds. Meanwhile, A3 and A5 also had aromatic rings, whose conjugation effect caused the -OH band to shift to a lower wavenumber. Correspondingly, the C 1s peak was divided into four to five peaks by peak fitting, namely C=O, C-OH, C-O, C sp3, and C sp2/sp. The relative contents of each chemical state are shown in Table 5. The C 1s peak fitting results for the five batches of activated carbon are shown in Figure 8.
It can be observed that the A1 and A4 batches of activated carbon did not fit C=O or had very low fitting content, corresponding to the mid-infrared spectra (Figure 6). The peak near 1650 cm−1 was not as sharp as the other three batches, indicating that the main functional groups reflected in this peak of A1 and A4 batches of activated carbon are likely to have been other functional groups rather than C=O.
The O peak was divided into four peaks by peak fitting. According to the full spectra, the surface of activated carbon contained silicon, so the peak at 533–534 eV should have been the O peak of SiO2. There were also O peaks of water or oxygen and organic functional groups C-O or C=O. The relative contents of each chemical state are shown in Table 6. The O 1s peak fitting results of the five batches of activated carbon are shown in Figure 9.
The appearance of SiO2 may be due to the introduction of some sand and gravel during the production of activated carbon. The relative content of C=O groups in the surface of batches A3 and A5 was the highest, and the equilibrium adsorption amount of calycosin-7-glucoside in these two batches was also the highest, suggesting that the content of C=O groups may correlate well with the equilibrium adsorption amount of calycosin-7-glucoside.

3.1.5. Comparison of Characterization Methods

Based on the characteristics of activated carbon obtained by each characterization technique, stepwise regression was performed for multiple linear modeling of the contents of adenine, adenosine, calycosin-7-glucoside, and astragaloside IV. Characterization methods were compared according to the modeling results. Neither specific surface area, pore volume data, nor XPS data could establish statistically significant quantitative models for the equilibrium adsorption capacities of any indicator component. The specific surface area and pore volume are physical properties of activated carbon, and modeling failure indicates that physical adsorption has little effect on the adsorption capacity of all indicator components. Although XPS technology can characterize the relative content of different atomic chemical states on the surface of activated carbon, modeling failure indicates that the chemical information obtained by this characterization is still insufficient.
However, FTIR characterization features successfully established quantitative models with the equilibrium adsorption capacities of three indicator components, i.e., adenine, adenosine, and calycosin-7-glucoside, with R2 > 0.97, and the specific modeling results are shown in Table S3. Among the three characterization methods, the features obtained by FTIR characterization have a stronger correlation with the adsorption capacity of activated carbon. The FTIR characterization features contain abundant information about surface chemical groups of activated carbon, suggesting that the adsorption capacities of activated carbon for the four indicator components were largely affected by surface active groups. Since astragaloside IV failed to be modeled, more batches of activated carbon were added, and FTIR characterization was used to attempt to establish more accurate and generalized quantitative models.

3.2. Mid-Infrared Spectrum Modeling

Ten batches of activated carbon, B1–B10, were newly added, their equilibrium adsorption capacities (shown in Table 7) and mid-infrared spectra (shown in Figure 10) were measured, and modeling was performed together with batches A1–A5. The specific modeling results are shown in Table 8.
It can be seen from Table 8 that for the adsorption capacities of the four indicator components, good modeling results were obtained using mid-infrared spectra data. In these results, 1560 cm−1 represents the presence of C=O functional groups, 2325 cm−1 and 3050 cm−1 represent the presence of aromatic rings, and 3442 cm−1 represents the presence of -OH. The modeling results suggest that the above functional groups play an important role in adsorbing active components. According to the modeling results, the adsorption capacity of calycosin-7-glucoside has a significant positive correlation with the number of carbonyl groups on the surface of activated carbon, which is consistent with the results of the O spectrum peak fitting result. The adsorption capacity of adenosine has a significant positive correlation with the number of aromatic rings on the surface of activated carbon and a strong negative correlation with the number of carbonyl groups. The adsorption capacity of adenine has a significant negative correlation with the number of carbonyl groups. The adsorption capacity of astragaloside IV has a significant negative correlation with the number of aromatic rings and a positive correlation with the number of hydroxyl groups, respectively.

3.3. Modeling Validation

The mid-infrared spectra of activated carbons for validation are shown in Figure 11. The equilibrium adsorption capacities of validation batches C1–C3 were predicted based on the established statistical prediction model, and the model was evaluated according to the experimental values. The evaluation index used was relative error, and the results are shown in Table 9.
According to the validation results for these three batches of activated carbon, the predicted values of indicator components were close to the actual measured values, indicating that the statistical prediction model established based on the mid-infrared spectrum is reliable.

4. Discussion

4.1. Analysis of Adsorption Mechanism

The specific surface area and microporous volume of batch A5 were the highest among batches A1–A5, but the experimental data showed that its adenine adsorption capacity was lower than that of batches A1 and A4. According to the mid-infrared spectrum modeling results, the quantitative models of adsorption capacities of different components are all related to the transmittance or corrected transmittance at 1–2 wavelengths and can explain most of the data variation. Comprehensive consideration suggests that in the Shenqi Fuzheng system, the types and quantities of surface functional groups of activated carbon play a decisive role in adsorption, which indicates that different components exhibit selective binding to particular functional groups.

4.2. Methodological Value

The FTIR prediction model established in this work has relative errors ≤ 5% in most cases for adenine, calycosin-7-glucoside, adenosine, and astragaloside IV, indicating its high reliability. Compared with traditional nonspecific indicators such as iodine adsorption value and methylene blue adsorption value, FTIR can be used to realize the mapping of “structure–performance” through quantitative correlation of characteristic functional groups.
In practical applications, although this method has not yet achieved real-time detection due to the complexity of sample processing, it requires only measuring the transmittance at specific wavelengths to characterize activated carbon. Therefore, this method provides a low-cost way to rapidly screen activated carbon and obtain synchronous prediction of multiple component adsorption capacities, which can improve product quality and batch-to-batch consistency. It also has the potential to solve the problem of batch-to-batch differences in activated carbon during the production of TCM injections.

4.3. The Shortcomings

There are many ingredients in DSE, but only four substances were considered in this work. More active ingredients should be considered in the future. The number of activated carbon batches used in this work is still small, and more industrial data need to be collected in the future to update the model parameters. This work also failed to investigate the component differences in multiple batches of the Shenqi Fuzheng system, so this prediction method may only apply to the Shenqi Fuzheng system whose batch number is 230222. The model used in this work is a linear model that cannot simulate the nonlinear influence of activated carbon properties on adsorption capacity.

5. Conclusions

In this work, the properties of activated carbon were characterized by multi-techniques including nitrogen adsorption, XPS, and FTIR. It was found that the adsorption capacity of activated carbon for indicator components, i.e., adenine, adenosine, calycosin-7-glucoside, and astragaloside IV in the Shenqi Fuzheng system was mainly affected by surface functional groups. The results of specific surface area, pore properties, and XPS of activated carbon indicate poor correlation with the adsorption capacities of the four indicator components, indicating that physical adsorption had little effect on the adsorption capacity, and the information XPS provided was insufficient. The characteristic wavelengths of FTIR, especially 1560 cm−1, 2325 cm−1, 3050 cm−1, and 3442 cm−1, have the most statistically significant quantitative relationships with the adsorption capacities of the four components (R2 = 0.76–0.85). The established mid-infrared spectrum prediction model was in good agreement with the validation experiment results in most cases. The method of characterizing activated carbon properties by FTIR is expected to be further used to guide rapid screening of activated carbon. Furthermore, this method has strong potential for application in automated quality control during the production of TCM injections, supporting the improvement of product quality.

Supplementary Materials

The following supporting information can be downloaded at: https://www.mdpi.com/article/10.3390/chemosensors13080279/s1, Table S1: Transmittance (%) at characteristic wavenumbers (cm−1) of different batches of activated carbon; Table S2: Corrected transmittance (%) at characteristic wavenumbers (cm−1) of different batches of activated carbon; Table S3: Modeling results of FTIR characterization features.

Author Contributions

Z.T. and X.W., data curation and writing of the original draft; Z.T., B.C. and X.G. writing, review and editing; X.G., W.H. and X.L., supervision, review and editing; Z.T. and X.G., methodology and writing; Z.T., X.L. and X.W., data acquisition; X.G., X.L. and W.H., conceptualization, and supervision; X.L. and W.H., funding acquisition. All authors have read and agreed to the published version of the manuscript.

Funding

This work was supported by the National Key R&D Program of China (No. 2022YFC3501600).

Data Availability Statement

Data will be made available upon request.

Acknowledgments

Thanks to Zhou Wei for his contributions to this research.

Conflicts of Interest

Authors W.H. and X.L. were employed by Livzon Group Limin Pharmaceutical Factory. The remaining authors declare that the research was conducted in the absence of any commercial or financial relationships that could be construed as a potential conflict of interest.

Abbreviations

The following abbreviations are used in this manuscript:
TCMtraditional Chinese medicine
XPSX-ray photoelectron spectrum
FTIRFourier transform infrared
DSEDiluted Shenqi Extract
BETBrunauer–Emmett–Teller
BJHBarrett–Joyner–Halenda
RSDrelative standard deviation

References

  1. State Pharmacopoeia Commission. Pharmacopoeia of the People’s Republic of China; National Medical Products Administration: Beijing, China, 2025; Volume 4. [Google Scholar]
  2. Xu, F.; Tan, Q.; He, L.; Mao, Y.; He, J. Study on decolorization process of Compound Huanglian Injection. Chin. Tradit. Herb. Drugs 2013, 44, 2386–2390. [Google Scholar]
  3. Shao, L.J.; Sun, Y.; Liang, J.; Li, M.Q.; Li, X.L. Decolorization affects the structural characteristics and antioxidant activity of polysaccharides from Thesium chinense Turcz: Comparison of activated carbon and hydrogen peroxide decolorization. Int. J. Biol. Macromol. 2020, 155, 1084–1091. [Google Scholar] [CrossRef] [PubMed]
  4. Zhu, Q.; Xiao, W.; Sun, Y.; Xu, L.; Wang, W. Impurity removal technology of Qihong Maitong Injection mixing liquid. Chin. Tradit. Herb. Drugs 2013, 44, 696–700. [Google Scholar]
  5. Selenius, M.; Ruokolainen, J.; Riikonen, J.; Rantanen, J.; Nakki, S.; Lehto, V.P.; Hyttinen, M. Removing siloxanes and hydrogen sulfide from landfill gases with biochar and activated carbon filters. Waste Manag. 2023, 167, 31–38. [Google Scholar] [CrossRef]
  6. Lin, J.; Chen, X.; Ding, Y. Study on the capacity of adsorption of bacterial endotoxin in liquid by activated charcoal (for injection). Shanghai Med. Pharm. J. 2018, 39, 12–15. [Google Scholar] [CrossRef]
  7. Min, Z. Effect of Activated Carbon on the Bacterial Endotoxin Content of Dextran 40 API. Fine Chem. Intermed. 2024, 54, 25–28. [Google Scholar] [CrossRef]
  8. Li, C.Y.; Tang, S.W.; Xu, Y.Y.; Liu, F.M.; Li, M.M.; Zhi, X.L.; Ma, Y. Ultrasonic-assisted activated carbon separation removing bacterial endotoxin from salvia miltiorrhizae injection. Ultrason. Sonochem. 2024, 103, 106781. [Google Scholar] [CrossRef]
  9. Xing, X.; Li, Y.; Feng, Y.; Liu, X.; Lü, S. Discussion on the correlation between sensitization of traditional Chinese medicine injections and production technology. Inf. Tradit. Chin. Med. 2012, 29, 52–54. [Google Scholar] [CrossRef]
  10. Li, F.; Shi, D.; Xue, Y.; Li, X.; Zhang, H. Prevention and treatment of pyrogens in the production of traditional Chinese medicine injections. Mod. Chin. Med. 2006, 8, 31–32. [Google Scholar] [CrossRef]
  11. Liu, C. Discussion on the generation and treatment of pyrogens in the production of traditional Chinese medicine injections. Heilongjiang Med. J. 2011, 24, 568–570. [Google Scholar] [CrossRef]
  12. Luo, J.; Yang, W.; Zhang, X.; Zhu, X.; Chen, M. Potential risk analysis of application of activated charcoal in injection manufacture. Chin. J. New Drugs 2019, 28, 404–407. [Google Scholar] [CrossRef]
  13. Bläker, C.; Muthmann, J.; Pasel, C.; Bathen, D. Characterization of Activated Carbon Adsorbents—State of the Art and Novel Approaches. Chembioeng Rev. 2019, 6, 119–138. [Google Scholar] [CrossRef]
  14. GB/T 12496.12-1999; Test Method for Wood Activated Carbon—Determination of Phenol Adsorption Value. Institute of Chemical Industry of Forest Products: Nanjing, China, 1999.
  15. GB/T 12496.10-1999; Test Method for Wood Activated Carbon—Determination of Methylene Blue Adsorption Value. Institute of Chemical Industry of Forest Products: Nanjing, China, 1999.
  16. GB/T 12496.8-2015; Test Method for Wood Activated Carbon—Determination of Iodine Adsorption Value. Institute of Chemical Industry of Forest Products: Nanjing, China, 2015.
  17. Brunauer, S.; Emmett, P.H.; Teller, E. Adsorption of gases in multimolecular layers. J. Am. Chem. Soc. 1938, 60, 309–319. [Google Scholar] [CrossRef]
  18. Chiang, Y.-C.; Chiang, P.-C.; Huang, C.-P. Effects of pore structure and temperature on VOC adsorption on activated carbon. Carbon 2001, 39, 523–534. [Google Scholar] [CrossRef]
  19. Tzvetkov, G.; Mihaylova, S.; Stoitchkova, K.; Tzvetkov, P.; Spassov, T. Mechanochemical and chemical activation of lignocellulosic material to prepare powdered activated carbons for adsorption applications. Powder Technol. 2016, 299, 41–50. [Google Scholar] [CrossRef]
  20. Villacañas, F.; Pereira, M.F.R.; Órfão, J.J.; Figueiredo, J.L. Adsorption of simple aromatic compounds on activated carbons. J. Colloid Interface Sci. 2006, 293, 128–136. [Google Scholar] [CrossRef] [PubMed]
  21. Lei, M.; Tang, T.S.; Yu, W. Discussion on the Boehm titration method used in analysis of surface oxygen functional groups on activated carbon. Carbon Tech. 2011, 30, 17–19. [Google Scholar] [CrossRef]
  22. Iwanow, M.; Gärtner, T.; Sieber, V.; König, B. Activated carbon as catalyst support: Precursors, preparation, modification and characterization. Beilstein J. Org. Chem. 2020, 16, 1188–1202. [Google Scholar] [CrossRef]
  23. Liu, X.; Ou, Z.; Zhou, W.; Tang, Z.; Gong, X. The Effect of Activated Carbon Adsorption on Content of Four Indicative Constituents in Shenqi Fuzheng Diluent. Hans J. Med. Chem. 2024, 12, 3. [Google Scholar] [CrossRef]
  24. Xu, Z.; Huang, W.; Gong, X.; Ye, T.; Qu, H.; Song, Y.; Hu, D.; Wang, G. Design space approach to optimize first ethanol precipitation process of Dangshen. Cshina J. Chin. Mater. Medica 2015, 40, 4411–4416. [Google Scholar] [CrossRef]
  25. Sun, M.F.; Yang, J.Y.; Cao, W.; Shao, J.Y.; Wang, G.X.; Qu, H.B.; Huang, W.H.; Gong, X.C. Critical process parameter identification of manufacturing processes of Astragali Radix extract with a weighted determination coefficient method. Chin. Herb. Med. 2020, 12, 125–132. [Google Scholar] [CrossRef]
  26. Zhang, S.; Fan, C.; Wang, L.; Liu, X.; Sun, X.; Ye, W. Chemical constituents of Shenqi Fuzheng Injection. Chin. Tradit. Pat. Med. 2011, 33, 1743–1747. [Google Scholar] [CrossRef]
  27. Gu, H.; Zhang, S.; Huang, W.; Liu, X.; Wang, Y.; Fan, C.; Ye, W. Chemical constituents of Shenqi Fuzheng Injection (II). Chin. Tradit. Pat. Med. 2013, 35, 1494–1499. [Google Scholar] [CrossRef]
  28. Yuan, X.; Yuan, M.; Zhang, L.; Zhu, S. Effective composition purification in Shenqi Fuzheng Prescription by different technologies. Chin. Tradit. Pat. Med. 2010, 32, 1514–1518. [Google Scholar]
  29. Yan, B.; Ma, Y.; Bai, B.; Liu, D.; Zhou, Q. Identification of main ingredients of Shenqi Fuzheng Injection based on UPLC-Q-TOF-MS and its network pharmacology in treatment of triple negative breast cancer. Shanghai J. Tradit. Chin. Med. 2024, 58, 52–61. [Google Scholar] [CrossRef]
Figure 1. The structures of adenine (a), adenosine (b), calycosin-7-glucoside (c), and astragaloside IV (d).
Chemosensors 13 00279 g001
Figure 2. Chromatogram of adenine, adenosine and calycosin-7-glucoside.
Chemosensors 13 00279 g002
Figure 3. Chromatogram of astragaloside IV.
Chemosensors 13 00279 g003
Figure 4. Isothermal line of nitrogen adsorption/desorption of activated carbon.
Chemosensors 13 00279 g004
Figure 5. Variation of dV/dD with pore size in activated carbon BJH desorption.
Chemosensors 13 00279 g005
Figure 6. Mid-infrared spectra of batches A1–A5.
Chemosensors 13 00279 g006
Figure 7. Full spectra of batches A1–A5.
Chemosensors 13 00279 g007
Figure 8. Peak fitting results of carbon spectra for batches A1–A5.
Chemosensors 13 00279 g008
Figure 9. Oxygen spectra peak fitting results of batches A1–A5.
Chemosensors 13 00279 g009
Figure 10. Mid-infrared spectra of batches B1–B10.
Chemosensors 13 00279 g010
Figure 11. Mid-infrared spectra of batches C1–C3 of activated carbon.
Chemosensors 13 00279 g011
Table 1. Different batches of activated carbon.
Batch No.ManufacturersRaw Material
A1Nanping Yuanli Activated Carbon Co., Ltd. (Nanping, China) Sawdust of pine and Chinese fir
A2Shanghai Activated Carbon Plant Co., Ltd. (Shanghai, China)Pine, Chinese fir
A3Shanghai Activated Carbon Plant Co., Ltd. (Shanghai, China)Pine, Chinese fir
A4Shanghai Xingchang Activated Carbon Co., Ltd. (Shanghai, China)Pine, Chinese fir, some miscellaneous woods
A5Shanghai Activated Carbon Plant Co., Ltd. (Shanghai, China)Pine, Chinese fir
B1Shanghai Activated Carbon Plant Co., Ltd. (Shanghai, China)Pine, Chinese fir
B2Shanghai Activated Carbon Plant Co., Ltd. (Shanghai, China)Pine, Chinese fir
B3Shanghai Activated Carbon Plant Co., Ltd. (Shanghai, China)Pine, Chinese fir
B4Nanping Yuanli Activated Carbon Co., Ltd. (Nanping, China)Sawdust of pine and Chinese fir
B5Nanping Yuanli Activated Carbon Co., Ltd. (Nanping, China)Sawdust of pine and Chinese fir
B6Nanping Yuanli Activated Carbon Co., Ltd. (Nanping, China)Sawdust of pine and Chinese fir
B7Nanping Yuanli Activated Carbon Co., Ltd. (Nanping, China)Sawdust of pine and Chinese fir
B8Nanping Yuanli Activated Carbon Co., Ltd. (Nanping, China)Sawdust of pine and Chinese fir
B9Shanghai Xingchang Activated Carbon Co., Ltd. (Shanghai, China)Pine, Chinese fir, some miscellaneous woods
B10Shanghai Xingchang Activated Carbon Co., Ltd. (Shanghai, China)Pine, Chinese fir, some miscellaneous woods
C1Shanghai Activated Carbon Plant Co., Ltd. (Shanghai, China)Pine, Chinese fir
C2Nanping Yuanli Activated Carbon Co., Ltd. (Nanping, China)Sawdust of pine and Chinese fir
C3Shanghai Xingchang Activated Carbon Co., Ltd. (Shanghai, China)Pine, Chinese fir, some miscellaneous woods
Table 2. Experimental results of equilibrium adsorption capacity (mg/g) of batches A1–A5.
IngredientA1A2A3A4A5AverageStandard DeviationRSD (%)ANOVA p-Value
Calycosin-7-glucoside31.6038.7865.1042.9557.6347.2112.3426.14<0.01
Adenine17.8517.079.28016.6311.0514.383.50524.38<0.01
Adenosine18.2324.8728.6419.9730.8524.514.84719.78<0.01
Astragaloside IV161.898.14122.7179.9137.3140.028.7320.53<0.01
Table 3. Specific surface area and pore volume parameters of activated carbon.
Parameter A1A2A3A4A5AverageStandard Deviation RSD (%)
SBET
(m2/g)
1280971.01278916.016681223269.222.01
Total pore volume
(cm3/g)
1.6130.96381.0580.95371.5891.2360.300724.34
Micropore porosity
(cm3/g)
0.19320.17380.21420.19210.25910.20650.0292614.17
Mesopore volume
(cm3/g)
1.2790.73830.69140.72561.2130.92940.259627.94
Table 4. Relative content of each component of batches A1–A5.
ComponentAtomic Relative Content (%)AverageStandard DeviationRSD (%)
A1A2A3A4A5
O 1s2.425.85.092.326.154.361.6638.05
C 1s96.7692.7193.5196.8192.5394.461.922.04
Si 2p0.821.491.40.861.311.180.2823.85
Table 5. Relative content of different chemical states of carbon peaks.
ComponentRelative Content (%)AverageStandard DeviationRSD (%)
A1A2A3A4A5
C sp2/sp3.0660.78291.2891.9860.22431.470.9967.15
C sp352.775.3371.0371.1162.7766.598.0512.09
C-OH25.4613.6911.8114.2218.3216.704.8729.15
C-O-C18.787.988.36412.3617.6913.034.5334.74
C=O02.2137.510.32451.0022.212.76124.7
Table 6. Relative contents of each chemical state of oxygen peak in batches A1-5.
ComponentRelative Content (%)AverageStandard DeviationRSD (%)
A1A2A3A4A5
C-O38.9328.0328.859.5422.1235.4813.1937.16
C=O9.2429.82110.646.48723.2111.885.8349.11
SiO247.9854.9956.3427.2549.2447.1610.4622.18
H2O/O23.8537.1624.2576.7235.4385.491.3123.79
Table 7. Experimental results of equilibrium adsorption capacity (mg/g) of activated carbon B1–B10.
ParameterCalycosin-7-glucosideAdenineAdenosineAstragaloside IV
B119.8520.8915.8619.28
B264.1917.3934.3428.35
B372.7914.6735.8951.00
B431.6016.1028.1748.78
B547.4316.5634.34132.8
B624.9214.8312.1835.11
B723.5515.3220.7366.28
B828.0721.7923.2866.61
B967.1820.0030.41182.3
B1035.7519.7822.56161.4
Average41.5317.7325.7879.20
Standard deviation18.92.527.7655.2
RSD (%)45.514.230.169.7
Table 8. Modeling results of different components.
ItemsCalycosin-7-glucosideAdenineAdenosineAstragaloside IV
Partial Regression Coefficientp ValuePartial Regression Coefficientp ValuePartial Regression Coefficientp ValuePartial Regression Coefficientp Value
Constant26.15/−11.91/0.86/−41.52/
1560//0.45<0.00010.470.0081//
1560 +−1.66<0.0001//////
2325 +////−2.02<0.0001//
3050 +//////8.720.0008
3442 +//////−10.04<0.0001
R20.85120.76000.85480.7677
+ Represents the corrected transmittance at the wavenumber.
Table 9. Validation results of equilibrium adsorption capacity prediction.
IngredientMetricsC1C2C3
Calycosin-7-glucosidePredicted value (mg/g)61.9029.7330.04
Experimental values (mg/g)62.6530.1131.00
Relative error (%)1.191.283.09
AdeninePredicted value (mg/g)20.0716.9020.46
Experimental values (mg/g)22.1016.5620.17
Relative error (%)9.172.051.43
AdenosinePredicted value (mg/g)31.2017.6324.90
Experimental values (mg/g)31.6317.2025.25
Relative error (%)1.342.481.41
Astragaloside IVPredicted value (mg/g)88.63157.1169.4
Experimental values (mg/g)90.40163.7177.1
Relative error (%)1.964.024.35
Disclaimer/Publisher’s Note: The statements, opinions and data contained in all publications are solely those of the individual author(s) and contributor(s) and not of MDPI and/or the editor(s). MDPI and/or the editor(s) disclaim responsibility for any injury to people or property resulting from any ideas, methods, instructions or products referred to in the content.

