A Systematic Review of the Use of Electronic Nose and Tongue Technologies for Detecting Food Contaminants


 ,
, 

Abstract
1. Introduction
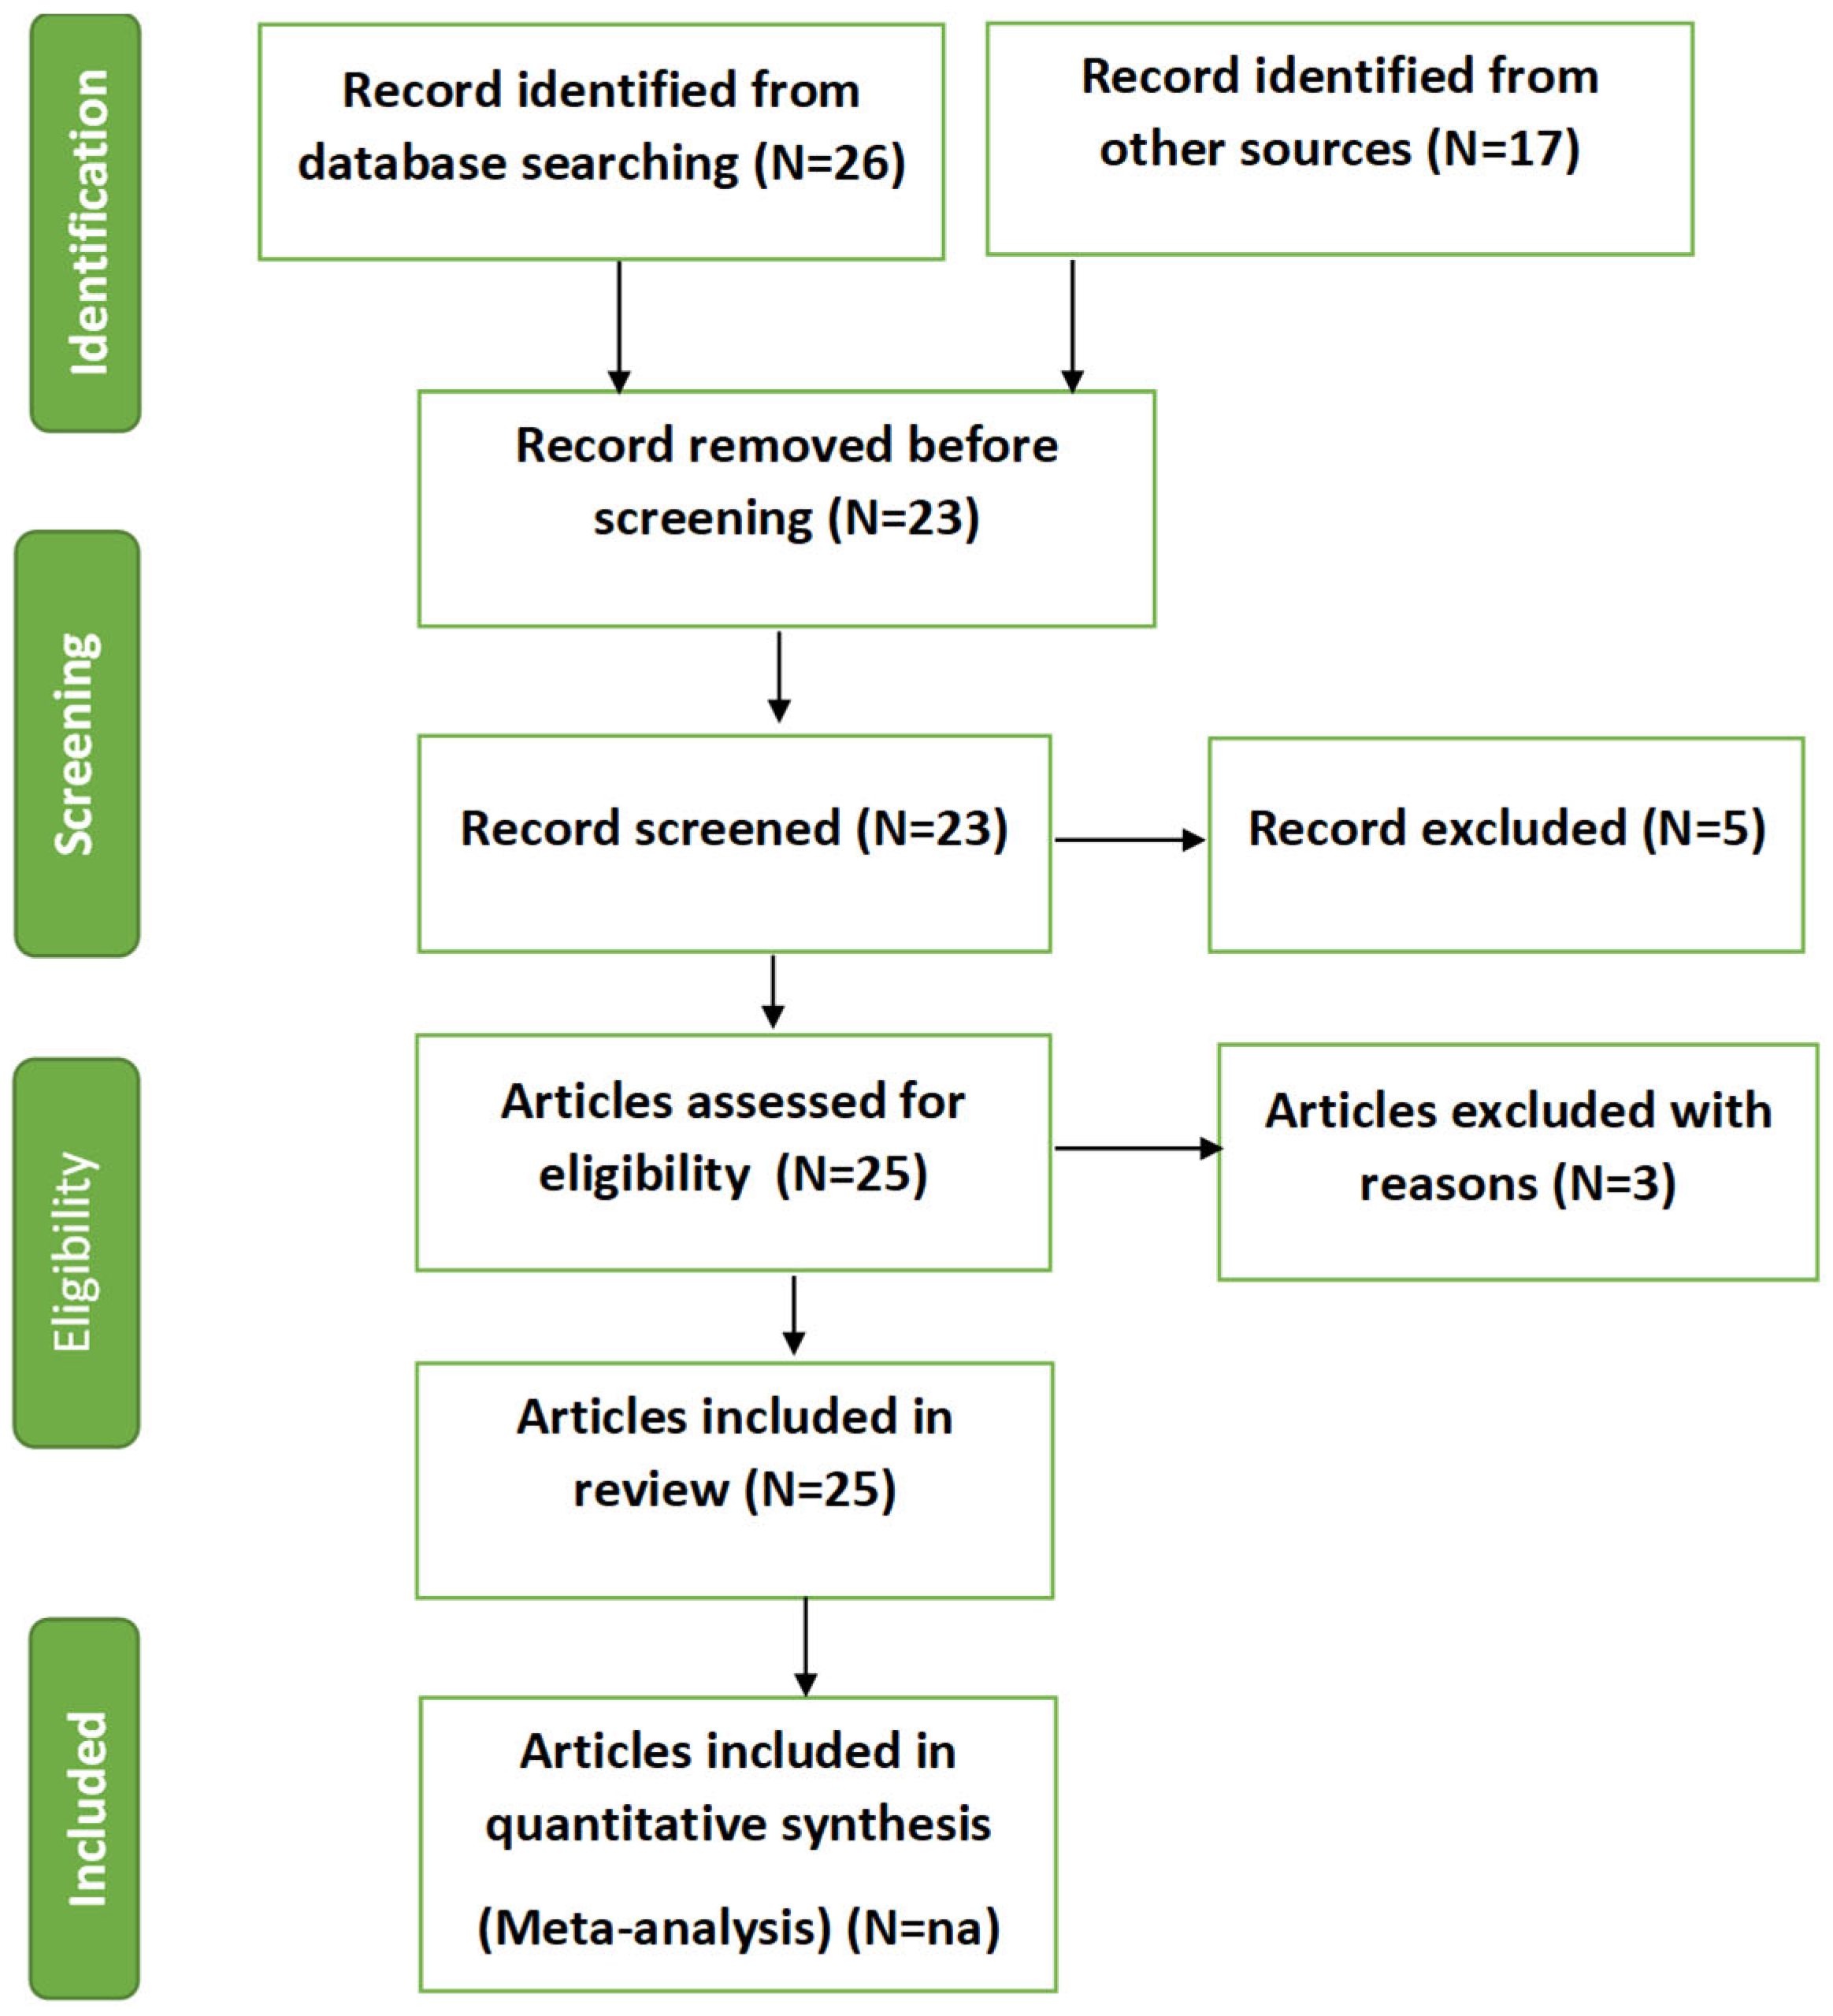
2. Research Method
2.1. Databases and Keywords
2.2. Inclusion and Exclusion Criteria
- Articles published in English language only;
- Peer-reviewed articles;
- Studies which focused on the e-nose and e-tongue or a combination of both for food contaminant monitoring.
- Articles published in languages other than English;
- Studies devoid of experimental data;
- Articles not available in full text.
2.3. The Following Food Safety Contests Were Discussed
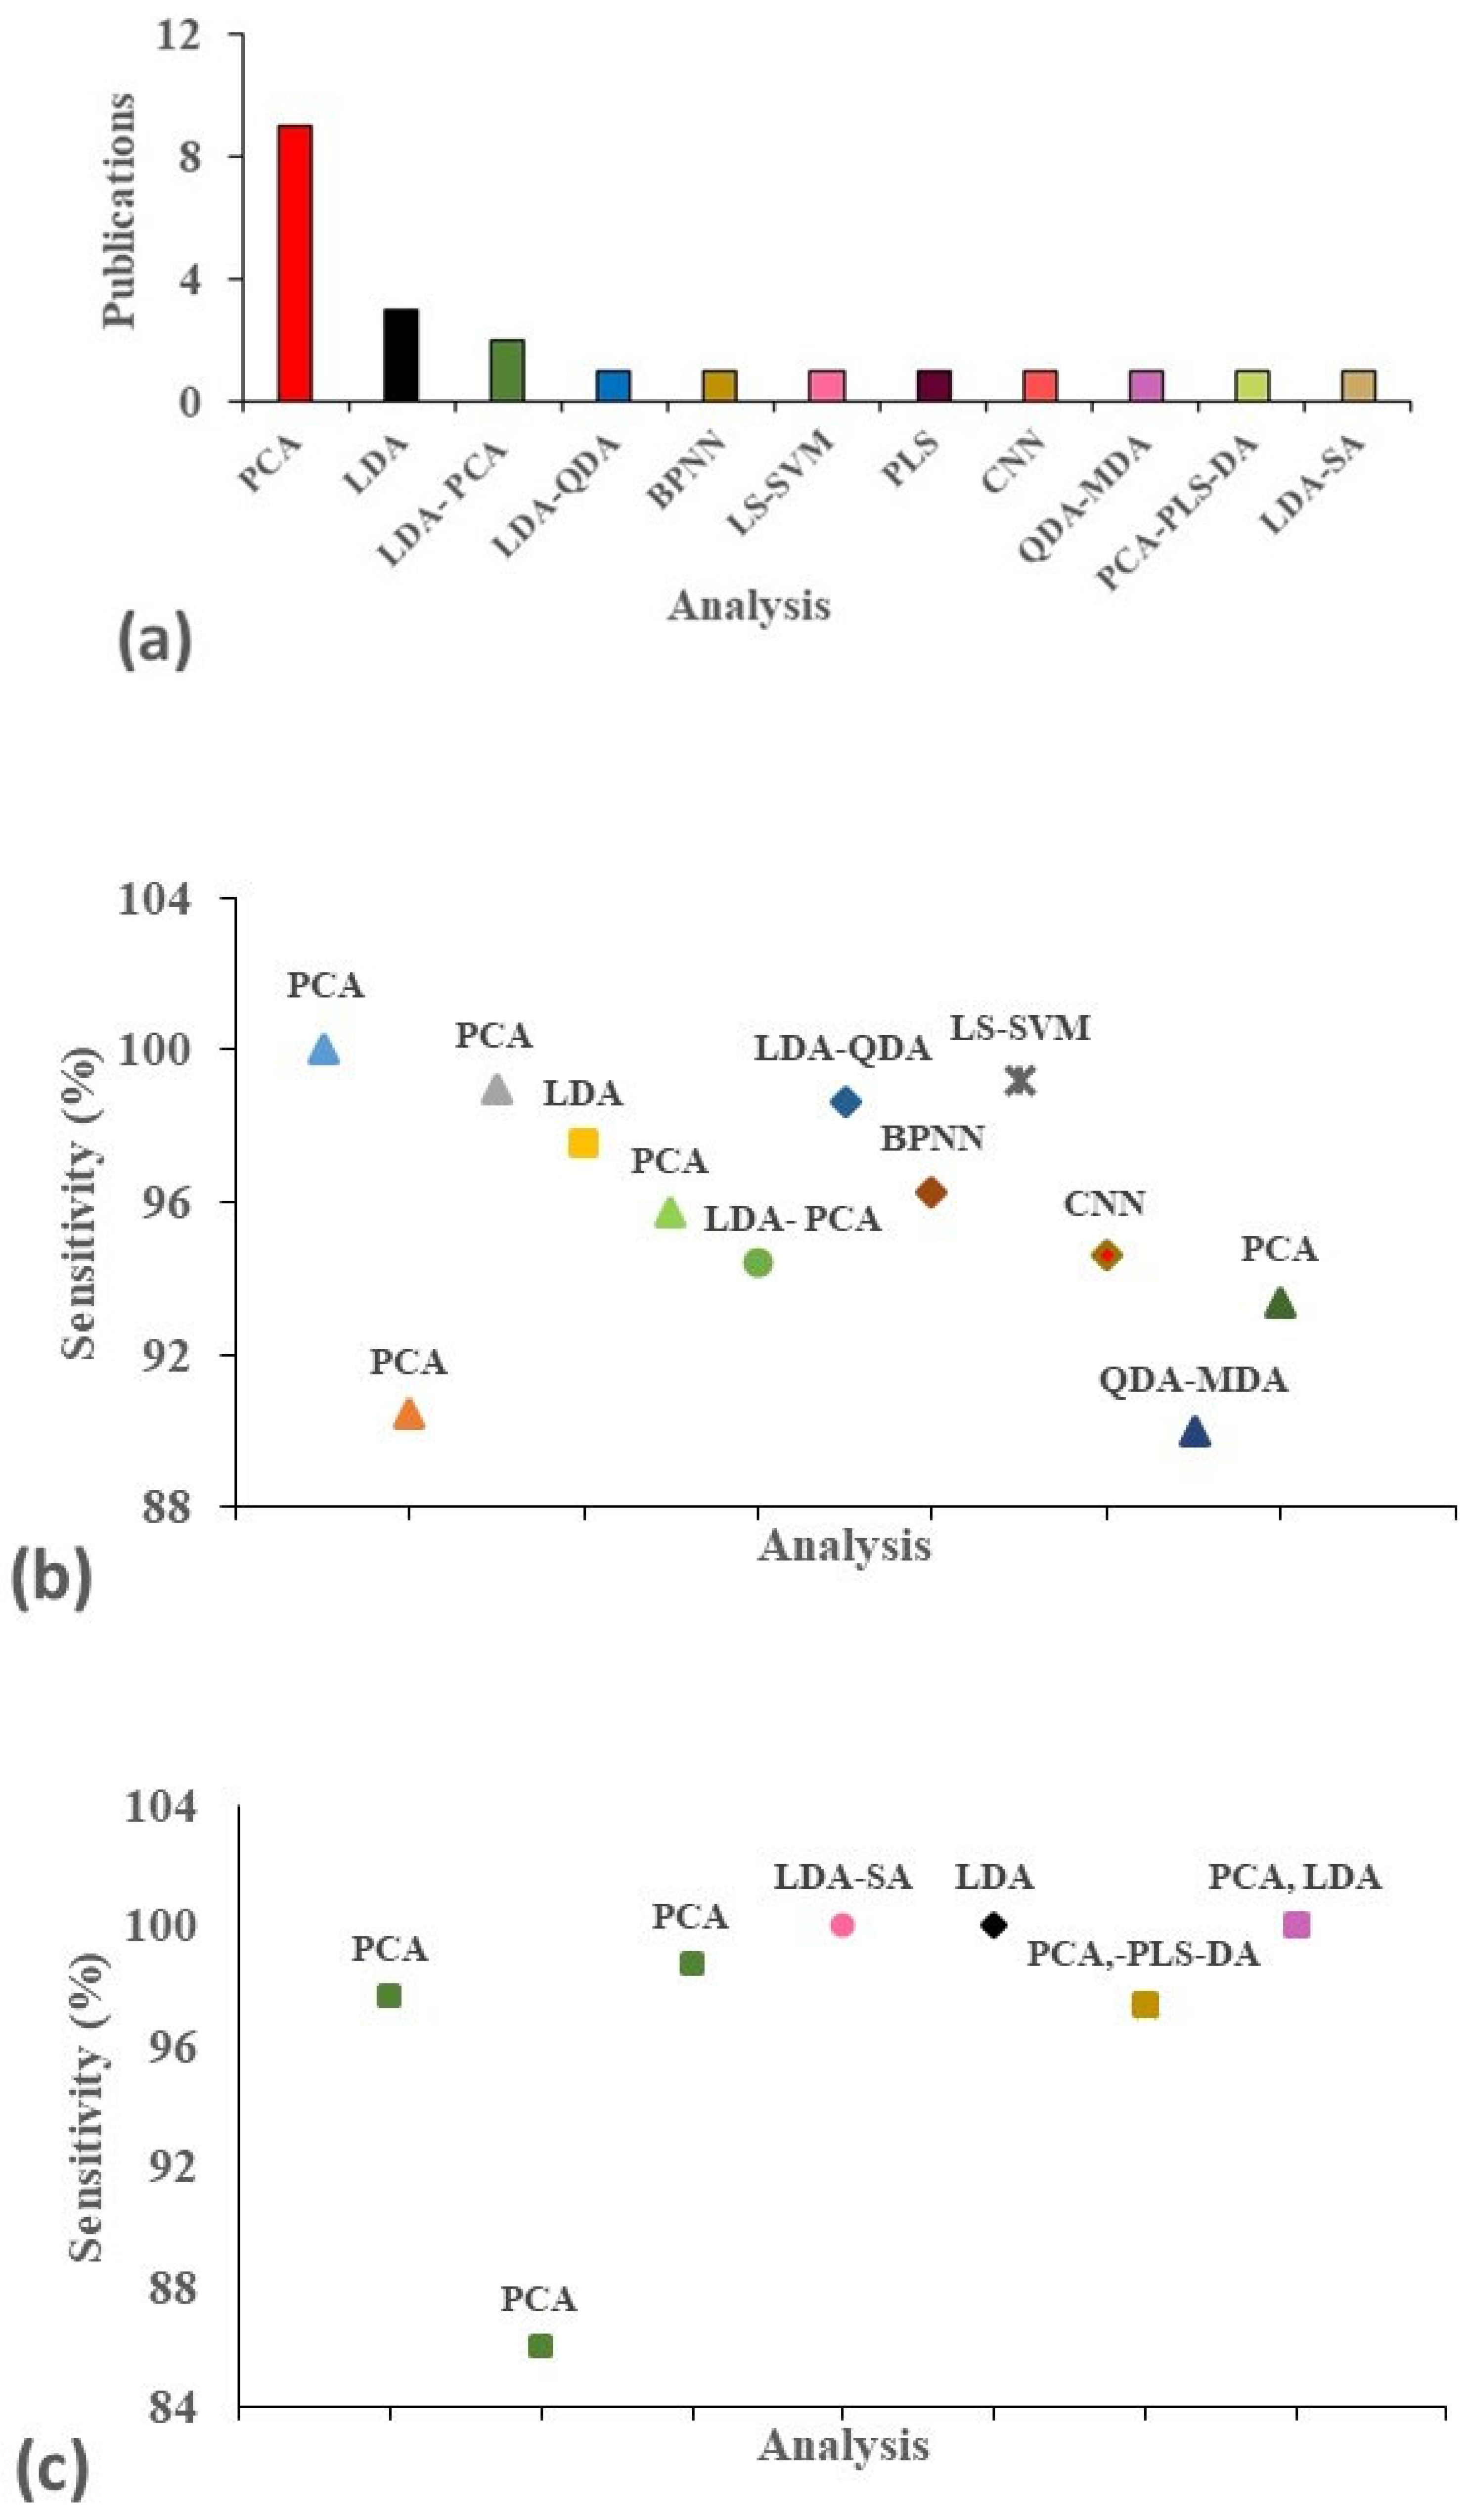
3. Results and Discussion
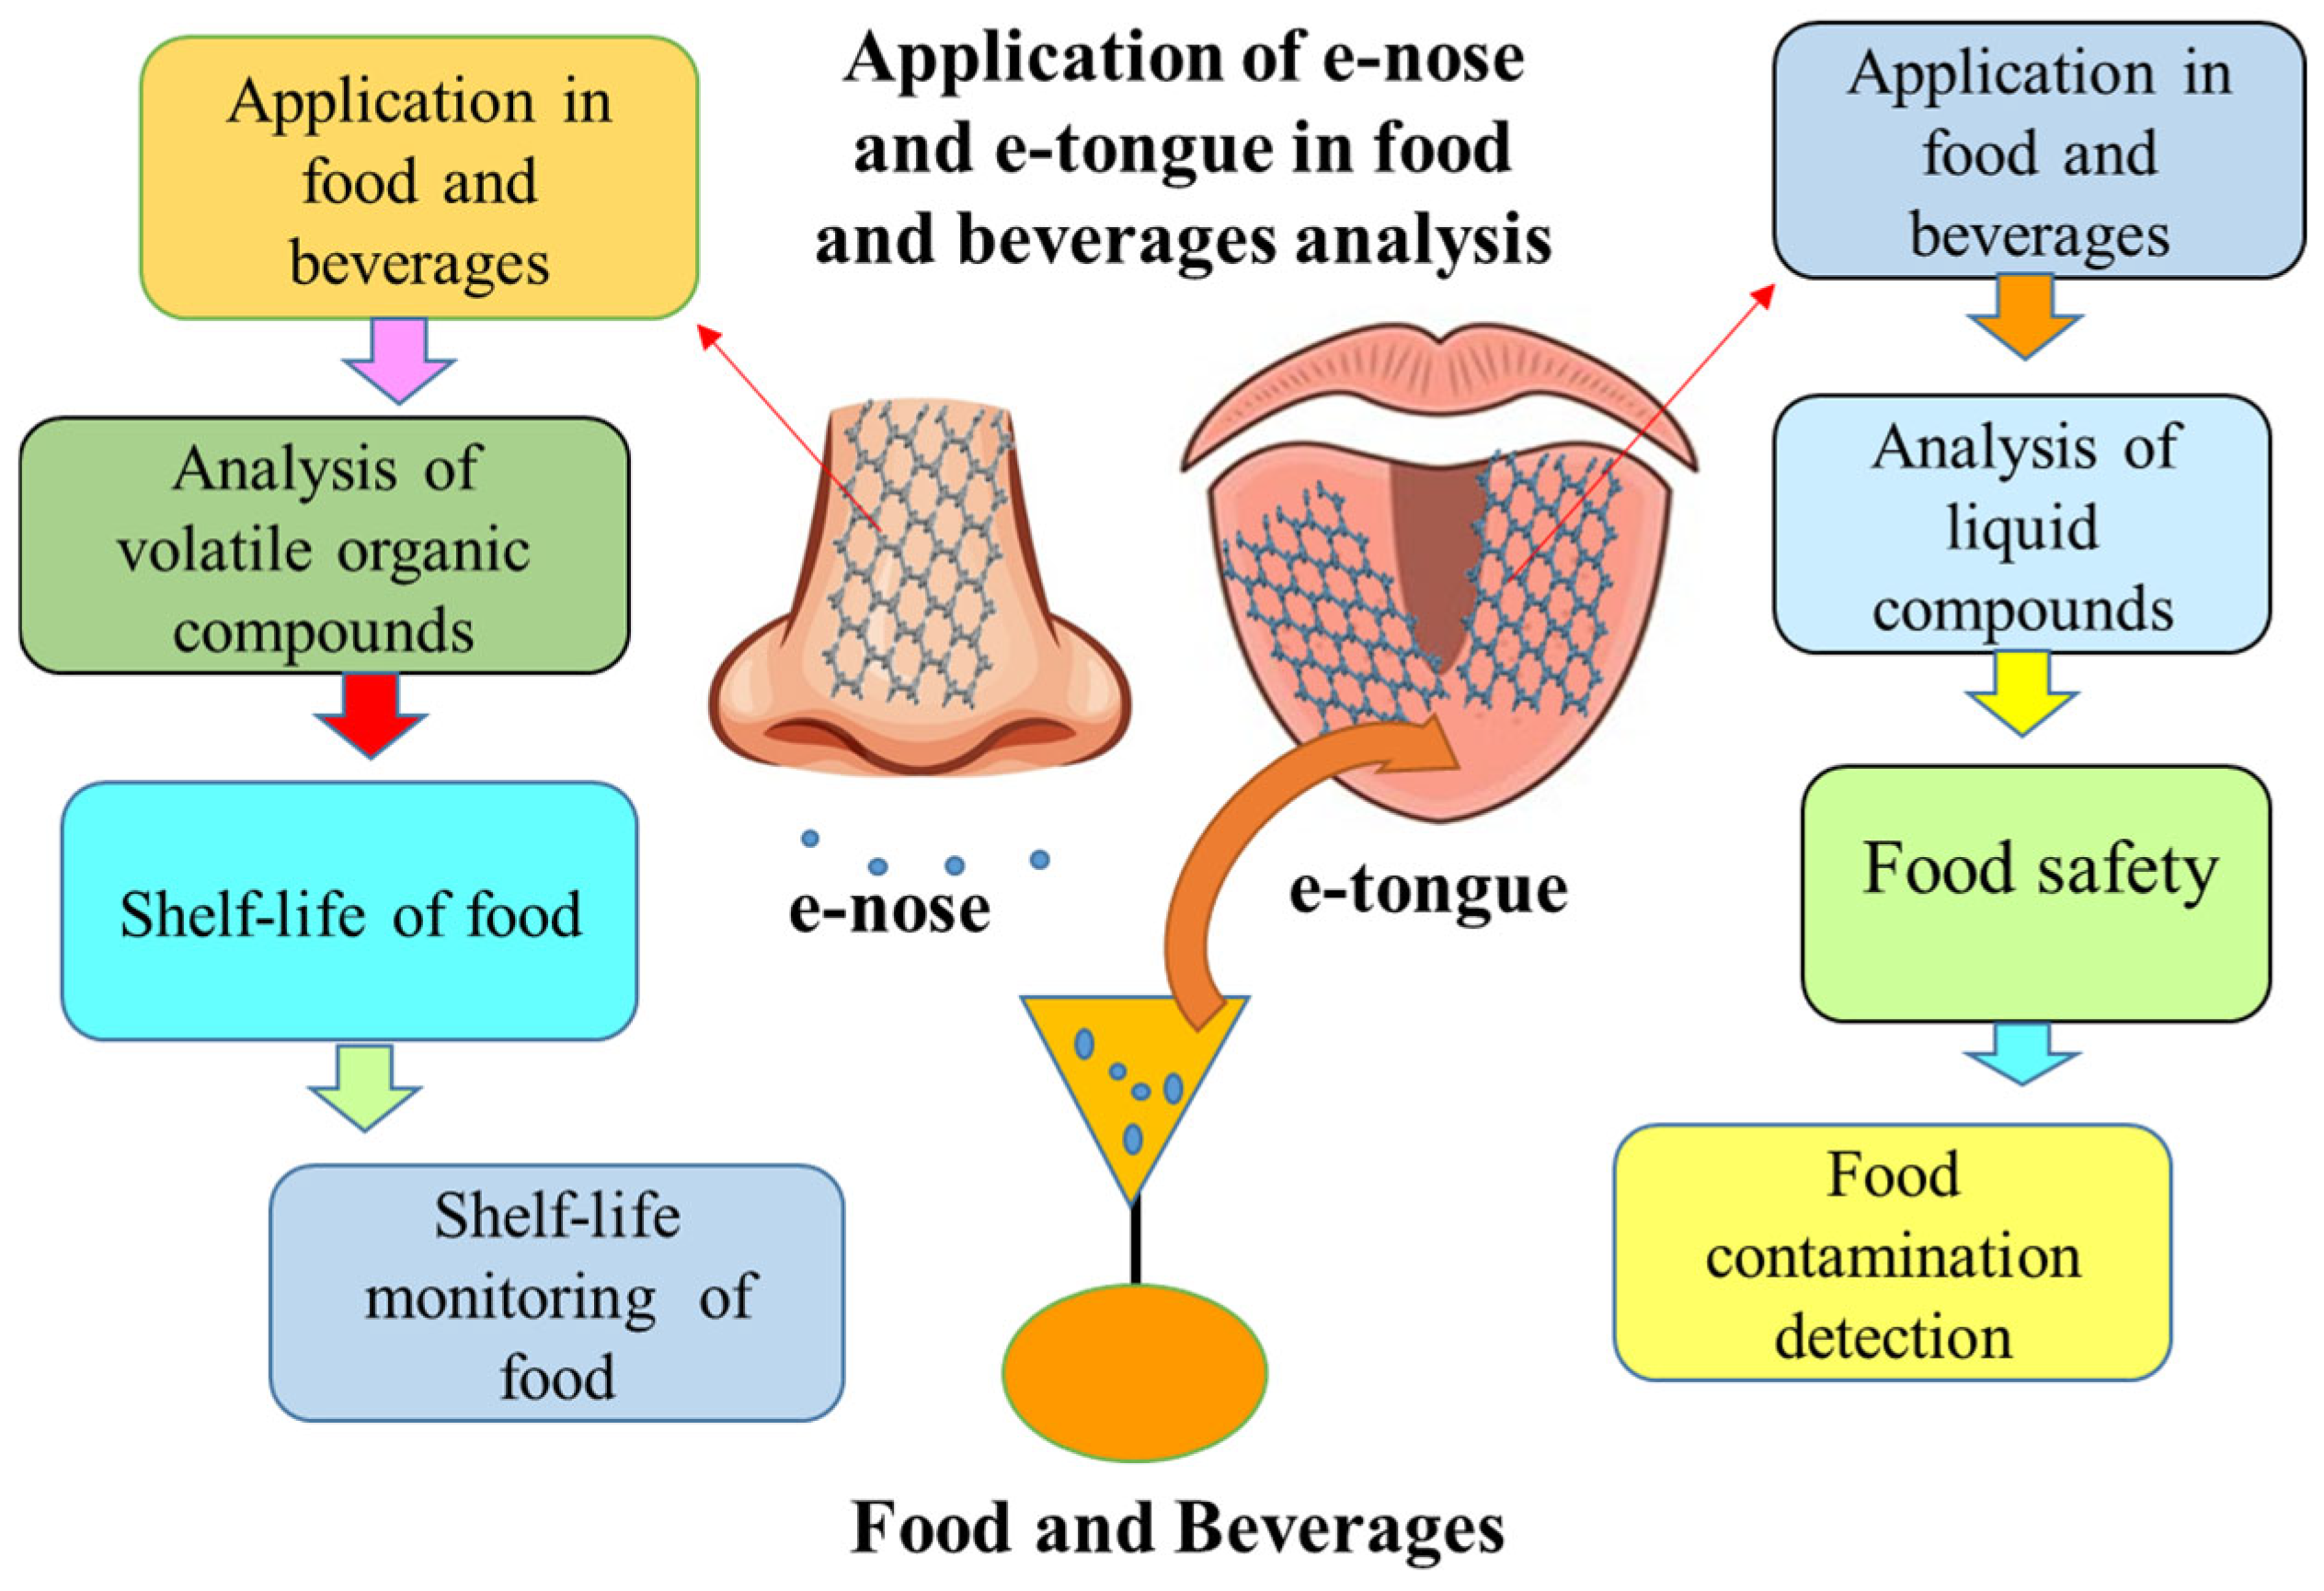
3.1. Application of E-Nose and E-Tongue in Food Quality Assessment
3.2. E-Nose Performance in Food Safety and Storage
- (i)
- Soft-rot Disease Detection
- (ii)
- Chitosan Detection in fruits
- (iii)
- Pathogen Detection in fruits
- (iv)
- Evaporated gas monitoring in fruits and vegetables
- (v)
- Volatile Organic Compound (VOC) Monitoring
3.3. E-Nose Applications in Food Security
- (i)
- Classifying garlic cultivars
- (ii)
- Urea detection in plants
3.4. E-Nose Applications in Shelf-Life Monitoring
- (i)
- Bacteria detection in meat
- (ii)
- Monitoring of Barattiere and climacteric fruits
- (iii)
- Microorganism detection in fish
- (iv)
- Sugar and carbohydrate detection
3.5. E-Tongue Performance in Food Quality Assessment
- (i)
- Monitoring beer
- (ii)
- Bitterness detection in olive oil
3.6. E-Tongue Applications in Food Contaminant Detection
- (i)
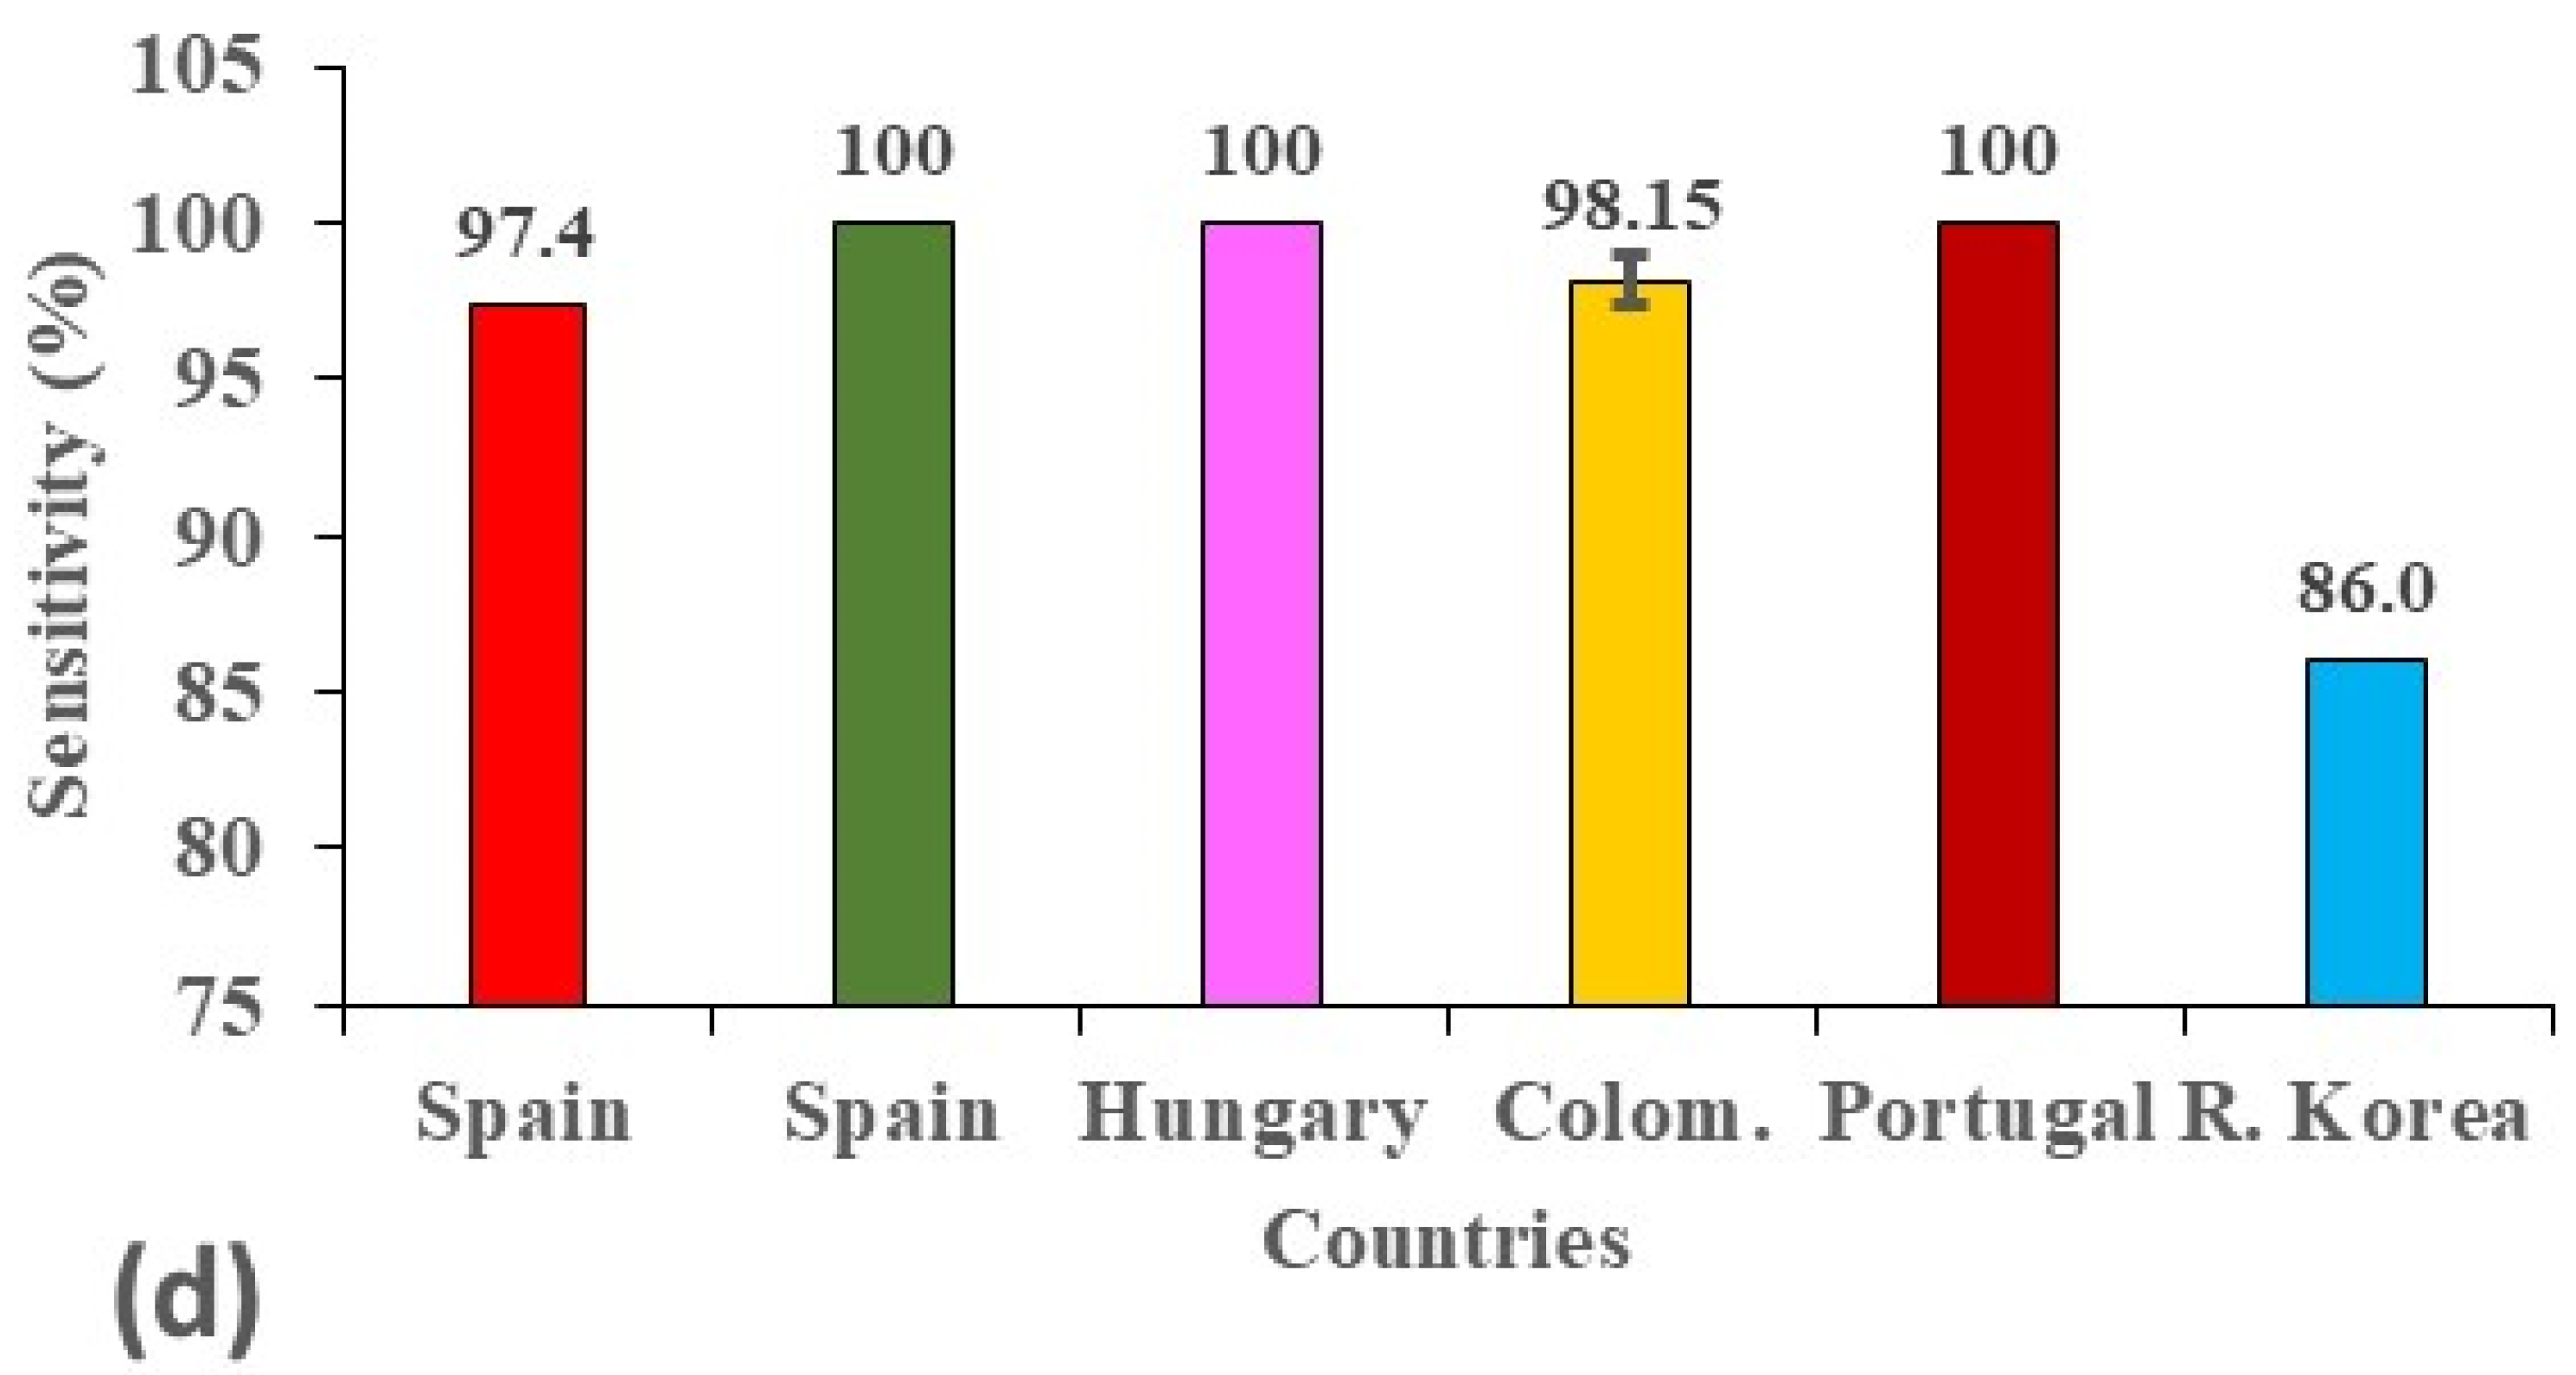
- Pathogenic microorganisms present in foodstuffs are considered a serious risk for causing various diseases in human beings. Their rapid detection due to low analyte concentrations has caused a technical challenge. Conventional techniques, including polymerase chain reaction [88] and conventional cultural methods [89], have been employed, but these are laborious and costly and have required a large amount of time. Hiba Ghrissi et al. proposed a potentiometric e-tongue lipid-sensor membrane system to investigate four types of bacteria (E. faecalis, S. aureus, E. coli, and P. aeruginosa—abbreviated at the endnotes of Table 1) in water samples, with a sensitivity of 100%, by using linear discriminant analysis–simulated annealing algorithm analysis [63]. The advantages of the proposed system over the other used techniques were its quick analysis and economical behaviors. The mechanism of such a system includes the differentiation of four samples from each other by following hydrogen bonding or electrostatic interactions among the various compounds and lipid-membrane polar and non-polar sites.
- (ii)
- Foodborne diseases caused by E. coli which affect human health are a serious problem nowadays. Different methods based on the growth of bacteria strains are being used by industries for its detection, but these require special infrastructure and have high time requirements. Jeniffer Katerine Carrilo-Gomex et al. proposed an e-tongue system owing to its efficient sensitivity, stability and multivariate analysis behaviors to determine the various E-coli concentrations in milk samples, with a 98.7% sensitivity, by using principal component analysis to separate the different voltametric signals which were obtained from diverse samples [66]. The best performance of the e-tongue was shown by using gold instead of a carbon electrode. Additionally, Jeniffer Katerine Carrillo Gomez et al. [64] developed a membrane filter-based e-tongue-and-e-nose-based technique for E-coli detection in water samples with a 97.6% sensitivity by using principal component analysis (only for e-tongue).
- (iii)
- Nowadays, the supply of clean and pure water to living organisms is a major issue. Different poisonous compounds have dissolved in water, disturbing its taste and odor. Various methods, such as headspace solid-phase micro extraction with gas chromatography–mass spectrometry (HS-SPME), have been widely used [90], but they need a trained person, have a long analysis time (1 h), and feature expensive equipment’s. Tae-Mun Hwang et al. [65] proposed an e-tongue-based system which has the properties of providing a rapid analysis (3 min) and being economical for the monitoring of 2-methylisoborneol compound, which is mostly produced by algae in water, with a sensitivity of 86.0%. The signal data was interpreted by using principal component analysis with a large variance. L. Lvova et al. developed a potentiometric e-tongue system for the detection of cyanobacteria in water, which achieved a limit of detection (LOD) of 10−6 mol/L. The obtained results were compared with colorimetric enzymatic analysis and a chromatographic technique. The performance of the e-tongue was considered highly effective for future use in the treatment of water.
3.7. A Comparison of the Strengths and Weaknesses of E-Nose and E-Tongue Technologies in Different Food Matrices
4. Challenges and Future Aspects
- Baseline alteration and standardization will be performed before pattern recognition to eliminate environmental noise and baseline drift for the regulation of raw signals.
- During operation, machine learning algorithms vigorously recalibrate sensor performance.
- Reusing formerly calibrated progressions and regulating them to diverse sensor environments.
5. Conclusions
Supplementary Materials
Author Contributions
Funding
Informed Consent Statement
Data Availability Statement
Acknowledgments
Conflicts of Interest
References
- Garcia-Perez, P.; Becchi, P.P.; Zhang, L.; Rocchetti, G.; Lucini, L. Metabolomics and chemometrics: The next-generation analytical toolkit for the evaluation of food quality and authenticity. Trends Food Sci. Technol. 2024, 147, 104481. [Google Scholar] [CrossRef]
- Lu, L.; Hu, Z.; Hu, X.; Li, D.; Tian, S. Electronic tongue and electronic nose for food quality and safety. Food Res Int. 2022, 162, 112214. [Google Scholar] [CrossRef] [PubMed]
- Magnuson, B.; Munro, I.; Abbot, P.; Baldwin, N.; Lopez-Garcia, R.; Ly, K.; McGirr, L.; Roberts, A.; Socolovsky, S. Review of the regulation and safety assessment of food substances in various countries and jurisdictions. Food Addit. Contam. 2013, 30, 1147–1220. [Google Scholar] [CrossRef] [PubMed]
- Committee, E.S.; Benford, D.; Halldorsson, T.; Jeger, M.J.; Knutsen, H.K.; More, S.; Naegeli, H.; Noteborn, H.; Ockleford, C.; Ricci, A. The principles and methods behind EFSA’s guidance on uncertainty analysis in scientific assessment. EFSA J. 2018, 16, e05122. [Google Scholar] [CrossRef] [PubMed]
- Ling, Z.; Yang, L.; Zhang, W.; Yao, T.; Xu, H. Detection of food contaminants: A review of established rapid analytical techniques and their applications and limitations. Food Saf. Health 2024, 2, 72–95. [Google Scholar] [CrossRef]
- Mazarakioti, E.C.; Zotos, A.; Thomatou, A.-A.; Kontogeorgos, A.; Patakas, A.; Ladavos, A. Inductively coupled plasma-mass spectrometry (ICP-MS), a useful tool in authenticity of agricultural products’ and foods’ origin. Foods 2022, 11, 3705. [Google Scholar] [CrossRef] [PubMed]
- Shim, J.-H.; Rahman, M.M.; Esatbeyoglu, T.; Oz, F.; El-Aty, A.A. Development of an enhanced analytical method utilizing pepper matrix as an analyte protectant for sensitive GC–MS/MS detection of dimethipin in animal-based food products. PLoS ONE 2023, 18, e0295968. [Google Scholar] [CrossRef] [PubMed]
- Yun, D.-Y.; Bae, J.-Y.; Park, C.-W.; Jang, G.-H.; Choe, W.-J. Determination of Modified QuEChERS Method for Chlorothalonil Analysis in Agricultural Products Using Gas Chromatography–Mass Spectrometry (GC-MS/MS). Foods 2023, 12, 3793. [Google Scholar] [CrossRef] [PubMed]
- Hakami, R.A.; Aqel, A.; Ghfar, A.A.; ALOthman, Z.A.; Badjah-Hadj-Ahmed, A.-Y. Development of QuEChERS extraction method for the determination of pesticide residues in cereals using DART-ToF-MS and GC-MS techniques. Correlation and quantification study. J. Food Compos. Anal. 2021, 98, 103822. [Google Scholar] [CrossRef]
- Barreca, S.; Orecchio, S.; Orecchio, S.; Abbate, I.; Pellerito, C. Macro and micro elements in traditional meals of Mediterranean diet: Determination, estimated intake by population, risk assessment and chemometric analysis. J. Food Compos. Anal. 2023, 123, 105541. [Google Scholar] [CrossRef]
- Hassan, M.H.; Khan, R.; Andreescu, S. Advances in electrochemical detection methods for measuring contaminants of emerging concerns. Electrochem. Sci. Adv. 2022, 2, e2100184. [Google Scholar] [CrossRef]
- Sakthivel, K.; Balasubramanian, S.; Chang-Chien, G.-P.; Wang, S.-F.; Billey, W.; Platero, J.; Soundappan, T.; Sekhar, P. Editors’ choice—Review—Advances in electrochemical sensors: Improving food safety, quality, and traceability. ECS Sens. Plus 2024, 3, 020605. [Google Scholar] [CrossRef]
- Umapathi, R.; Ghoreishian, S.M.; Sonwal, S.; Rani, G.M.; Huh, Y.S. Portable electrochemical sensing methodologies for on-site detection of pesticide residues in fruits and vegetables. Coord. Chem. Rev. 2022, 453, 214305. [Google Scholar] [CrossRef]
- Dey, K. Electrochemical Biosensors Market Research Report Information by Type (Diagnosis and Monitoring), by End User (Healthcare Diagnostics, Environmental Monitoring, and Food Quality Testing), And By Region (North America, Europe, Asia-Pacific, and the Rest of the World)–Market Forecast Till 2032. Available online: https://www.marketresearchfuture.com/reports/electrochemical-biosensors-market-2792 (accessed on 30 August 2019).
- Sun, X.; Liu, F.; Xue, X. Machine learning combined with electrochemical sensor for rapid detection of Sudan Red I in food. J. Food Meas. Charact. 2024, 18, 95–104. [Google Scholar] [CrossRef]
- Wang, M.; Chen, Y. Electronic nose and its application in the food industry: A review. Eur. Food Res. Technol. 2024, 250, 21–67. [Google Scholar] [CrossRef]
- Casalinuovo, I.A.; Di Pierro, D.; Coletta, M.; Di Francesco, P. Application of electronic noses for disease diagnosis and food spoilage detection. Sensors 2006, 6, 1428–1439. [Google Scholar] [CrossRef]
- Gliszczyńska-Świgło, A.; Chmielewski, J. Electronic nose as a tool for monitoring the authenticity of food. A review. Food Anal. Methods 2017, 10, 1800–1816. [Google Scholar] [CrossRef]
- Mohamed, R.R.; Yaacob, R.; Mohamed, M.A.; Dir, T.A.T.; Rahim, F.A. Food freshness using electronic nose and its classification method: A review. Int. J. Eng. Technol. 2018, 7, 49–53. [Google Scholar] [CrossRef]
- Arshak, K.; Moore, E.; Lyons, G.M.; Harris, J.; Clifford, S. A review of gas sensors employed in electronic nose applications. Sens. Rev. 2004, 24, 181–198. [Google Scholar] [CrossRef]
- Tan, J.; Xu, J. Applications of electronic nose (e-nose) and electronic tongue (e-tongue) in food quality-related properties determination: A review. Artif. Intell. Agric. 2020, 4, 104–115. [Google Scholar] [CrossRef]
- Baietto, M.; Wilson, A.D. Electronic-nose applications for fruit identification, ripeness and quality grading. Sensors 2015, 15, 899–931. [Google Scholar] [CrossRef] [PubMed]
- Yan, K.; Zhang, D. Correcting instrumental variation and time-varying drift: A transfer learning approach with autoencoders. IEEE Trans. Instrum. Meas. 2016, 65, 2012–2022. [Google Scholar] [CrossRef]
- Verma, M.; Asmita, S.; Shukla, K. A regularized ensemble of classifiers for sensor drift compensation. IEEE Trans. Instrum. 2015, 16, 1310–1318. [Google Scholar] [CrossRef]
- Vanaraj, R.; IP, B.; Mayakrishnan, G.; Kim, I.S.; Kim, S.-C. A Systematic Review of the Applications of Electronic Nose and Electronic Tongue in Food Quality Assessment and Safety. Chemosensors 2025, 13, 161. [Google Scholar] [CrossRef]
- Ye, Z.; Liu, Y.; Li, Q. Recent progress in smart electronic nose technologies enabled with machine learning methods. Sensors 2021, 21, 7620. [Google Scholar] [CrossRef] [PubMed]
- Yadav, U.; Khurana, S.; Rawal, K.; Arora, B.; Yadav, A. Integrating AI with Electronic Tongue (E-Tongue) for Real-Time Detection in the Food Industry. In Artificial Intelligence in the Food Industry; CRC Press: Boca Raton, FL, USA, 2025; pp. 277–296. [Google Scholar]
- Tahara, Y.; Toko, K. Electronic tongues–a review. IEEE Sens. J. 2013, 13, 3001–3011. [Google Scholar] [CrossRef]
- Tibaduiza, D.; Anaya, M.; Gómez, J.; Sarmiento, J.; Perez, M.; Lara, C.; Ruiz, J.; Osorio, N.; Rodriguez, K.; Hernandez, I. Electronic tongues and noses: A general overview. Biosensors 2024, 14, 190. [Google Scholar] [CrossRef] [PubMed]
- Jiang, H.; Zhang, M.; Bhandari, B.; Adhikari, B. Application of electronic tongue for fresh foods quality evaluation: A review. Food Rev. Int. 2018, 34, 746–769. [Google Scholar] [CrossRef]
- Schlossareck, C.; Ross, C.F. Electronic tongue and consumer sensory evaluation of spicy paneer cheese. J. Food Sci. 2019, 84, 1563–1569. [Google Scholar] [CrossRef] [PubMed]
- Suthaharan, S. Support vector machine. In Machine Learning Models and Algorithms for Big Data Classification: Thinking with Examples for Effective Learning; Springer: Berlin/Heidelberg, Germany, 2016; pp. 207–235. [Google Scholar]
- Leon-Medina, J.X.; Anaya, M.; Pozo, F.; Tibaduiza, D. Nonlinear feature extraction through manifold learning in an electronic tongue classification task. Sensors 2020, 20, 4834. [Google Scholar] [CrossRef] [PubMed]
- Leon-Medina, J.X.; Cardenas-Flechas, L.J.; Tibaduiza, D.A. A data-driven methodology for the classification of different liquids in artificial taste recognition applications with a pulse voltammetric electronic tongue. Int. J. Distrib. Sens. Netw. 2019, 15, 1550147719881601. [Google Scholar] [CrossRef]
- Torrico, D.D.; Mehta, A.; Borssato, A.B. New methods to assess sensory responses: A brief review of innovative techniques in sensory evaluation. Curr. Opin. Food Sci. 2023, 49, 100978. [Google Scholar] [CrossRef]
- Bouchouras, G.; Kotis, K. Integrating Artificial Intelligence, Internet of Things, and Sensor-Based Technologies: A Systematic Review of Methodologies in Autism Spectrum Disorder Detection. Algorithms 2025, 18, 34. [Google Scholar] [CrossRef]
- Kuchmenko, T.; Umarkhanov, R.; Lvova, L. E-nose for the monitoring of plastics catalytic degradation through the released Volatile Organic Compounds (VOCs) detection. Sens. Actuators B Chem. 2020, 322, 128585. [Google Scholar] [CrossRef]
- Okur, S.; Zhang, Z.; Sarheed, M.; Nick, P.; Lemmer, U.; Heinke, L. Towards a MOF e-Nose: A SURMOF sensor array for detection and discrimination of plant oil scents and their mixtures. Sens. Actuators B Chem. 2020, 306, 127502. [Google Scholar] [CrossRef]
- Shooshtari, M.; Salehi, A. An electronic nose based on carbon nanotube-titanium dioxide hybrid nanostructures for detection and discrimination of volatile organic compounds. Sens. Actuators B Chem. 2022, 357, 131418. [Google Scholar] [CrossRef]
- Grassi, S.; Benedetti, S.; Casiraghi, E.; Buratti, S. E-sensing systems for shelf life evaluation: A review on applications to fresh food of animal origin. Food Packag. Shelf Life 2023, 40, 101221. [Google Scholar] [CrossRef]
- Gil, M.; Rudy, M.; Duma-Kocan, P.; Stanisławczyk, R. Electronic Sensing Technologies in Food Quality Assessment: A Comprehensive Literature Review. Appl. Sci. 2025, 15, 1530. [Google Scholar] [CrossRef]
- Fayaz, U.; Srivastava, S.; Dar, A.H.; Bashir, I.; Manzoor, S.; Pandey, V.K.; Shams, R.; Dash, K.K. Recent insights into E-tongue interventions in food processing applications: An updated review. Curr. Food Sci. Technol. Rep. 2024, 2, 169–182. [Google Scholar] [CrossRef]
- Ortega, J.B.; Garcia, J.G.; Ortega, J.G. Precision of volatile compound analysis in extra virgin olive oil: The influence of MOS electronic nose acquisition factors. In Proceedings of the 2015 IEEE International Conference on Industrial Technology (ICIT), Seville, Spain, 17–19 March 2015; pp. 1482–1487. [Google Scholar] [CrossRef]
- Qiu, S.; Wang, J. The prediction of food additives in the fruit juice based on electronic nose with chemometrics. Food Chem. 2017, 230, 208–214. [Google Scholar] [CrossRef] [PubMed]
- Rutolo, M.F.; Clarkson, J.P.; Covington, J.A. The use of an electronic nose to detect early signs of soft-rot infection in potatoes. Biosyst. Eng. 2018, 167, 137–143. [Google Scholar] [CrossRef]
- Ezhilan, M.; Nesakumar, N.; Jayanth Babu, K.; Srinandan, C.S.; Rayappan, J.B.B. An Electronic Nose for Royal Delicious Apple Quality Assessment–A Tri-layer Approach. Food Res. Int. 2018, 109, 44–51. [Google Scholar] [CrossRef] [PubMed]
- Jia, W.; Liang, G.; Tian, H.; Sun, J.; Wan, C. Electronic nose-based technique for rapid detection and recognition of moldy apples. Sensors 2019, 19, 1526. [Google Scholar] [CrossRef] [PubMed]
- Wang, M.; Gao, F.; Wu, Q.; Zhang, J.; Xue, Y.; Wan, H.; Wang, P. Real-time assessment of food freshness in refrigerators based on a miniaturized electronic nose. Anal. Methods 2018, 10, 4741–4749. [Google Scholar] [CrossRef]
- Herrmann, P.S.D.P.; Santos Luccas, M.D.; Ferreira, E.J.; Torre Neto, A. Application of electronic nose and machine learning used to detect soybean gases under water stress and variability throughout the daytime. Front. Plant Sci. 2024, 15, 1323296. [Google Scholar] [CrossRef] [PubMed]
- Rao, J.; Zhang, Y.; Yang, Z.; Li, S.; Wu, D.; Sun, C.; Chen, K. Application of electronic nose and GC–MS for detection of strawberries with vibrational damage. Food Qual. Saf. 2020, 4, 181–192. [Google Scholar] [CrossRef]
- Trirongjitmoah, S.; Juengmunkong, Z.; Srikulnath, K.; Somboon, P. Classification of garlic cultivars using an electronic nose. Comput. Electron. Agric. 2015, 113, 148–153. [Google Scholar] [CrossRef]
- Tatli, S.; Mirzaee-Ghaleh, E.; Rabbani, H.; Karami, H.; Wilson, A.D. Rapid Detection of Urea Fertilizer Effects on VOC Emissions from Cucumber Fruits Using a MOS E-Nose Sensor Array. Agronomy 2022, 12, 35. [Google Scholar] [CrossRef]
- Astuti, S.D.; Tamimi, M.H.; Pradhana, A.A.S.; Alamsyah, K.A.; Purnobasuki, H.; Khasanah, M.; Susilo, Y.; Triyana, K.; Kashif, M.; Syahrom, A. Gas sensor array to classify the chicken meat with E. coli contaminant by using random forest and support vector machine. Biosens. Bioelectron. X 2021, 9, 100083. [Google Scholar] [CrossRef]
- Sanchez, R.; Alejo, M.; Escribano, P.; Arroyo, P.; Meléndez, F.; Lozano, J. Evaluation of the Shelf Life of Fresh Fish Using an Electronic Nose. Chem. Eng. Trans. 2024, 112, 115–120. [Google Scholar] [CrossRef]
- Cozzolino, R.; Palumbo, M.; Cefola, M.; Laurino, C.; Siano, F.; De Giulio, B.; Pace, B. E-nose and Attenuated Total Reflectance-Fourier Transform Infrared data to estimate the shelf-life of fresh-cut Barattiere packaged in polypropylene or in biodegradable polylactic acid bags. Food Packag. Shelf Life 2023, 38, 101130. [Google Scholar] [CrossRef]
- Karamchandani, S.; Sekhani, B.; Nair, K.; Shah, K. E-nose for shelf-life prediction of climacteric fruits. In Proceedings of the 2021 IEEE 4th International Conference on Computing, Power and Communication Technologies (GUCON), Kuala Lumpur, Malaysia, 24–26 September 2021. [Google Scholar] [CrossRef]
- Khorramifar, A.; Rasekh, M.; Karami, H.; Lozano, J.; Gancarz, M.; Łazuka, E.; Łagód, G. Determining the shelf life and quality changes of potatoes (Solanum tuberosum) during storage using electronic nose and machine learning. PLoS ONE 2023, 18, e0284612. [Google Scholar] [CrossRef] [PubMed]
- Ghasemi-Varnamkhasti, M.; Rodríguez-Méndez, M.L.; Mohtasebi, S.S.; Apetrei, C.; Lozano, J.; Ahmadi, H.; Razavi, S.H.; Antonio de Saja, J. Monitoring the aging of beers using a bioelectronic tongue. Food Control 2012, 25, 216–224. [Google Scholar] [CrossRef]
- Medina-Plaza, C.; de Saja, J.A.; Fernández-Escudero, J.A.; Barajas, E.; Medrano, G.; Rodriguez-Mendez, M.L. Array of biosensors for discrimination of grapes according to grape variety, vintage and ripeness. Anal. Chim. Acta. 2016, 947, 16–22. [Google Scholar] [CrossRef] [PubMed]
- Apetrei, C. Novel method based on polypyrrole-modified sensors and emulsions for the evaluation of bitterness in extra virgin olive oils. Food Res. Int. 2012, 48, 673–680. [Google Scholar] [CrossRef]
- Vitalis, F.; Tjandra Nugraha, D.; Aouadi, B.; Aguinaga Bósquez, J.P.; Bodor, Z.; Zaukuu, J.L.Z.; Kocsis, T.; Zsom-Muha, V.; Gillay, Z.; Kovacs, Z. Detection of monilia contamination in plum and plum juice with NIR spectroscopy and electronic tongue. Chemosensors 2021, 9, 355. [Google Scholar] [CrossRef]
- Zaukuu, J.L.Z.; Gillay, Z.; Kovacs, Z. Standardized extraction techniques for meat analysis with the electronic tongue: A case study of poultry and red meat adulteration. Sensors 2021, 21, 481. [Google Scholar] [CrossRef] [PubMed]
- Ghrissi, H.; Veloso, A.C.; Marx, Í.M.; Dias, T.; Peres, A.M. A potentiometric electronic tongue as a discrimination tool of water-food indicator/contamination bacteria. Chemosensors 2021, 9, 143. [Google Scholar] [CrossRef]
- Goméz, J.K.C.; Acevedo, C.M.D.; García, R.O. Application of an E-Tongue and E-nose for a rapid E. coli detection in a drinking water treatment plant. In Proceedings of the 2019 IEEE International Symposium on Olfaction and Electronic Nose (ISOEN), Fukuoka, Japan, 26–29 May 2019; pp. 1–4. [Google Scholar] [CrossRef]
- Nam, S.-H.; Lee, J.; Kim, E.; Koo, J.-W.; Shin, Y.; Hwang, T.-M. Electronic tongue for the simple and rapid determination of taste and odor compounds in water. Chemosphere 2023, 338, 139511. [Google Scholar] [CrossRef] [PubMed]
- Carrillo-Gómez, J.K.; Acevedo, C.M.D.; García-Rico, R.O. Detection of the bacteria concentration level in pasteurized milk by using two different artificial multisensory methods. Sens. Bio-Sens. Res. 2021, 33, 100428. [Google Scholar] [CrossRef]
- Lvova, L.; Gonçalves, C.G.; Petropoulos, K.; Micheli, L.; Volpe, G.; Kirsanov, D.; Legin, A.; Viaggiu, E.; Congestri, R.; Guzzella, L. Electronic tongue for microcystin screening in waters. Biosens. Bioelectron. 2016, 80, 154–160. [Google Scholar] [CrossRef] [PubMed]
- Wang, W.; Feng, Y.; Dai, W. Topic analysis of online reviews for two competitive products using latent Dirichlet allocation. Electron. Commer. Res. 2018, 29, 142–156. [Google Scholar] [CrossRef]
- Xu, P.; Brock, G.N.; Parrish, R.S. Modified linear discriminant analysis approaches for classification of high-dimensional microarray data. Comput. Stat. Data Anal. 2009, 53, 1674–1687. [Google Scholar] [CrossRef]
- Karamizadeh, S.; Abdullah, S.M.; Manaf, A.A.; Zamani, M.; Hooman, A. An overview of principal component analysis. J. Signal Inf. Process. 2013, 4, 173–175. [Google Scholar] [CrossRef]
- Li, L.; Liu, S.; Peng, Y.; Sun, Z. Overview of principal component analysis algorithm. Optik 2016, 127, 3935–3944. [Google Scholar] [CrossRef]
- Liu, J.; Ma, Z.; Tian, L.; Li, Q.; Bi, W. BPNN-assisted control algorithm application to a super large cable-net structure of active FAST reflector system. In Structures; Elsevier: Amsterdam, The Netherlands, 2025. [Google Scholar] [CrossRef]
- Wang, M.; Liu, Z.; Yu, Y.; Yang, X.; Gao, W. Rate-Dependent Hysteresis Model Based on LS-SVM for Magnetic Shape Memory Alloy Actuator. In Actuators; MDPI: Basel, Switzerland, 2025. [Google Scholar] [CrossRef]
- Guo, Z.; Bai, G. Application of least squares support vector machine for regression to reliability analysis. Chin. J. Aeronaut. 2009, 22, 160–166. [Google Scholar] [CrossRef]
- Du, B.; Zheng, S.; Zhao, J. Quadratic discriminant analysis in distributed frameworks. Statistics 2025, 3, 735–761. [Google Scholar] [CrossRef]
- Savino, P.; Graglia, F.; Scozza, G.; Pietra, V.D. Automated corrosion surface quantification in steel transmission towers using UAV photogrammetry and deep convolutional neural networks. Comput. Aided Civ. Infrastruct. Eng. 2025, 40, 2050–2070. [Google Scholar] [CrossRef]
- Kamilaris, A.; Prenafeta-Boldú, F.X. A review of the use of convolutional neural networks in agriculture. J. Agric. Sci. 2018, 156, 312–322. [Google Scholar] [CrossRef]
- Szostakiwskyj, J.M.H.; Cortese, F.; Abdul-Rhaman, R.; Anderson, S.J.; Warren, A.L.; Archer, R.; Read, E.; Hecker, K.G. The Problem with Time: Application of Partial Least Squares Analysis on Time-Frequency Plots to Account for Varying Time Intervals with Applied EEG Data. Brain Sci. 2025, 15, 135. [Google Scholar] [CrossRef] [PubMed]
- Mo, Y.; Liu, J.; Zhang, L. Deconvolution of spatial transcriptomics data via graph contrastive learning and partial least square regression. Brief. Bioinform. 2025, 26, bbaf052. [Google Scholar] [CrossRef] [PubMed]
- Chen, C.; Li, X.; Bo, Z.; Du, W.; Fu, L.; Tian, Y.; Cui, S.; Shi, Y.; Xie, H. Occurrence, characteristics, and PCR-based detection of Pectobacterium polaris causing soft rot of Chinese cabbage in China. Plant Dis. 2021, 105, 2880–2887. [Google Scholar] [CrossRef] [PubMed]
- Baek, J.H.; Lee, S.-Y.; Bae, J.-Y.; Oh, S.-W. Development of a selective and differential medium for effective isolation of Pectobacterium carotovorum from soft rot-infected agricultural products. Food Sci. Biotechnol. 2025, 34, 1517–1524. [Google Scholar] [CrossRef] [PubMed]
- Suárez, M.B.; Diego, M.; Feria, F.J.; Martín-Robles, M.J.; Moreno, S.; Palomo, J.L. New PCR-based assay for the identification of Pectobacterium carotovorum causing potato soft rot. Plant Dis. 2022, 106, 676–684. [Google Scholar] [CrossRef] [PubMed]
- Li, Z.; Thomas, C. Quantitative evaluation of mechanical damage to fresh fruits. Trends Food Sci. Technol. 2014, 35, 138–150. [Google Scholar] [CrossRef]
- Black, C.; Chevallier, O.P.; Elliott, C.T. The current and potential applications of ambient mass spectrometry in detecting food fraud. TrAC Trends Anal. Chem. 2016, 82, 268–278. [Google Scholar] [CrossRef]
- Karami, H.; Rasekh, M.; Mirzaee-Ghaleh, E. Qualitative analysis of edible oil oxidation using an olfactory machine. J. Food Meas. Charact. 2020, 14, 2600–2610. [Google Scholar] [CrossRef]
- Thienes, C.P.; Masiri, J.; Benoit, L.A.; Barrios-Lopez, B.; Samuel, S.A.; Krebs, R.A.; Samadpour, M. Quantitative detection of beef contamination in cooked meat products by ELISA. J. AOAC Int. 2019, 102, 898–902. [Google Scholar] [CrossRef] [PubMed]
- Jordana-Lluch, E.; Giménez, M.; Quesada, M.D.; Ausina, V.; Martró, E. Improving the diagnosis of bloodstream infections: PCR coupled with mass spectrometry. Biomed. Res. Int. 2014, 2014, 501214. [Google Scholar] [CrossRef] [PubMed]
- Lin, C.C.; Fung, L.L.; Chan, P.K.; Lee, C.M.; Chow, K.F.; Cheng, S.H. A rapid low-cost high-density DNA-based multi-detection test for routine inspection of meat species. Meat Sci. 2014, 96, 922–929. [Google Scholar] [CrossRef] [PubMed]
- Gracias, K.S.; McKillip, J.L. A review of conventional detection and enumeration methods for pathogenic bacteria in food. Can. J. Microbiol. 2004, 50, 883–890. [Google Scholar] [CrossRef] [PubMed]
- Ruan, E.D.; Aalhus, J.L.; Summerfelt, S.T.; Davidson, J.; Swift, B.; Juárez, M. Determination of off-flavor compounds, 2-methylisoborneol and geosmin, in salmon fillets using stir bar sorptive extraction–thermal desorption coupled with gas chromatography–mass spectrometry. J. Chromatogr. A. 2013, 1321, 133–136. [Google Scholar] [CrossRef] [PubMed]
- Rudnitskaya, A. Calibration update and drift correction for electronic noses and tongues. Front. Chem. 2018, 6, 433. [Google Scholar] [CrossRef] [PubMed]
- Yang, B.; Wang, H.; Cao, Z.; Yan, J.; Dong, Z.; Ren, F.; Zhang, W.; Chen, L. The Aroma, Taste Contributions, and Flavor Evaluation Based on GC-IMS, E-Nose, and E-Tongue in Soybean Pastes: A Comparative Study. Foods 2025, 14, 1178. [Google Scholar] [CrossRef] [PubMed]
- Dong, W.; Zhao, J.; Hu, R.; Dong, Y.; Tan, L. Differentiation of Chinese robusta coffees according to species, using a combined electronic nose and tongue, with the aid of chemometrics. Food Chem. 2017, 229, 743–751. [Google Scholar] [CrossRef] [PubMed]
- Hruškar, M.; Major, N.; Krpan, M.; Panjkota Krbavčić, I.; Šarić, G.; Marković, K.; Vahčić, N. Evaluation of milk and dairy products by electronic tongue. Mljekarstvo Časopis Za Unaprjeđenje Proizv. I Prerade Mlijeka 2009, 59, 193–200. [Google Scholar]
- Lipkowitz, J.B.; Ross, C.F.; Diako, C.; Smith, D.M. Discriminating aging and protein-to-fat ratio in Cheddar cheese using sensory analysis and a potentiometric electronic tongue. J. Dairy. Sci. 2018, 101, 1990–2004. [Google Scholar] [CrossRef] [PubMed]
- Németh, D.; Balázs, G.; Daood, H.G.; Kovács, Z.; Bodor, Z.; Zinia Zaukuu, J.-L.; Szentpéteri, V.; Kókai, Z.; Kappel, N. Standard analytical methods, sensory evaluation, NIRS and electronic tongue for sensing taste attributes of different melon varieties. Sensors 2019, 19, 5010. [Google Scholar] [CrossRef] [PubMed]
- Lee, H.J.; Yoon, J.W.; Kim, M.; Oh, H.; Yoon, Y.; Jo, C. Changes in microbial composition on the crust by different air flow velocities and their effect on sensory properties of dry-aged beef. Meat Sci. 2019, 153, 152–158. [Google Scholar] [CrossRef] [PubMed]
- Lee, C.H.; Chen, I.-T.; Yang, H.C.; Chen, Y.J. An AI-powered electronic nose system with fingerprint extraction for aroma recognition of coffee beans. Micromachines 2022, 13, 1313. [Google Scholar] [CrossRef] [PubMed]
- Aunsa-Ard, W.; Kerdcharoen, T. Electronic nose for analysis of coffee beans obtained from different altitudes and origin. In Proceedings of the 2022 14th International Conference on Knowledge and Smart Technology (KST), Saen Suk, Thailand, 26–29 June 2022; pp. 147–151. [Google Scholar] [CrossRef]
- Khorramifar, A.; Sharabiani, V.R.; Karami, H.; Kisalaei, A.; Lozano, J.; Rusinek, R.; Gancarz, M. Investigating changes in pH and soluble solids content of potato during the storage by electronic nose and Vis/NIR spectroscopy. Foods 2022, 11, 4077. [Google Scholar] [CrossRef] [PubMed]
- Kiselev, I.; Sysoev, V.; Kaikov, I.; Koronczi, I.; Adil Akai Tegin, R.; Smanalieva, J.; Sommer, M.; Ilicali, C.; Hauptmannl, M. On the temporal stability of analyte recognition with an e-nose based on a metal oxide sensor array in practical applications. Sensors 2018, 18, 550. [Google Scholar] [CrossRef] [PubMed]
- Cetó, X.; Voelcker, N.H.; Prieto-Simón, B. Bioelectronic tongues: New trends and applications in water and food analysis. Biosens. Bioelectron. 2016, 79, 608–626. [Google Scholar] [CrossRef] [PubMed]
- Mahanti, N.K.; Shivashankar, S.; Chhetri, K.B.; Kumar, A.; Rao, B.B.; Aravind, J.; Swami, D. Enhancing food authentication through E-nose and E-tongue technologies: Current trends and future directions. Trends Food Sci. Technol. 2024, 150, 104574. [Google Scholar] [CrossRef]
- El Barbri, N.; Amari, A.; Vinaixa, M.; Bouchikhi, B.; Correig, X.; Llobet, E. Building of a metal oxide gas sensor-based electronic nose to assess the freshness of sardines under cold storage. Sensors Actuators B Chem. 2007, 128, 235–244. [Google Scholar] [CrossRef]
- Yu, H.; Wang, J.; Xu, Y. Identification of adulterated milk using electronic nose. Sens. Mater. 2007, 19, 275–285. [Google Scholar]
- Yongwei, W.; Wang, J.; Zhou, B.; Lu, Q. Monitoring storage time and quality attribute of egg based on electronic nose. Anal. Chim. Acta 2009, 650, 183–188. [Google Scholar] [CrossRef] [PubMed]
- Aghili, N.S.; Rasekh, M.; Karami, H.; Edriss, O.; Wilson, A.D.; Ramos, J. Aromatic fingerprints: VOC analysis with E-nose and GC-MS for rapid detection of adulteration in sesame oil. Sensors 2023, 23, 6294. [Google Scholar] [CrossRef] [PubMed]
- Mesías, M.; Barea-Ramos, J.D.; Lozano, J.; Morales, F.J.; Martín-Vertedor, D. Application of an electronic nose technology for the prediction of chemical process contaminants in roasted almonds. Chemosensors 2023, 11, 287. [Google Scholar] [CrossRef]
- Han, F.; Huang, X.H.; Aheto, J.; Zhang, D.; Feng, F. Detection of beef adulterated with pork using a low-cost electronic nose based on colorimetric sensors. Foods 2020, 9, 193. [Google Scholar] [CrossRef] [PubMed]
- Aghdamifar, E.; Sharabiani, V.R.; Taghinezhad, E.; Szymanek, M.; Dziwulska-Hunek, A. E-nose as a non-destructive and fast method for identification and classification of coffee beans based on soft computing models. Sens. Actuators B. Chem. 2023, 393, 134229. [Google Scholar] [CrossRef]
- Gonzalez Viejo, C.; Tongson, E.; Fuentes, S. Integrating a low-cost electronic nose and machine learning modelling to assess coffee aroma profile and intensity. Sensors 2021, 21, 2016. [Google Scholar] [CrossRef] [PubMed]
- Gancarz, M.; Malaga-Toboła, U.; Oniszczuk, A.; Tabor, S.; Oniszczuk, T.; Gawrysiak-Witulska, M.; Rusinek, R. Detection and measurement of aroma compounds with the electronic nose and a novel method for MOS sensor signal analysis during the wheat bread making process. Food Bioprod. Process 2021, 127, 90–98. [Google Scholar] [CrossRef]
- Rusinek, R.; Gancarz, M.; Nawrocka, A. Application of an electronic nose with novel method for generation of smellprints for testing the suitability for consumption of wheat bread during 4-day storage. LWT 2020, 117, 108665. [Google Scholar] [CrossRef]
- Rusinek, R.; Siger, A.; Gawrysiak-Witulska, M.; Rokosik, E.; Malaga-Toboła, U.; Gancarz, M. Application of an electronic nose for determination of pre-pressing treatment of rapeseed based on the analysis of volatile compounds contained in pressed oil. Int. J. Food Sci. Technol. 2019, 55, 2161–2170. [Google Scholar] [CrossRef]
- Perez-Gonzalez, C.; Garcia-Hernandez, C.; Garcia-Cabezon, C.; Rodriguez-Mendez, M.L.; Dias, L.; Martin-Pedrosa, F. Analysis of milk adulteration by means of a potentiometric electronic tongue. J. Dairy. Sci. 2024, 107, 9135–9144. [Google Scholar] [CrossRef] [PubMed]
- Gómez, J.K.C.; Puentes, Y.A.N.; Niño, D.D.C.; Acevedo, C.M.D. Detection of pesticides in water through an electronic tongue and data processing methods. Water 2023, 15, 624. [Google Scholar] [CrossRef]
- do Nascimento, A.S.; Silva, F.d.L.; Machado, C.S.; Cavalcante da Silva, S.M.P.; Estevinho, L.M.; Dias, L.G.; Carvalho, C.A.L.d. Use of the electronic tongue as a tool for the characterization of Melipona scutellaris Latreille honey. J. Apic. Res. 2022, 61, 79–90. [Google Scholar] [CrossRef]
- Scagion, V.P.; Mercante, L.A.; Sakamoto, K.Y.; Oliveira, J.E.; Fonseca, F.J.; Mattoso, L.H.; Ferreira, M.D.; Correa, D.S. An electronic tongue based on conducting electrospun nanofibers for detecting tetracycline in milk samples. RSC Adv. 2016, 6, 103740–103746. [Google Scholar] [CrossRef]
- Munekata, P.E.; Finardi, S.; de Souza, C.K.; Meinert, C.; Pateiro, M.; Hoffmann, T.G.; Domínguez, R.; Bertoli, S.L.; Kumar, M.; Lorenzo, J.M. Applications of electronic nose, electronic eye and electronic tongue in quality, safety and shelf life of meat and meat products: A review. Sensors 2023, 23, 672. [Google Scholar] [CrossRef] [PubMed]
- Alfieri, G.; Modesti, M.; Riggi, R.; Bellincontro, A. Recent advances and future perspectives in the E-nose technologies addressed to the wine industry. Sensors 2024, 24, 2293. [Google Scholar] [CrossRef] [PubMed]
- Bonah, E.; Huang, X.; Aheto, J.H.; Osae, R. Application of electronic nose as a non-invasive technique for odor fingerprinting and detection of bacterial foodborne pathogens: A review. J. Food Sci. Technol. 2020, 57, 1977–1990. [Google Scholar] [CrossRef] [PubMed]
- Moshayedi, A.J.; Sohail Khan, A.; Hu, J.; Nawaz, A.; Zhu, J. E-nose-driven advancements in ammonia gas detection: A comprehensive review from traditional to cutting-edge systems in indoor to outdoor agriculture. Sustainability 2023, 15, 11601. [Google Scholar] [CrossRef]
- Li, Y.; Wang, Z.; Zhao, T.; Li, H.; Jiang, J.; Ye, J. Electronic nose for the detection and discrimination of volatile organic compounds: Application, challenges, and perspectives. TrAC Trends Anal. Chem. 2024, 180, 117958. [Google Scholar] [CrossRef]
- Chen, H.; Huo, D.; Zhang, J. Gas recognition in E-nose system: A review. IEEE Trans. Biomed. Circuits Syst. 2022, 16, 169–184. [Google Scholar] [CrossRef] [PubMed]
- Cho, S.; Moazzem, M.S. Recent applications of potentiometric electronic tongue and electronic nose in sensory evaluation. Prev. Nutr. Food Sci. 2022, 27, 354. [Google Scholar] [CrossRef] [PubMed]
- Sadati, A.K.; Nayedar, M.; Nayedar, L.; Falakodin, Z. Challenges for food security and safety: A qualitative study in an agriculture supply chain company in Iran. Agric. Food Secur. 2021, 10, 41. [Google Scholar] [CrossRef] [PubMed]
- Röck, F.; Barsan, N.; Weimar, U. Electronic nose: Current status and future trends. Chem. Rev. 2008, 108, 705–725. [Google Scholar] [CrossRef] [PubMed]
- Aladhadh, M. A review of modern methods for the detection of foodborne pathogens. Microorganisms 2023, 11, 1111. [Google Scholar] [CrossRef] [PubMed]
- Dhal, S.B.; Kar, D. Leveraging artificial intelligence and advanced food processing techniques for enhanced food safety, quality, and security: A comprehensive review. Discov. Appl. Sci. 2025, 7, 75. [Google Scholar] [CrossRef]
- Ma, T.; Wang, H.; Wei, M.; Lan, T.; Wang, J.; Bao, S.; Ge, Q.; Fang, Y.; Sun, X. Application of smart-phone use in rapid food detection, food traceability systems, and personalized diet guidance, making our diet more health. Food Res. Int. 2022, 152, 110918. [Google Scholar] [CrossRef] [PubMed]
- Sempionatto, J.R.; Montiel, V.R.-V.; Vargas, E.; Teymourian, H.; Wang, J. Wearable and mobile sensors for personalized nutrition. ACS Sens. 2021, 6, 1745–1760. [Google Scholar] [CrossRef] [PubMed]
- Page, M.J.; McKenzie, J.E.; Bossuyt, P.M.; Boutron, I.; Hoffmann, T.C.; Mulrow, C.D.; Shamseer, L.; Tetzlaff, J.M.; Akl, E.A.; Brennan, S.E.; et al. The PRISMA 2020 statement: An updated guideline for reporting systematic reviews. BMJ 2021, 372, n71. [Google Scholar] [CrossRef] [PubMed]


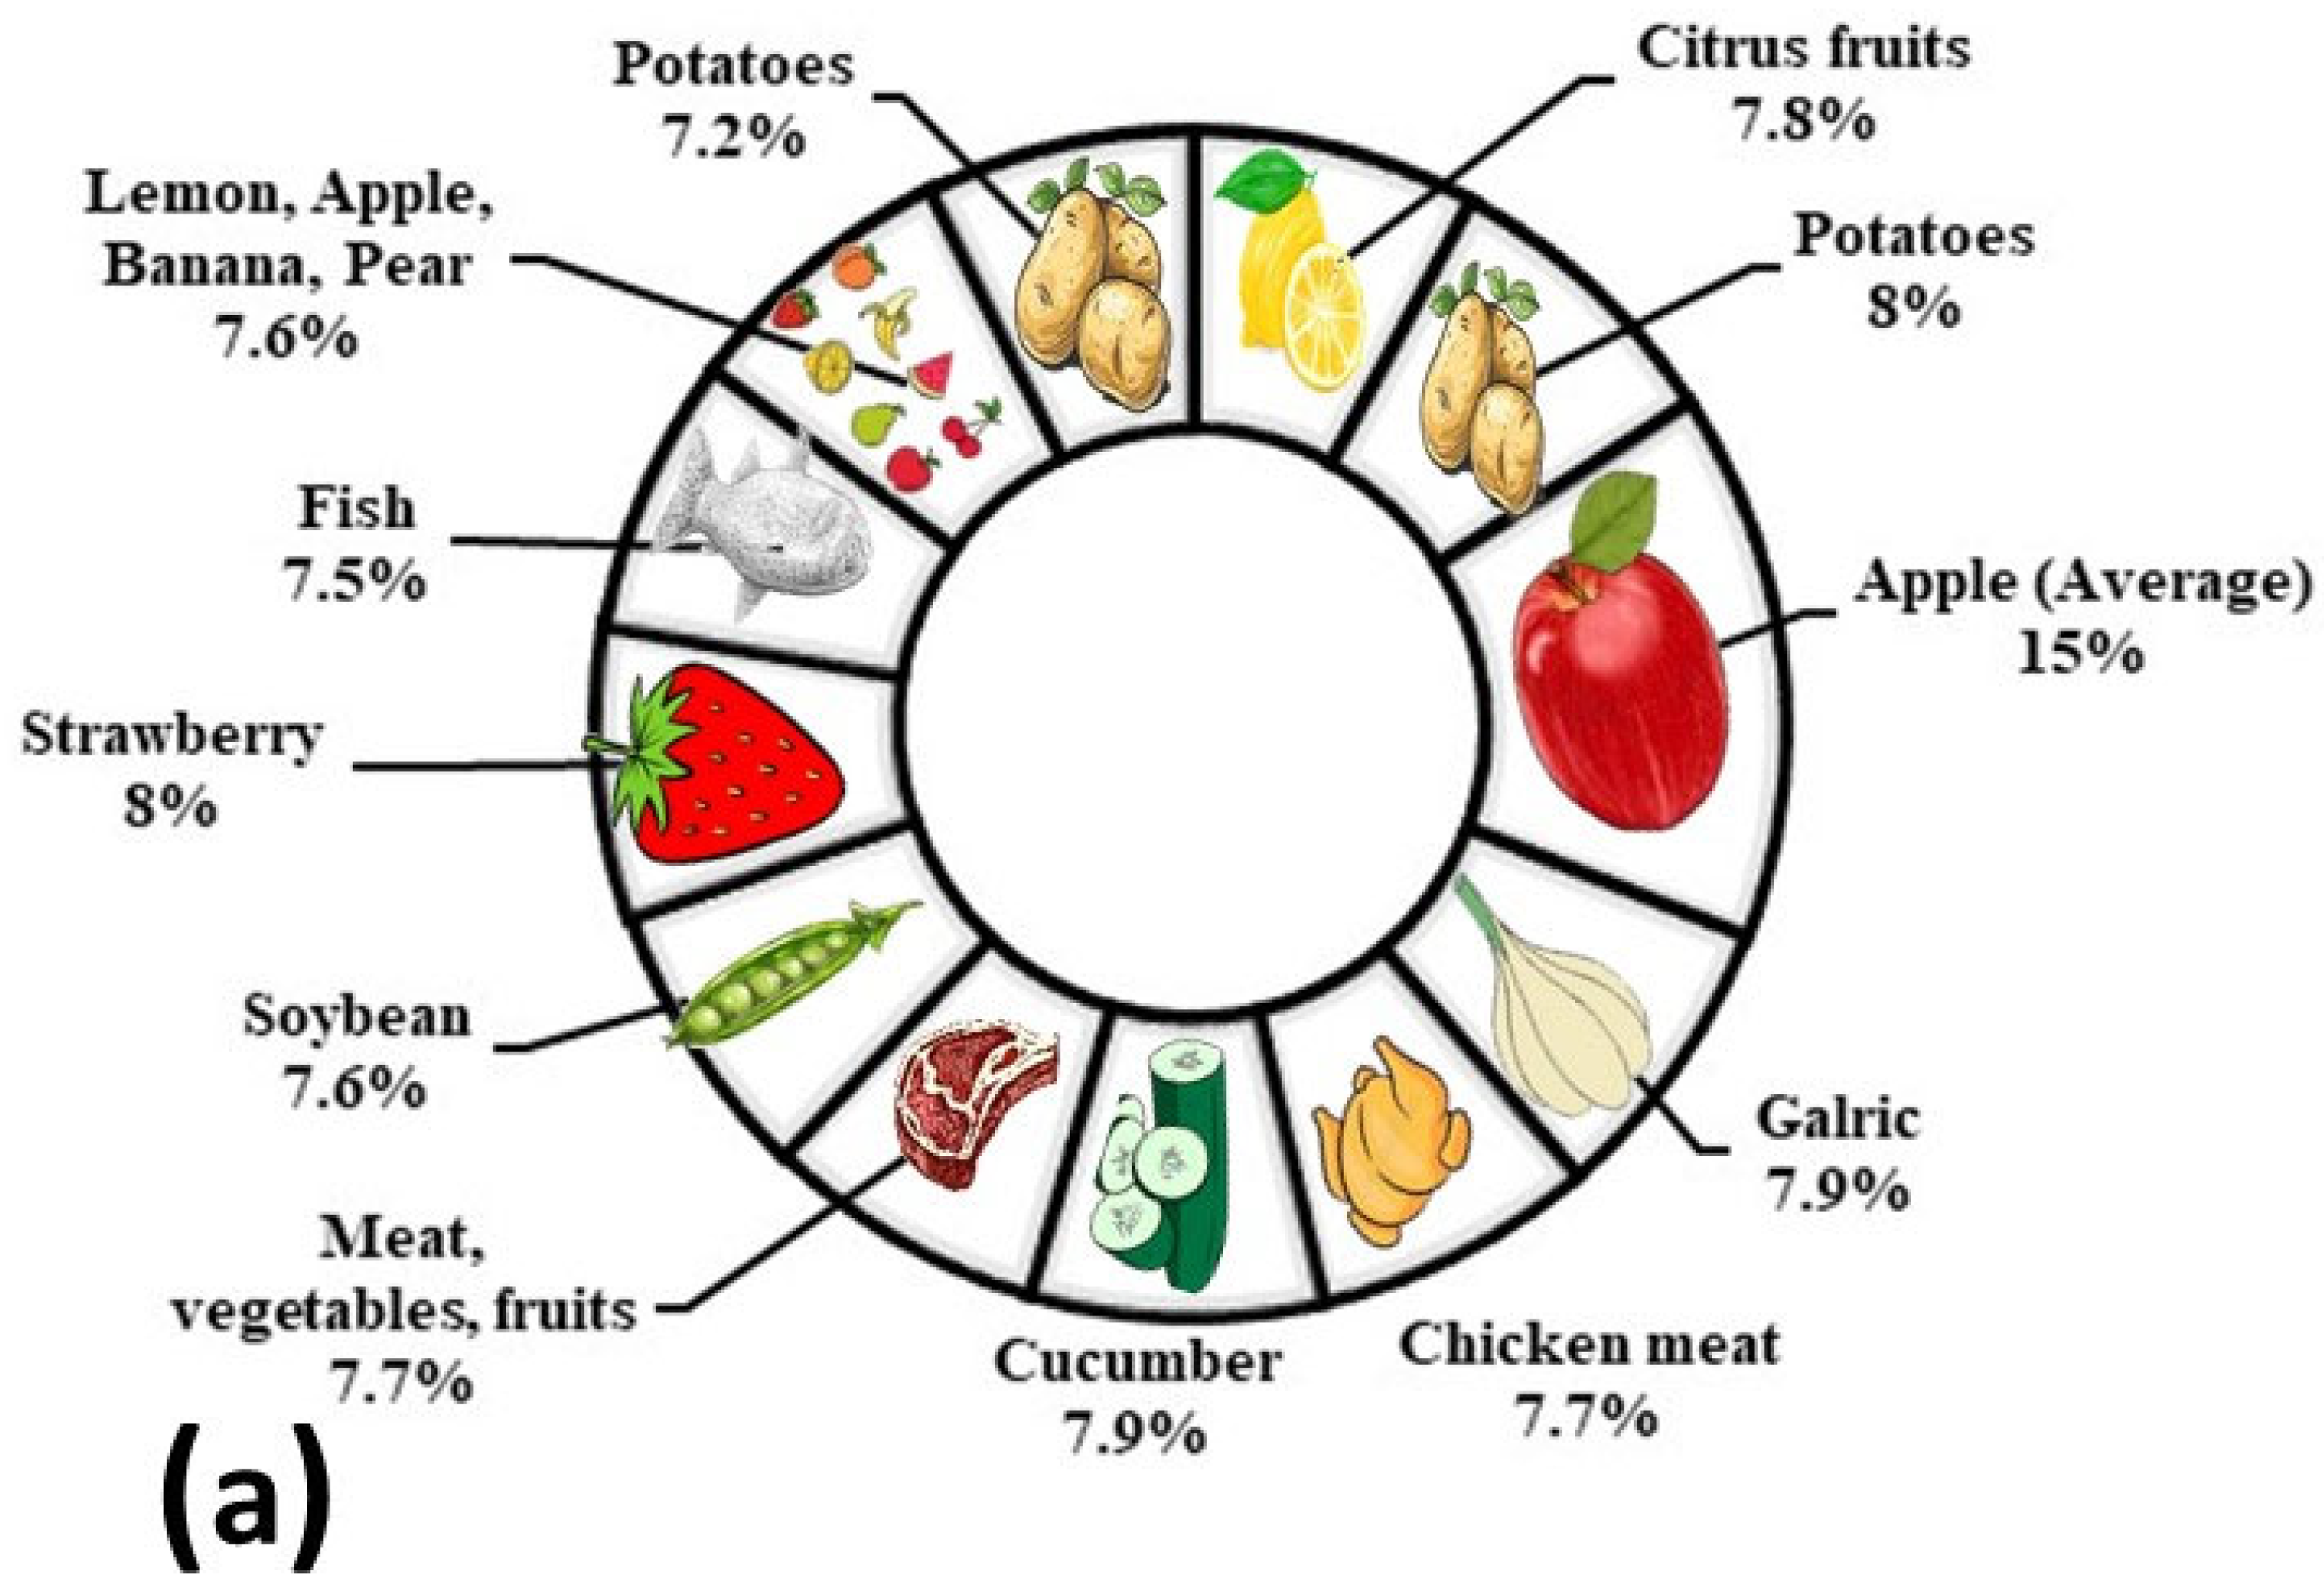
| Food Samples | Analyte | Analysis | Accuracy/Sensitivity (%) | Citations (Jan-2025) | Countries | Publication Year | Ref. |
|---|---|---|---|---|---|---|---|
| e-nose in food quality, safety and storage | |||||||
| Olive oil | - | - | - | 6 | Ireland | 2015 | [43] |
| Citrus fruits | Chitosan | LDA | 97.5 | 178 | China | 2017 | [44] |
| - | - | - | (Original groups) | - | - | - | - |
| Potatoes | Soft-rot | PCA | 100 | 50 | UK | 2018 | [45] |
| Apple | Pathogen | PCA | <90.5 | 65 | India | 2018 | [46] |
| Apple | Pathogens | BPNN | 96.3 (Group A) | 112 | China | 2019 | [47] |
| Meat, vegetables, | Gases | - | 96.2 | 54 | China | 2018 | [48] |
| fruits | - | ||||||
| Soybean | Gases | LDA/PCA | 94.4 | 2 | Brazil | 2024 | [49] |
| Strawberry | VOCs | LS-SVM | 99.2 | 14 | China | 2020 | [50] |
| e-nose in food security | |||||||
| Garlic | - | PCA | 99 | 203 | Thailand | 2015 | [51] |
| Cucumber | Urea | LDA-QDA | 98.7 | 41 | Iran | 2022 | [52] |
| e-nose in shelf monitoring of food | |||||||
| Chicken meat | E-coli | PCA | 95.7 | 41 | Indonesia | 2021 | [53] |
| Fish | Microorganisms | PCA | 93.4 | - | Spain | 2020 | [54] |
| Barattiere | VOCs | PLS | - | 3 | Italy | 2024 | [55] |
| Lemon, Apple, | Climacteric-fruits | CNN | 94.6 | 4 | India | 2021 | [56] |
| Banana, Pear | - | - | - | - | - | - | |
| Potatoes | Sugar, Carbohydrates | QDA/MDA | <90.0 | 12 | Iran | 2023 | [57] |
| e-tongue in food quality assessment | |||||||
| Beers | - | PCA, LDA | 100 | 130 | Spain | 2012 | [58] |
| Grapes | Sugar, Phenol | PCA | - | 23 | Spain | 2016 | [59] |
| Olive oil | Bitterness | PCA, PLS-DA | 97.4 | 39 | Spain | 2019 | [60] |
| Plum juice | M. fructigena | LDA | - | 20 | Hungary | 2021 | [61] |
| Red meat, Poultry | Adulteration check | LDA | 100 | 32 | Hungary | 2021 | [62] |
| - | - | - | - | - | - | - | |
| e-tongue in food contamination | |||||||
| Water | 1 E. f, S.a, E. C, | LDA-SA | 100 | 19 | Portugal | 2021 | [63] |
| - | P. A, | - | - | - | - | - | - |
| Water | E. Coli | PCA | 97.6 | 8 | Colombia | 2019 | [64] |
| Water | 2-MethylIsoborneol | PCA | 86 | 7 | R. Korea | 2023 | [65] |
| Milk | E. Coli | PCA | 98.7 | 21 | Colombia | 2021 | [66] |
| Water | Cyanobacteria | - | 10−6 mol/L(LOD) | 51 | Italy | 2016 | [67] |
| List of abbreviations for mentioned analysis with comparison of their advantages and possible disadvantages | |||||||
| LDA | Linear discriminant analysis | The advantage of using LDA for the analysis of text is to represent a large amount of data [68] in short descriptions to represent various topics with speed. The major disadvantage of standardized LDA is that multiple tuning parameter [69] sets can yield the same cross-validation error, yet result in significantly different test errors, making the selection of optimal parameters challenging. | |||||
| PCA | Principal component analysis | The objective of PCA is to characterize the data in as [70] limited an extent as possible and to obtain consistent results for the analysis. The disadvantages include the requirement of the suitability of 2D face image with [71] a 1D vector. | |||||
| BPN-N | Backpropagation neural network | Used for educating the accuracies in different functioning environments [72] | |||||
| LS-SVM | Least squares support vector machine | Helpful to improve training efficiency and to solve linear equations [73]. Limitation includes time consumption and demanding for huge space [74] | |||||
| QDA | Quadratic discriminant analysis | Have the advantage to use for binary cataloguing problems [75]. | |||||
| CNN | Convolutional neural network | CNN is helpful for such problem having object detection, image segmentation and classification [76] The limitation may include the requirement for large, expertly annotated [77] datasets, which demand domain-specific expertise and need large time. | |||||
| PLS | Partial least square | Use for the investigation of valuable information to extracts array of activity [78] and to support a concern among enterprise elements. | |||||
| PLSR | Partial least squares regression | Combine the advantages of PCA and canonical correlation analysis to remove [79] batch affects. | |||||
| PLS-DA | Partial least square-discriminant analysis | - | |||||
| LRA | Linear regression analysis | - | |||||
| MDA | Multivariate discrimination analysis | - | |||||
| Food Samples | Purpose | Algorithms Used (Analysis) | Year | Ref. |
|---|---|---|---|---|
| E-nose | ||||
| Sardines | Freshness | PCA | 2007 | [104] |
| Milk | Adulteration | PCA/LDA | 2007 | [105] |
| Egg | Storage time and quality | 1 GANN/BPNN (better result) | 2009 | [106] |
| Sesame oil | Adulteration | PCA/LDA | 2023 | [107] |
| Almonds | Detection of contaminants chemical process | PCA | 2023 | [108] |
| Beef and pork | Adulteration | LDA | 2020 | [109] |
| Coffee | Volatile compounds | PCA | 2022 | [110] |
| Coffee | Coffee aroma | PCA | 2022 | [111] |
| Potatoes | VOCs | SVR | 2022 | [99] |
| Wheat bread | VOCs | - | 2021 | [112] |
| Wheat bread | VOCs | - | 2020 | [113] |
| Rapeseed oil | VOCs | PCA | 2019 | [114] |
| E-tongue | ||||
| Water | Differentiation of bacteria | LDA-SA | 2021 | [63] |
| Milk | Adulteration | PCA/PLA | 2024 | [115] |
| Water | Pesticides | PCA/LDA | 2023 | [116] |
| Melipona scutellaris honey | Characterization | PCA | 2022 | [117] |
| Fat and milk | Tetracycline | PCA | 2016 | [118] |
| Techniques | Advantages | Ref. |
|---|---|---|
| E-nose | Greater precision and reliability. | [119] |
| Robust to various environmental conditions and accurate interpretation of data. | [119] | |
| Fast and noninvasive technique; needs little or no sample preparation. | [120] | |
| Provides real-time and automated measurements; advantages of portability and ease of use. | [120] | |
| Flexibility and time-saving technique. | [121] | |
| Limitations | ||
| Hardware friendliness and anti-noise capability. | [122] | |
| Poor selectivity and susceptibility. | [123] | |
| Requires periodic recalibration; susceptible to interfering gases and environmental factors; limited range of applications and sensor limitations. | [120] | |
| E-Tongue | Advantages | |
| It can select many different (both specific and less specific) membranes for its electrodes. | [22] | |
| Low cost; simple manufacturing and assembly; long-term stability and ability to taste toxic compounds. | [124] | |
| Limitations | ||
| Sensitive to temperature. | [22] | |
| Adsorption of components and influence of changes in solution composition; | [124] | |
| pretreatment of samples and short lifetime of components; needs skilled person. | [125] |
Disclaimer/Publisher’s Note: The statements, opinions and data contained in all publications are solely those of the individual author(s) and contributor(s) and not of MDPI and/or the editor(s). MDPI and/or the editor(s) disclaim responsibility for any injury to people or property resulting from any ideas, methods, instructions or products referred to in the content. |
© 2025 by the authors. Licensee MDPI, Basel, Switzerland. This article is an open access article distributed under the terms and conditions of the Creative Commons Attribution (CC BY) license (https://creativecommons.org/licenses/by/4.0/).
Share and Cite
Zia Ul Haq, M.; Singh, B.; Fuku, X.; Barhoum, A.; Tian, F. A Systematic Review of the Use of Electronic Nose and Tongue Technologies for Detecting Food Contaminants. Chemosensors 2025, 13, 262. https://doi.org/10.3390/chemosensors13070262
Zia Ul Haq M, Singh B, Fuku X, Barhoum A, Tian F. A Systematic Review of the Use of Electronic Nose and Tongue Technologies for Detecting Food Contaminants. Chemosensors. 2025; 13(7):262. https://doi.org/10.3390/chemosensors13070262
Chicago/Turabian StyleZia Ul Haq, Muhammad, Baljit Singh, Xolile Fuku, Ahmed Barhoum, and Furong Tian. 2025. "A Systematic Review of the Use of Electronic Nose and Tongue Technologies for Detecting Food Contaminants" Chemosensors 13, no. 7: 262. https://doi.org/10.3390/chemosensors13070262
APA StyleZia Ul Haq, M., Singh, B., Fuku, X., Barhoum, A., & Tian, F. (2025). A Systematic Review of the Use of Electronic Nose and Tongue Technologies for Detecting Food Contaminants. Chemosensors, 13(7), 262. https://doi.org/10.3390/chemosensors13070262