Article

Coffees Brewed from Standard Capsules Help to Compare Different Aroma Fingerprinting Technologies—A Comparison of an Electronic Tongue and Electronic Noses

1
Department of Food Measurement and Process Control, Institute of Food Science and Technology, Hungarian University of Agriculture and Life Sciences, 1118 Budapest, Hungary
2
ADEXGO Kft. Correltech Laboratory, 1222 Budapest, Hungary
3
Agricultural and Food Research Center, Széchenyi István University, 9026 Győr, Hungary
4
School of Agriculture, College of Agriculture and Natural Sciences, University of Cape Coast, Cape Coast, Ghana
5
Independent Researcher, 6330 Kufstein, Austria
*
Author to whom correspondence should be addressed.
Chemosensors 2025, 13(7), 261; https://doi.org/10.3390/chemosensors13070261
Submission received: 21 May 2025 / Revised: 11 July 2025 / Accepted: 12 July 2025 / Published: 18 July 2025
(This article belongs to the Special Issue Electronic Nose and Electronic Tongue for Substance Analysis)

Abstract

With the development of various new types of instrumental aroma sensing technologies, there is a need for methodologies that help developers and users evaluate the performance of the different devices. This study introduces a simple method that uses standard coffee beverages, reproducible worldwide, thus allowing users to compare aroma sensing devices and technologies globally. Eight different variations of commercial coffee capsules were used to brew espresso coffees (40 mL), consisting of either Arabica coffee or a blend of Robusta and Arabica coffee, covering a wide range of sensory attributes. The AlphaMOS Astree electronic tongue (equipped with sensors based on chemically modified field-effect transistor technology) and the AlphaMOS Heracles NEO and the Volatile Scout3 electronic noses (both using separation technology based on gas chromatography) were used to describe the taste and odor profiles of the freshly brewed coffee samples and also to compare them to the various sensory characteristics declared on the original packaging, such as intensity, roasting, acidity, bitterness, and body. Linear discriminant analysis (LDA) results showed that these technologies were able to classify the samples similarly to the pattern of the coffees based on the human sensory characteristics. In general, the arrangement of the different coffee types in the LDA results—i.e., the similarities and dissimilarities in the types based on their taste or smell—was the same in the case of the Astree electronic tongue and the Heracles electronic nose, while slightly different arrangements were found for the Scout3 electronic nose. The results of the Astree electronic tongue and those of the Heracles electronic nose showed the taste and smell profiles of the decaffeinated coffees to be different from their caffeinated counterparts. The Heracles and Scout3 electronic noses provided high accuracies in classifying the samples based on their odor into the sensory classes presented on the coffee capsules’ packaging. Despite the technological differences in the investigated devices, the introduced coffee test could assess the similarities in the taste and odor profiling capacities of the aroma fingerprinting technologies. Since the coffee capsules used for the test can be purchased all over the world in the same quality, these coffees can be used as global standard samples during the comparison of different devices applying different measurement technologies. The test can be used to evaluate instrumentational and data analytical developments worldwide and to assess the potential of novel, cost-effective, accurate, and rapid solutions for quality assessments in the food and beverage industry.

Graphical Abstract

1. Introduction

The beverage made from coffee (Coffea spp.) is one of the most widely consumed products around the globe because of its health benefits [1] and unique taste and aroma [2]. In clinical research, coffee consumption is associated with decreased rates of neurological and metabolic diseases, including Parkinson’s disease and type 2 diabetes [3]. Likewise, in a consumer preference and acceptance test, coffee’s unique taste and aroma were strongly associated with the product’s acceptability or likeness on the market [2]. It is therefore not surprising that coffee is one of the most widely studied plantation crops in the world [4]. Industrially, the coffee beverage is mostly produced from the two major species of the coffee crop, scientifically classified as Coffea arabica and Coffea canephora, commonly known as Arabica and Robusta, respectively [5]. Arabica coffee is considered superior because of its desired flavor, constituting about 60% of the world’s coffee production [6]. Arabica is associated with a fruity flavor, whereas Robusta has an earthy flavor [7]. Regarding taste, Robusta is reported to be more bitter than Arabica, which may be the reason why Arabica is grown in much greater quantities than Robusta, as it is considered to be mild in taste. The bitterness of Robusta is associated with the high caffeine content [8]. It is important to mention that, in addition to the genetic makeup of the coffee types, the climatic environment or geographical location where the coffee was cultivated, and the techniques applied during processing, for example, roasting, may impact the sensory properties of the coffee beverage, such as aroma or flavor and taste [9]. The development and application of correlative analytical methods in the food industry, over the years, have made the rapid evaluation of food or beverages very easy, efficient, and cost-effective [10]. Sensor technologies, such as the electronic nose [11,12,13] and tongue [14], have come to complement the existing conventional flavor, aroma, and taste testing methods of food beverages, such as the long-tested nine-point hedonic [15] scale, which employs the services of professional sensing panelists, to meet the expected needs of the final consumer in the food value chain. The challenges that characterize the existing conventional quality testing methods, such as the cost of hiring professionals, the subjectivity of sensory scores [16,17], especially when panelists are not well trained, and the time needed for human sensory evaluation, are all drastically reduced when the electronic nose and tongue are used [18]. As an analytical instrument, the electronic tongue is made of an array of nonspecific, low-selective chemical sensors with high stability and cross-sensitivity to different substances in solution [19]. The electronic nose, on the other hand, is made up of heterogeneous electrochemical gas sensors with partial specificity and a pattern recognition system capable of recognizing odors or smells based on changes in the sensors’ signals [18,20]. The application of chemometrics and the selection and utilization of appropriate methods of multivariate data processing of the sensor data from both technologies (electronic nose and tongue) make it possible to differentiate the aroma and taste differences in the food beverage analyzed [19,20].
Some studies have already attempted to use the electronic nose to classify coffee beans based on their aroma profiles [21]. This present study used brewed coffee for three reasons: (1) the sensory evaluation of brewed coffee samples is known to consumers, thus allowing us to best correlate the instrumental technologies with human impressions, (2) sensory data provided by the manufacturer were available for brewed coffees, and (3) the same type of sample was meant to be used throughout the whole study, and electronic tongue measurements require liquid samples; therefore, all tests were performed with the same material. The objective was to establish a simple test using coffee brewed from capsules available worldwide as “standard samples”, enabling users to compare different aroma fingerprinting technologies globally. Therefore, a comparison of the electronic tongue and two types of electronic nose technology was performed.

2. Materials and Methods

2.1. Coffee Samples

Eight different types of Nespresso® coffee capsules were used in all experiments [22]. The capsules represented distinct geographical origins and broad variations in flavor properties, and they were pure Arabica or blended Arabica–Robusta types. The selection of the coffee types was based on their availability on the international market, suitability for brewing espresso (the capsule to be recommended for espresso size), and variety of sensory properties. These made the eight selected types appropriate for evaluating the aroma profiling capabilities of the investigated technologies. The origin and roasting type of the different Nespresso® types are summarized in Table 1. The geographical origin was highly diverse, but it was not the aim of this study to test the aroma profiling technologies to identify geographical regions.
All capsules were purchased in official Nespresso® stores and used within a few weeks after purchase. Until then, the vacuum-sealed capsules were stored at room temperature and humidity. For the samples analyzed at the Hungarian partners, a De’Longhi Nespresso U EN110.B coffee machine (De’Longhi S.p.A., Treviso, Italy) was used to brew three replicates of espresso coffees of the eight different types of Nespresso® capsules, resulting in 40 mL of liquid per each brewing (n = 24). At the Lithuanian partner, a KRUPS Essenza Mini coffee machine (KRUPS GmbH, Solingen, Germany) was used in the same way as explained above. The coffees were brewed freshly before electronic nose and electronic tongue analyses, and the cold liquids were used for measurements within 6 h.
Table 2 shows the types of Nespresso® coffee capsules used and the sensory properties of the brewed coffees listed on the original packaging of the capsule types. Further on within this paper, during the evaluations of the predictability of the different values of the variables, the values will be indicated by V plus the respective value. E.g., intensity goes from V4 to V11, while roasting goes from V2 to V5, etc.
Decaffeinated versions, such as “Ristretto decaffeinato” and “Volluto decaffeinato”, have similar intensity, roasting levels, acidity, bitterness, and body as their caffeinated counterparts. This suggests that the removal of caffeine does not significantly change the flavor profile of the coffee. Robusta–Arabica blends generally show higher intensity and body compared with pure Arabica varieties.
A correlation matrix showing the relationships between the different sensory parameters of the coffees (intensity, roast level, acidity, bitterness, and body) can be seen in Table 3.
There is a strong positive correlation between intensity and roasting, meaning more intense coffees are more heavily roasted. Intensity and roasting also have a strong positive correlation with bitterness and body, but a moderately negative correlation with acidity. There is a negative correlation between acidity and bitterness, indicating that more acidic coffees are less bitter. Acidity also negatively correlates with body. Overall, higher intensity, roasting, and bitterness are associated with fuller-bodied but less acidic coffees.
Figure 1 shows the results of a principal component analysis (PCA) based on the factory data of the investigated coffees. The first principal component, PC1, explains the majority of the variance, i.e., 95.98%, suggesting that it captures the most significant differences among the capsules. These differences likely revolve around intensity and roasting level, as these characteristics fundamentally influence the flavor of the coffee. This is reflected in the positioning of the “India” capsule, which is significantly separated from the others on the PC1 axis to the right, due to its considerably higher intensity and roasting level compared with the other capsules. The second principal component, PC2, explains much less of the variance, which indicates that the variables it represents are less crucial for understanding the differences among the capsules. PC2 likely reflects other, less dominant characteristics, or ones with little variation, such as acidity or body. The 2-dimensional plane of PC1 and PC2 is stretched between the “India” and “Ethiopia” coffees, representing the extremities in all parameters.

2.2. Electronic Tongue Measurements with Astree

Each freshly brewed 40 mL sample was diluted tenfold for electronic tongue (e-tongue) measurements. Each diluted solution (100 mL) was added to beakers and measured four times (with different orders of the samples in the four sequences) using an Alpha Astree potentiometric e-tongue (AlphaMOS, Toulouse, France) at the Hungarian University of Agriculture and Life Sciences, Department of Food Measurement and Process Control, Hungary, equipped with a Ag/AgCl reference electrode and seven chemically modified field-effect transistor (ChemFET) sensors (ZZ, AB, GA, BB, CA, DA, JE) with an organic membrane coating developed for liquid food analysis. These sensors were optimized for detecting taste profiles in liquid samples, particularly in food and beverage applications. Each sensor in the array was sensitive to specific ions and organic compounds, operating by capturing potential variances against a Ag/AgCl reference electrode. The sensors were cross-sensitive and cross-selective. This allowed for a comprehensive analysis of the taste and flavor profiles. AlphaSoft v12 software (Alpha MOS, Toulouse, France) was used to operate the e-tongue and acquire data. During each measurement, the relative potential difference was recorded on each of the seven sensors for 120 s. However, only the average voltage signals from the last 10 s were used for analysis, as this period corresponded to the sensors’ stable state. These data were then exported for drift correction to enhance the e-tongue sensor signals and for statistical evaluation [23,24].

2.3. Electronic Nose Measurements with Heracles Neo

One round of instrumental aroma profile measurement was carried out using an Alpha MOS Heracles NEO electronic nose (Alpha MOS, Toulouse, France) in the Correltech Laboratory of ADEXGO Kft., Hungary, equipped with an HS100 PAL-RSI autosampler unit (CTC Analytics AG, Zwingen, Switzerland). AlphaSoft v16 (Alpha MOS, Toulouse, France) software was used to operate the electronic nose (e-nose) and for data acquisition. Two vials of each brew (totaling 48) were prepared for the e-nose measurements: 1 mL was measured into 20 mL headspace vials, which were sealed with magnetic caps with PTFE–silicon septa. The autosampler was set to incubate each sample to generate the saturated headspace containing the highest concentration of volatile compounds over the liquid samples before each headspace injection. The Heracles analyzer uses flash gas chromatography technology, including a trap, two gas chromatography columns (column-1: MXT-5, column-2: MXT-1701; Restek, Bellefonte, PA, USA), and two flame ionization detectors (FID-1, FID-2).
Based on the preliminary experiments with the coffee samples, and the intention to imitate human consumption and sensing, incubation at 40 °C for 10 min at 500 rpm agitation was applied on the autosampler, followed by the injection of 2 mL of the gas sample from the headspace into the analyzer using a pre-heated Hamilton syringe at 60 °C. Further parameters and settings of the e-nose gas chromatography unit included the following: column types: Restek MXT-5 (10 m, more apolar polysiloxane stationary phase), Restek MXT-1701 (10 m, more polar polysiloxane stationary phase) (Restek Co., Bellefonte, PA, USA); carrier gas: hydrogen (FID-grade, with an ultra-high purity of 99.999%); carrier gas flow rate: 30 mL/min; trapping temperature: 30 °C; initial oven temperature: 50 °C; endpoint of oven heating: 250 °C; heating rate: 2 °C/s; acquisition duration: 110 s; acquisition period: 0.01 s; and sample gas injection speed: 125 μL/s.
The retention times of the volatiles were recorded at both FIDs, followed by a conversion to Kovats retention indices, which relate the retention times of the detected volatile molecules of a sample to the retention times of n-alkanes under the same conditions. The chromatograms, i.e., the signal intensities measured on the FIDs as a function of the retention time or the retention index, described the aroma profiles. The chromatograms were transformed into a multivariate dataset, where each chromatogram peak was identified as a virtual sensor, named by the position of the peak along the retention index scale, and the intensity of the virtual sensor was derived from the area under the respective chromatogram peak.

2.4. Electronic Nose Measurements with Scout3

The second round of instrumental aroma profile measurement was carried out using the Volatile Scout3 (Volatile Technologies LT UAB, Vilnius, Lithuania) e-nose, a portable gas chromatograph, at Volatile Technologies LT UAB, Lithuania, equipped with three different photoionization detectors (PIDs), with 10.0, 10.6, and 11.7 eV ionization energy. The system utilizes its own internal software package. The chromatography column used is MXT-5 (10 m, more apolar polysiloxane stationary phase) from Restek, Bellefonte, PA, USA.
The sample collection involved adding 2 mL of brewed room-temperature coffee to the sample vial, sealing it manually using a threaded cap, and sample warm-up for 15 min. Once the system and sample were ready, sampling started and lasted for 5 min. The results were displayed on the screen as lab-like chromatograms of the chemical composition signal.
The samples were injected using a dynamic headspace method, where volatiles from the vial were swept into the system. The sample passed through the Restek MXT-5 column into an aluminum chamber equipped with PID detectors. Filtered ambient air, free from humidity and contamination, served as the carrier gas. The GC column operated at an isothermal temperature of 40 °C.
The aroma profiles were represented by chromatograms, which recorded signal intensities from the PIDs as a function of the retention time or the retention index. These chromatograms were processed into a multivariate dataset, with each chromatogram peak identified as a virtual sensor, named according to its position on the retention index scale. The intensity of each virtual sensor was determined by the area under the corresponding chromatogram peak.

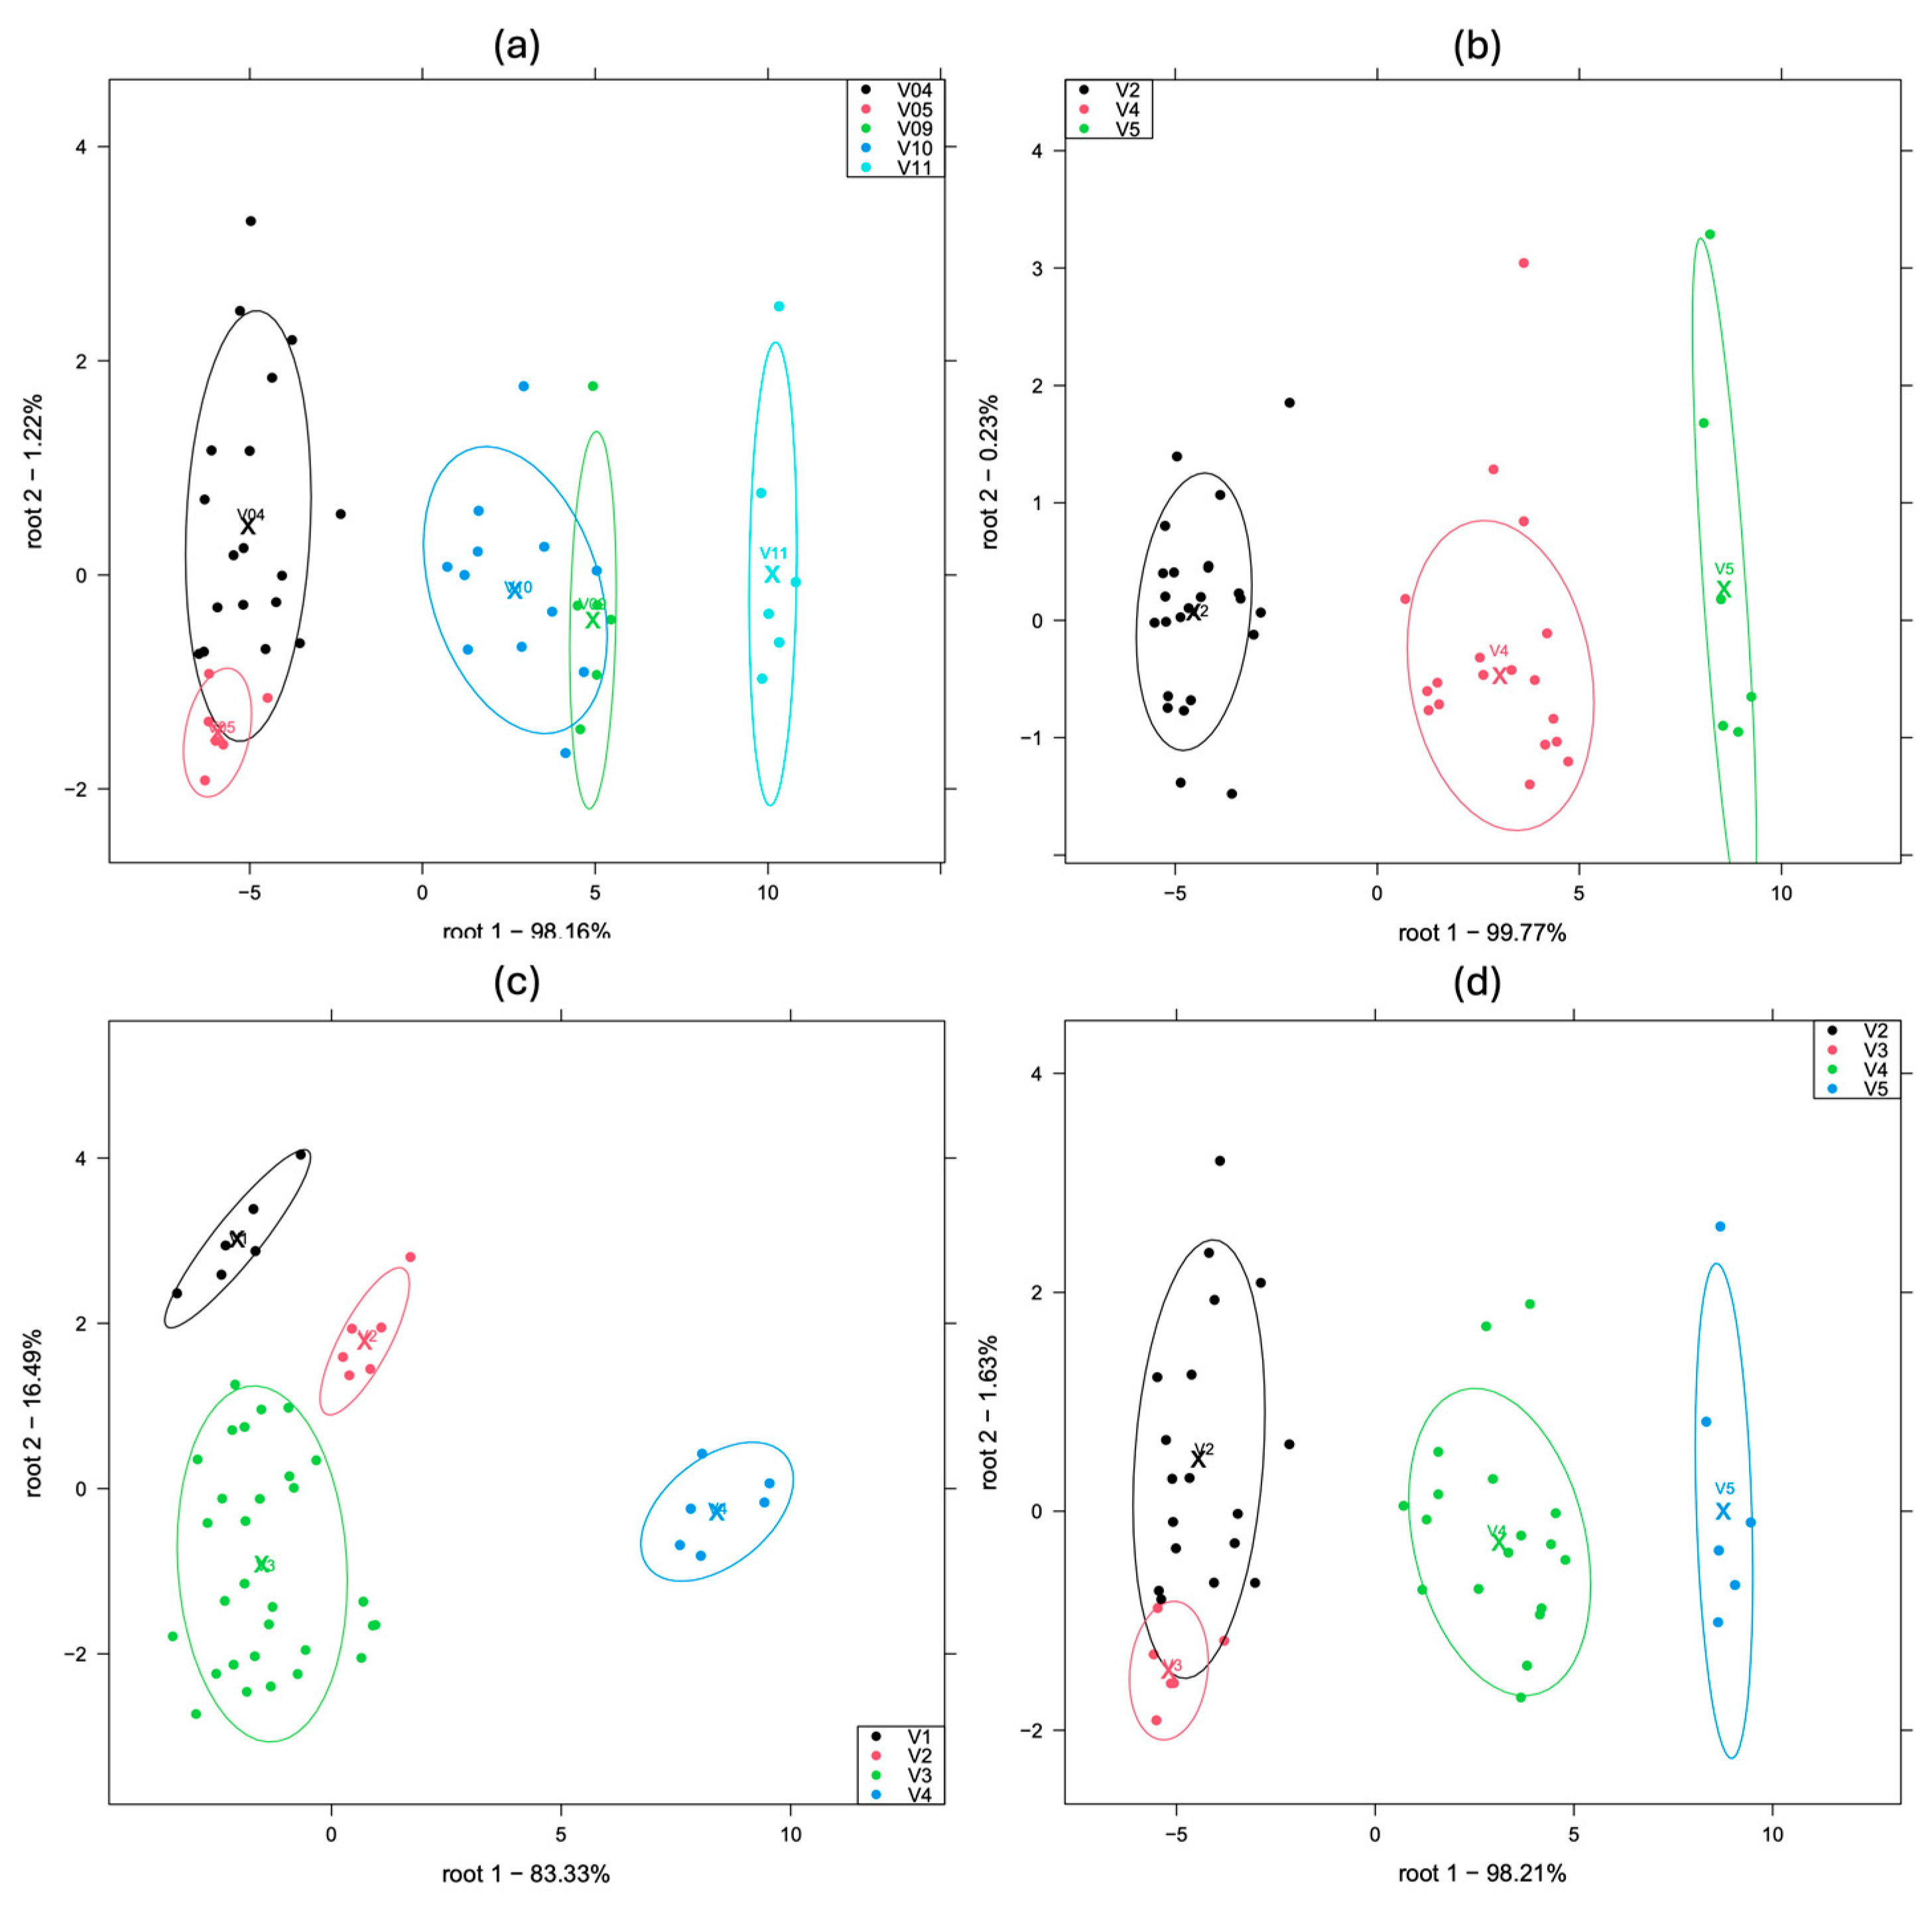
2.5. Multivariate Analysis of the E-Tongue and E-Nose Data

During the evaluation of data recorded with each technology, principal component analysis (PCA) was utilized to identify outliers, which were removed. Linear discriminant analysis (LDA) based on the PCA was performed to classify the samples according to the eight different types of Nespresso® coffees and then according to intensities (with levels of V4, V5, V9, V10, V11), roasting (V2, V4, V5), acidity (V1, V2, V3, V4), bitterness (V2, V3, V4, V5), body (V2, V4), and coffee blend (Arabica, Robusta–Arabica). In these analyses, the principal component scores served as the input for the LDA models. The supervised classification approach of LDA helped to identify the axes (linear combinations of the principal components) along which the samples showed the most significant differences between groups, while having minimal variations within the groups, allowing for a clear distinction between groups based on their flavor or odor profiles. Full (leave-one-out) cross-validations [25] were used to determine the optimal number of principal components for the LDA model training and to calculate the classification accuracies (i.e., hit rate). The data analysis was carried out in R-project (4.2.0) software using the “aquap 2” package (0.4.2) [26].

3. Results

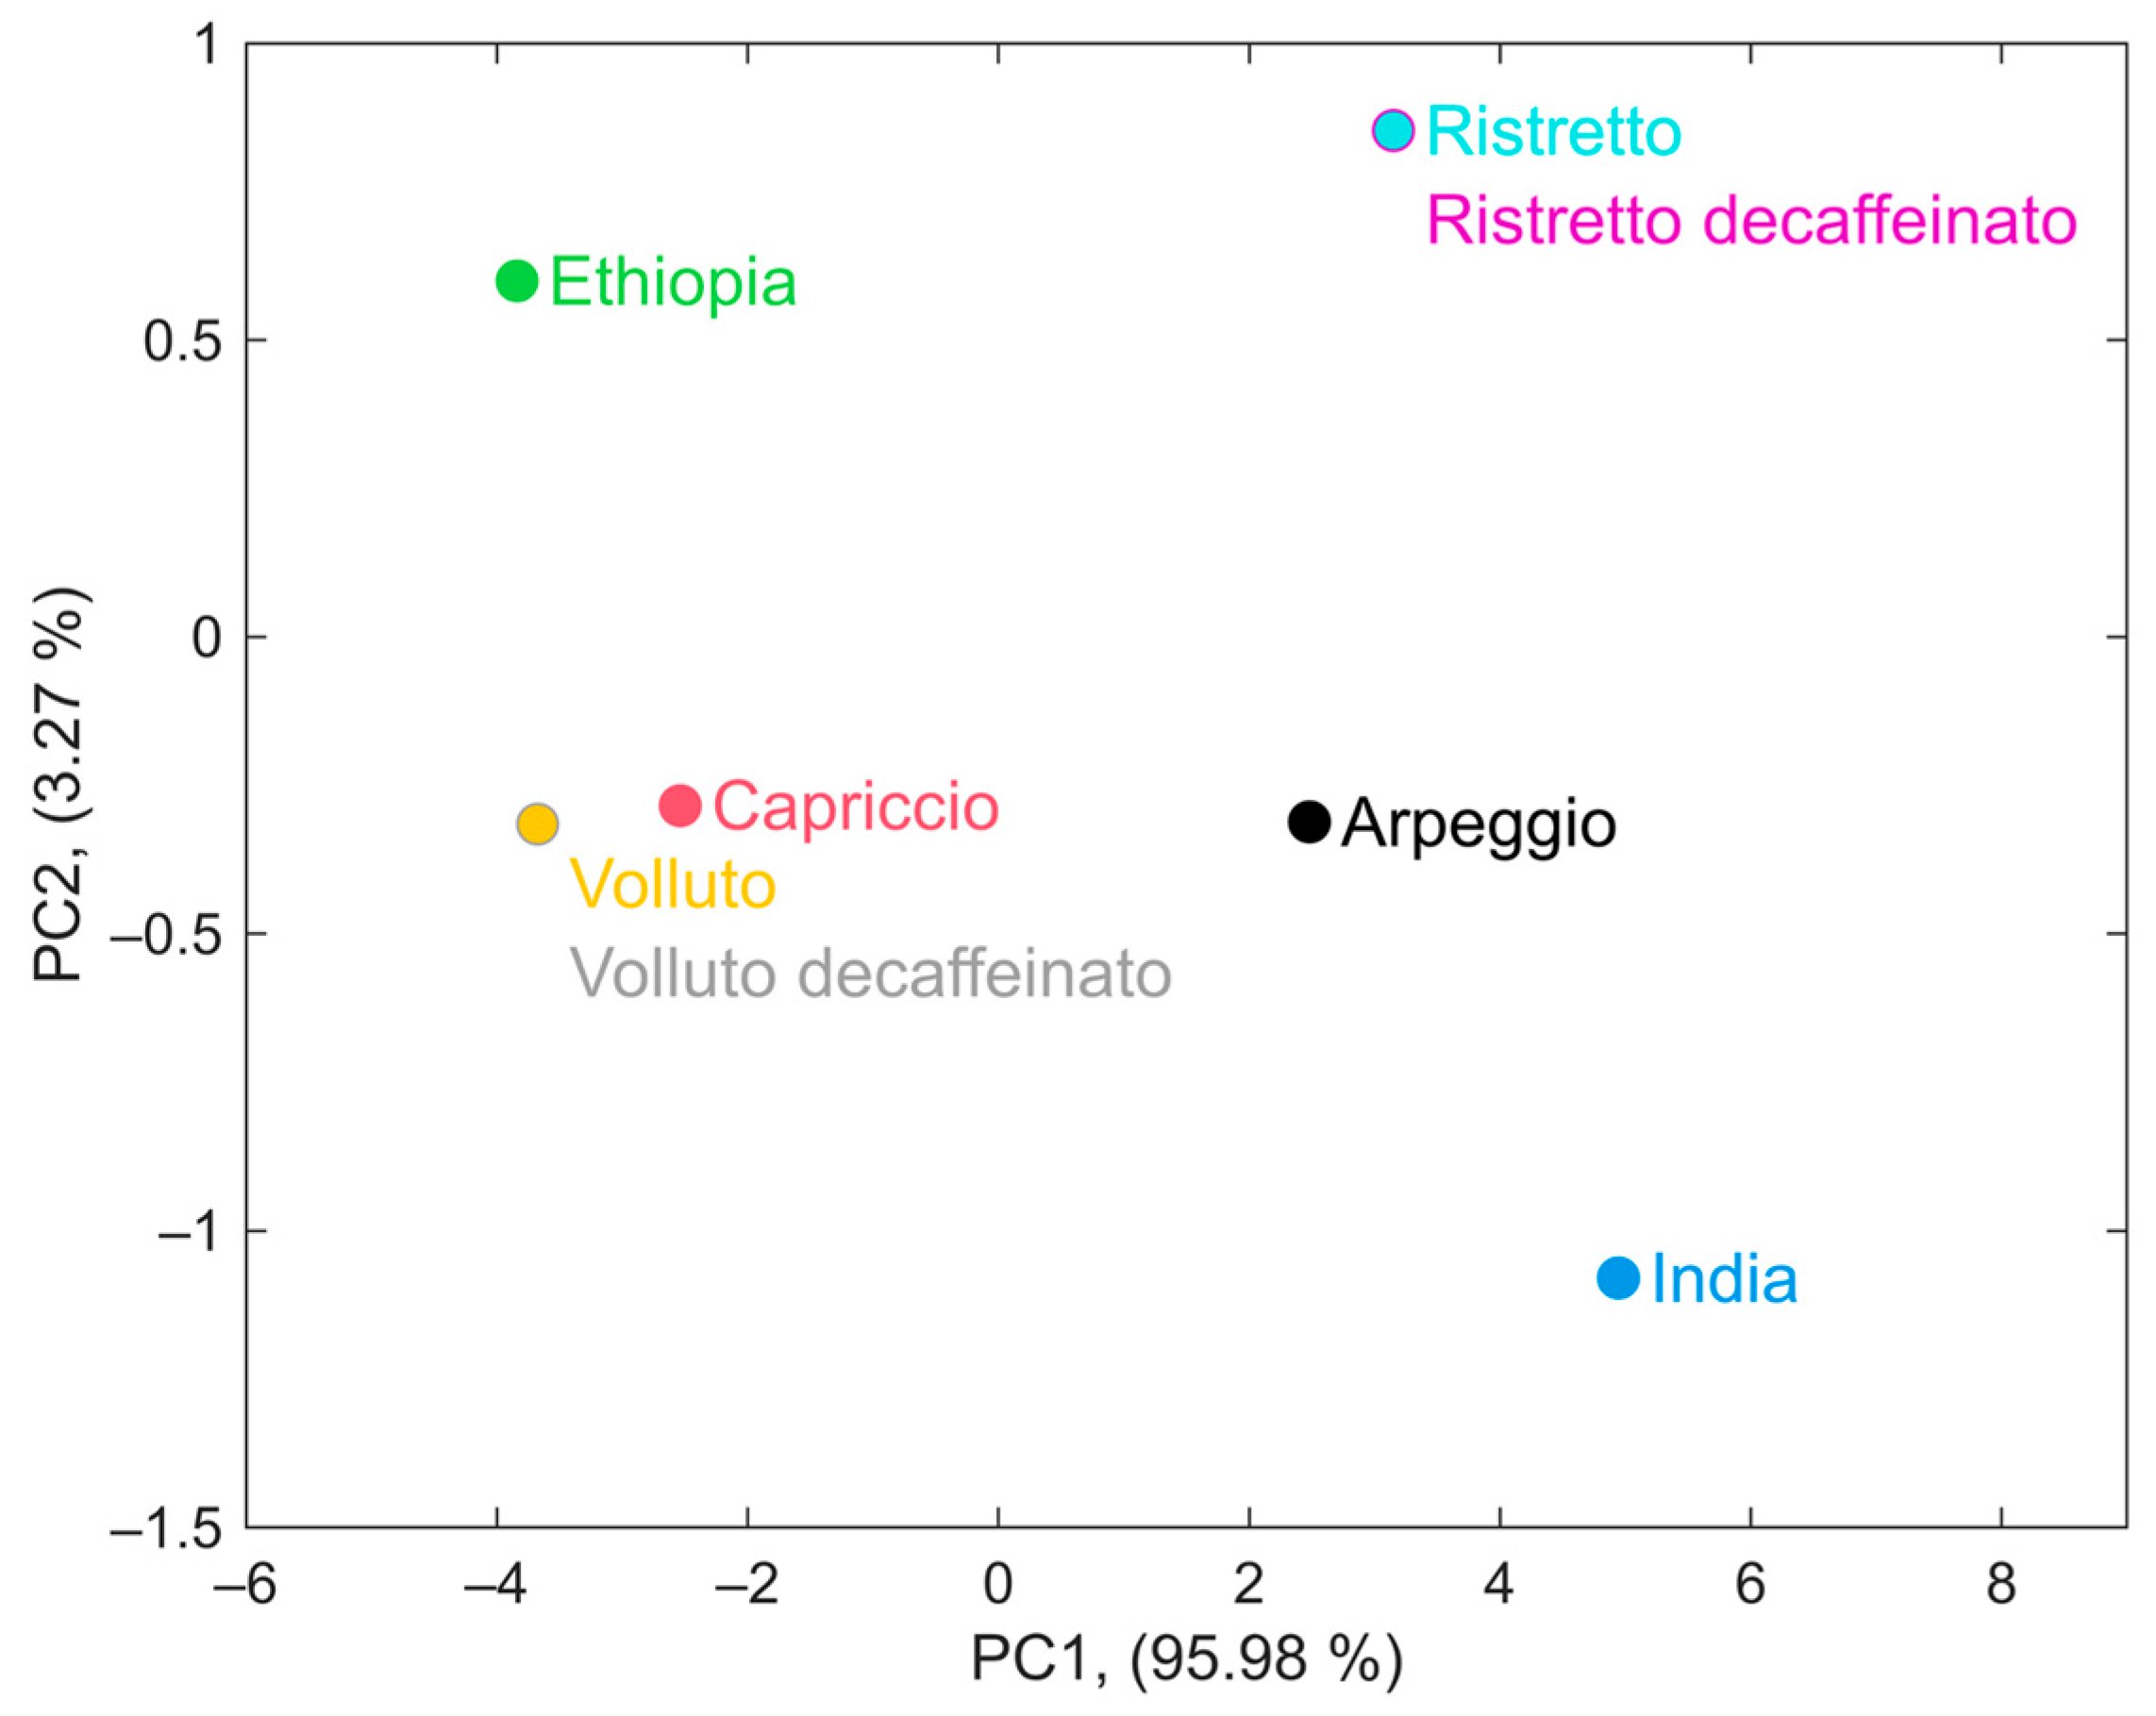
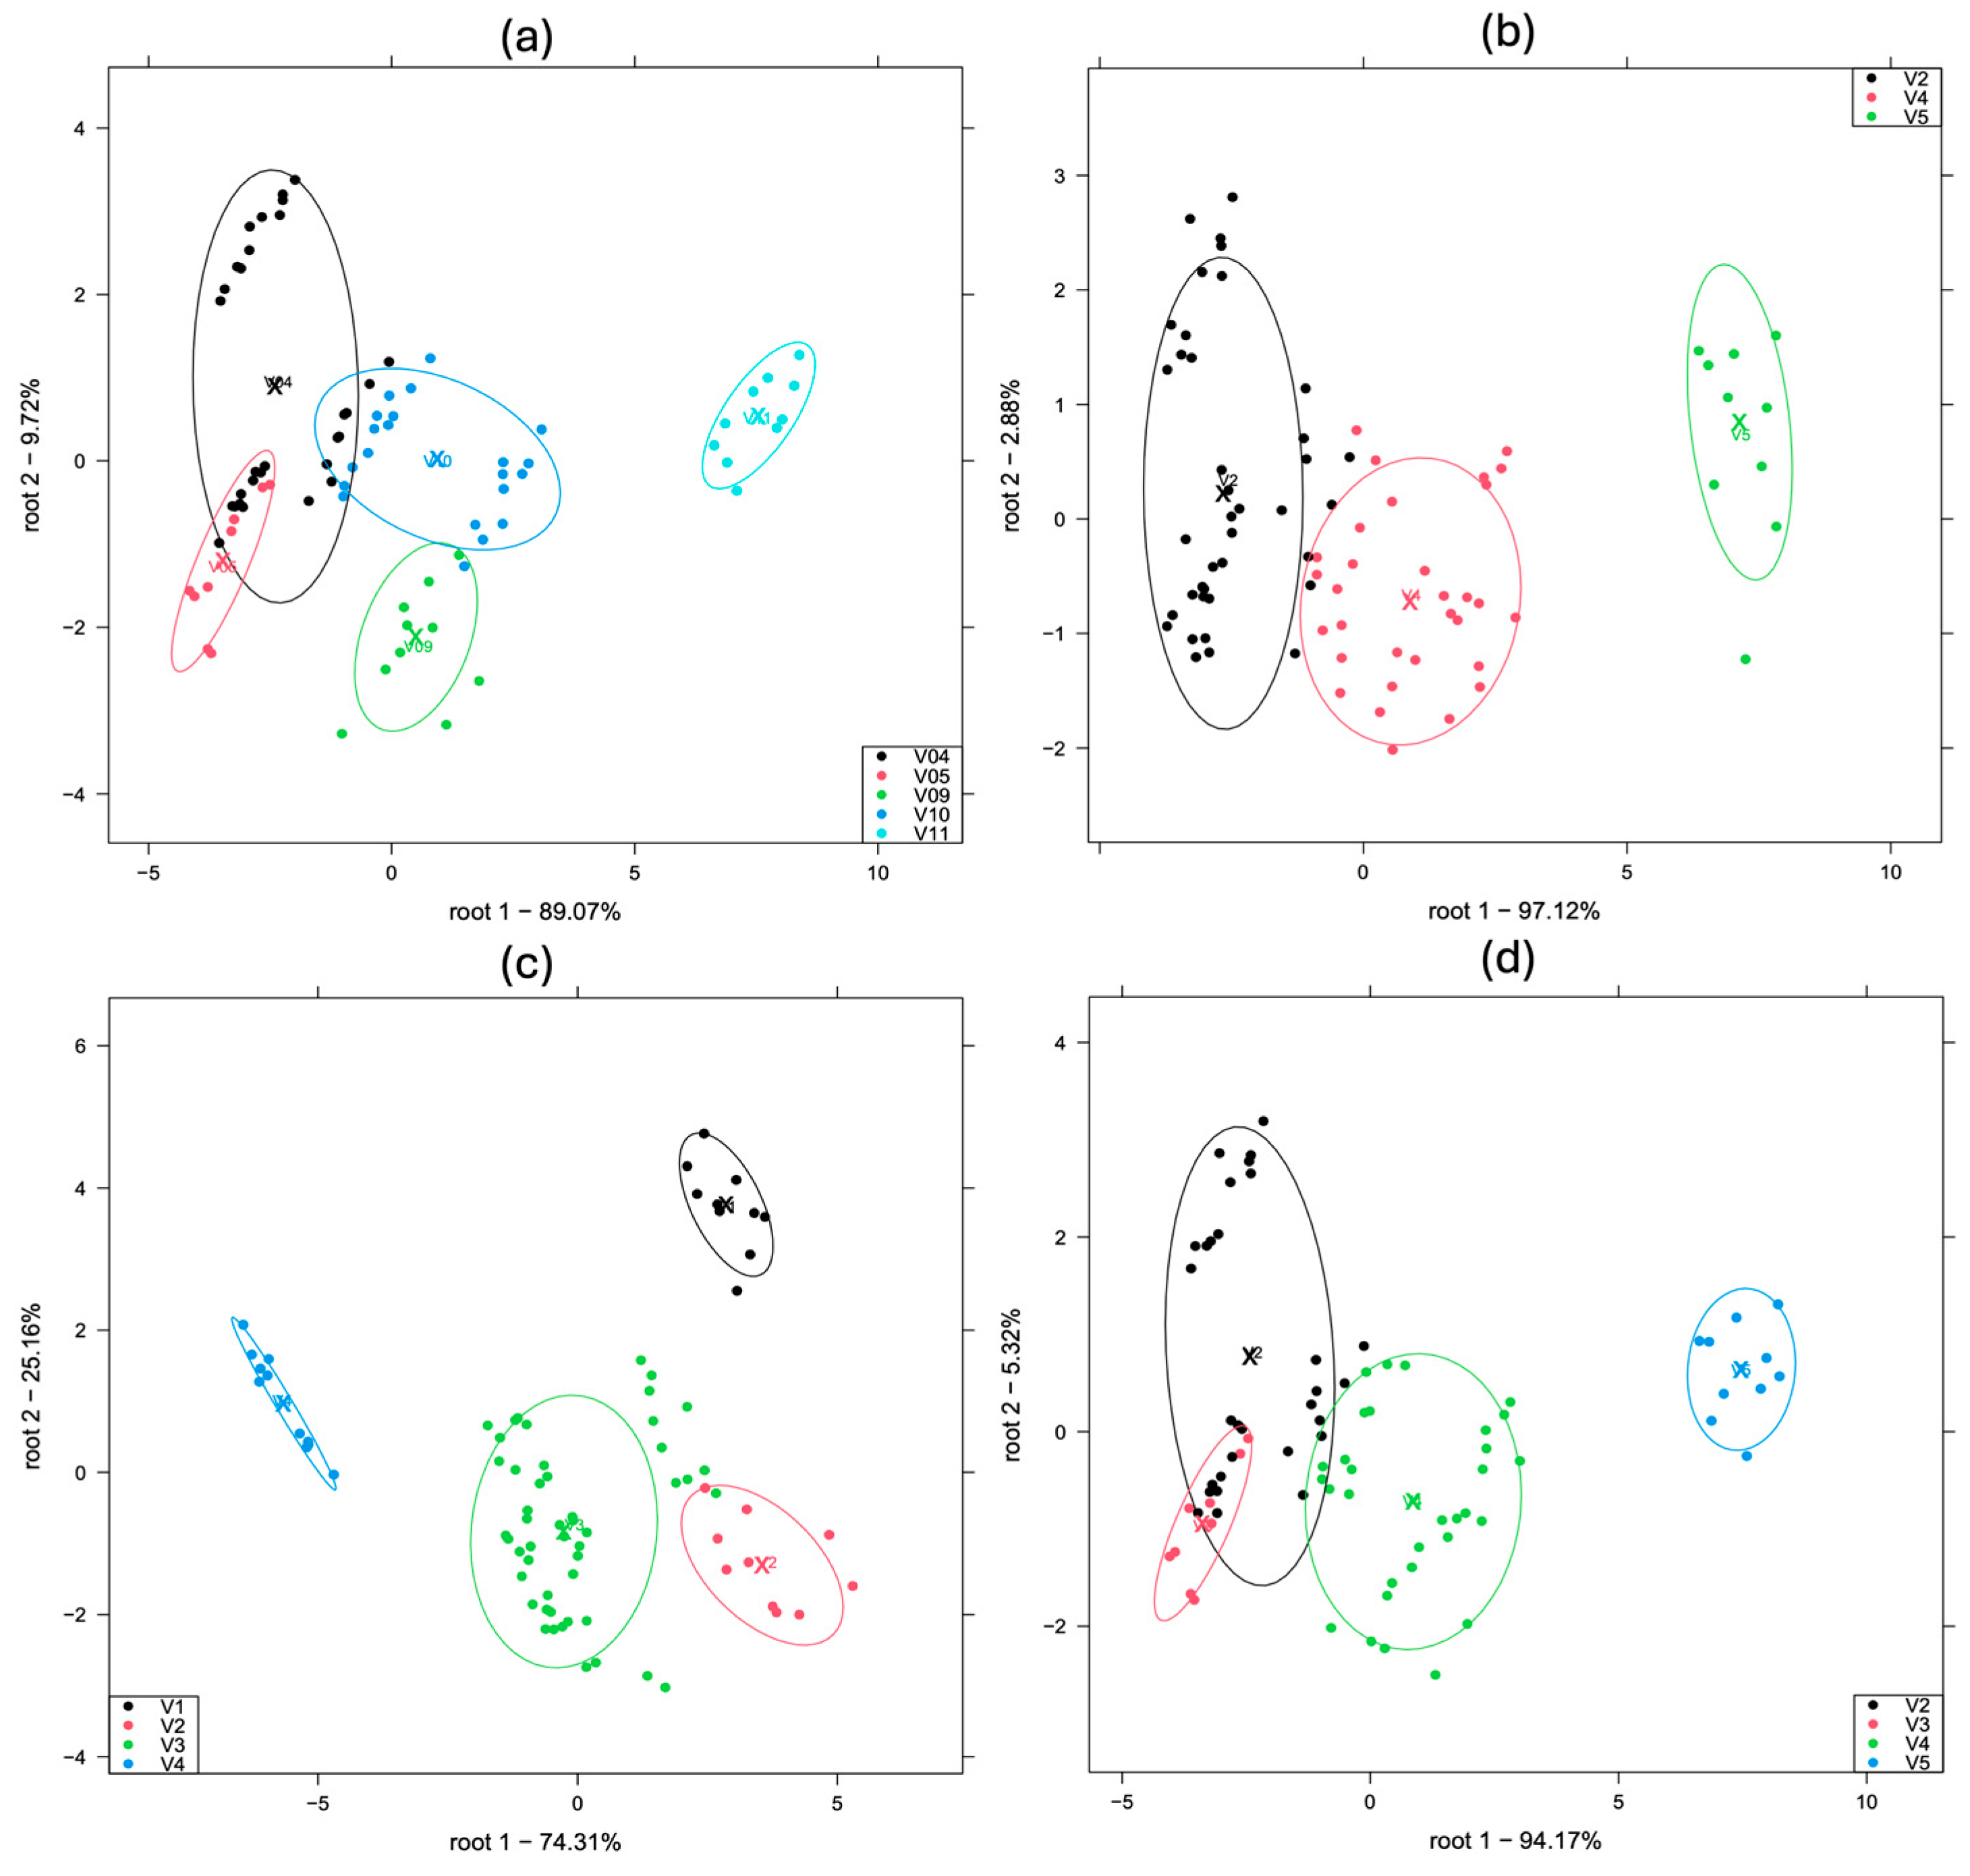
3.1. Astree E-Tongue Measurements

Figure 2 shows the sensor signals measured by the e-tongue. Some separation of the types of Nespresso® coffee capsules is observable. The reason for the partial separation is likely due to the intensity parameter of the coffee samples. The “India”, “Ristretto”, and “Ristretto decaffeinato” coffees have the highest intensity and have the highest signals, and the “Ethiopia” coffee has the lowest intensity and shows the lowest sensor signals.
Figure 3 shows the results of the PCA performed on the e-tongue data. In the PCA, on the PC1-PC2 plane, 85.27% of the total variance in the data was explained by PC1, while PC2 explained 11.09%. The largest differences between the flavor profiles were observed in the direction of PC1. The “Ethiopia” sample is positioned separately, indicating that its flavor profile significantly differs from the other coffees. “India” and “Ristretto” are close but well separated from each other, and the ellipse of “Arpeggio” overlaps with both, suggesting that these coffee brews have similar flavor profiles. These three samples are separated from the remaining others along the PC1 axis. The “Volluto” and “Volluto decaffeinato” ellipses are close to each other, indicating that their flavor profiles are similar, regardless of their caffeine contents. Contrary to expectations, the “Ristretto decaffeinato” samples are separated from the “Ristretto” samples and overlap with the “Volluto” and “Capriccio” samples in the mid area. Along the PC2 axis, the samples are not separated.
Other possible planes were also examined, and the samples showed separation only on the PC1-PC4 plane. On this plane, the “Arpeggio” coffee is well separated from the “India” coffee. “Volluto decaffeinato” and “Volluto” are again positioned close to each other. The “Volluto decaffeinato” sample overlaps with the “Capriccio” sample but remains separated from the other coffees. The distinct position of “Ethiopia” also appears here, clearly separated from the other coffee samples.
Next, a linear discriminant analysis (LDA) was performed on the data to maximize the separation between the different coffee types. Figure 4 shows the results of the linear discriminant analysis (LDA) of the e-tongue measurements. The first discriminant axis (Root 1) explains 93.7% of the differences in the data, while Root 2 explains 6.1%. The “India” and “Ethiopia” coffees are strongly separated from the other coffee samples, indicating that their flavor profiles differ significantly from the others. The “Arpeggio” coffee is also well separated; however, it shows the largest within-group variation compared to any other group, suggesting a more varied flavor profile. Similar to the findings of the PCA, “Volluto” and “Volluto decaffeinato” are positioned close to each other, whereas “Ristretto” and “Ristretto decaffeinato” are further apart, indicating that the flavor profiles of the two “Volluto” types are more similar. “Capriccio” and “Volluto decaffeinato” overlap, suggesting that their flavor profiles might be similar despite being different coffee types.
An LDA was applied to investigate whether the samples showed any separation based on the sensory parameters indicated on the packaging: intensity, roasting, acidity, and bitterness (Figure 5). The best classification was achieved for the acidity classes, while in the case of the other three parameters, the high extreme was always well separated from the rest.

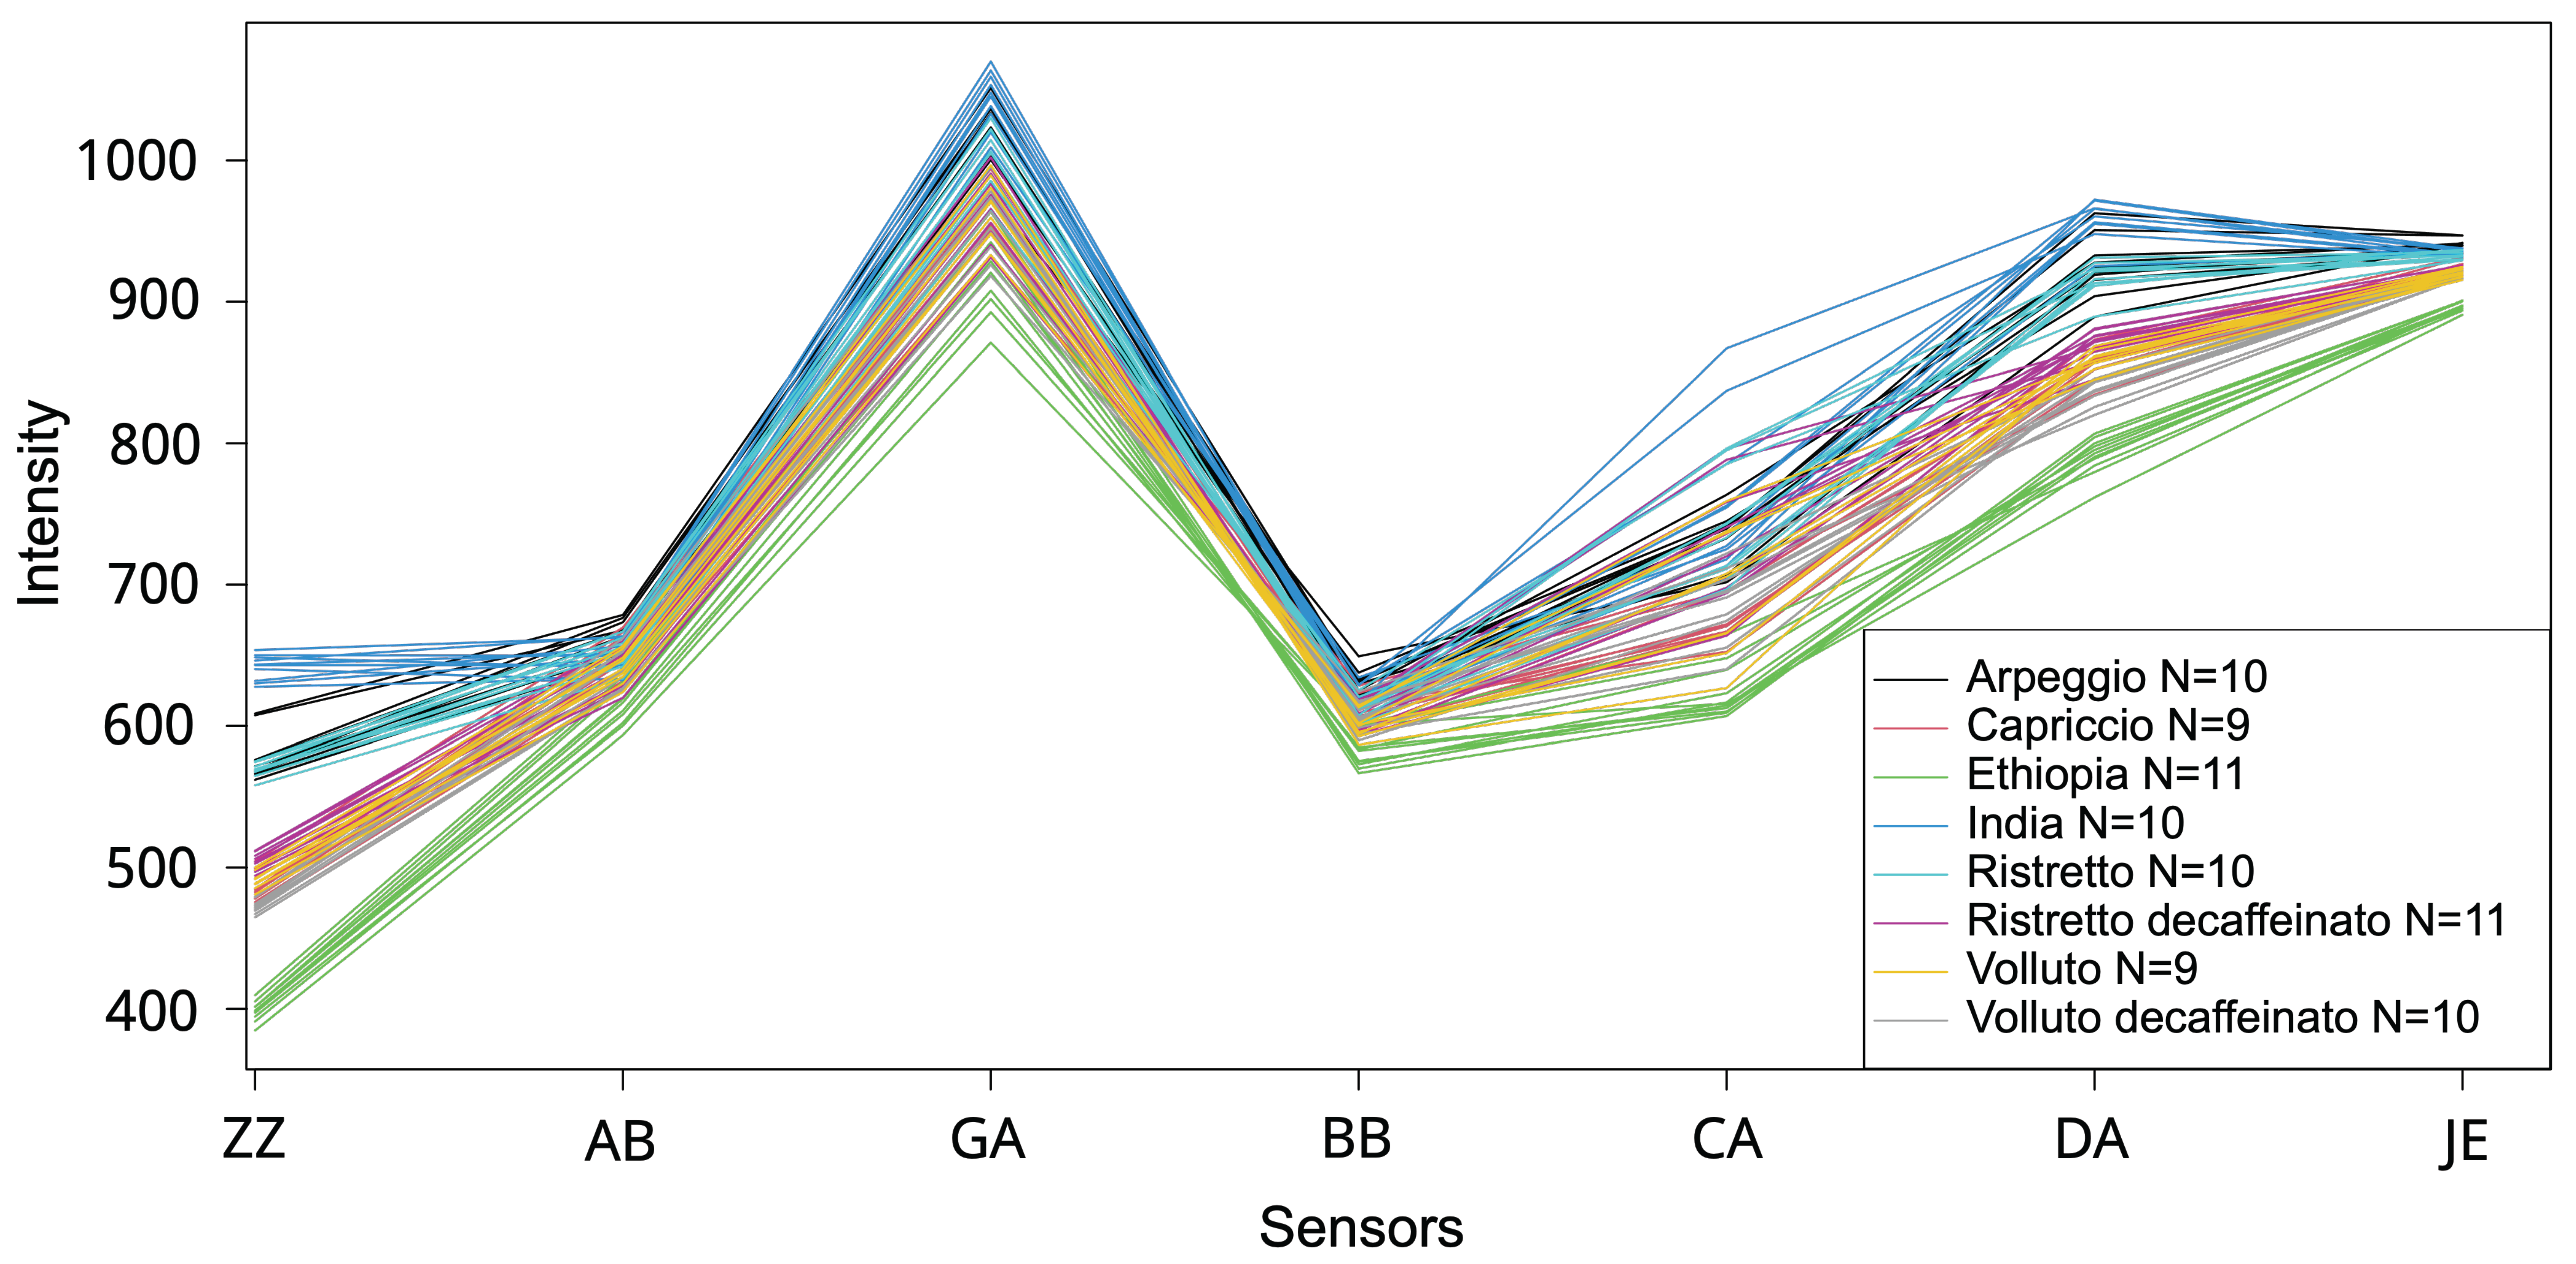
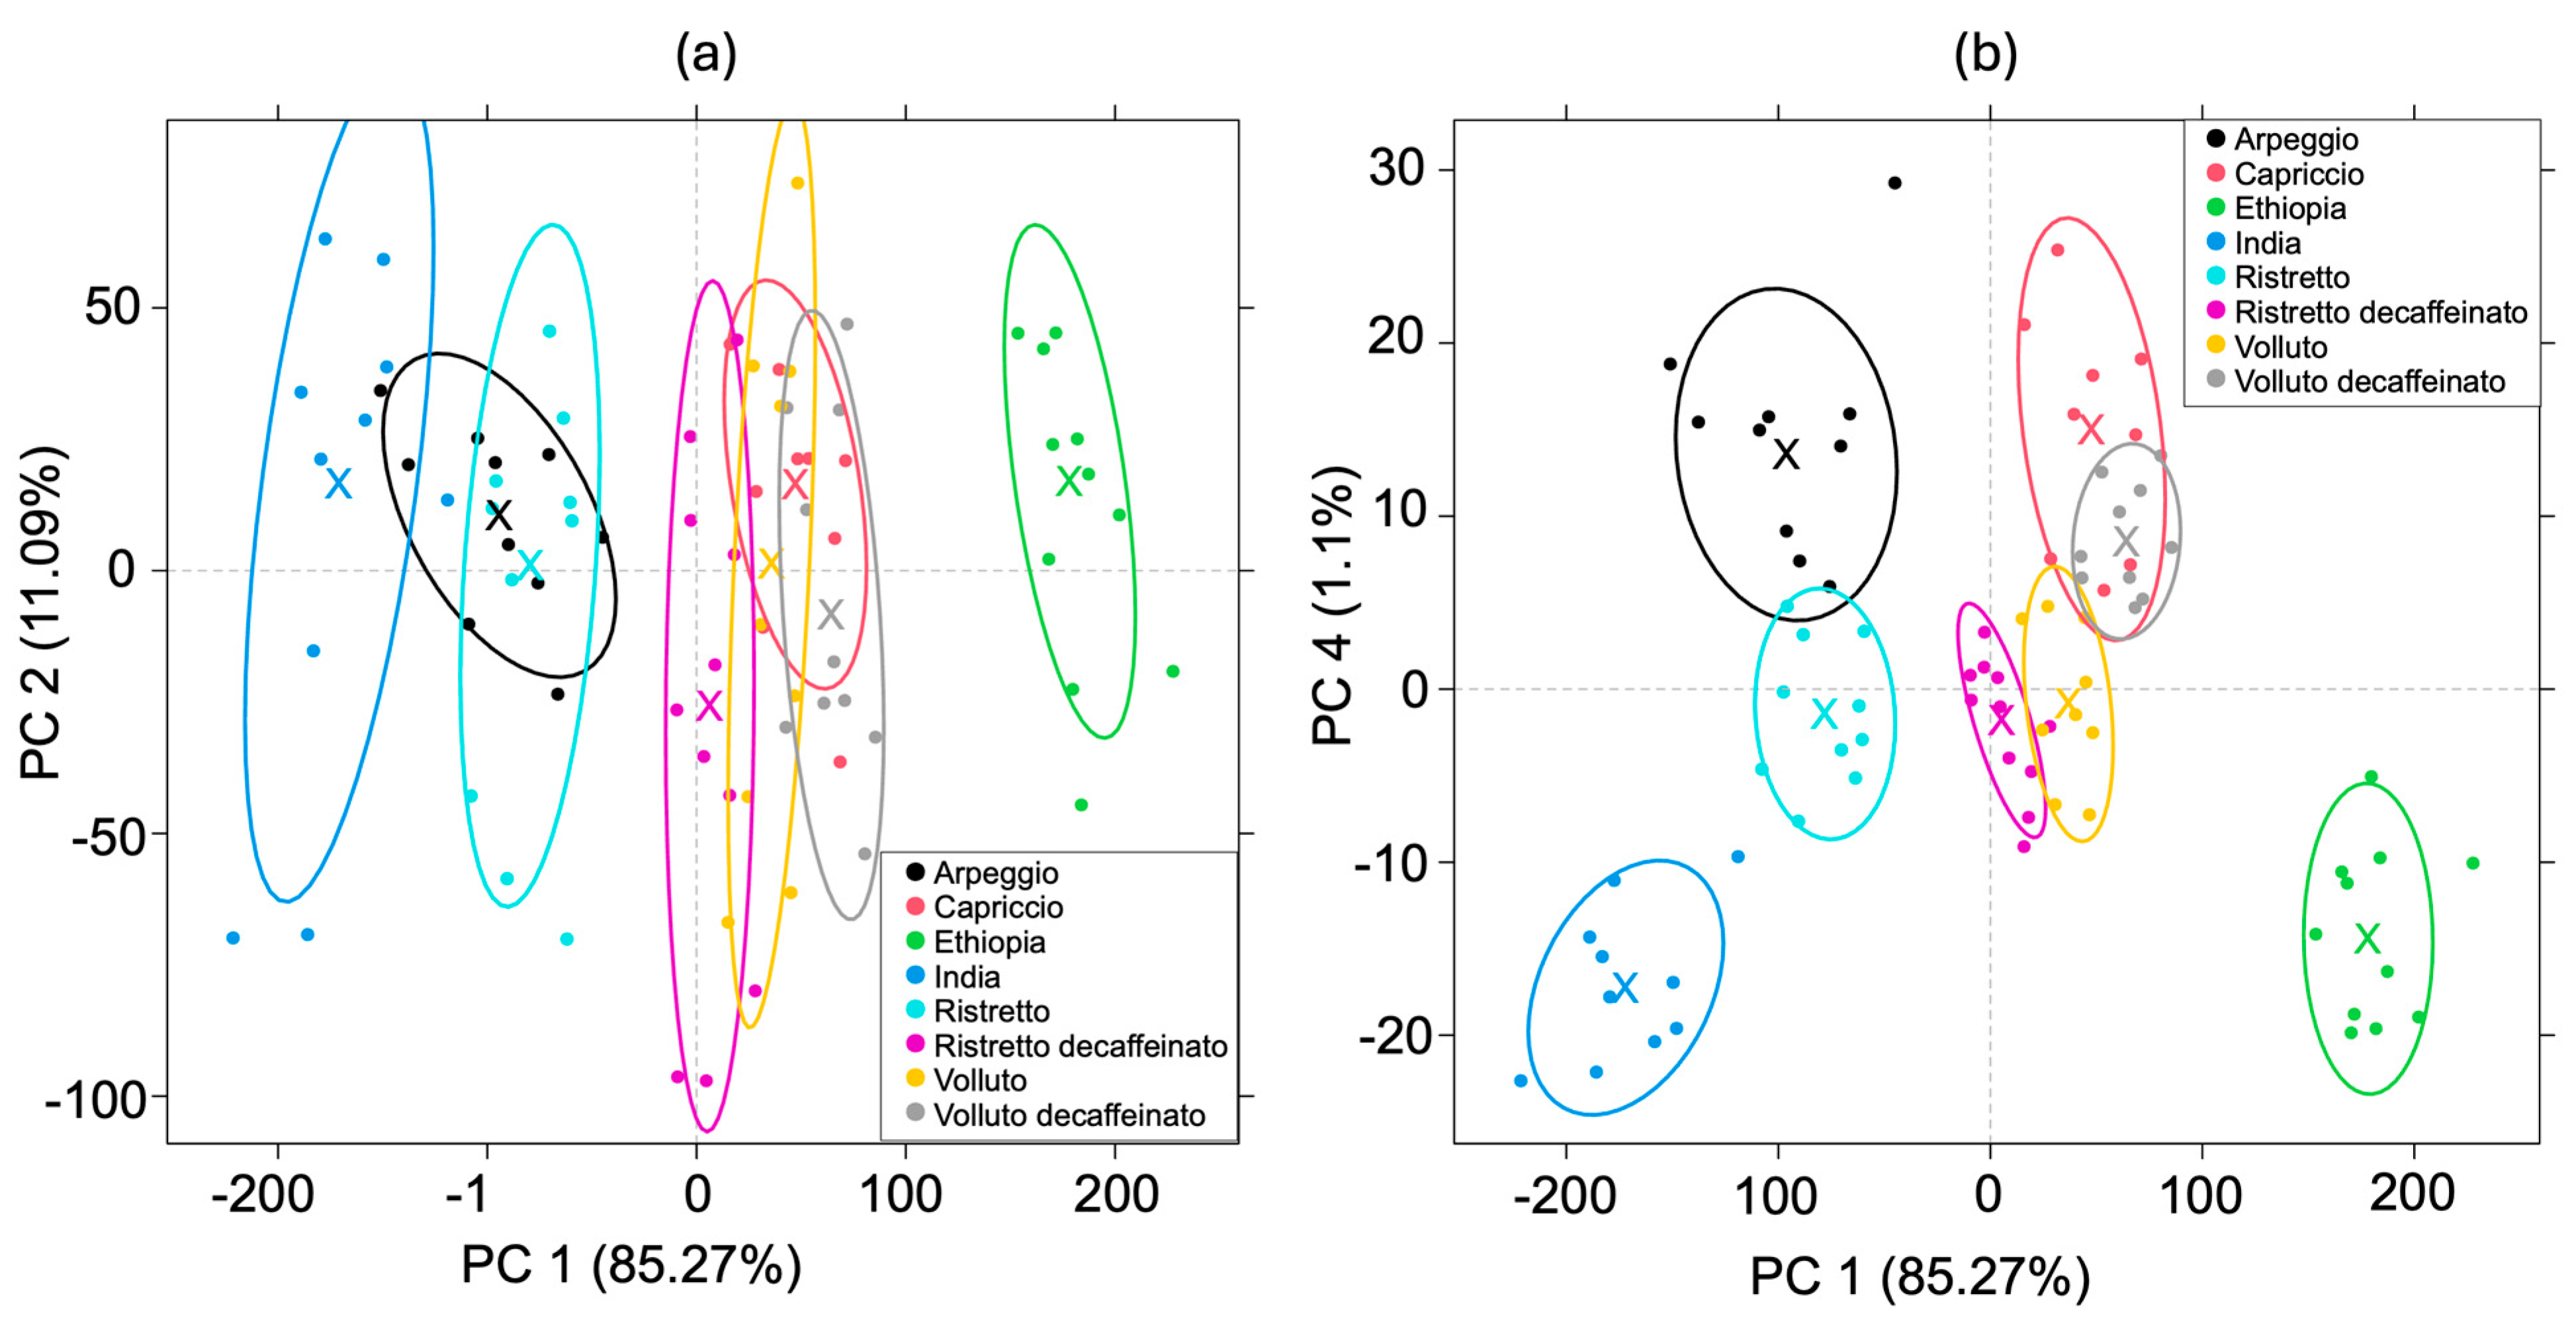
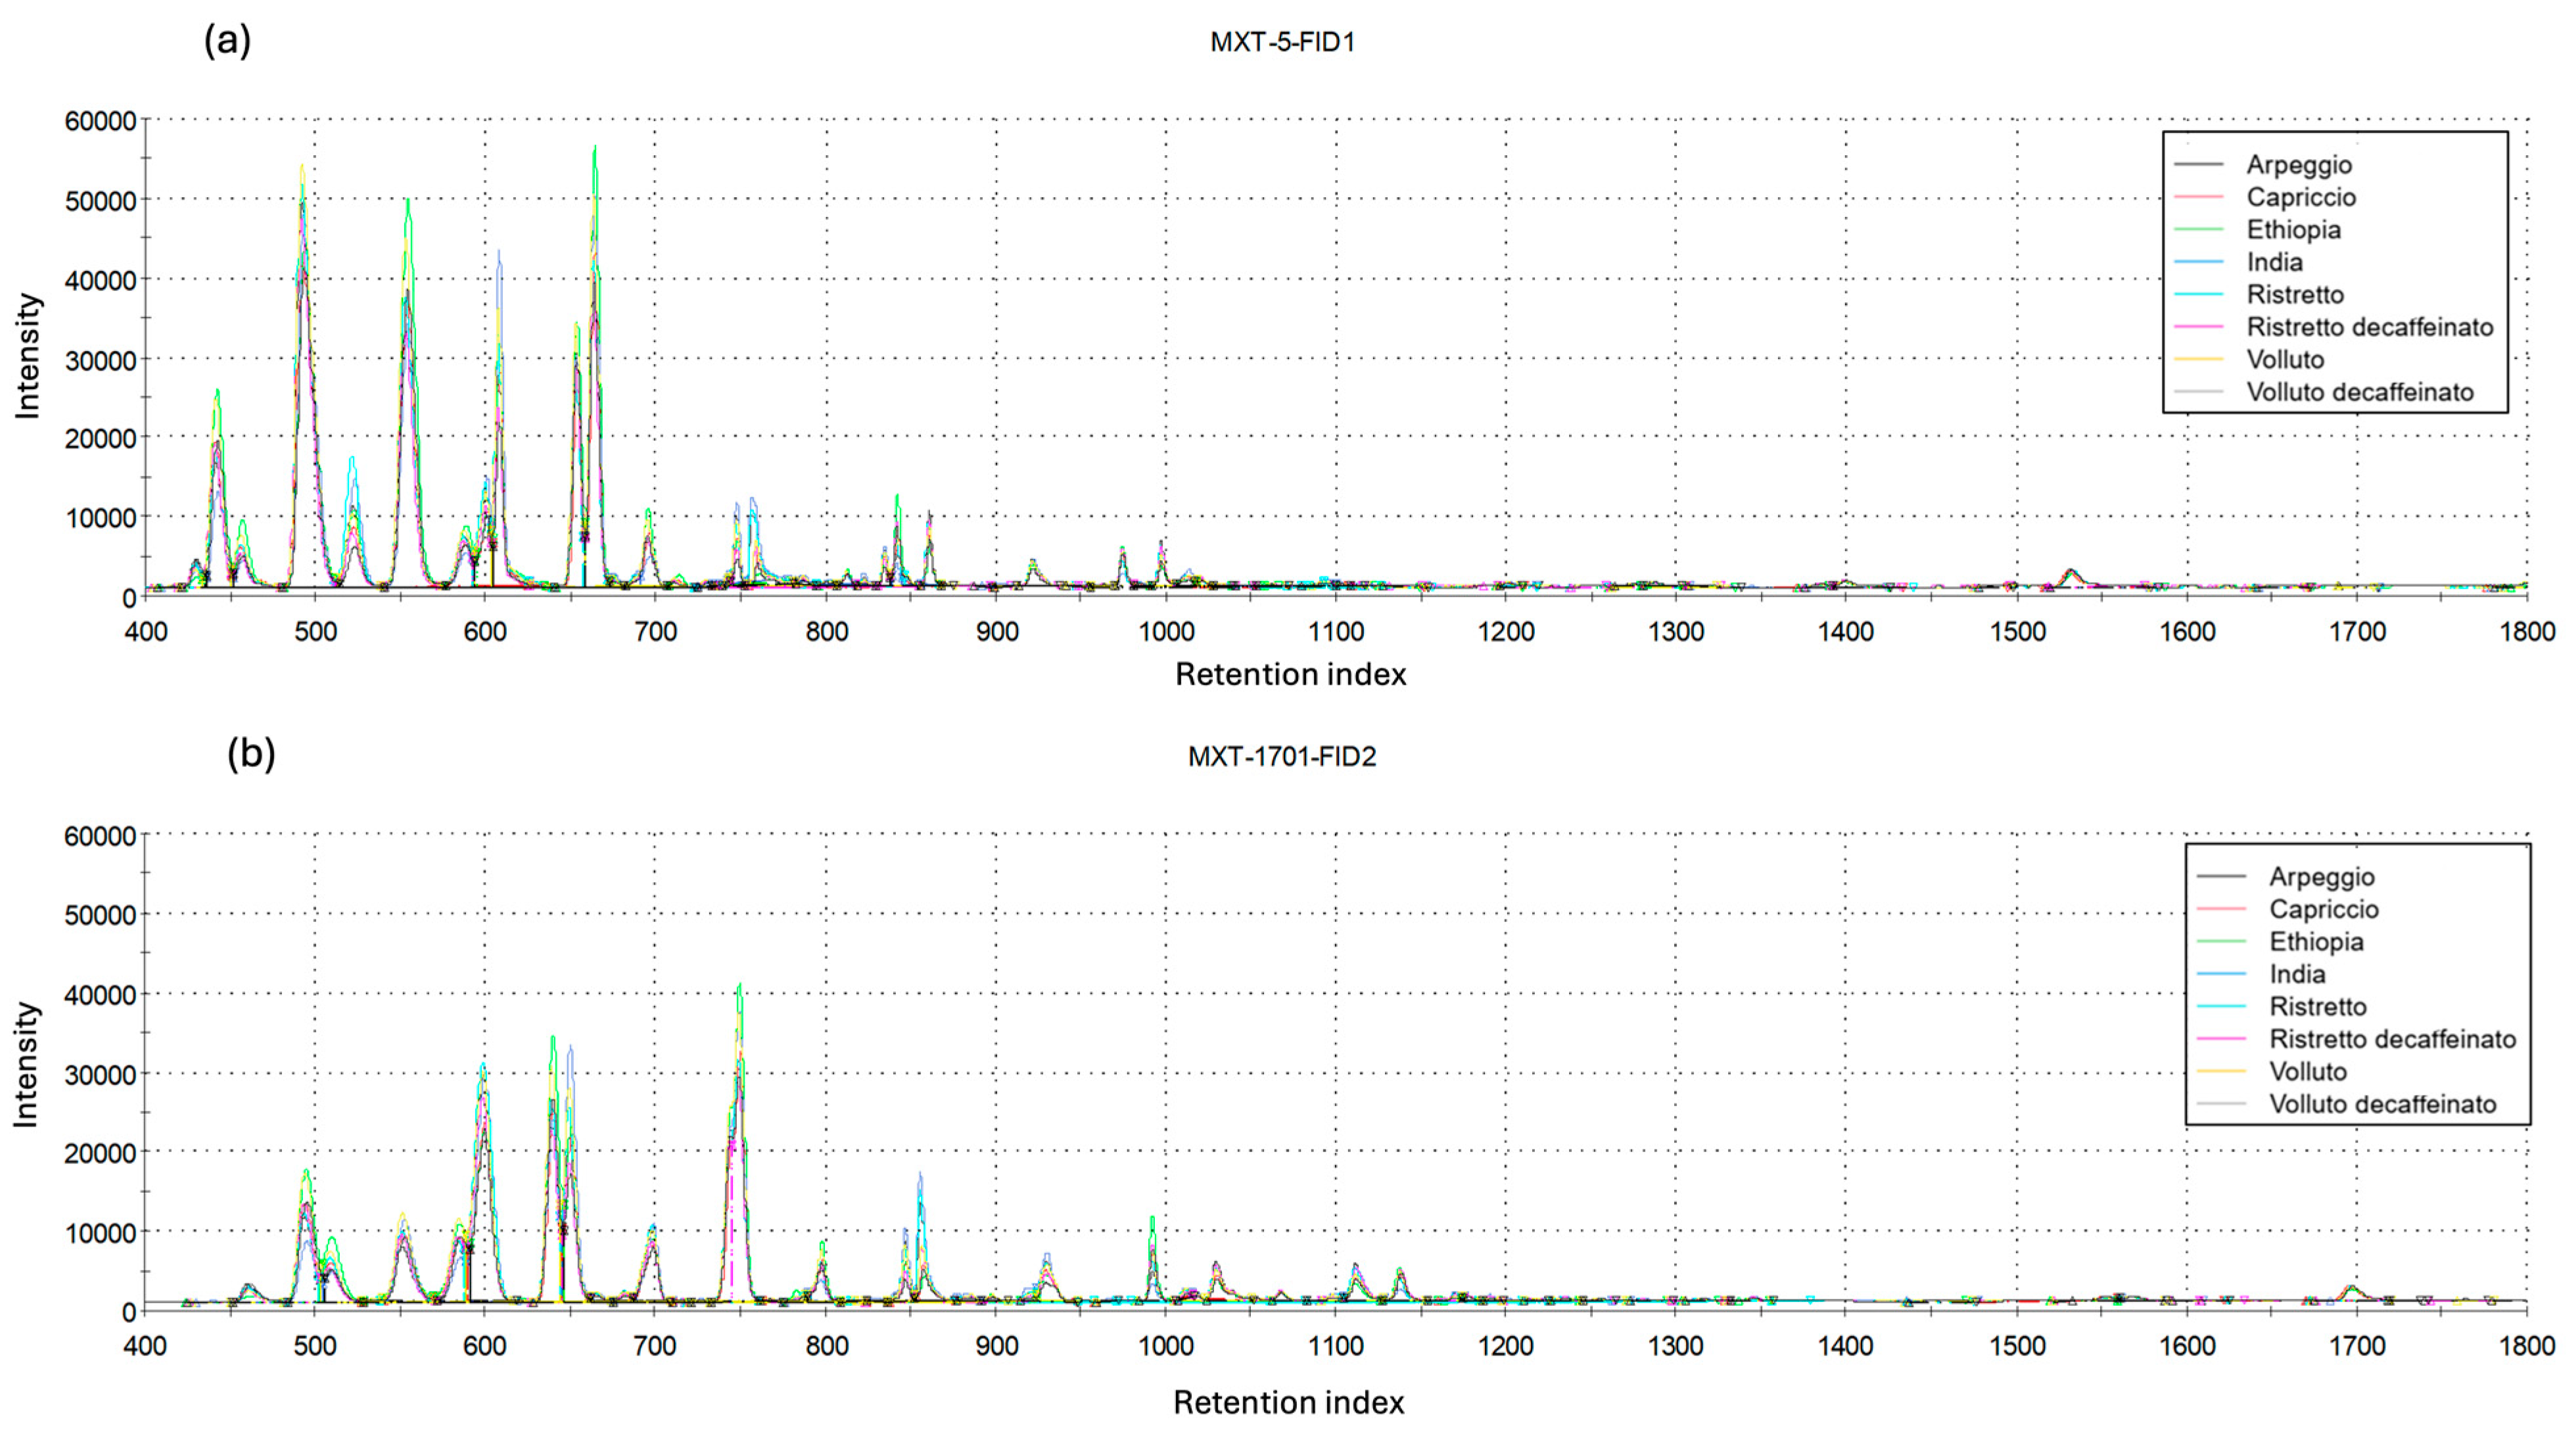
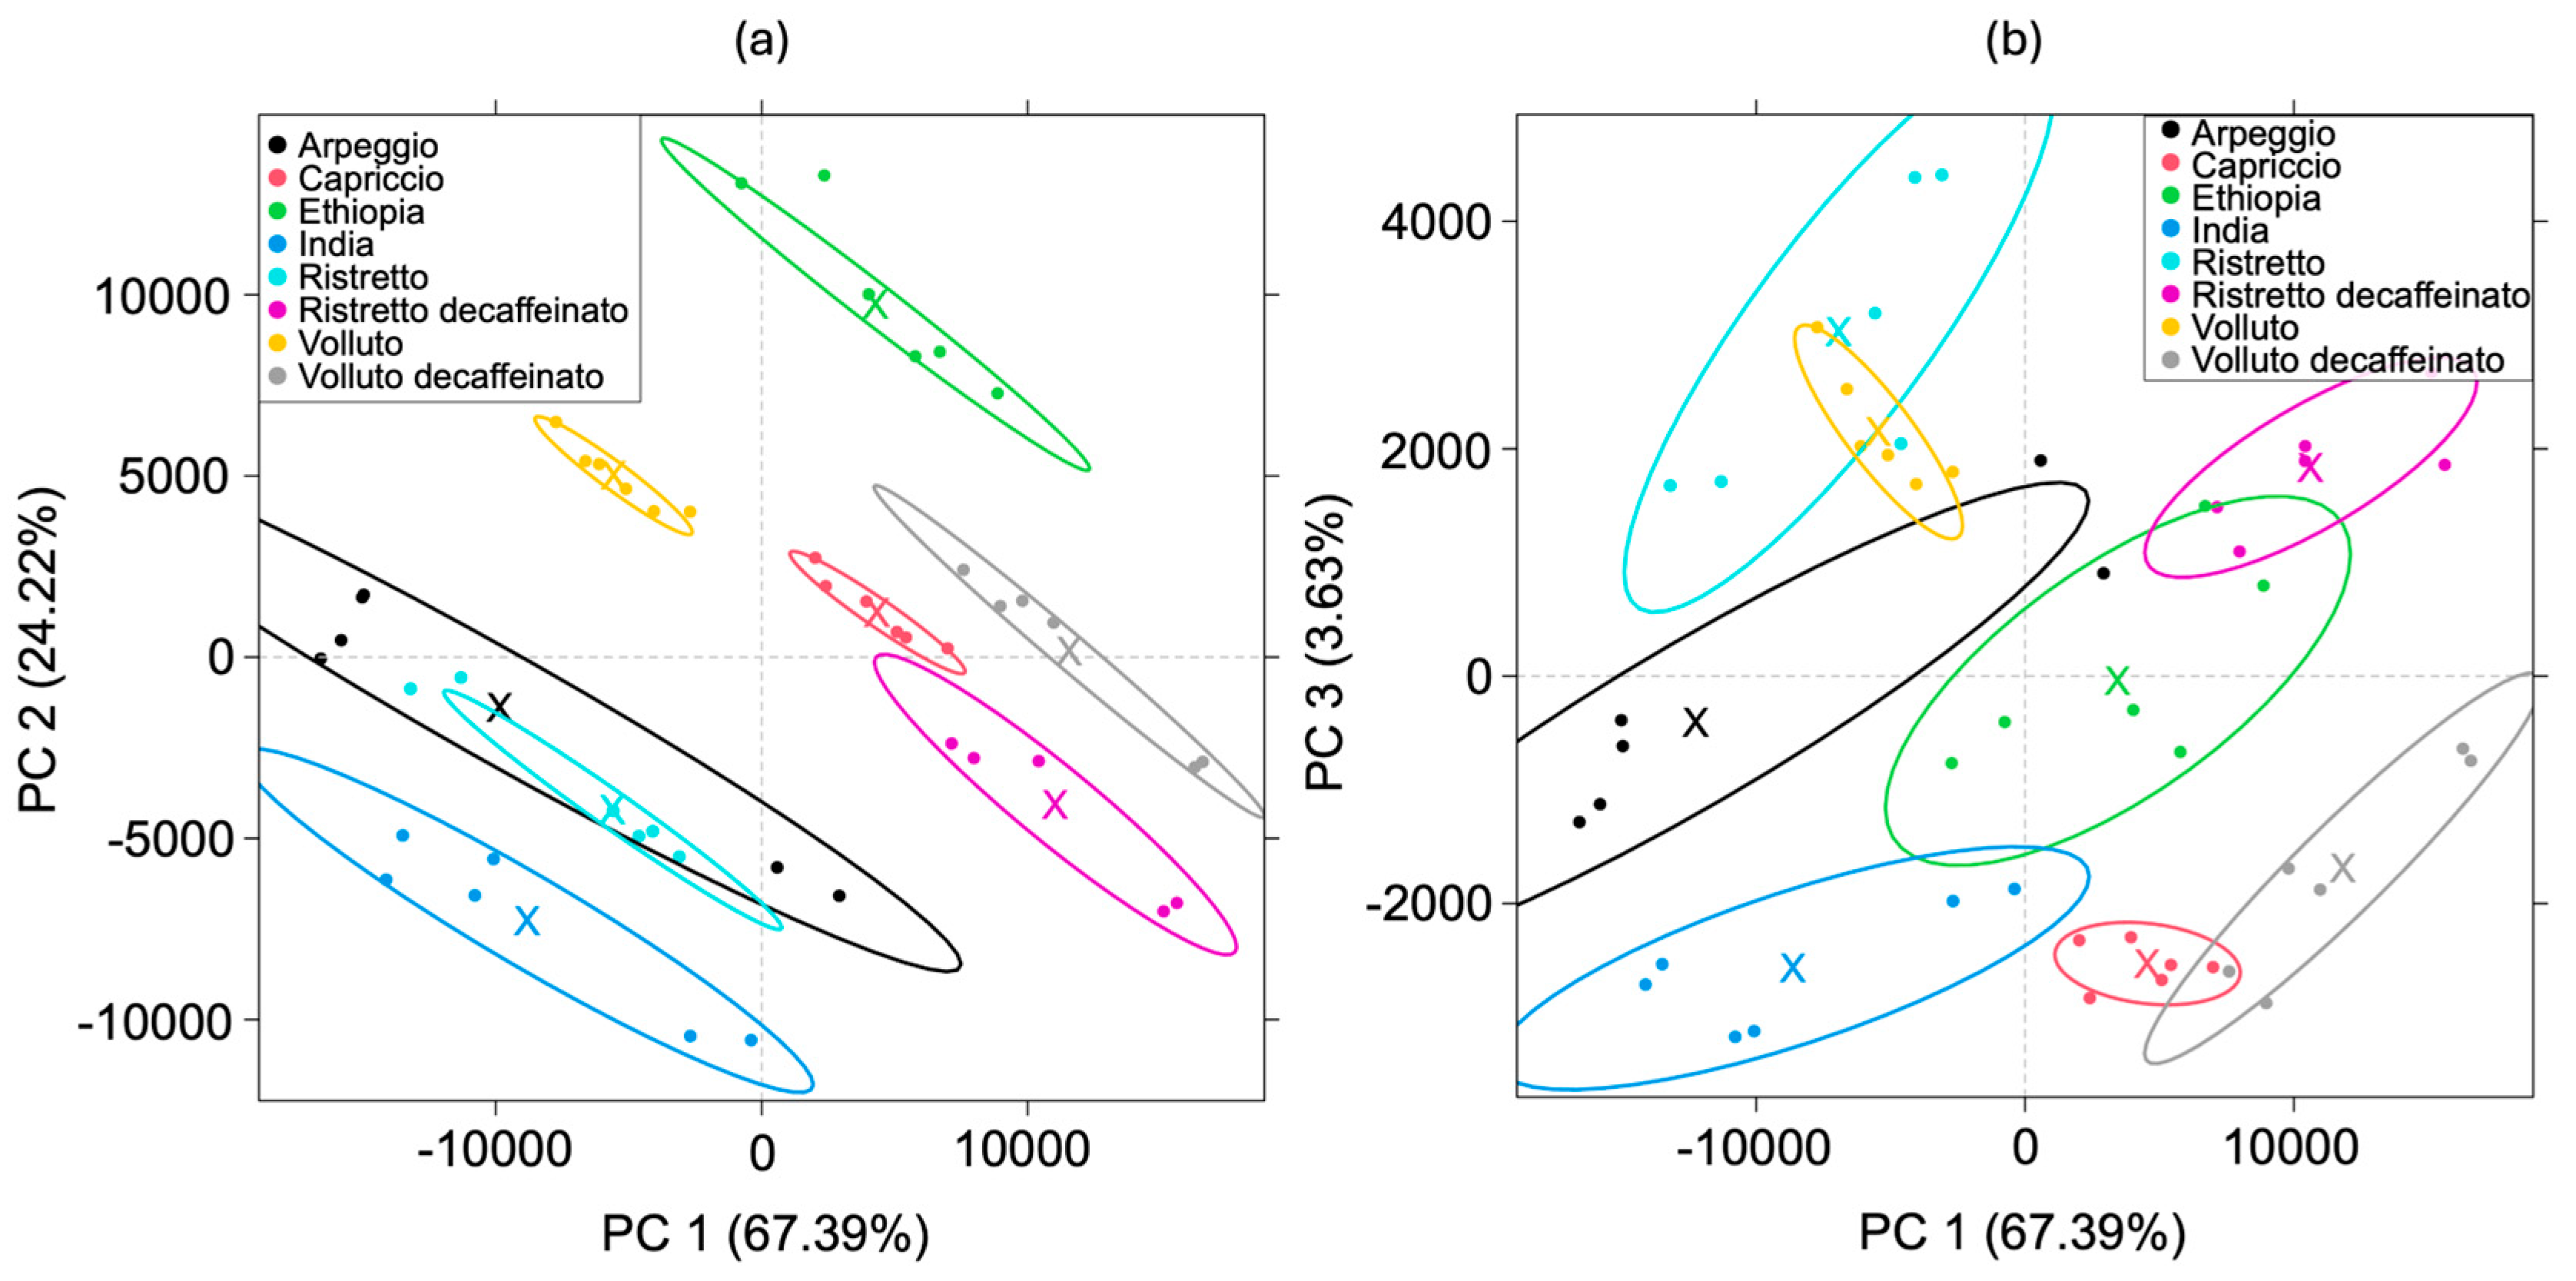
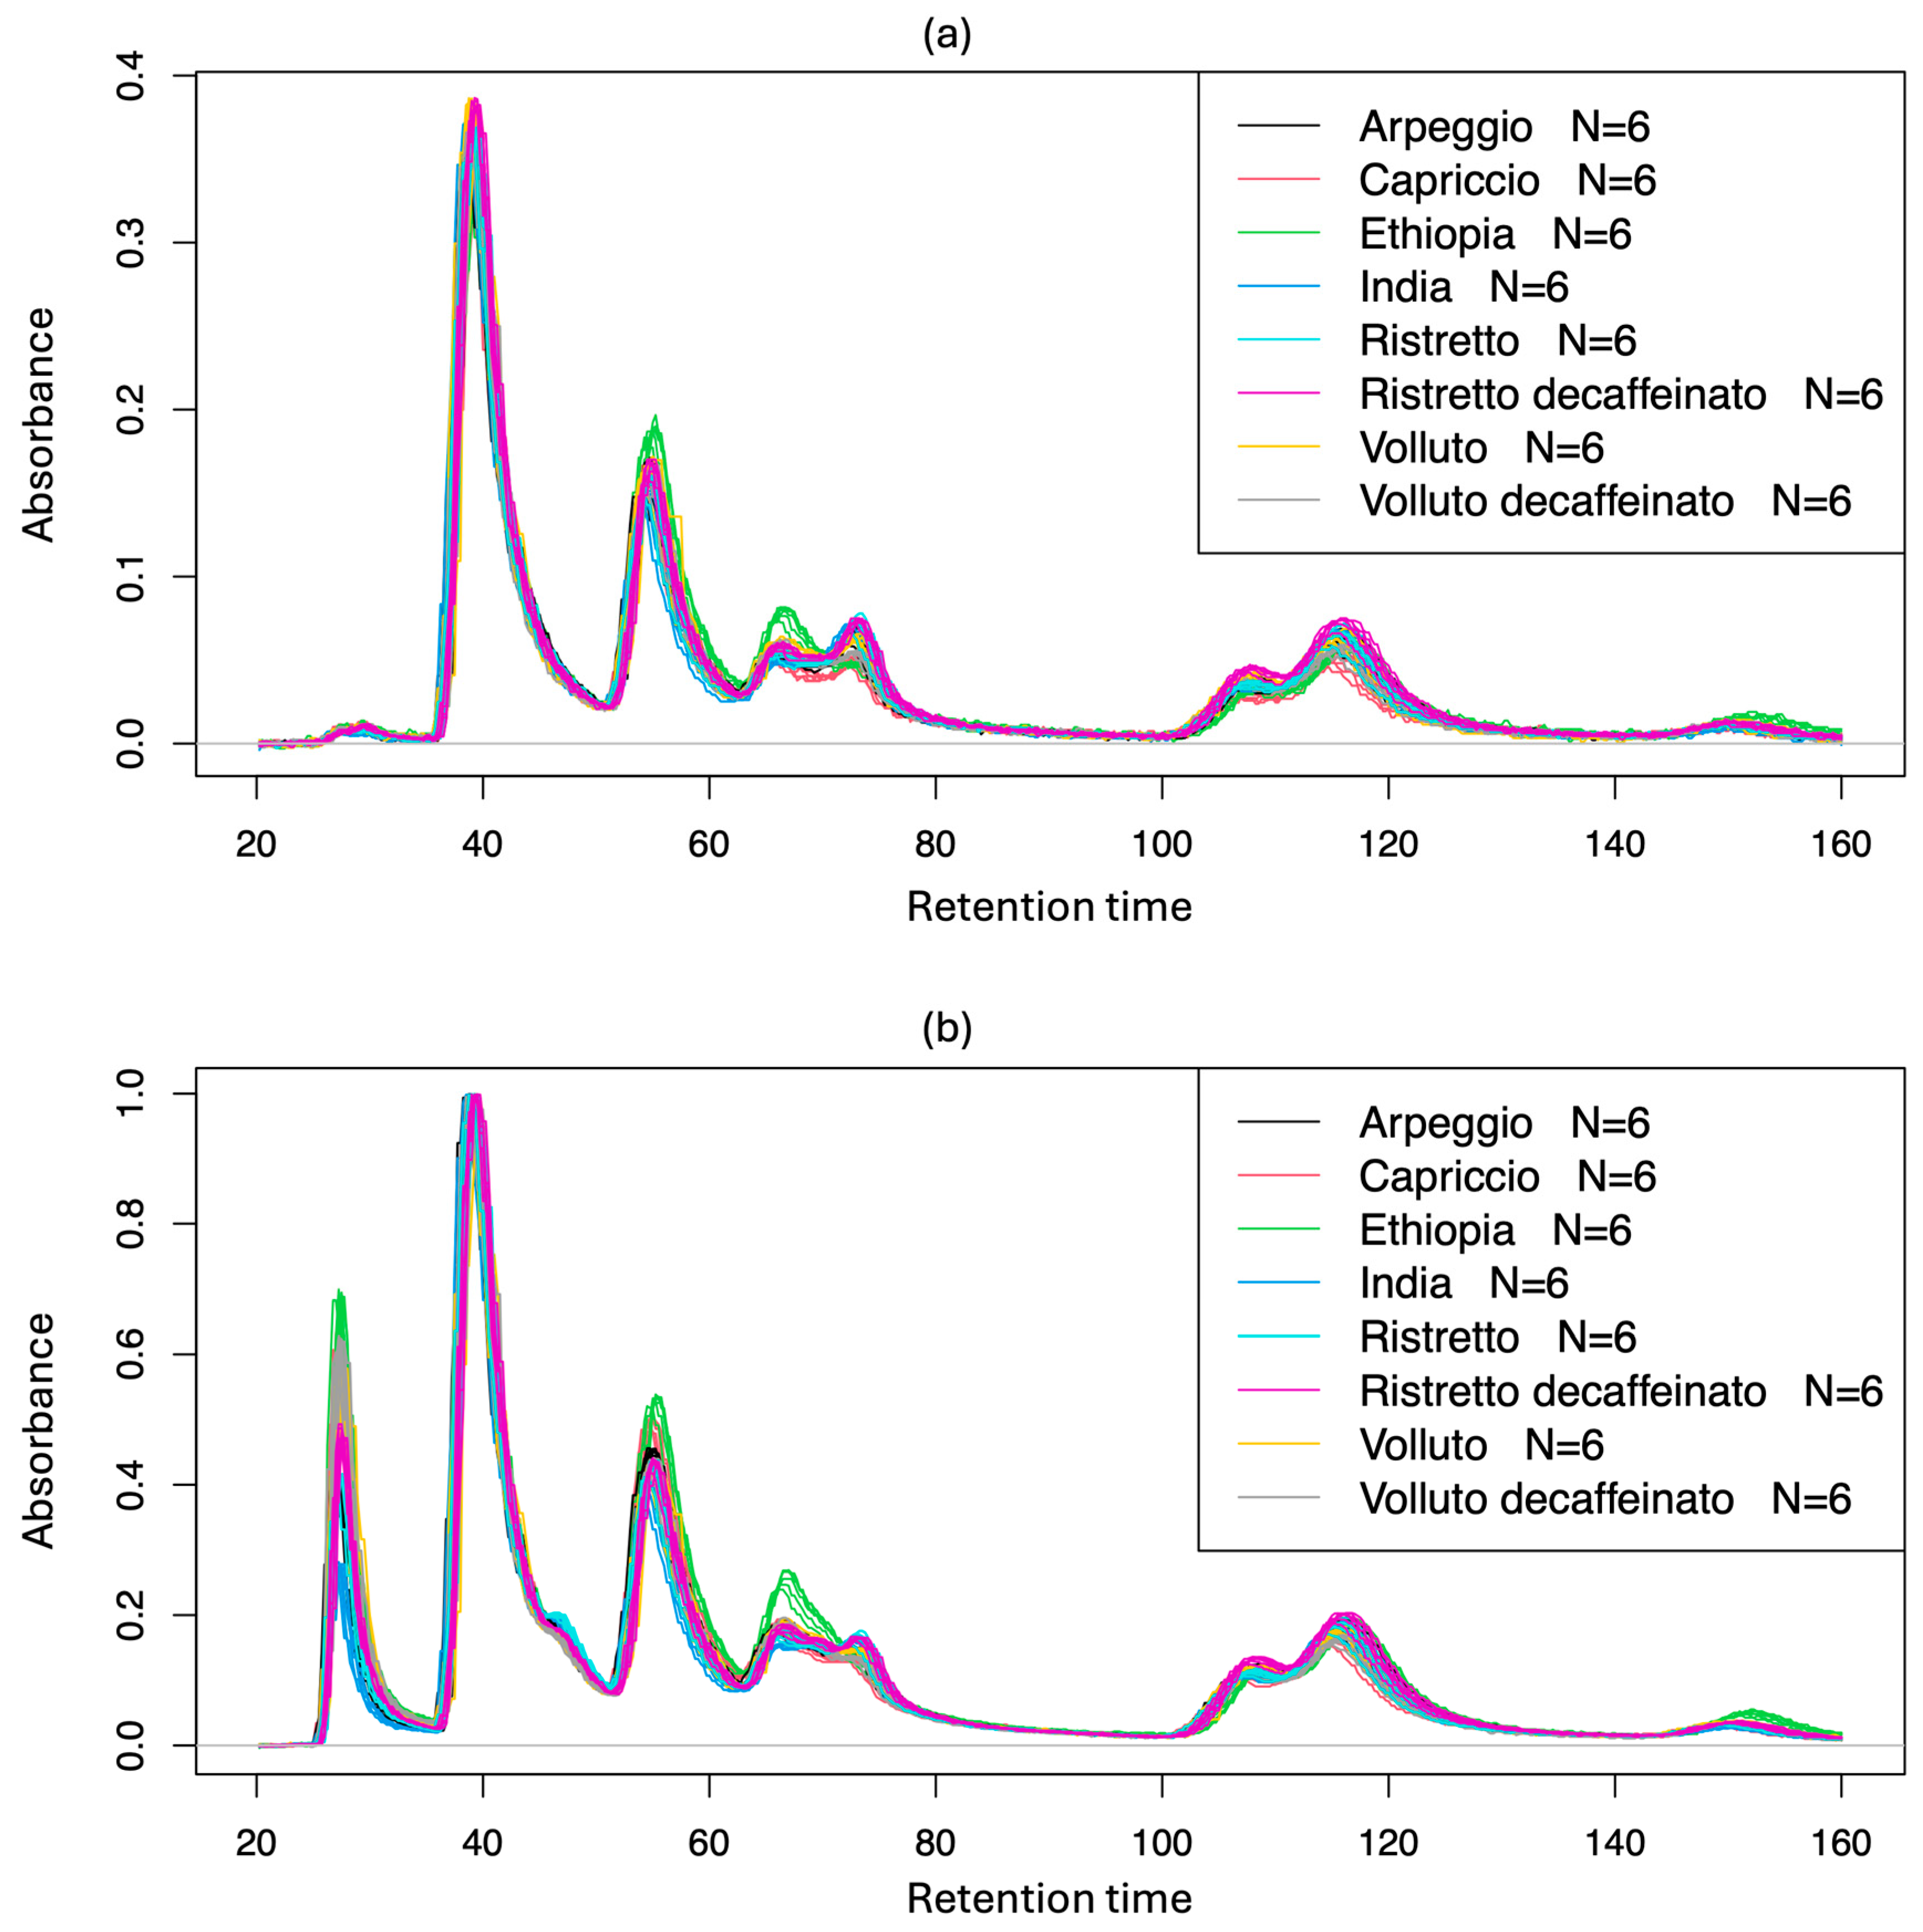
3.2. Heracles E-Nose Measurements

Figure 6 shows the chromatograms measured with the Heracles e-nose for each coffee type. The chromatograms are highly similar and do not allow for a clear distinction of the coffee types based on a simple chromatographic comparison. After identifying the peaks and defining the area under the curve, the virtual sensor array dataset was evaluated with multivariate statistical approaches.
Figure 7 shows the principal component analysis (PCA) of the coffee capsules measured with the Heracles e-nose using both columns, where the PC1 axis explains 67.39% of the differences in the data, while PC2 explains 24.22%. On the PC1-PC2 plane, the samples are separated from each other, except for the “Arpeggio” and “Ristretto” samples, which strongly overlap, although they remain distinct from the other samples. The most distant samples are “Ethiopia” and “India”. The “Volluto decaffeinato” and “Volluto” samples, as well as the “Ristretto decaffeinato” and “Ristretto” samples, are separated from each other, indicating that the decaffeinated versions of these samples have slightly different scent profiles. On the PC1-PC3 plane, the “Arpeggio” and “Ristretto” samples are distinguished from each other.
Figure 8 shows the linear discriminant analysis (LDA) of the coffee samples based on both column-1 and column-2, where the Root 1 axis explains 75.16% of the variance, representing the largest differences between the coffee samples, while the Root 2 axis accounts for the remaining 17.91%, highlighting smaller variations in the data. The India and Ethiopia samples have distinctly different flavor profiles compared to the other coffees, as indicated by their position and the greatest distance along the Root 1 axis. The Capriccio and Volluto decaffeinato samples are also separated from each other and the other samples. The Arpeggio and Ristretto samples, as well as the Ristretto decaffeinato and Volluto samples, overlap in pairs, indicating similarity in their flavor profiles, but these two groups are still distinct from each other and the rest of the samples.
Figure 9 presents the linear discriminant analysis (LDA) results based on intensity, roasting, acidity, and bitterness parameters, considering both columns. In the intensity plot (top left), the samples can be divided into three groups. Only the V5 and V11 groups are significantly separated. The separation of the V09 group can also be observed, but its proximity to the other samples indicates that it does not differ significantly from the other three groups (V04, V05, V10). In the roasting plot (top right), the V2 and V4 groups slightly overlap, indicating that the LDA is unable to fully separate them, suggesting that their flavor profiles may be similar. The V5 group, however, is significantly different from the others, as it is separated from both the V2 and V4 groups. In the acidity plot (bottom left), the V1 and V4 groups are completely separated from the other groups. The V2 and V3 groups slightly overlap, indicating that their flavor profiles may be similar. In the bitterness plot (bottom right), the V5 group is well-separated from the other groups. The V3 and V4 groups are also distinct from each other and the V5 group, with a greater distance from V5 than from each other. The V2 group overlaps with the V3 and V4 groups, indicating that these three groups have very similar flavor profiles in terms of bitterness.

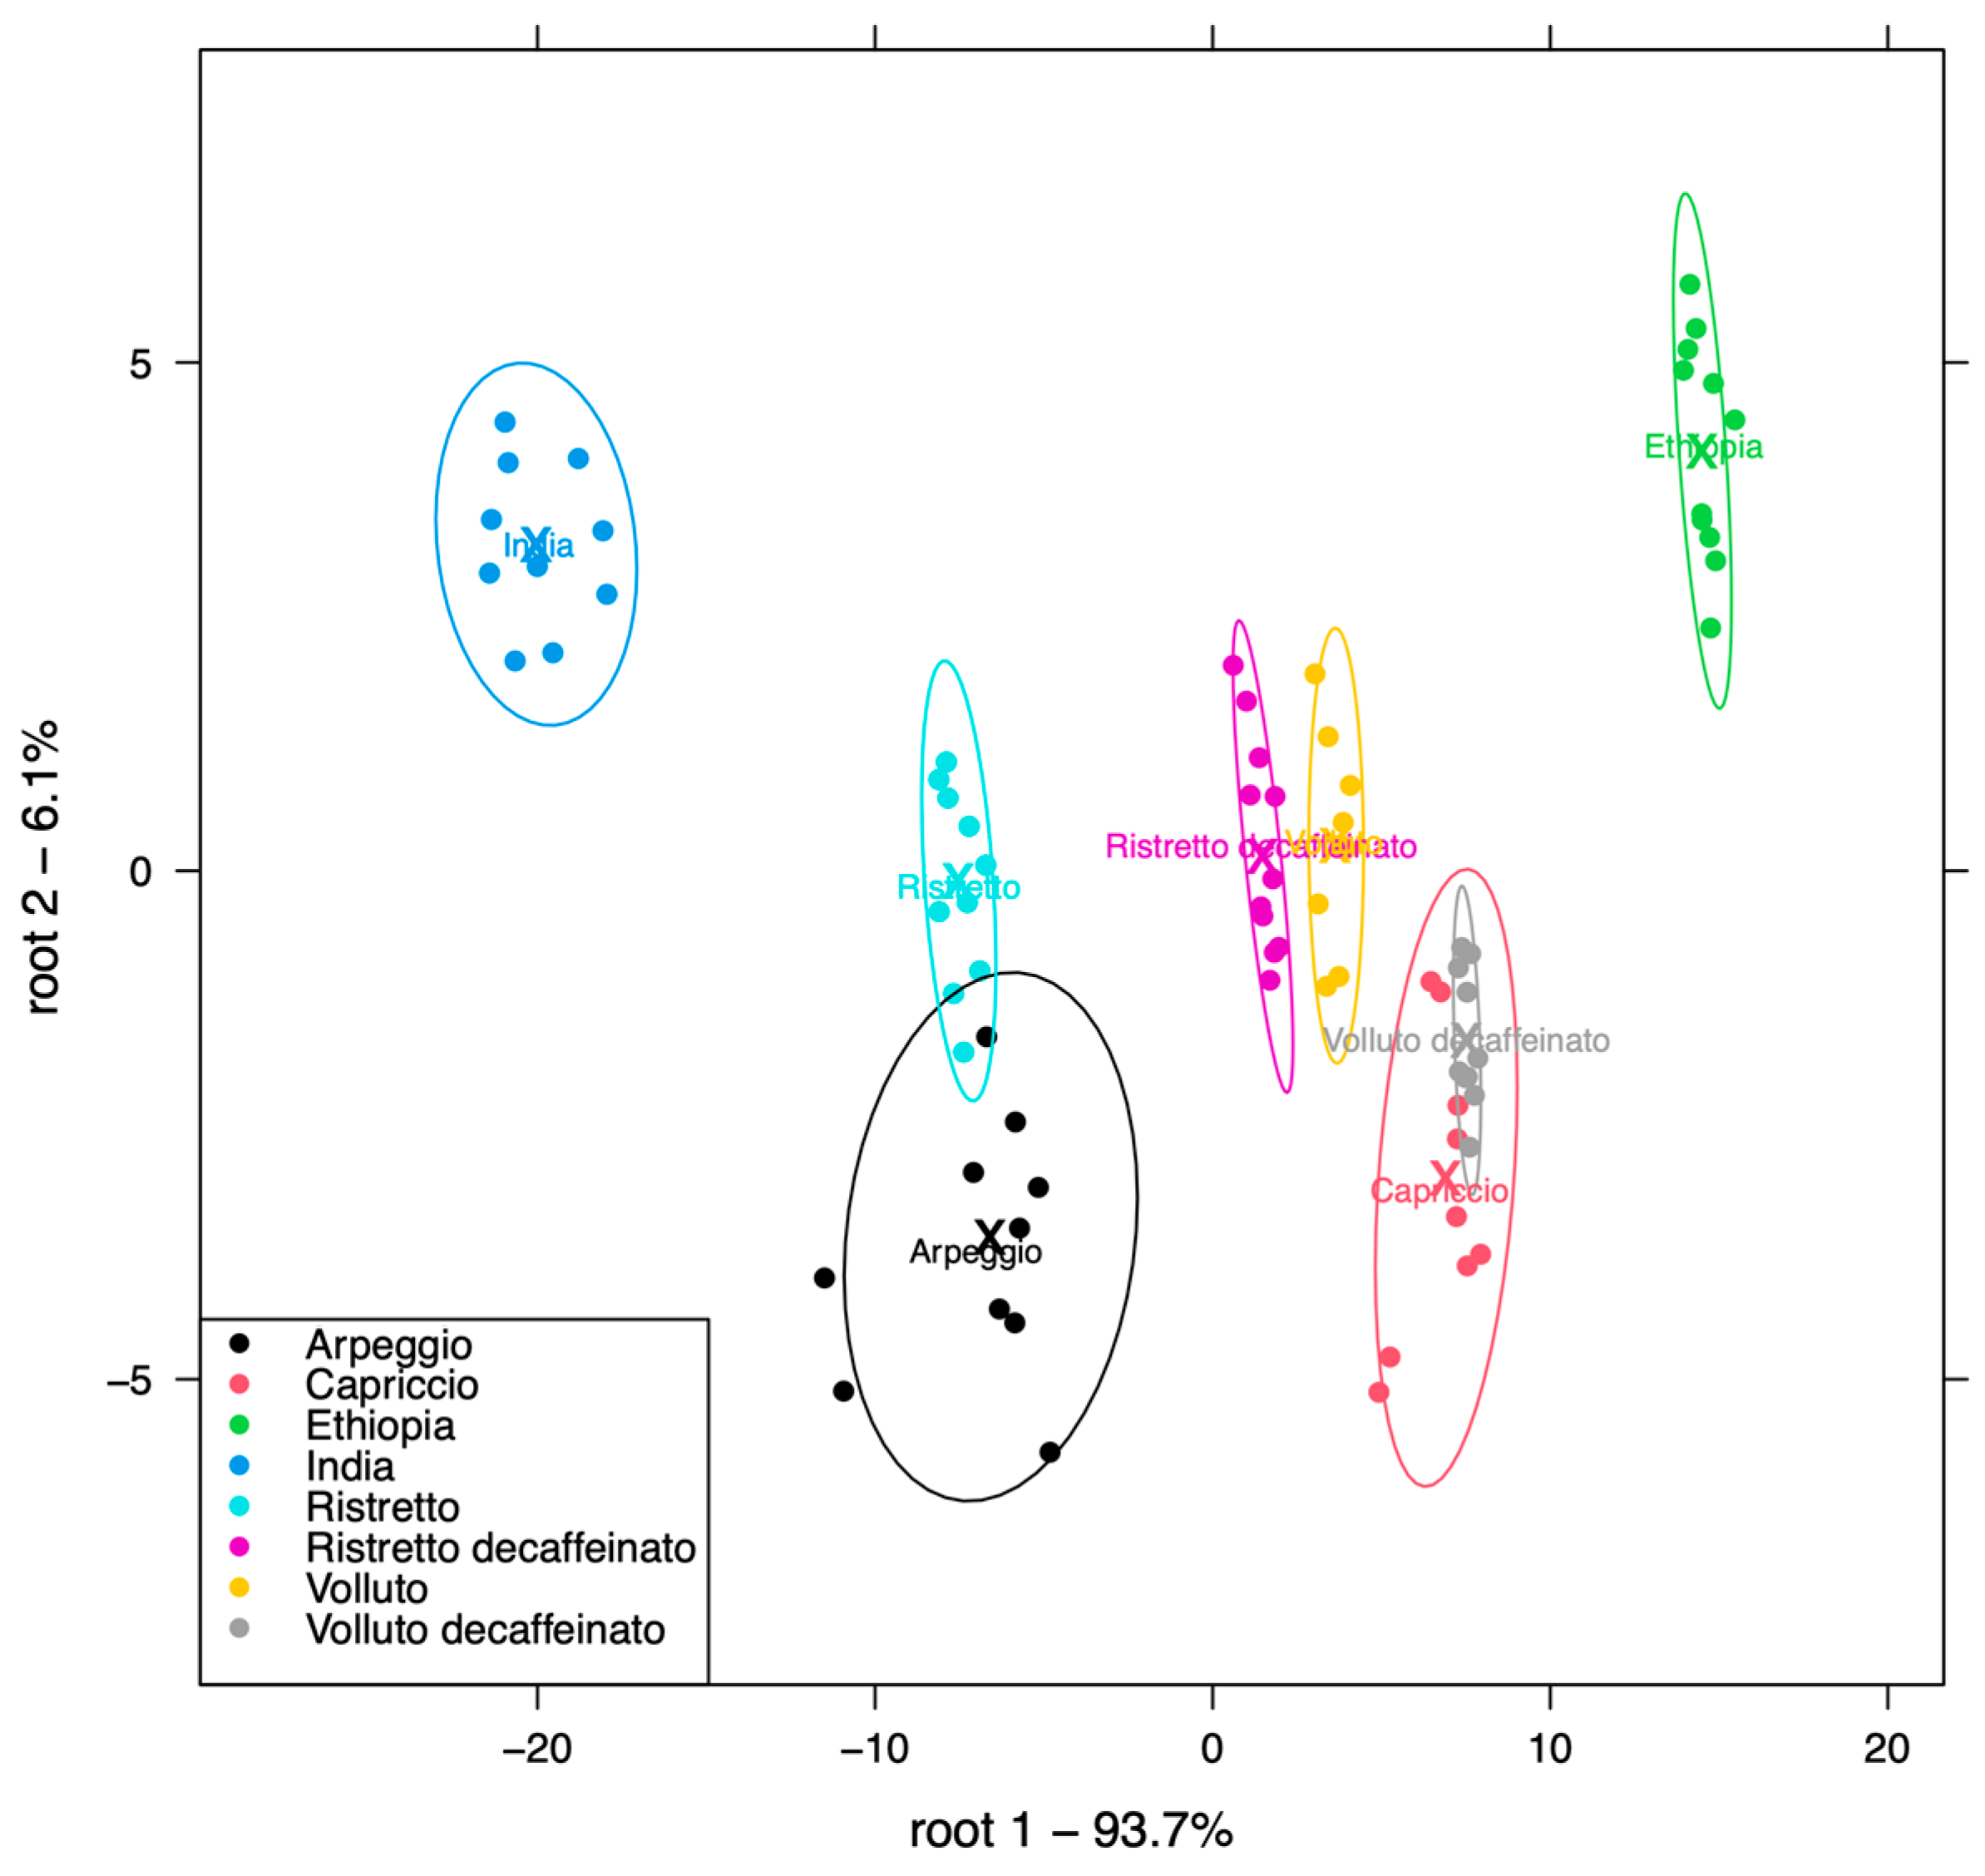
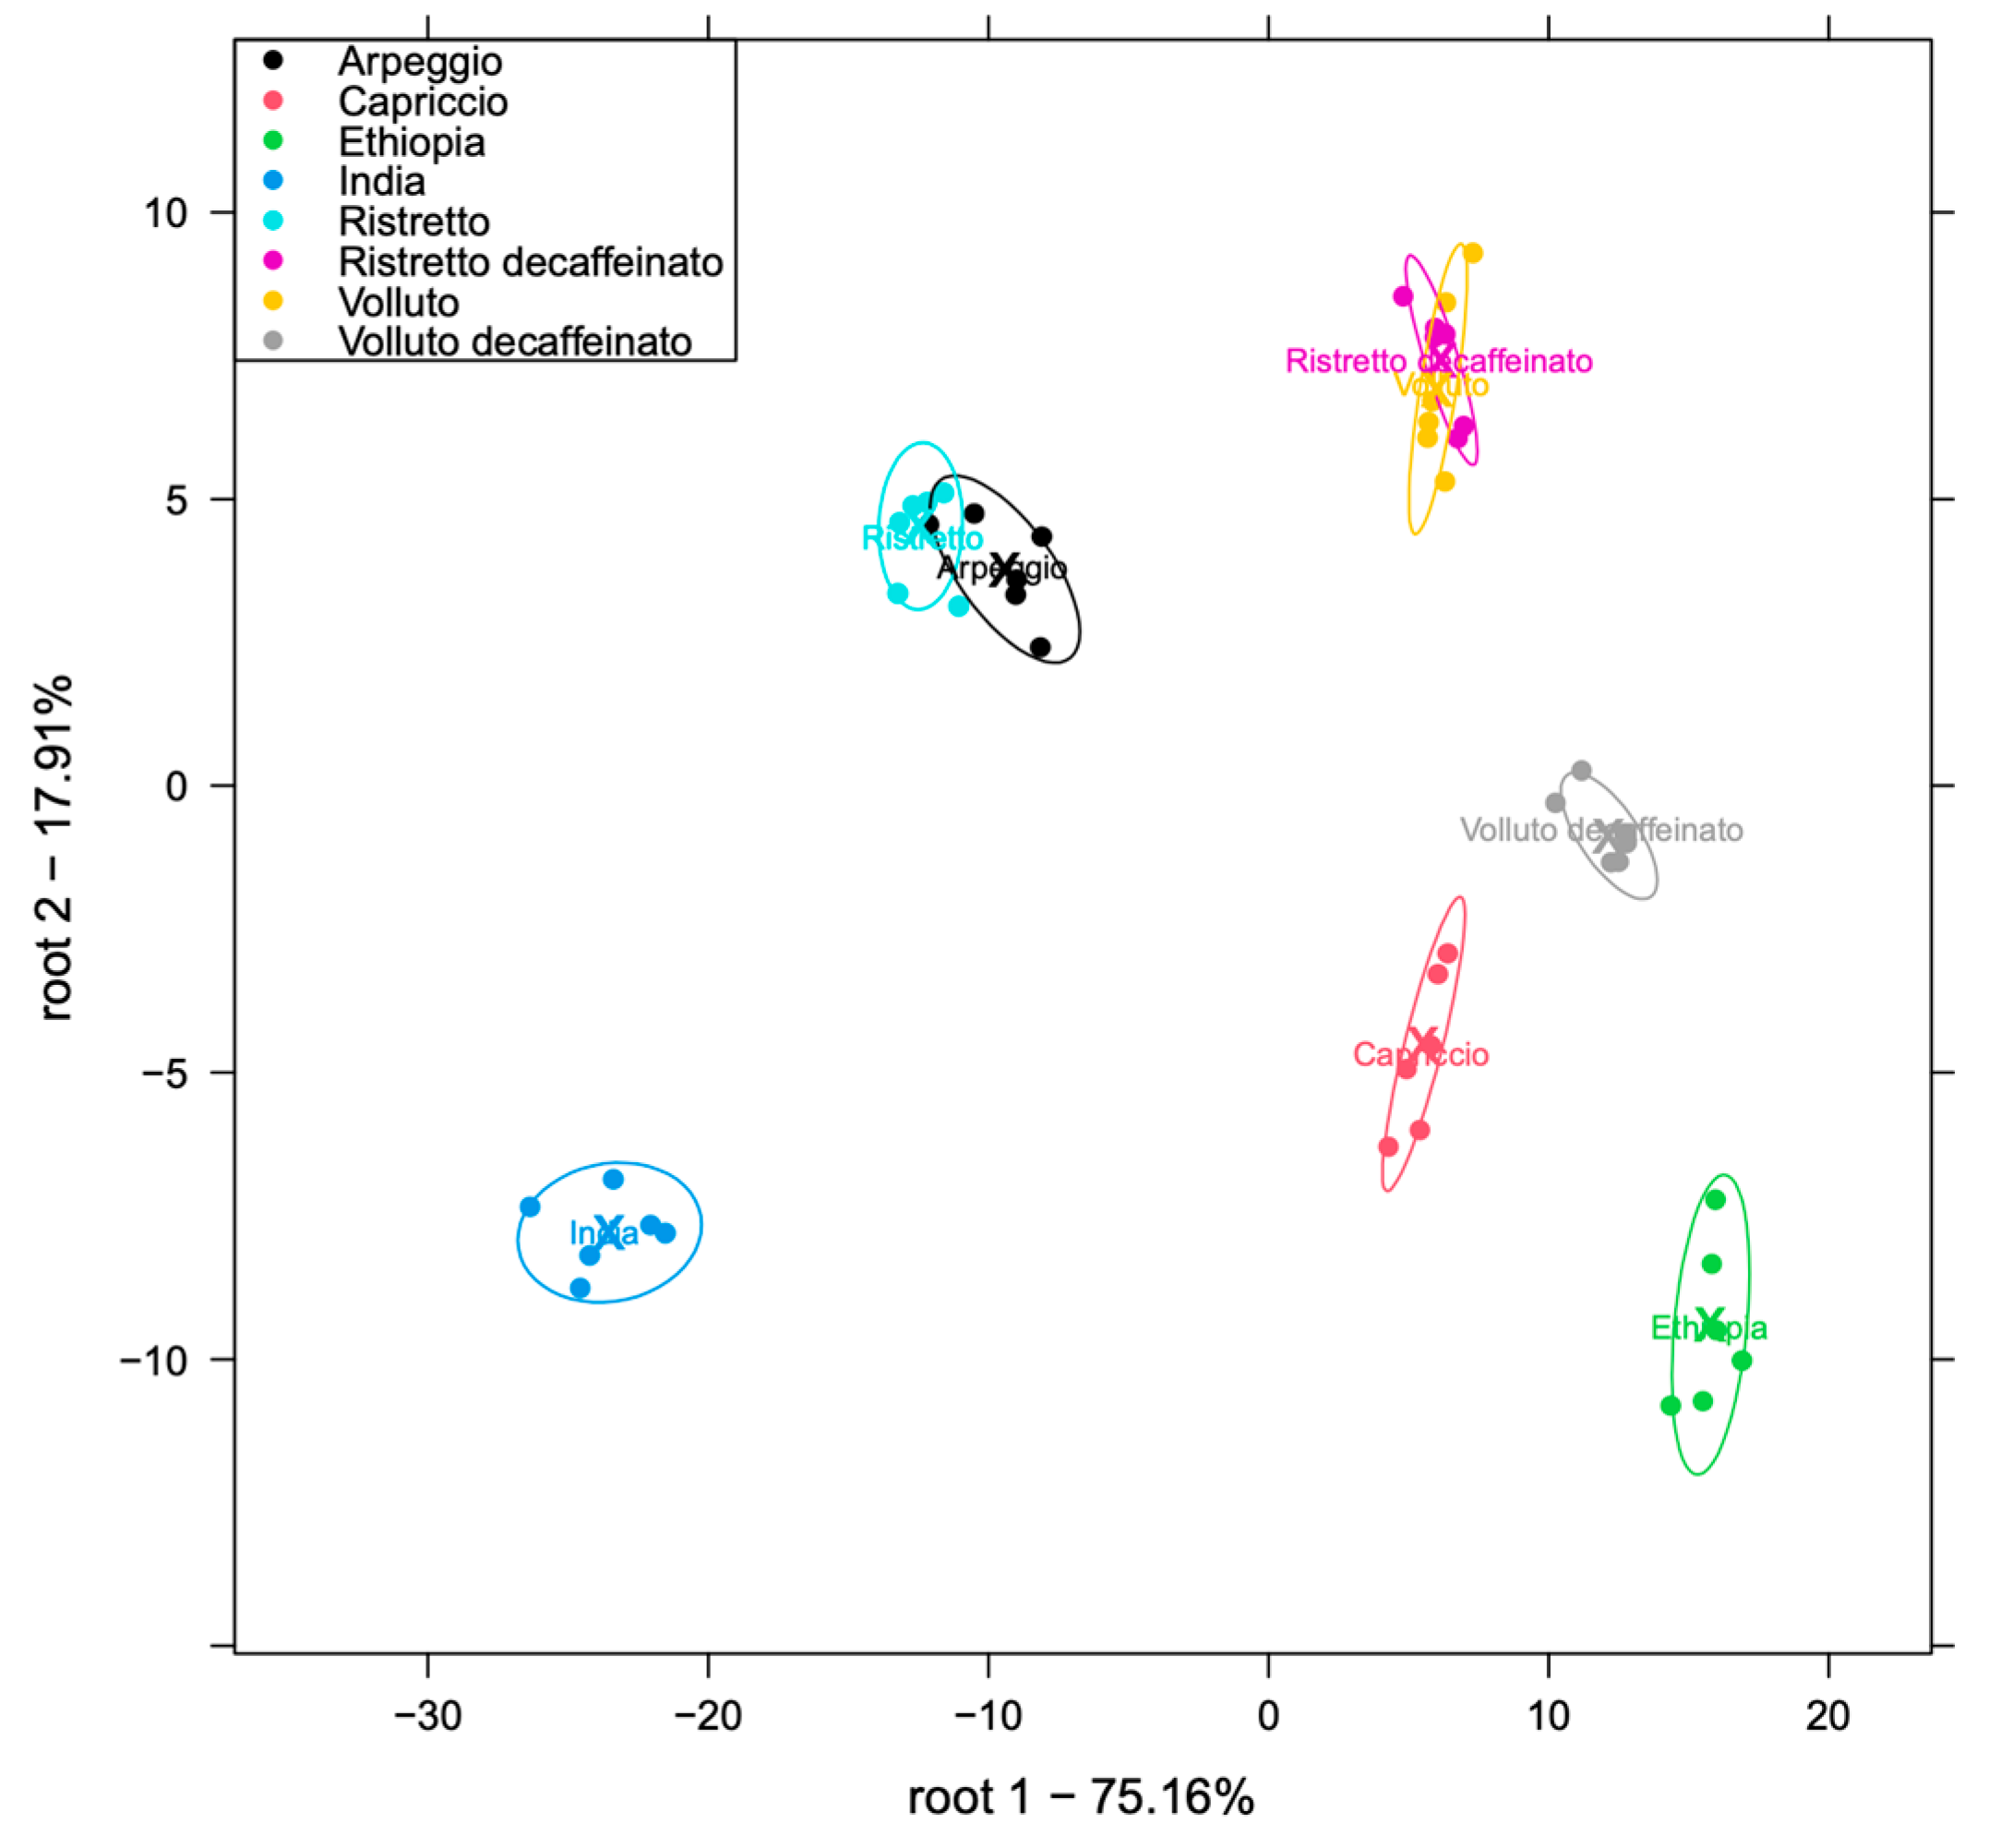
3.3. Scout3 E-Nose Measurements

During the data evaluation process, it became apparent that the third PID of the Scout3 e-nose gave incomprehensible data. Therefore, the data of the first and second PIDs were used for further evaluations. Figure 10 shows the sensor signals measured with the two PIDs of the Scout3 e-nose. The less characteristic “Ethiopia” coffees gave very distinct differences, i.e., higher peaks in some parts of the smell-prints.
Figure 11 displays the results of the principal component analysis (PCA) performed on the Scout3 e-nose data. On the PC1–PC2 plane, PC1 accounts for 56.29% and PC2 for 25.8% of the total variance. The most pronounced differentiation among the samples is observed along the PC2 axis. India and Ethiopia exhibit the greatest separation from each other and from the remaining coffee types, suggesting substantial differences in their aroma profiles. The other samples formed two partially overlapping clusters: one comprising Arpeggio, Ristretto, and Ristretto decaffeinato, and the other including Capriccio, Volluto, and Volluto decaffeinato. On the PC1–PC3 plane, a similar trend is observed along the PC3 component. However, in this case, the India sample does not separate clearly but overlaps with the Ristretto sample.
In the linear discriminant analysis (LDA) of the coffee samples based on both PID-1 and PID-2, as shown in Figure 12, Root 1 accounts for 88.52% of the total variance, while Root 2 explains 11.11%. Along the Root 1 axis, the India and Ethiopia samples are positioned at the greatest distance from each other, indicating significant differences in their aroma profiles. The Arpeggio sample also exhibits clear separation from the other samples, suggesting a distinct scent profile. The Ristretto and Ristretto decaffeinato samples are located close to each other but remain distinguishable. The Volluto and Volluto decaffeinato samples show slight overlap, indicating a high degree of similarity in their aroma profiles; however, they are distinctly separated from the Capriccio sample, which is the closest to this group yet remains clearly differentiated.
In Figure 13, the intensity plot (top left) shows that the samples can be grouped into three clusters. Among them, only sample V11 exhibits clear separation, while V04, V05, V09, and V10 form the other two groups, with slight overlap observed within these clusters. In the roasting plot (top right), samples V2, V4, and V5 are distinctly separated from the others, indicating substantial differences in their roasting characteristics. In the acidity plot (bottom left), all samples are clearly separated, with complete distinction observed among the groups. This suggests that acidity is a strong discriminating factor among the samples. In the bitterness plot (bottom right), the group consisting of V4 and V5 is well separated from the rest, while V2 and V3 display slight overlap, indicating a certain degree of similarity in the bitterness profiles.
Since there were no continuous variables of the sensory parameters, it was not possible to develop quantitative calibration models to predict the sensory parameters using the instrumentally measured aroma fingerprints. Therefore, LDA classifications were developed to classify the samples into the discrete categories defined by the values under each property parameter of Table 2. The hit rates of the cross-validations achieved with the three technologies are shown in Table 4. Overall, the Heracles e-nose showed the highest accuracy. The accuracies of the Scout3 e-nose were very close to those of the Heracles e-nose, while the Astree e-tongue had the lowest classification accuracy in this comparison.

4. Discussion

4.1. Discussion of the Results

This study validates the use of real and virtual sensor technologies in the food industry using coffee as an example, demonstrating the ability to differentiate variations between different coffee types and samples. The application of all the investigated instrumental aroma sensing technologies showed the ability to categorize the coffee samples based on their predefined sensory characteristics using the multivariate aroma fingerprints, suggesting that these technologies could be used as a differentiating testing tool where the standard tests using the same parameters failed [27,28].
The results highlight robust and promising abilities of the e-tongue and the e-nose to examine the complex sensory attributes of different types of coffee samples, including their acidity and flavor intensity, and even whether they are caffeinated or decaffeinated [28]. The decaffeinated coffee samples and their caffeinated counterparts had different responses on the Astree e-tongue and the Heracles e-nose, which indicates that despite decaffeinated coffees having similar sensory characteristics, there might be subtle differences in the soluble and volatile compounds that are captured by these technologies. The Scout3 e-nose could also separate the decaffeinated samples with less distinction because of the measured odor profile similarities. At the present stage, the Astree e-tongue and the Heracles e-nose technologies could be used to assess the quality of decaffeination technologies and evaluate the similarity in the original and decaffeinated samples.
The Heracles and Scout3 e-noses provided high accuracies in classifying the samples based on their odor into the sensory classes presented on the coffee capsules’ packaging, including flavor intensity, acidity, roast level, bitterness, and body.
All in all, these contemporary sensor technologies offer the food and beverage industry cost-effective, non-destructive, and less time-consuming methods for quality assessment, not only for coffee but also for other kinds of beverages and foods.

4.2. Discussion of the Testing Methodology

The instrumental aroma fingerprinting technologies investigated in this study have obvious differences: (1) the benchtop e-tongue (Astree) measures soluble molecules causing the taste with an array of ChemFET sensors having biological coatings, (2) the benchtop e-nose (Heracles) measures volatile compounds with a flash gas chromatograph having two different columns and FIDs, and (3) the portable e-nose (Scout3) measures volatile compounds with an isothermal gas chromatograph having one column and three different PIDs; on the other hand, (i) the e-tongue provides data of a real sensor array, while (ii) e-noses provide data of virtual sensor arrays generated from chromatograms.
The introduced simple testing methodology using standard coffee capsules of different coffee types can reveal the similarity in these diverse instrumental aroma fingerprinting technologies in terms of suitability and achievable results. The coffee test demonstrated that the above-mentioned technologies cluster the different coffee types in a comparable way: the relative arrangement of the types based on the instrumental aroma fingerprinting technologies was similar to the arrangement of the types based on the combination of the human sensory characteristics (compare the PCA score plot in Figure 1 with the LDA plots in Figure 4, and Figure 8, and Figure 12). In all classifications, the biggest difference was between the Ethiopia and India coffee samples, while the Ristretto and Arpeggio samples were always the closest to the India samples, and the Volluto and Capriccio samples were closest to the Ethiopia samples. The allocation of the groups on the LDA plots of the Astree e-tongue and the Heracles e-nose (Figure 4 and Figure 8) was almost the same; only root2 had the opposite sign [29]. Besides the similarities, the differences in the technologies were revealed. The Scout3 e-nose was less reliable in the differentiation of the decaffeinated coffee samples from their original counterparts.
When planning a similar test to (1) compare devices employing the same technology, or (2) compare different technologies, it is important to choose (i) diverse types of (ii) standard samples. To provide (ii) standard samples, capsule coffee was chosen, which can be purchased and brewed in the same quality all over the world, enabling users to compare measurement results globally. (i) Diversity was ensured with the selection of the types, ranging from the softest (Nespresso® Ethiopia) to the strongest aromas (Nespresso® India), with some others in the middle, having similarities and differences.
Aroma sensing shows great variability in the applied technologies. E-noses may employ arrays of metal oxide semiconductor sensors, conducting polymer sensors, optoelectronic sensors, piezoelectronic sensors, etc. The odor fingerprints of the same odor substances measured with the different technologies may differ in the data structure and measured values [30]. Therefore, a comparison of the technologies is essential to evaluate their performance capabilities: it is not evident that one technology can detect the differences in the same way as another one can, and it is not obvious that the measured data have a correlation with the human sensory characteristics.
A similar coffee test was performed with another e-nose employing different odor measuring technology, and non-comparable results were achieved, validating the need and applicability of such evaluation tests. Unfortunately, the authors are not authorized to publish the details of that instrument; still, a comparison of the results of the aforementioned e-nose with those of the Heracles e-nose is shown in Figure S1—the arrangements of the coffee types based on their aromas measured with the two technologies are completely different.
In summary, this study demonstrates a simple and cost-effective method to compare different aroma fingerprinting technologies based on measuring coffees brewed from standard coffee capsules. Regarding the investigated technologies, the test revealed the similarities in the taste and odor profiling capabilities of the Astree e-tongue, the Heracles e-nose, and the Scout3 e-nose. The established test can be used to evaluate instrumentational and data analytical developments worldwide. Constant monitoring of novel technologies based on similar tests is required to identify, compare, and evaluate different quality assessment tools aiming to describe aroma.

Supplementary Materials

The following supporting information can be downloaded at https://www.mdpi.com/article/10.3390/chemosensors13070261/s1, Figure S1. Results of the LDA classifications of samples of seven Nespresso® coffee types based on the odor fingerprint measured with (a) an AlphaMOS Heracles e-nose, and (b) an alternative e-nose.

Author Contributions

Conceptualization, G.B. and I.A.; methodology, G.B., Z.K., V.E., T.T. and I.A.; software, Z.G.; formal analysis, Z.K. and V.E.; investigation, B.G., Z.G., Z.K., V.E., T.T., H.G.Y. and G.B.; resources, Z.K., T.T. and G.B.; data curation, B.G., V.E. and Z.G.; writing—original draft preparation, B.G., H.G.Y. and G.B.; writing—review and editing, B.G., Z.G., Z.K., V.E., T.T., H.G.Y., I.A. and G.B.; visualization, Z.G. and B.G.; supervision, G.B. All authors have read and agreed to the published version of the manuscript.

Funding

This research received no external funding.

Institutional Review Board Statement

Not applicable.

Informed Consent Statement

Not applicable.

Data Availability Statement

The raw data supporting the results of this article can be downloaded at Supplementary Materials.

Acknowledgments

The authors are grateful to Adomas Malaiska and Lucas Lopez at Volatile Technologies LT UAB, Vilnius, Lithuania, for performing the measurements with the Volatile Scout3 electronic nose.

Conflicts of Interest

The authors declare no conflicts of interest.

References

  1. Nigra, A.D.; Teodoro, A.J.; Gil, G.A. A Decade of Research on Coffee as an Anticarcinogenic Beverage; Hindawi Limited: London, UK, 2021. [Google Scholar] [CrossRef]
  2. Mahmud, M.M.C.; Shellie, R.A. Unravelling the relationship between aroma compounds and consumer acceptance: Coffee as an example. Compr. Rev. Food Sci. Food Saf. 2020, 19, 2380–2420. [Google Scholar] [CrossRef] [PubMed]
  3. Safe, S.; Kothari, J.; Hailemariam, A.; Upadhyay, S.; Davidson, L.A.; Chapkin, R.S. Health Benefits of Coffee Consumption for Cancer and Other Diseases and Mechanisms of Action. Int. J. Mol. Sci. 2023, 24, 2706. [Google Scholar] [CrossRef] [PubMed]
  4. Pabon, C.D.R.; Sánchez-Benitez, J.; Ruiz-Rosero, J.; Ramirez-Gonzalez, G. Coffee Crop Science Metric: A Review; Editora UFLA: Lavras, Brazil, 2020. [Google Scholar] [CrossRef]
  5. Portela, C.S.; de Almeida, I.F.; Mori, A.L.B.; Yamashita, F.; de T, M. Brewing conditions impact on the composition and characteristics of cold brew Arabica and Robusta coffee beverages. LWT 2021, 143, 111090. [Google Scholar] [CrossRef]
  6. Assa, A.; Loppies, J.; Amalia, A.; Indriana, D.; Mamang; Utami, R.; Ariyanti, M.; Winaldi, A. Chemical compounds and sensory characteristics of arabica coffee (Coffea arabica) as a novel specialty coffee from Sinjai regency, Indonesia. Food Res. 2021, 5, 107–112. [Google Scholar] [CrossRef] [PubMed]
  7. Li, J. What Determines Coffee Aroma and Flavor? Berkeley Sci. J. 2022, 26, 59–63. [Google Scholar] [CrossRef]
  8. Esquivel, P.; Jiménez, V.M. Functional properties of coffee and coffee by-products. Food Res. Int. 2012, 46, 488–495. [Google Scholar] [CrossRef]
  9. Barbosa, I.P.; de Oliveira, A.C.B.; Rosado, R.D.S.; Sakiyama, N.S.; Cruz, C.D.; Pereira, A.A. Sensory analysis of arabica coffee: Cultivars of rust resistance with potential for the specialty coffee market. Euphytica 2020, 216, 165. [Google Scholar] [CrossRef]
  10. Nielsen, S.S. Introduction to Food Analysis; Springer: London, UK, 2024; pp. 3–14. [Google Scholar] [CrossRef]
  11. Marek, G.; Dobrzański, B.; Oniszczuk, T.; Combrzyński, M.; Ćwikła, D.; Rusinek, R. Detection and differentiation of volatile compound profiles in roasted coffee arabica beans from different countries using an electronic nose and GC-MS. Sensors 2020, 20, 2124. [Google Scholar] [CrossRef] [PubMed]
  12. Viejo, C.G.; Tongson, E.; Fuentes, S. Integrating a low-cost electronic nose and machine learning modelling to assess coffee aroma profile and intensity. Sensors 2021, 21, 2016. [Google Scholar] [CrossRef] [PubMed]
  13. Michishita, T.; Akiyama, M.; Hirano, Y.; Ikeda, M.; Sagara, Y.; Araki, T. Gas Chromatography/Olfactometry and Electronic Nose Analyses of Retronasal Aroma of Espresso and Correlation with Sensory Evaluation by an Artificial Neural Network. J. Food Sci. 2010, 75, S477–S489. [Google Scholar] [CrossRef] [PubMed]
  14. Arrieta, A.A.; Núñez, Y.E.; Mendoza, J.M. Mini-electronic tongue used to discriminate between coffee samples of different geographical origin. Int. J. Technol. 2020, 11, 288–298. [Google Scholar] [CrossRef]
  15. Peryam, D.R.; Girardot, N.F. Advanced taste test method. Food Eng. 1952, 24, 58–61. [Google Scholar]
  16. Bliss, P.J.; Schulz, T.J.; Senger, T.; Kaye, R.B. Odour measurement—Factors affecting olfactometry panel performance. Water Sci. Technol. 1996, 34, 549–556. [Google Scholar] [CrossRef]
  17. Sorokowska, A.; Sorokowski, P.; Frackowiak, T. Determinants of human olfactory performance: A cross-cultural study. Sci. Total Environ. 2015, 506–507, 196–200. [Google Scholar] [CrossRef] [PubMed]
  18. Yakubu, H.G.; Kovacs, Z.; Toth, T.; Bazar, G. Trends in artificial aroma sensing by means of electronic nose technologies to advance dairy production- a review. Crit. Rev. Food Sci. Nutr. 2021, 63, 234–248. [Google Scholar] [CrossRef] [PubMed]
  19. Tan, J.; Xu, J. Applications of Electronic Nose (e-Nose) and Electronic Tongue (e-Tongue) in Food Quality-Related Properties Determination: A Review; KeAi Communications Co.: Beijing, China, 2020. [Google Scholar] [CrossRef]
  20. Moshayedi, A.J.; Khan, A.S.; Yang, S.; Geng, K.; Hu, J.; Soleimani, S.; Razi, A. E-Nose design and structures from statistical analysis to application in robotic: A compressive review. EAI Endorsed Trans. AI Robot. 2023, 2, e1. [Google Scholar] [CrossRef]
  21. Flambeau, K.J.; Lee, W.J.; Yoon, J. Discrimination and geographical origin prediction of washed specialty Bourbon coffee from different coffee growing areas in Rwanda by using electronic nose and electronic tongue. Food Sci. Biotechnol. 2017, 26, 1245–1254. [Google Scholar] [CrossRef] [PubMed]
  22. Coffee Capsule|Nespresso Hungary. Available online: https://www.nespresso.com/hu/en/order/capsules/original (accessed on 7 July 2025).
  23. Kovács, Z. Thesis Method to Decrease the Disturbing Effects Occurring by the Electronic Tongue Measurement; Corvinus University of Budapest: Budapest, Hungary, 2012; Available online: https://core.ac.uk/download/pdf/33421263.pdf (accessed on 7 July 2025).
  24. Kovacs, Z.; Szöllősi, D.; Zaukuu, J.-L.Z.; Bodor, Z.; Vitális, F.; Aouadi, B.; Zsom-Muha, V.; Gillay, Z. Factors Influencing the Long-Term Stability of Electronic Tongue and Application of Improved Drift Correction Methods. Biosensors 2020, 10, 74. [Google Scholar] [CrossRef] [PubMed]
  25. Næs, T.; Isaksson, T.; Fearn, T.; Davies, T. A User Friendly Guide to Multivariate Calibration and Classification; NIR Publications: Chichester, UK, 2002. [Google Scholar]
  26. Kovacs, Z.; Pollner, B. Aquaphotomics-Software R-Package Aquap2. In Proceedings of the Understanding Water in Biology 2nd International Symposium, Kobe, Japan, 26–29 November 2016; pp. 26–29. [Google Scholar]
  27. Costa, A.M.S.; Sobral, M.M.C.; Delgadillo, I.; Rudnitskaya, A. Electronic tongue as a rapid tool for the assessment of coffee flavour and chemical composition. In Proceedings of the IEEE Sensors, Valencia, Spain, 2–5 November 2014; pp. 2126–2129. [Google Scholar] [CrossRef]
  28. Várvölgyi, E.; Kozits, S.; Soós, J.; Szöllosi, D.; Kovács, Z.; Fekete, A. Application of electronic tongue for distinguishing coffee samples and predicting sensory attributes. Prog. Agric. Eng. Sci. 2012, 8, 49–63. [Google Scholar] [CrossRef]
  29. Chen, Y.; Gao, B.; Lu, W. Recent Research Advancements of Coffee Quality Detection: Targeted Analyses vs. Nontargeted Fingerprinting and Related Issues. J. Food Qual. 2023, 2023, 6156247. [Google Scholar] [CrossRef]
  30. Gromski, P.S.; Correa, E.; Vaughan, A.A.; Wedge, D.C.; Turner, M.L.; Goodacre, R. A comparison of different chemometrics approaches for the robust classification of electronic nose data. Anal. Bioanal. Chem. 2014, 406, 7581–7590. [Google Scholar] [CrossRef] [PubMed]
Figure 1. PCA score plot based on the factory data of the Nespesso® coffees listed on the packaging (scores of the decaffeinated samples are identical to their caffeinated counterparts) (percentages on the axes show the ratio of the total variance in the original variables described by the respective principal component).
Chemosensors 13 00261 g001
Figure 2. The sensor signals of the Astree e-tongue for each type of Nespresso® coffee.
Chemosensors 13 00261 g002
Figure 3. PCA score plots of measurements taken with the Astree e-tongue grouped by coffee types: (a) plane of PC1 and PC2; (b) plane of PC1 and PC4 (percentages on the axes show the ratio of the total variance in the original variables described by the respective principal component).
Chemosensors 13 00261 g003
Figure 4. LDA classification of measurements taken with the Astree e-tongue (percentages on the axes show the ratio of the total variance in the original variables described by the respective discriminant factor/root).
Chemosensors 13 00261 g004
Figure 5. LDA classifications of measurements taken with the Astree e-tongue based on the sensory parameters indicated on the packaging, (a) Intensity; (b) roasting; (c) acidity; (d) bitterness (percentages on the axes show the ratio of the total variance in the original variables described by the respective discriminant factor/root).
Chemosensors 13 00261 g005
Figure 6. Sensor signals of the Heracles e-nose, colored by Nespresso® coffee types: (a) column-1; (b) column-2.
Chemosensors 13 00261 g006
Figure 7. PCA analysis of measurements taken with the Heracles e-nose using both columns, grouped by coffee type: (a) score plot of the PC1-PC2 plane; (b) score plot of the PC1-PC3 plane (percentages on the axes show the ratio of the total variance in the original variables described by the respective principal component).
Chemosensors 13 00261 g007
Figure 8. LDA analysis of measurements taken with the Heracles e-nose using both columns, grouping by the coffee type (number of latent variables: 4) (percentages on the axes show the ratio of the total variance in the original variables described by the respective discriminant factor/root).
Chemosensors 13 00261 g008
Figure 9. LDA analysis of measurements taken with the Heracles e-nose using both columns, grouping by the parameters provided by the coffee capsule manufacturer: (a) intensity; (b) roasting; (c) acidity; (d) bitterness (percentages on the axes show the ratio of the total variance in the original variables described by the respective discriminant factor/root).
Chemosensors 13 00261 g009
Figure 10. Sensor signals of the Scout3 e-nose, colored by Nespresso® coffee types: (a) PID-1; (b) PID-2.
Chemosensors 13 00261 g010
Figure 11. PCA analysis of measurements taken with the Scout3 e-nose using both PID-1 and PID-2, grouped by coffee type: (a) score plot of the PC1-PC2 plane; (b) score plot of the PC1-PC3 plane (percentages on the axes show the ratio of the total variance in the original variables described by the respective principal component).
Chemosensors 13 00261 g011
Figure 12. LDA analysis of measurements taken with the Scout3 e-nose using PID-1 and PID-2, grouped by coffee type (number of latent variables: 4) (percentages on the axes show the ratio of the total variance in the original variables described by the respective discriminant factor/root).
Chemosensors 13 00261 g012
Figure 13. LDA analysis of measurements taken with the Scout3 e-nose using both PID-1 and PID-2, grouped by the parameters provided by the coffee capsule manufacturer: (a) intensity; (b) roasting; (c) acidity; (d) bitterness (percentages on the axes show the ratio of the total variance in the original variables described by the respective discriminant factor/root).
Chemosensors 13 00261 g013
Table 1. Origin and roasting type of the Nespresso® coffees used for the analyses.
Coffee CapsuleIngredients/OriginRoast Type
ArpeggioPure Arabica from Costa RicaDeep roasting
CapriccioSouth American Arabicas (high-altitude), Brazilian Arabica and RobustaLight roasting
EthiopiaDry-processed Ethiopian ArabicaLight and short roasting
IndiaMonsooned Indian Robusta and Indian ArabicaNot specified
RistrettoLong-roasted Robusta from South India, quick-roasted Arabicas from Brazil and East AfricaCombination of long and quick roasting
Ristretto DecaffeinatoSlow split-roasted Brazilian Arabicas, Robusta from South India, Arabicas from South America and East AfricaSlow split roasting
VollutoBrazilian and Colombian ArabicasLight roasting
Volluto DecaffeinatoSplit-roasted Brazilian and Colombian ArabicasSplit roasting
Table 2. Types of Nespresso® coffees used for the analyses and the sensory properties listed on the packaging.
Coffee CapsuleTypeIntensityRoastingAcidityBitternessBody
ArpeggioArabica94244
CapriccioRobusta–Arabica52332
EthiopiaArabica42422
IndiaRobusta–Arabica115154
RistrettoRobusta–Arabica104344
Ristretto decaffeinatoRobusta–Arabica104344
VollutoArabica42322
Volluto decaffeinatoArabica42322
Table 3. Correlations between the parameters of the coffee types listed on the packaging.
IntensityRoastingAcidityBitternessBody
Intensity-0.98−0.660.970.98
Roasting0.98-−0.740.960.96
Acidity−0.66−0.74-−0.76−0.60
Bitterness0.970.96−0.76-0.92
Body0.980.96−0.600.92-
Table 4. Cross-validation accuracies of the LDA classifications based on the data of the Astree e-tongue, the Heracles e-nose, and the Scout3 e-nose.
GroupsCross-Validation Accuracy of the Astree E-TongueCross-Validation Accuracy of the Heracles E-NoseCross-Validation Accuracy of the Scout3 E-Nose
Nespresso® coffee types70%98%92%
Intensity62%85%85%
Roasting81%98%100%
Acidity84%92%96%
Bitterness74%85%90%
Body85%100%100%
Coffee blend65%75%69%
Disclaimer/Publisher’s Note: The statements, opinions and data contained in all publications are solely those of the individual author(s) and contributor(s) and not of MDPI and/or the editor(s). MDPI and/or the editor(s) disclaim responsibility for any injury to people or property resulting from any ideas, methods, instructions or products referred to in the content.

