Abstract
The early detection of liver cirrhosis (LC) is crucial due to its high morbidity and mortality in advanced stages. Reliable, non-invasive diagnostic tools are essential for timely intervention. Exhaled human breath, reflecting metabolic changes, offers significant potential for disease diagnosis. This paper focuses on the emerging role of sensor array-based volatile organic compounds (VOCs) analysis of exhaled breath, particularly using electronic nose (e-nose) technology to differentiate LC patients from healthy controls (HCs). This study included 55 participants: 27 LC patients and 28 HCs. Sensor’s measurement data were analyzed using machine learning techniques, such as principal component analysis (PCA), discriminant function analysis (DFA), and support vector machines (SVMs) that were utilized to uncover meaningful patterns and facilitate accurate classification of sensor-derived information. The diagnostic accuracy was thoroughly assessed through receiver operating characteristic (ROC) curve analysis, with specific emphasis on assessing sensitivity and specificity metrics. The e-nose effectively distinguished LC from HC, with PCA explaining 92.50% variance and SVMs achieving 100% classification accuracy. This study demonstrates the significant potential of e-nose technology towards VOCs analysis in exhaled breath, as a valuable tool for LC diagnosis. It also explores feature extraction methods and suitable algorithms for effectively distinguishing between LC patients and controls. This research provides a foundation for advancing breath-based diagnostic technologies for early detection and monitoring of liver cirrhosis.
1. Introduction
Liver disease has emerged as a significant global health challenge, claiming the lives of two million people annually worldwide. Among these, one million deaths are attributed to complications arising from cirrhosis [1,2,3]. This high mortality rate is largely attributed to the late detection of symptoms. These often occur at advanced stages or when the disease has already reached a metastatic state [4]. Despite significant advancements in recent years, liver cirrhosis (LC) continues to claim numerous lives globally. This persistent mortality is also driven by the high cost of treatment, which remains a barrier in many regions of the world [5,6]. Patients with liver cirrhosis (LC) often rely on pharmacological treatments and surgery to manage their condition. However, early detection and timely intervention can slow or even halt disease progression, potentially reducing the need for invasive procedures. Therefore, developing reliable and effective diagnostic methods is crucial. While current therapies are beneficial, they do not fully address the disease burden, underscoring the need for advanced tools that enable early detection.
Early detection is essential for prompt treatment to reduce severity and mortality. Traditional diagnostic tests often face delays, hindering timely diagnosis and intervention. Chromatography techniques, while efficient and sensitive, require structured laboratory settings, are resource intensive, and do not provide rapid results. Additionally, some methods involve patient irradiation or invasive procedures, which add complexity and discomfort. These limitations highlight the need for alternatives. Developing robust, non-invasive diagnostic techniques based on volatile organic compounds (VOCs) analysis could offer a safer, more accessible, and patient-friendly alternative for early LC detection and management, ultimately saving lives worldwide [7].
VOCs have been studied for years in disease diagnosis. Metabolic changes in affected cells alter VOC production in the blood, leading to detectable changes in exhaled breath. As by-products of metabolic processes, VOCs show significant concentration shifts in response to pathological changes or disease states [8,9,10,11]. In essence, the onset and progression of many diseases are associated with distinctive shifts in the composition and abundance of specific VOCs, highlighting their diagnostic potential as non-invasive indicators of metabolic or physiological disturbances [12].
To achieve this, incorporating the analysis of exhaled breath samples is recommended [13,14]. This has led to the development of multi-sensory systems, such as electronic noses, which offers advantages like simplicity, reliability, cost effectiveness, and rapid results, even in complex environments and for untrained personnel [15,16,17].
E-noses work with sensor arrays that can detect a wide range of compounds accurately. Their effectiveness comes from the unique properties of the sensors, which are well known and make the device useful in many different applications [18,19].
The detection method relies on analyzing samples with diverse chemical signatures, thereby enabling the effective identification of a wide range of compounds [20,21]. They have a wide range of applications, including its use in the automotive industry [22], pharmaceuticals and medicine [23], agriculture [24], military industry [25], and environment monitoring [26]. This work focuses on the biomedical field, with a particular emphasis on the analysis of human breath. Recently, several studies have focused on employing multi-sensor systems, known as electronic noses and tongues, for LC diagnosis [3,27,28].
When these devices are integrated with chemometric techniques, they have proven to demonstrate considerable effectiveness in addressing complex analytical challenges [29]. Chemometric methods are used to classify samples by identifying and differentiating their chemical signatures. In recent decades, electrochemistry-based analytical platforms have become essential for generating comprehensive multi-element profiles. Key chemometric tools commonly employed in this field include PCA, which is primarily utilized for dimensional data reduction, DFA applied for classification tasks, and SVMs that excel in pattern recognition. Additionally, e-nose responses combined with pattern recognition methods can help establish distinctive signatures for analyzing various gas samples [30,31].
This study aimed to use an e-nose with pattern recognition method to analyze exhaled breath samples from LC and HC patients. The goal was to identify and distinguish VOCs in exhaled breath, enabling differentiation between the two health states.
2. Materials and Methods
2.1. Exhaled Breath Collection
Human exhaled breath can be collected by non-invasive sampling method by using Tedlar bags. A large number of volatile organic compounds (VOCs) which are detected come from endogenous odor. Normally, the procedure of breath sampling is carried out in a cleaner room of the hospital which is well appointed for this purpose in which most exogenous VOCs come from the inhalation of indoor odor. Precautions are taken to avoid outdoor air pollutants, such as compounds from tobacco smoke, compounds derived from fossil fuel combustion, or household products.
A total of 165 breath samples were collected in 2 L Tedlar bags from 27 patients diagnosed with LC and 28 LC-free controls. All patient samples were collected during the early stages of the disease. Table 1 outlines the demographic and general characteristics of the participants. Only adult volunteers were included, while individuals who had consumed food, medication, alcohol, or tobacco before noon were excluded to ensure result consistency. A total of 132 breath samples from 44 subjects were used to train the model and 33 breath samples from 11 subjects were used to evaluate it. Currently, there is no standardized method for breath sampling in the literature [32] and various protocols are employed for samples analysis [33].

Table 1.
General characteristics of all studied volunteers.
Volunteers were instructed to rinse their mouths thoroughly prior to the collection of exhaled breath samples in order to minimize contamination. Sample collection was conducted in the morning prior to any food intake by either patients or healthy volunteers. Breath samples were collected using 2-liter commercial Tedlar® bags (Supelco Inc., Bellefonte, PA, USA) equipped with a mouthpiece and a one-way valve to prevent external air contamination. Each volunteer provided three breath samples by exhaling into the Tedlar® bags through the valve system. To ensure the integrity of the samples, the Tedlar® bags were thoroughly cleaned with synthetic air three times both before and after each collection. This rigorous cleaning process minimized residual contamination and ensured reliable sampling conditions. Tedlar® bags have demonstrated superior sample storage properties compared to bags made from other materials [34].
The study was ethically approved by the Biomedical Research Ethics Committee of Avicenne University Hospital (Mohammed V University, Rabat, Morocco). Before sample collection, all participants provided informed consent following ethical guidelines.
2.2. Analysis of Exhaled Breath
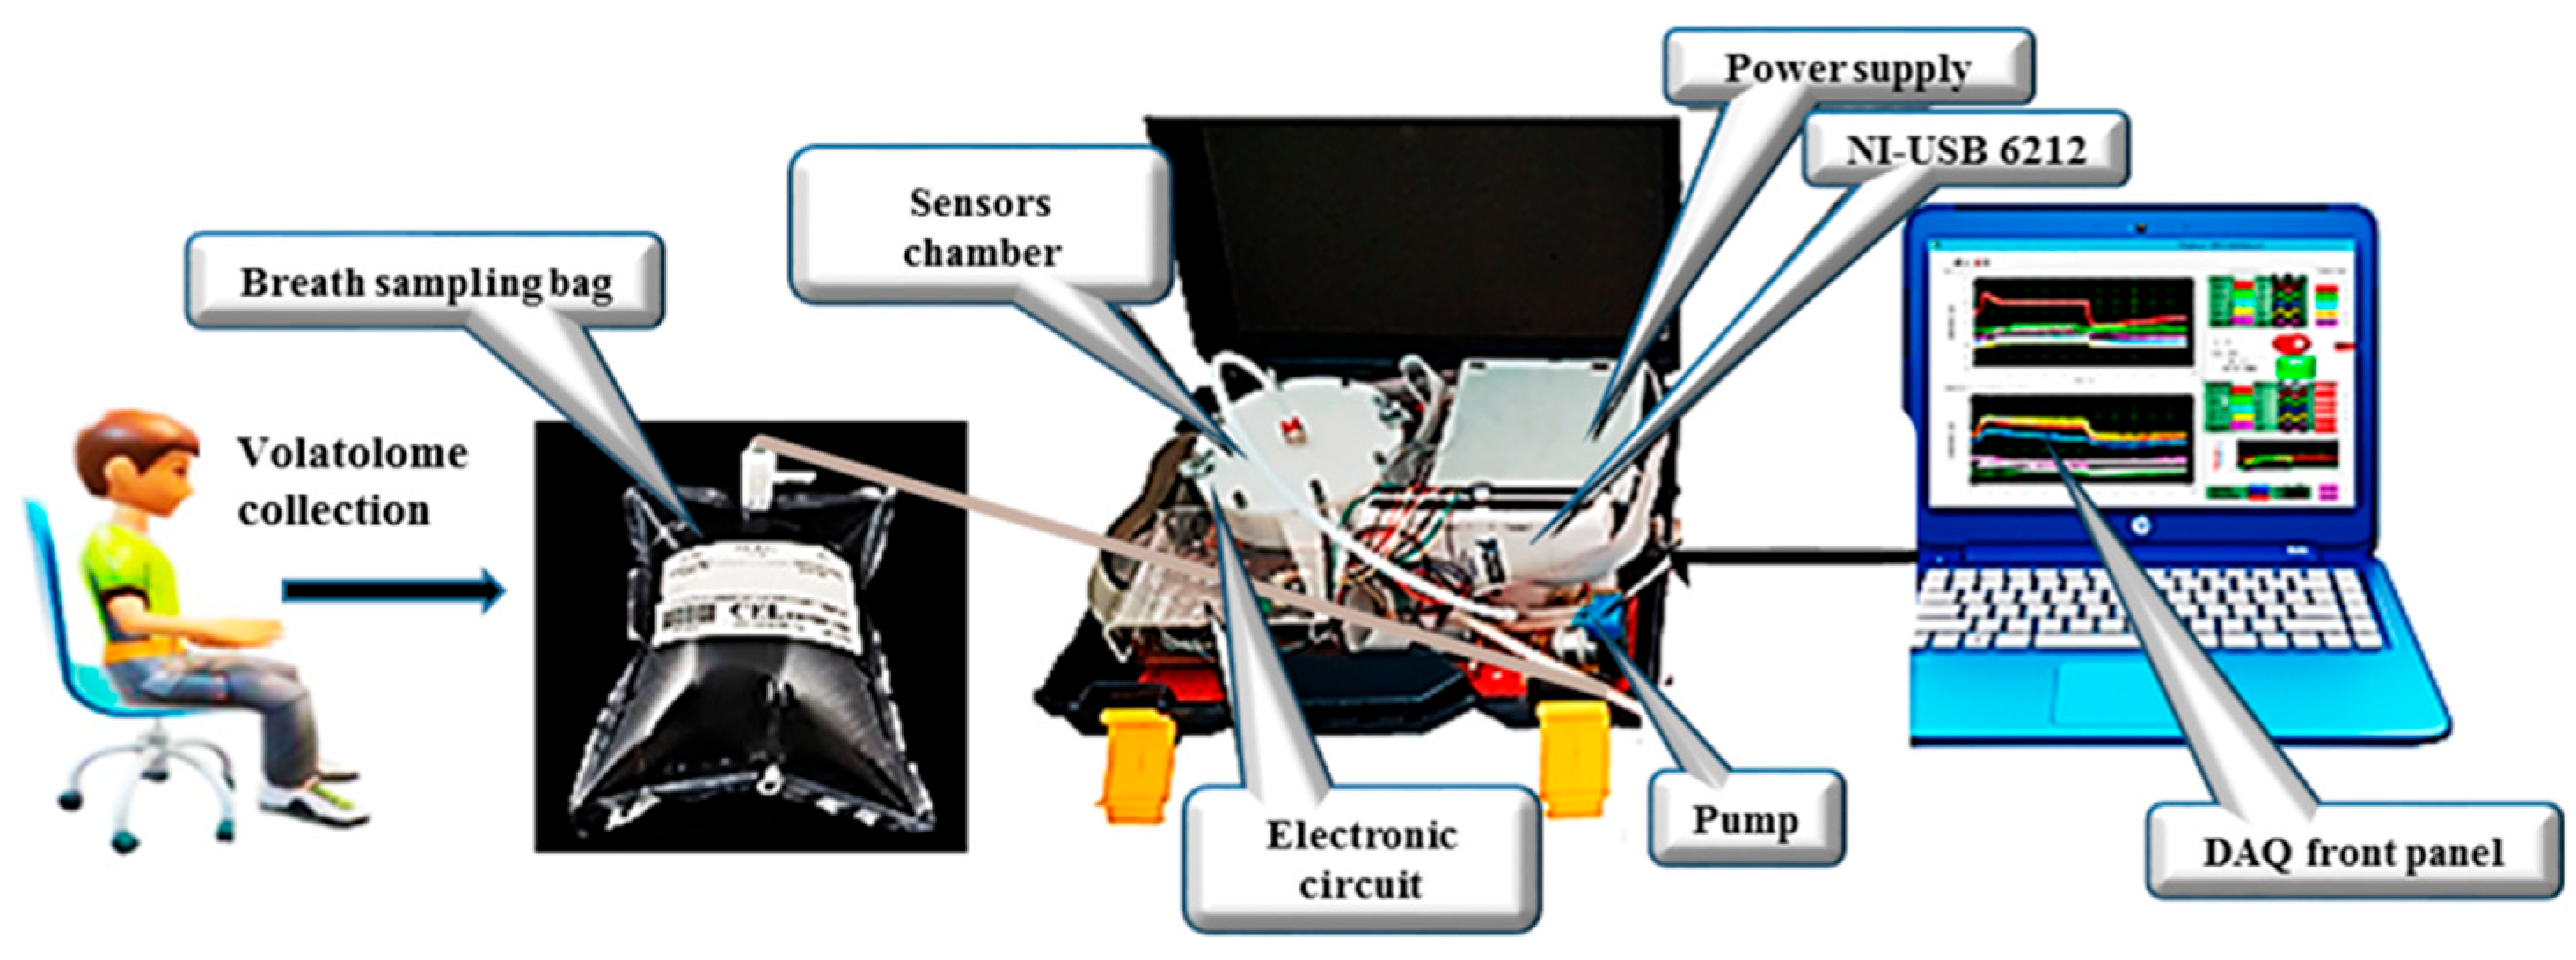
An e-nose system was employed to analyze VOCs in exhaled breath samples collected from patients with LC and HCs. The schematic diagram of the system is presented in Figure 1. The electronic nose developed in this study utilizes an array of five Metal Oxide Semiconductor (MOS) sensors, specifically the MQ-2, MQ-3, MQ-135, MQ-137, and MQ-163 models from Henan Hanwei Electronics Co., Ltd. (Henan, China). These sensors are strategically positioned within a 250 mL analysis chamber that facilitates the circulation of gas samples (Figure 1). The system is equipped with essential components including a Tedlar® bag for the collection of breath samples, a micro-pump for vapor movement, a USB-6212 NI module for data acquisition, and a LabVIEW interface for real-time monitoring and recording of sensor outputs. Each gas sensor in the e-nose array is selected based on its unique sensitivity to detect specific target compounds. To maintain stable environmental conditions throughout the analysis, the system integrates two additional sensors: the Honeywell HIH 4000-002 for humidity measurement and the LM35DZ for temperature monitoring, both of which are from National Semiconductor. They provide real-time environmental data and ensure consistent analytical conditions.

Figure 1.
Schematic of the e-nose used to analyze human exhaled breath.
For each participant in the study, three breath samples were collected in identical Tedlar® bags and subsequently transferred to the sensor chamber for analysis. Following a stabilization period, the sample headspace was analyzed using flow injection facilitated by a micro-pump operating at a flow rate of 200 mL/min for a duration of 10 min. This process allowed for the effective transport of the analyte to the sensor chamber. To ensure accurate measurements, a 10 min purge with atmospheric air was conducted between each sample analysis, allowing the gas sensor arrays to return to their baseline levels.
2.3. Data Pre-Processing
Sensor response drift is a well-recognized challenge in e-nose systems, and was systematically addressed in this study to ensure the accuracy and reliability of the results. Various drift correction techniques were applied during data pre-processing to minimize its impact and improve the consistency of sensor performance [35].
A normalization procedure was implemented for each gas sensor response to mitigate the effects of drift. The normalization formula used was (G − G0)/G0, where G is the measured conductance and G0 represents the baseline conductance. For machine learning techniques, we also applied Z-score normalization, which involved subtracting the mean and dividing by the standard deviation of the sensor data. This method ensured that the sensor outputs were consistent, compensating for potential drift due to environmental factors or sensor aging. This approach standardized sensor responses, reduced variability caused by drift, and enhanced the robustness of the subsequent analysis [35].
To optimize the analysis of multivariate data and streamline computational processing, only the most relevant variables were selected from the initial dataset. This selection process was designed to retain the maximum amount of meaningful information derived from the sensor responses of the e-nose system. In this study, the analysis focused on two key features extracted from the sensor responses:
- ❖
- ∆G = (Gs − G0): The difference between the stabilized conductance (Gs) and the initial conductance (G0);
- ❖
- AUC (area under the curve): The area under the response curve of each sensor, calculated using the trapezoidal method. The AUC was determined over the measurement interval from one to nine minutes of the total response time. It quantifies the overall intensity of the sensor response over a given period. It is more robust than maximum or minimum values because it captures the entire dynamics of the signal. The AUC helps to better differentiate breath profiles and the compounds detected by gas sensors. It can be correlated with the total concentration of volatile compounds present in the breath. This measure is less sensitive to local fluctuations and signal noise.
The study analyzed 165 breath samples collected from 55 volunteers, with each volunteer providing three samples in Tedlar® bags. For each sample, the two key features, ΔG and AUC, were extracted from the responses of all the five gas sensors. This process resulted in the extraction of ten features per breath sample. With 165 total samples, the complete dataset consisted of 1650 features (165 × 10), ensuring comprehensive representation of the sensor responses while reducing data dimensionality for analysis.
2.4. Data Analysis
After extracting the relevant variables (Excel file containing row data are provided as Supplementary Information), machine-learning techniques including PCA, DFA, and SVMs were employed to classify the analyzed samples. These techniques facilitated enhanced visualization and interpretation of the results [36]. Chemometric methods are vital for developing practical systems that can effectively characterize a diverse range of compounds [37]. The application of these methods in this study aims to evaluate the efficacy of the electronic nose system in differentiating between two types of breath group samples.
PCA, an unsupervised linear method, employs orthogonal transformations to reduce the dimensionality of multivariate data while retaining as much variance as possible [38,39]. This transformation ensures that the principal components (PCs) capture the maximum variance while maintaining orthogonally. In this research, PCA was applied to the multivariate data from the electronic nose, resulting in a clear representation of the data within a lower-dimensional space.
DFA is a supervised chemometric method with a proven track record of effectiveness in various applications of electronic sensing systems [40]. The DFA method determines discriminant functions by minimizing the variance within groups (intra-class variance) while simultaneously maximizing the variance between groups (inter-class variance).
The SVM technique is a supervised, non-linear approach that aims to achieve optimal classification by establishing a boundary that maximizes the distance between data points of different categories. The maximum margin refers to the maximum distance between the decision boundary (separation boundary) and the nearest data points from each class, known as support vectors [41]. SVMs function by constructing a hyperplane that separates data into distinct classes. While there may be multiple valid hyperplanes, SVMs are designed to identify the one that not only divides the points of the two classes but also maximizes the margin between them, ensuring the greatest possible separation from the nearest data points.
Additionally, an ROC curve serves as a graphical representation of the diagnostic performance of a binary classification system across various discrimination thresholds. It is generated by plotting the true positive rate (TPR) against the false positive rate (FPR) for different threshold values [42].
3. Results and Discussion
3.1. E-Nose Responses Towards Exhaled Breath Samples
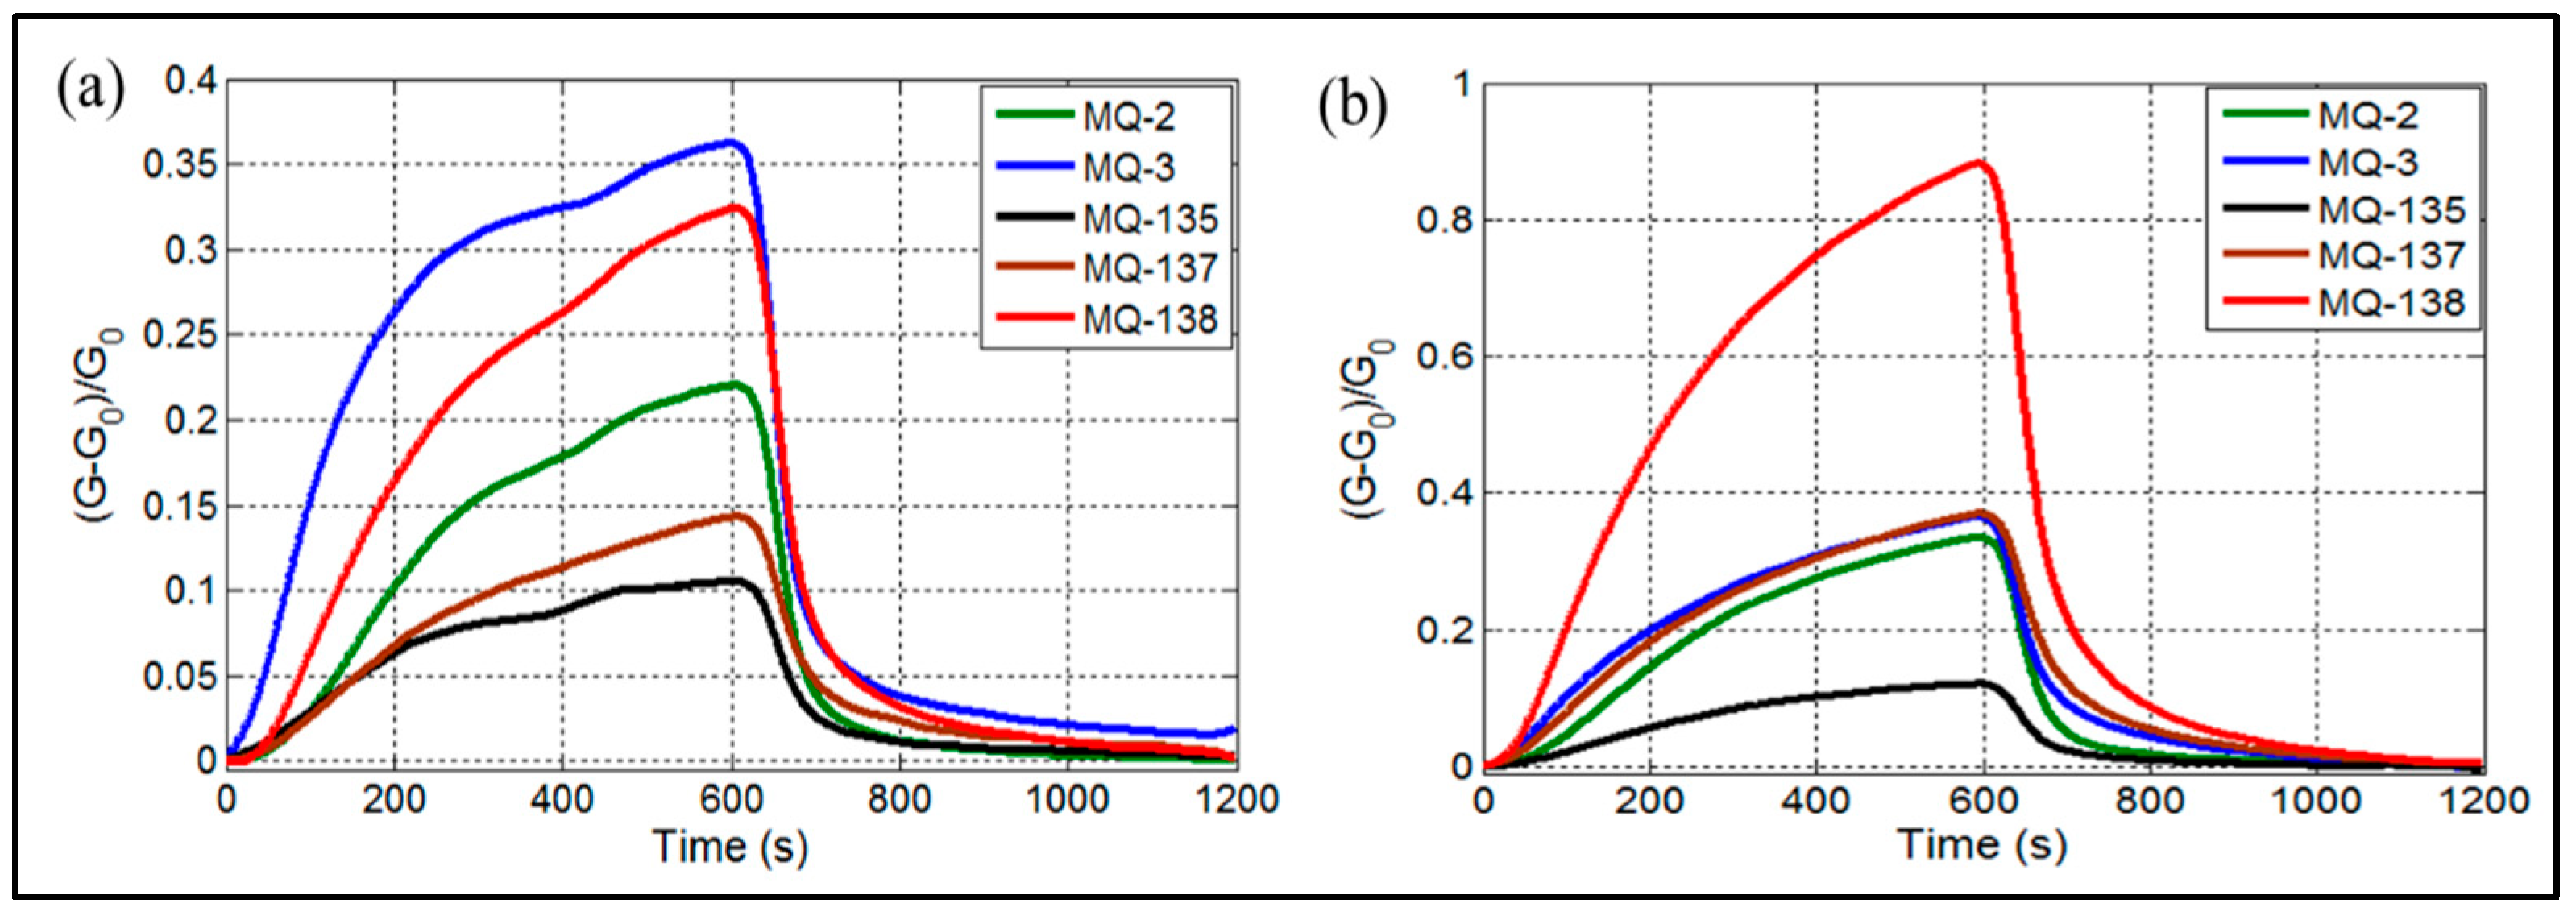
When samples are introduced into the electronic nose, the sensors begin to interact with various components based on the chemical nature of the volatile organic compounds present in the breath. This results in the generation of signals. Figure 2 illustrates the responses of the gas sensors to exhaled breath samples from HC (Figure 2a) and LC groups (Figure 2b). As depicted in Figure 2, the sensor arrays’ response toward exhaled breath was closely tied to both gas detection and pattern recognition. The MQ-138 sensor, shown in Figure 2b, demonstrated higher sensitivity compared to the other sensors. Numerous studies have analyzed breath VOCs biomarkers in LC patients, identifying volatile compounds associated with liver cirrhosis, including methanol [3,43], dimethyl sulfide [44,45], ethanol, and toluene [45]. While the other sensors exhibited relatively lower signals, distinct differences were observed between LC patients and HC, as shown in Figure 2a. Notably, the gas reaction was completed after 600 seconds, whereas gas desorption was finalized in approximately 600 seconds for MQ sensors. This behavior can be attributed to the varying VOC concentrations in the breath samples of HC and LC patients [3].

Figure 2.
E-nose responses of MQ gas sensors when exposed to exhaled breath of (a) healthy controls, (b) liver cirrhosis patients.
3.2. Radar Plot Results
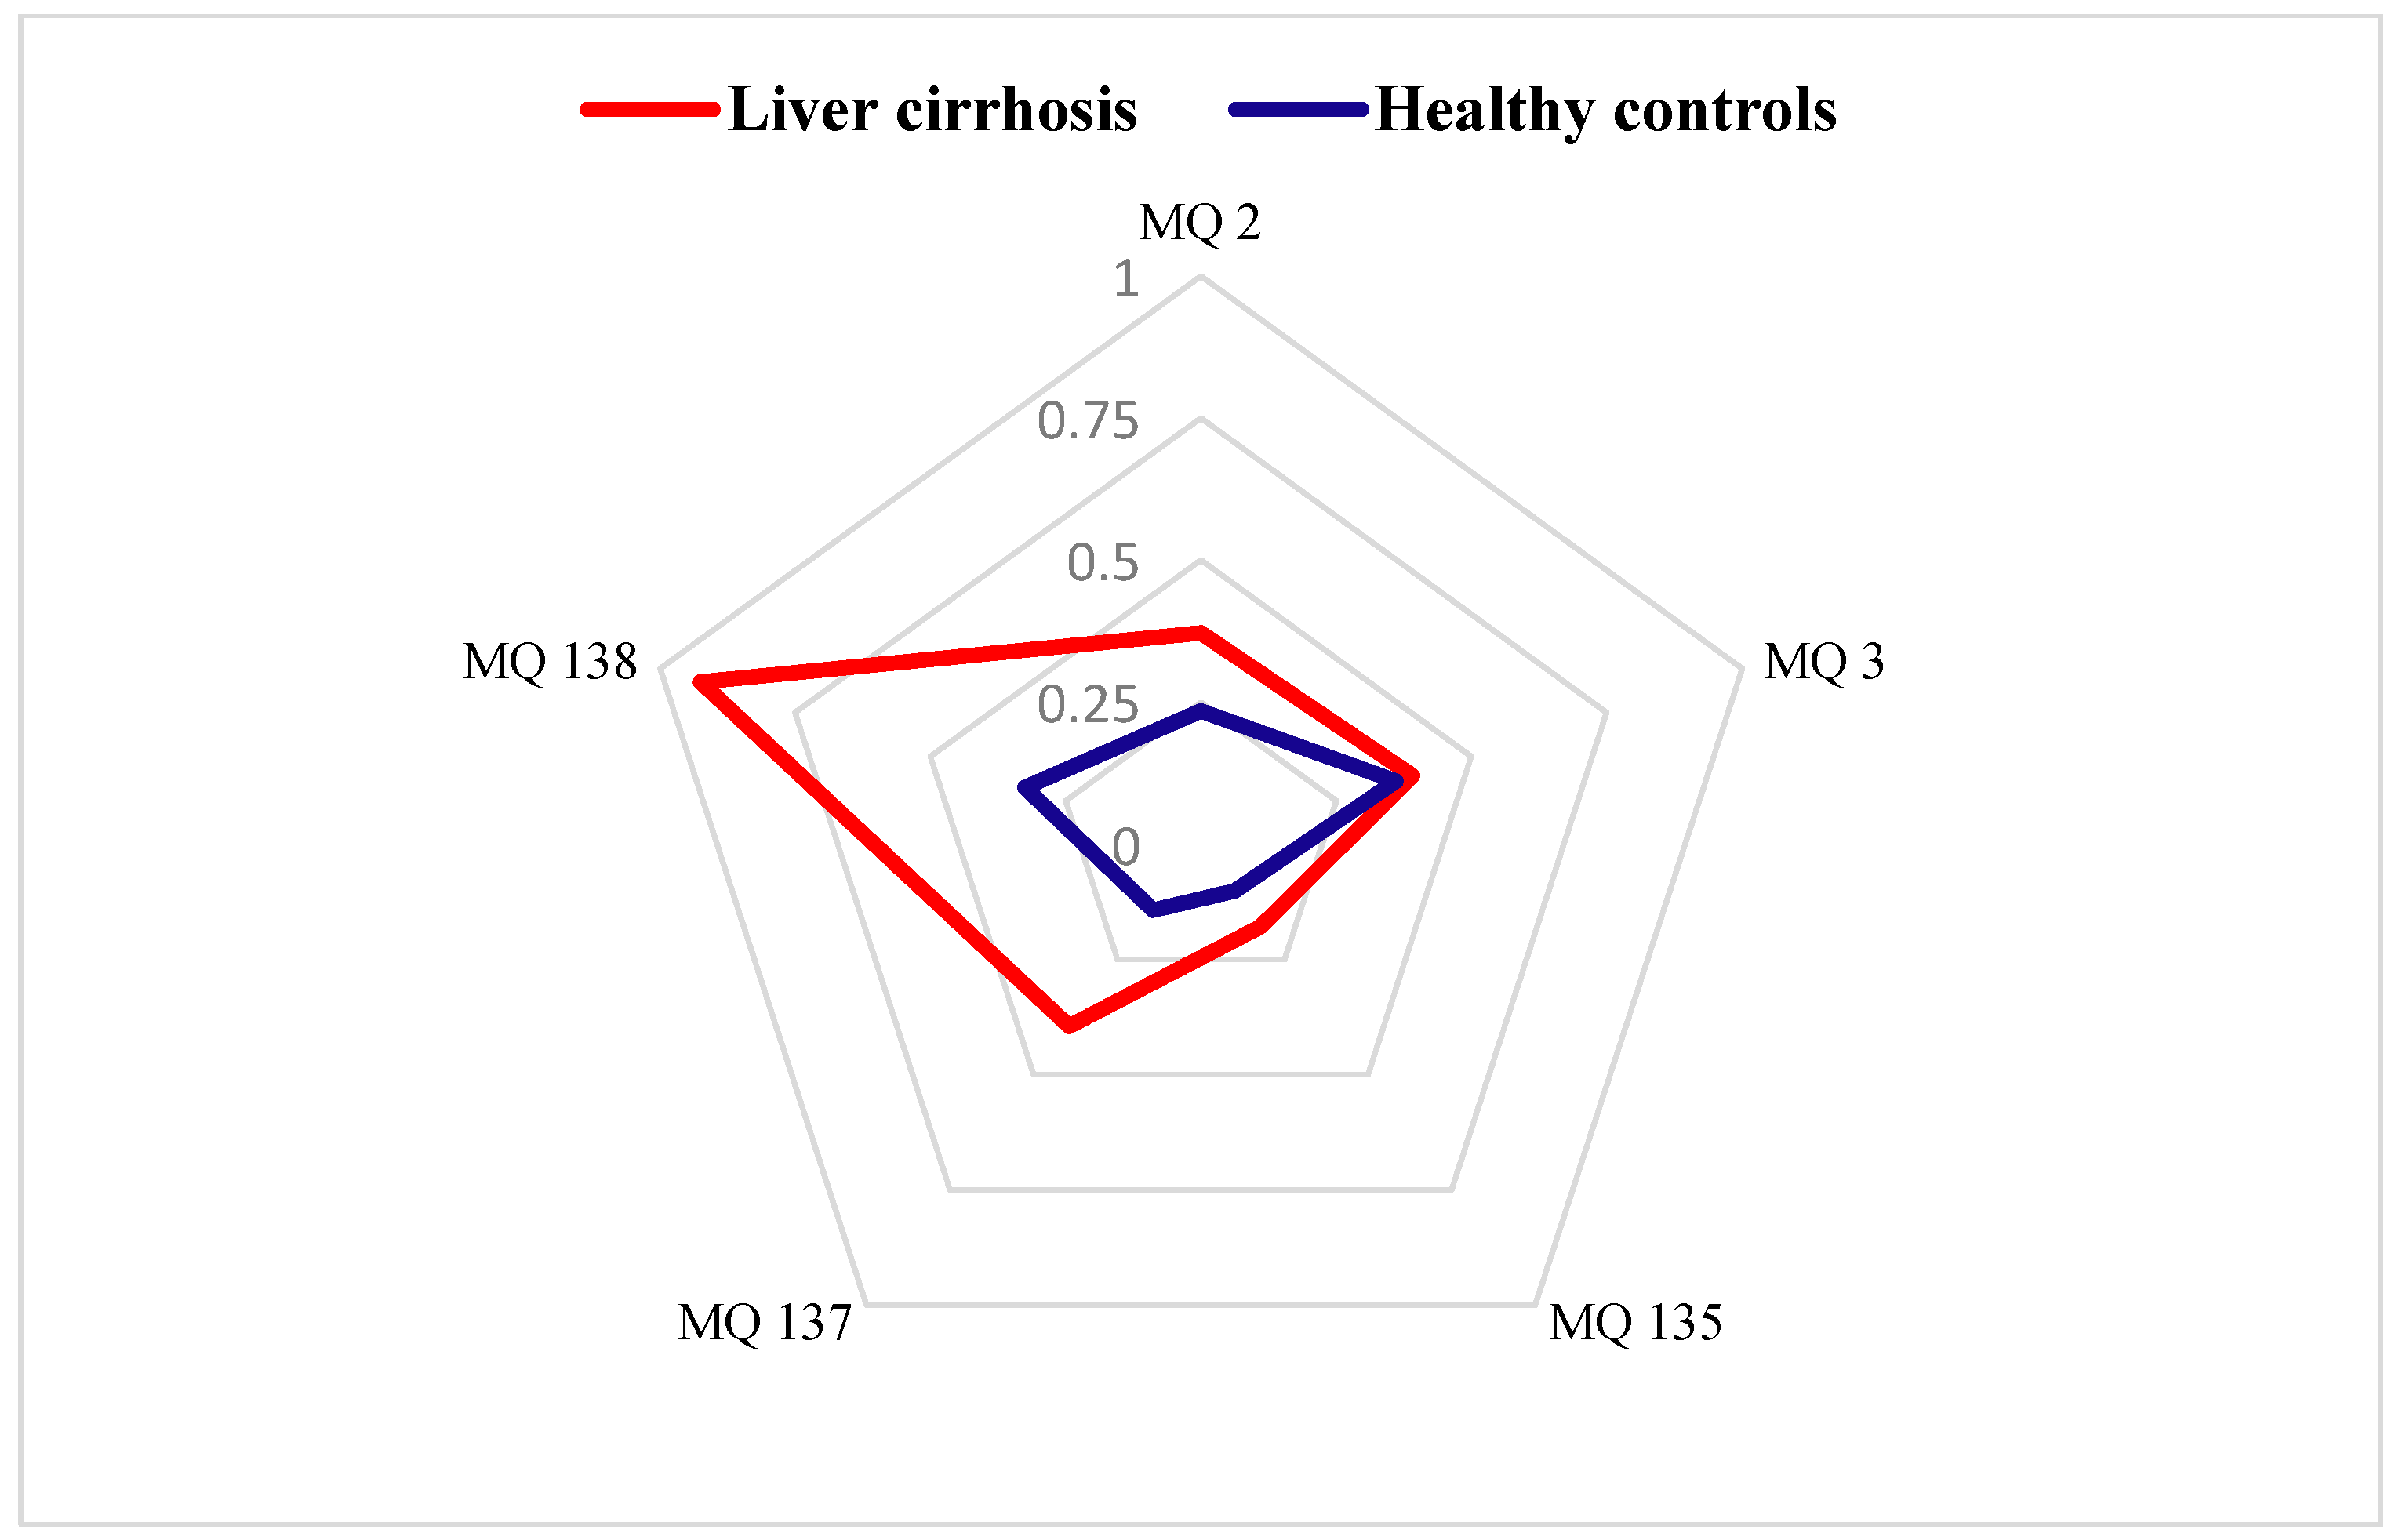
Figure 3 presents the radar plot results, highlighting the contributions of each gas sensor in the e-nose system. These plots were constructed using the stabilized conductance ((G − G0)/G0) values as feature, enabling a detailed comparison of the breath–print patterns between the LC and HC groups. The analysis revealed distinct variations in the chemical signatures of the two cohorts, underscoring the potential of the e-nose system in differentiating disease states based on VOC profiles.
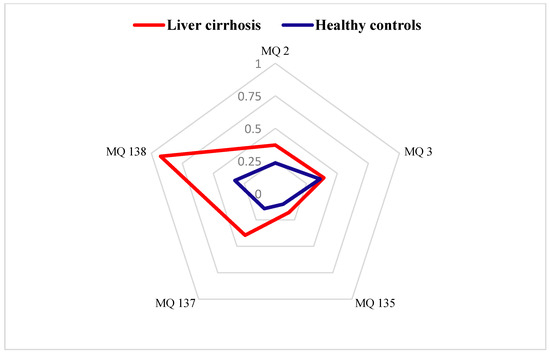
Figure 3.
Radar plots of e-nose gas sensor responses towards exhaled breath from healthy controls and patients with liver cirrhosis expressed by (G − G0)/G0 as a feature.
3.3. Data Treatment
After extracting features from a dataset, it could be essential to reduce the dimensionality of the multidimensional data. This reduction is necessary because the original complexity of the data can complicate its interpretation. The final step in the data analysis process for the e-nose involves pattern recognition, which is utilized for prediction of the breath status associated with different diseases. The machine learning techniques utilized for data processing included PCA, DFA, and SVMs. The dataset was split into training (80%) and test (20%) subsets to facilitate robust model development and evaluation.
3.3.1. PCA Classification Results
This approach ensured a more robust evaluation of the model’s performance, while minimizing the risk of overfitting. By separating the data, we were able to train the model on one subset and test it on another, providing an unbiased estimate of its effectiveness.
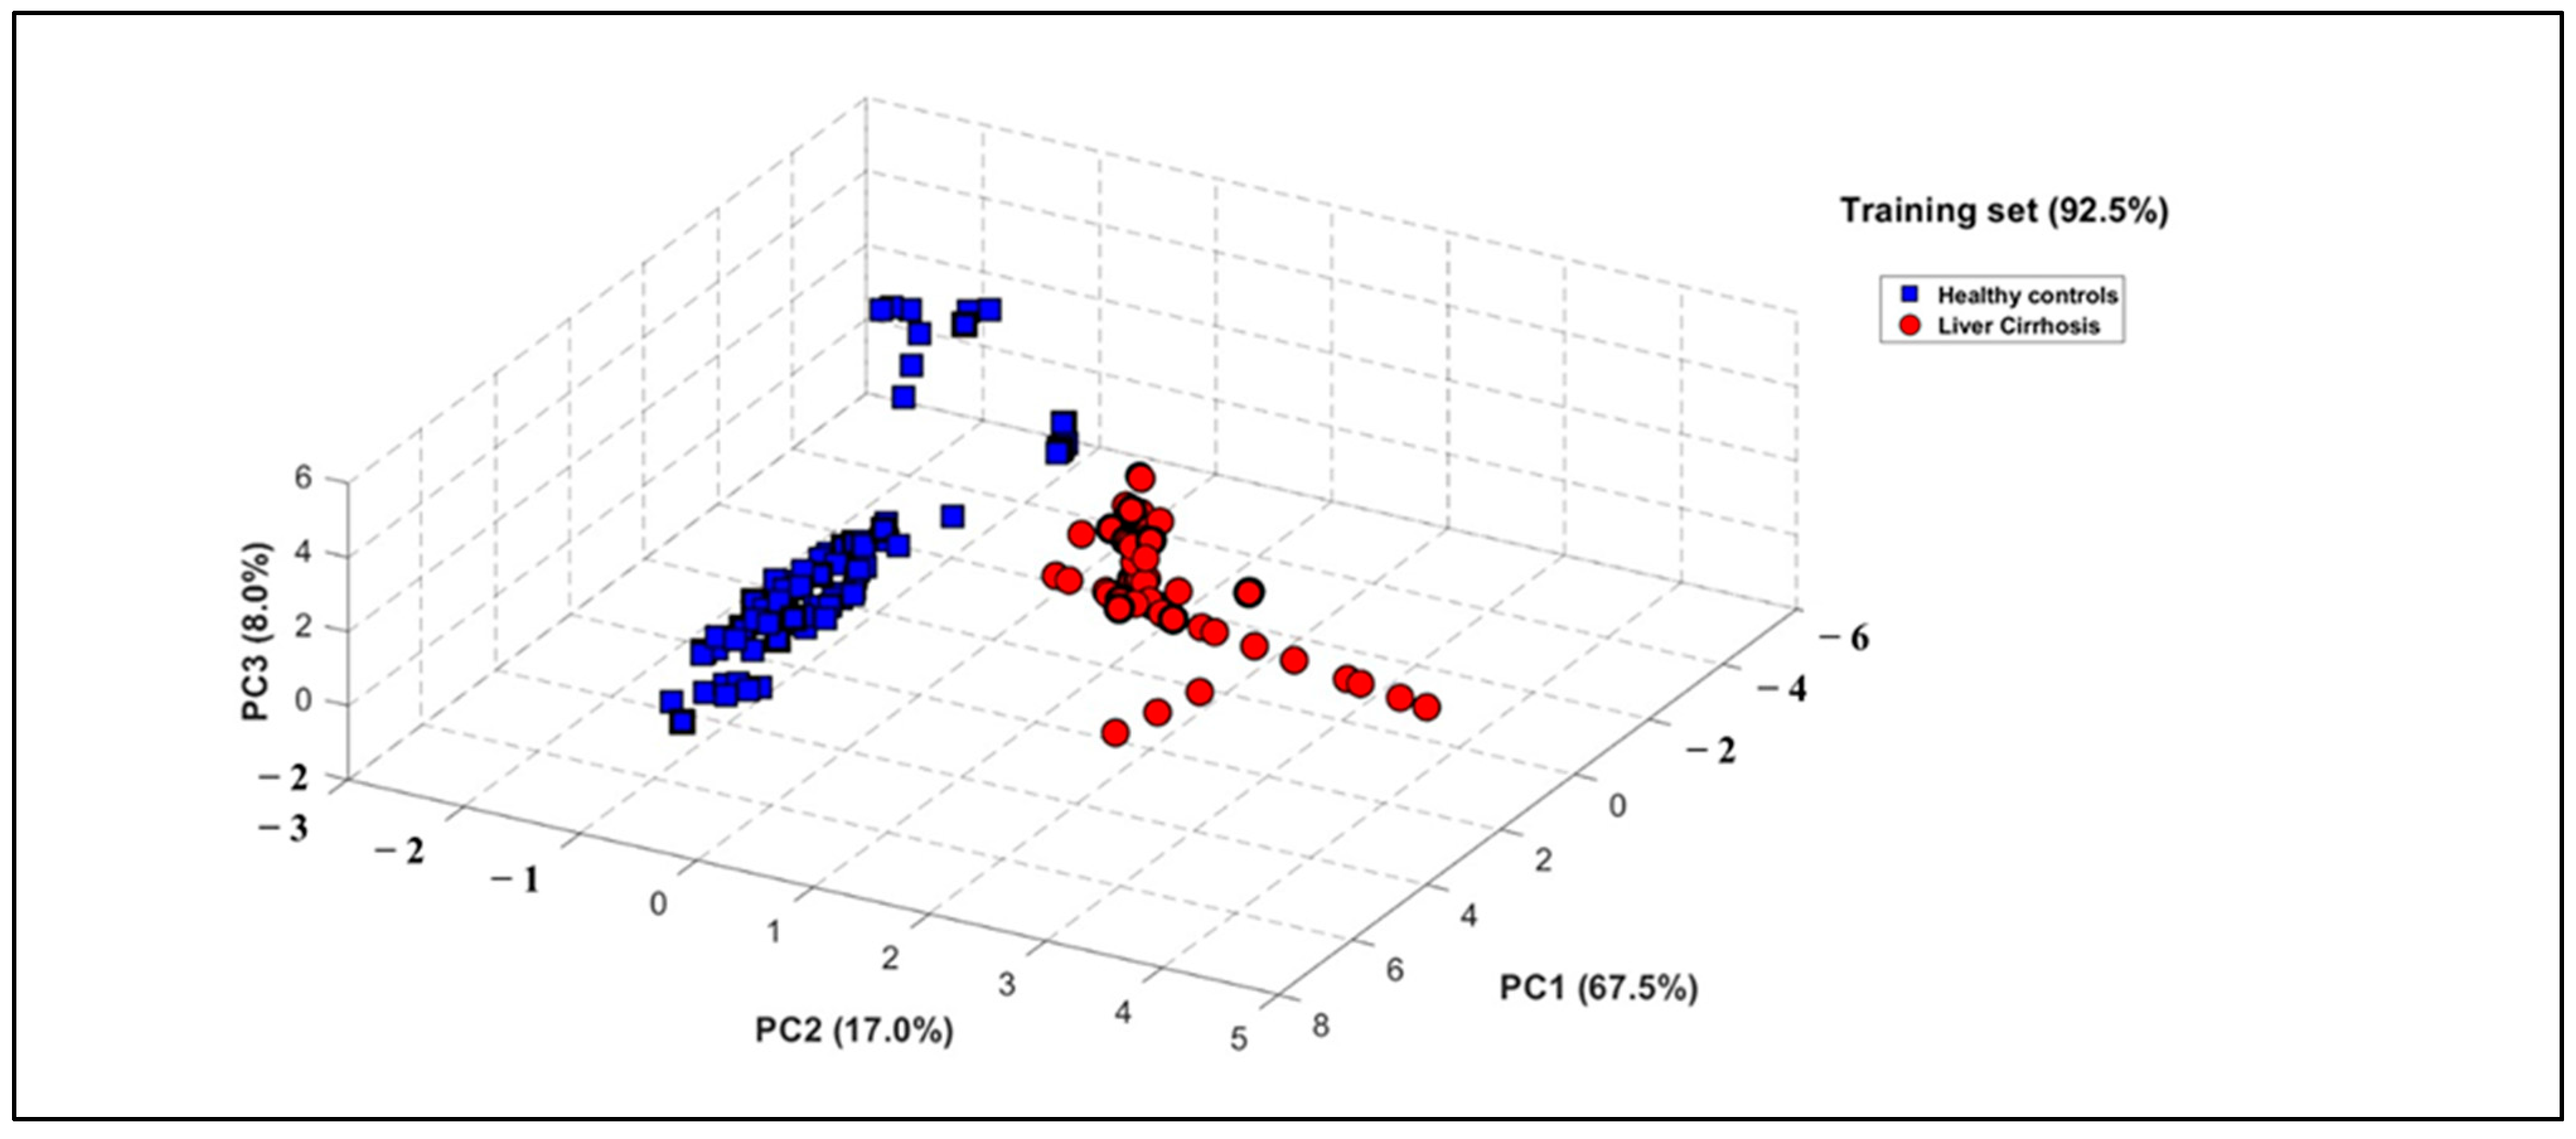
PCA was applied to the e-nose dataset to evaluate its capacity to differentiate between health states, utilizing the area under the curve (AUC) and ΔG as informative features. The results demonstrated a strong correlation among sensor responses, with the first three principal components explaining 92.50% of the total variance in the dataset (Figure 4). The resulting three-dimensional PCA plot demonstrates a distinct classification of breath patterns between LC patients and HCs. Figure 4 shows the PCA plot obtained with the e-nose database when processing the global dataset including smokers, with 92.50% of data variance explained by the first three principal components (PCs). It can be observed that a distinct discrimination of breath patterns between LC patients and HC was obtained. It should be also highlighted that this discrimination of the two groups was independent of confounding factors such as age difference or smoking habit, since the reduced database treatment by using PCA when excluding smokers permits us to obtain a score of 92.50% of data variance explained by the first three principal components (PCs). Comparative results are provided in Figures S1 and S2 of the Supplementary Material.
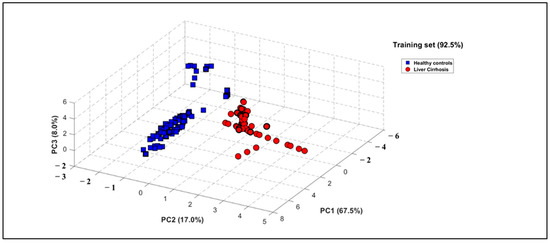
Figure 4.
Three-dimensional PCA plot performed on breath VOC samples when processing global database including smokers of 27 LC patients (red circles) and 28 healthy subjects (blue squares).
3.3.2. PCA Identification Results
An additional test set was collected using the e-nose, consisting of 33 breath samples from 11 new individuals, all under the same experimental conditions. This step aimed to assess the system’s ability to accurately recognize entirely new samples. These had not been used during the development of the PCA discrimination model. The test data were then projected onto the previously constructed PCA model. As shown in Figure 5, all new breath samples were correctly classified with no overlap, highlighting a strong consistency between the breath patterns observed in both the training and test datasets.
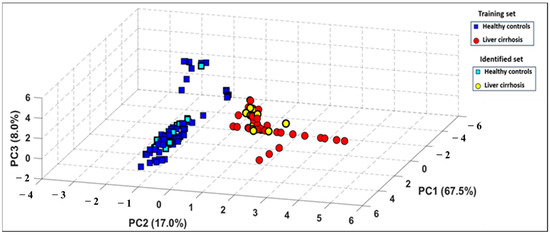
Figure 5.
Projection of test set of measurements onto the PCA model built using the training set of measurements.
3.3.3. DFA Discrimination Results
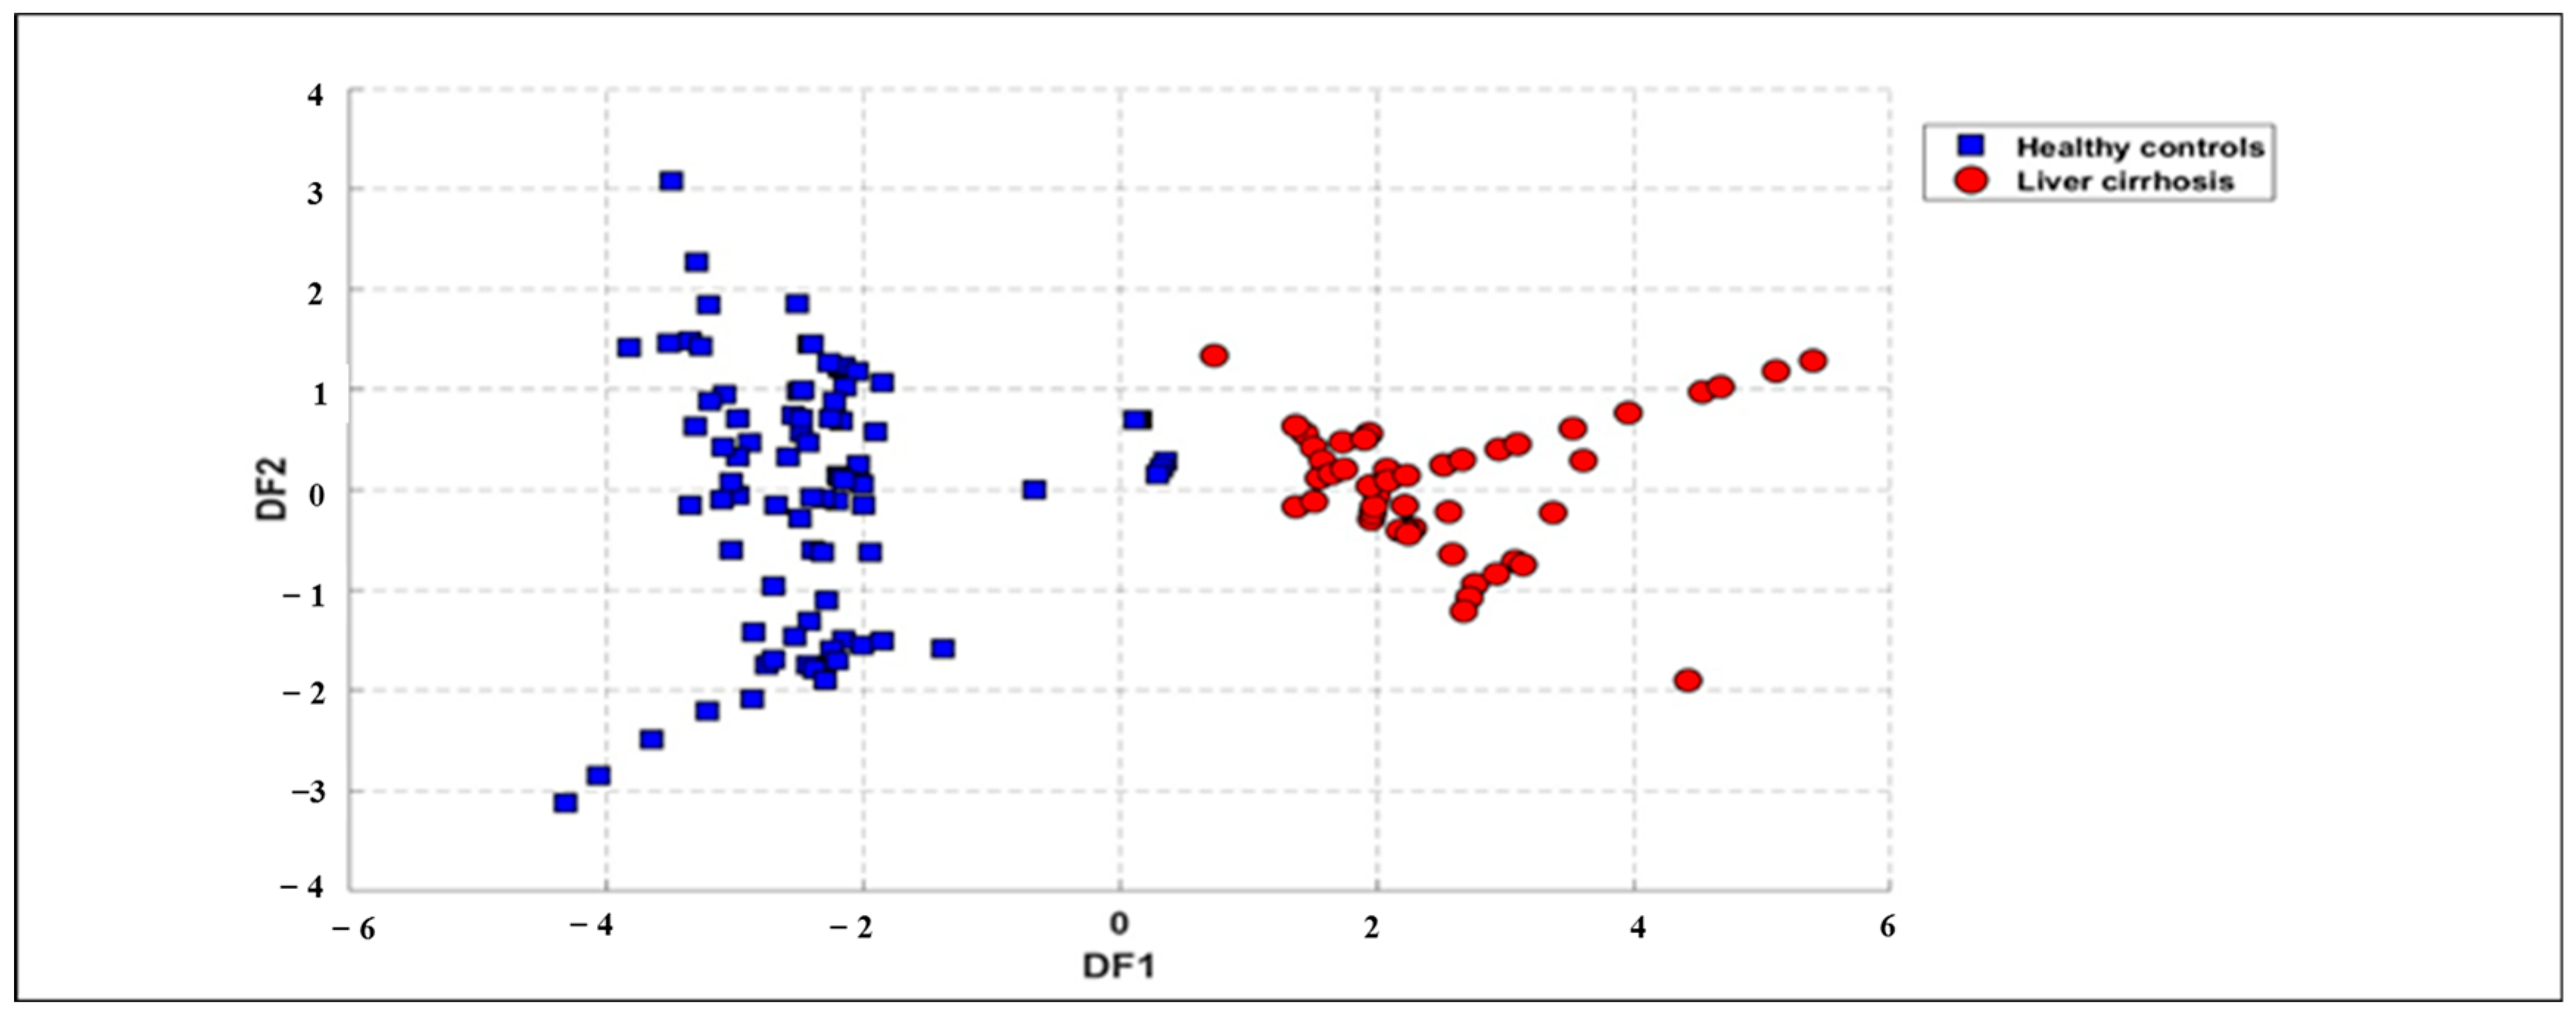
The same dataset was further analyzed using a supervised method known as DFA to differentiate breath samples based on health status. DFA was applied to database treatment by using the same features as those used in the PCA analysis. The outcomes, illustrated in Figure 6 (for all samples), underscore the effectiveness of this approach. The results from DFA reveal a distinct separation between the breath samples of LC patients and HC, highlighting the method’s capability to classify samples based on health conditions. Figure 6 shows the first two functions of the DFA method for the classification of LC patients and HCs using the full dataset obtained from the e-nose system. The result displays a good discrimination between LC patients and HCs. Therefore, the processing of the data by DFA technique confirms the results obtained by the PCA method. Moreover, the processing of the reduced dataset when excluding smokers by using the DFA technique also reveals a perfect discrimination of the two groups, as provided in the Supplementary Material (Figures S3 and S4). We can notice that smoking does not reduce model accuracy but increases within-group variability, making group separation less distinct in DFA plots. The founding results demonstrate that smoking does not affect discrimination performance.

Figure 6.
DFA plot displaying global data points for exhaled breath samples related to 27 patients with LC (red circles) and 28 healthy subjects (blue squares) collected from e-nose measurements using ΔG and Area as features.
3.3.4. SVM Classification Results
SVMs were employed to classify the breath samples based on the health status of the participants. The total dataset consisted of 55 volunteers, including 27 patients with LC and 28 HC, matched for age to ensure balanced representation. The SVM was applied on the training datasets (Table 2), and test datasets (Table 3) with the same features used for PCA analysis (i.e., AUC and ΔG), in order to check the rate of the model’s classification accuracy.
Table 2.
Support vector machine results for the classification of 132 breath samples regarding their health states by using training dataset of the e-nose system with a success rate of 100%.
Table 3.
Support vector machine results for the classification of 33 breath samples regarding their health states by using test dataset of the e-nose system with a success rate of 100%.
The SVM classification was performed to distinguish between the two groups using the extracted features from the e-nose system. Based on the analysis of the confusion matrix of the two datasets, the SVM model achieved an accuracy of 100%, effectively differentiating between LC and HC samples. This result highlights the robustness of the e-nose system combined with SVMs in identifying disease-specific signatures in exhaled breath. The classification of LC and HC health states was performed using the SVM model. The study compared two datasets: a global dataset including both smokers and non-smokers, and a restricted dataset excluding smokers. The results are presented in the form of confusion matrices (see Supplementary Material, Tables S1 and S2). In both cases, the model achieved perfect accuracy of 100%, with no false positives or false negatives. This shows that the parameters used by the SVMs allow for a clear distinction between the LC and HC groups, regardless of the presence of smokers. However, excluding smokers has a notable effect on the composition of the sample: the size of the HC group decreases from 69 to 39 subjects, representing a reduction of 43.5%. The presence or exclusion of smokers does not affect the SVM model’s ability to discriminate between LC and HC health states. In both configurations (with or without smokers), the model achieves 100% accuracy, with no false positives or false negatives. This indicates that the features exploited by the SVMs are sufficiently robust and informative to enable clear separation of the two groups, regardless of the smoking status of the participants.
3.3.5. Receiver Operating Characteristic (ROC)
ROC curves for the e-nose data were generated to evaluate its diagnostic performance. The AUC values were computed to quantify the diagnostic accuracy of each dataset. Logistic regression analysis was used to assess the diagnostic capabilities of the e-nose model. Figure 7 illustrates the ROC curve for the e-nose data, showing an AUC of one, which reflects the analysis of breath samples from LC and HC groups.
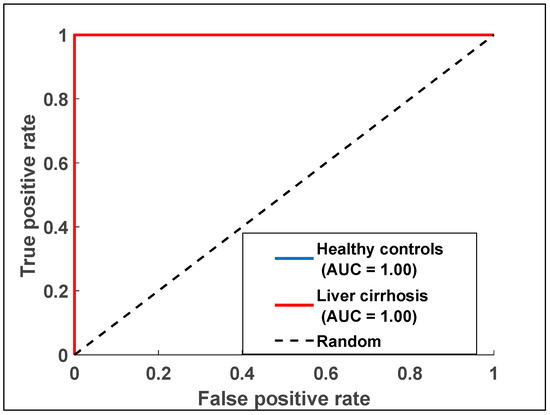
Figure 7.
Receiver operating characteristic curve displaying data points for exhaled breath samples relating to the two health states with data collected from the e-nose measurements.
4. Conclusions
This study highlights the promising potential of exhaled breath analysis for early liver cirrhosis (LC) detection. By analyzing disease-specific volatile organic compound signatures in breath samples, the e-nose system, integrated with optimized commercial sensors, effectively differentiated LC patients from healthy controls. Advanced pattern recognition techniques, including PCA, DFA, and SVMs, coupled with ROC analysis, validated the diagnostic accuracy of the system. These results demonstrate the e-nose as a robust, non-invasive tool for LC detection, offering accessible, timely, and patient-friendly screening options. This research emphasizes the transformative potential of breath-based diagnostics in improving early intervention and reducing the global burden of liver disease. A key advantage of this approach is the introduction of electronic sensing systems as viable alternatives to traditional diagnostic methods, which often have significant limitations. The proposed devices exhibit strong classification and predictive capabilities, potentially aiding early diagnosis of various conditions. The portability and rapid analysis capabilities of the e-nose further suggest its applicability for non-invasive diagnostics of other diseases. To improve clinical reliability, strategies such as noise-reduction algorithms, machine learning, and environmental control are essential. Long-term system stability can be ensured through periodic calibration, durable sensors, and self-diagnostic features. AI-driven pattern recognition algorithms will help maintain diagnostic accuracy over time. One major limitation of this study is the relatively low number of samples, which is due to the rarity of LC patients meeting the inclusion criteria. Although we continuously add new cases as they become available, the current dataset size may limit the generalizability and statistical power of the machine learning models applied. Future studies with larger cohorts will be necessary to validate and strengthen the findings presented here.
Supplementary Materials
The following supporting information can be downloaded at: https://www.mdpi.com/article/10.3390/chemosensors13070260/s1, Figure S1: Three-dimensional PCA plot displaying breath samples patterns when excluding smokers of 26 LC patients (red circles) and 16 healthy subjects (blue squares); Figure S2: Three-dimensional PCA plot displaying breath samples patterns when processing global database including smokers of 27 LC patients (red circles) and 28 healthy subjects (blue squares); Figure S3: Two-dimensional DFA plot displaying breath samples patterns when excluding smokers of 26 LC patients (red circles) and 16 healthy subjects (blue squares); Figure S4: Two-dimensional DFA plot displaying breath samples patterns when processing the global da-tabase including smokers of 27 LC patients (red circles) and 28 healthy subjects (blue squares); Table S1: Support vector machines results for the classification of breath samples when excluding smokers of 26 LC patients and 16 healthy subjects regarding their health states by using training data set of the e-nose system with a success rate of 100%; Table S2: Support vector machines results for the classification of breath samples when processing the global database including smokers of 27 LC patients and 28 healthy subjects regarding their health states by using training data set of the e-nose system with a success rate of 100%; File S1: excel raw data.
Author Contributions
Conceptualization, B.B. and N.E.B.; measurement methodology, M.W. and O.Z.; software, O.Z.; validation, M.W.; resources, N.E.B., F.Z.A. and N.L.; breath sample collection at hospital, F.Z.A. and N.L. writing—original draft preparation, M.W.; writing—review and editing, B.B. and N.E.B.; supervision, B.B.; project administration, N.E.B.; funding acquisition, N.E.B. All authors have read and agreed to the published version of the manuscript.
Funding
This research was funded by Moulay Ismaïl University of Meknes for financial support of the project “Research support, UMI-2018”. This work was also supported by the H2020-MSCA-RISE-2020 project, grant agreement ID: 101007653: “Non-invasive volatiles test for canine leishmaniasis diagnosis”.
Institutional Review Board Statement
Not applicable.
Informed Consent Statement
Not applicable.
Data Availability Statement
Data will be made available on request.
Acknowledgments
The authors acknowledge the support provided by Moulay Ismaïl University of Meknes, UMI 2018 and H2020-MSCA-RISE-2020 project, grant agreement ID: 101007653: “Non-invasive volatiles test for canine leishmaniasis diagnosis”. The authors also thank Tarik Saidi for his contribution during data processing.
Conflicts of Interest
The authors declare no conflicts of interest.
References
- Devarbhavi, H.; Asrani, S.K.; Arab, J.P.; Nartey, Y.A.; Pose, E.; Kamath, P.S. Global burden of liver disease: 2023 update. J. Hepatol. 2023, 79, 516–537. [Google Scholar] [CrossRef] [PubMed]
- Åberg, F.; Savikko, J.; Eerola, V.; Ilmakunnas, M.; Kyllönen, L.; Isoniemi, H. High prevalence of liver fibrosis and cirrhosis in a nationwide sample of organ donors with liver histology. J. Hepatol. 2024, 80, e205–e207. [Google Scholar] [CrossRef]
- Zaim, O.; Diouf, A.; El Bari, N.; Lagdali, N.; Benelbarhdadi, I.; Ajana, F.Z.; Bouchikhi, B. Comparative analysis of volatile organic compounds of breath and urine for distinguishing patients with liver cirrhosis from healthy controls by using electronic nose and voltammetric electronic tongue. Anal. Chim. Acta 2021, 1184, 339028. [Google Scholar] [CrossRef]
- Afdhal, N.; McHutchison, J.; Brown, R.; Jacobson, I.; Manns, M.; Poordad, F.; Weksler, B.; Esteban, R.; Thuluvath, P.; Zeuzem, S. Thrombocytopenia associated with chronic liver disease. J. Hepatol. 2008, 48, 1000–1007. [Google Scholar] [CrossRef] [PubMed]
- Mohammadi, M.; Zarghami, N.; Hedayati, M.; Montazeri, S.; Shahnazari, B. Visfatin effects on telomerase gene expression in AGS gastric cancer cell line. Indian J. Cancer 2015, 52, 32–35. [Google Scholar]
- Kumar, S.; Huang, J.; Abbassi-Ghadi, N.; Spanel, P.; Smith, D.; Hanna, G.B. Mass spectrometric analysis of exhaled breath for the identification of volatile organic compound biomarkers in esophageal and gastric adenocarcinoma. Ann. Surg. 2015, 262, 981–990. [Google Scholar] [CrossRef] [PubMed]
- Ghosh, C.; Singh, V.; Grandy, J.; Pawliszyn, J. Recent advances in breath analysis to track human health by new enrichment technologies. J. Sep. Sci. 2020, 43, 226–240. [Google Scholar] [CrossRef]
- Scheideler, L.; Manke, H.G.; Schwulera, U.; Inacker, O.; Hämmerle, H. Detection of Nonvolatile Macromolecules in Breath: A Possible Diagnostic Tool? Am. Rev. Respir. Dis. 1993, 148, 778–784. [Google Scholar] [CrossRef]
- Goto, I.; Yoneda, S.; Yamamoto, M.; Kawajiri, K. Prognostic Significance of Germ Line Polymorphisms of the CYP1A1 and Glutathione S-Transferase Genes in Patients with Non-Small Cell Lung Cancer. Cancer Res. 1996, 56, 3725–3730. [Google Scholar]
- Chen, X.; Muhammad, K.G.; Madeeha, C.; Fu, W.; Xu, L.; Hu, Y.; Liu, J.; Ying, K.; Chen, L.; Yurievna, G.O. Calculated Indices of Volatile Organic Compounds (VOCs) in Exhalation for Lung Cancer Screening and Early Detection. Lung Cancer 2021, 154, 197–205. [Google Scholar] [CrossRef]
- Duran-Acevedo, C.M.; Caceres-Tarazona, J.M. Low-cost desorption unit coupled with a gold nanoparticles gas sensor arrays for the analysis of volatile organic compounds emitted from the exhaled breath (gastric cancer and control samples). Microelectron. Eng. 2020, 237, 111483. [Google Scholar] [CrossRef]
- Lubes, G.; Goodarzi, M. GC-MS based metabolomics used for the identification of cancer volatile organic compounds as biomarkers. J. Pharm. Biomed. Anal. 2018, 147, 313–322. [Google Scholar] [CrossRef] [PubMed]
- Markar, S.R.; Lagergren, J.; Hanna, G.B. Research protocol for a diagnostic study of non-invasive exhaled breath analysis for the prediction of oesophagogastric cancer. BMJ Open 2016, 6, e009139. [Google Scholar] [CrossRef]
- Krilaviciute, A.; Stock, C.; Leja, M.; Brenner, H. Potential of non-invasive breath tests for preselecting individuals for invasive gastric cancer screening endoscopy. J. Breath Res. 2018, 12, 036009. [Google Scholar] [CrossRef] [PubMed]
- Matsumoto, K.; Murakami, Y.; Shimizu, Y.; Shimamura, Y.; Takahashi, A.; Sugano, K.; Hirao, K. Electronic nose to distinguish bladder cancer by urinary odor feature: A pilot study. Cancer Biomark. 2020, 28, 33–39. [Google Scholar] [CrossRef]
- Turppa, E.; Polaka, I.; Vasiljevs, E.; Kortelainen, J.M.; Shani, G.; Leja, M.; Haick, H. Repeatability study on a classifier for gastric cancer detection from breath sensor data. In Proceedings of the 19th IEEE International Conference on Bioinformatics and Bioengineering, Athens, Greece, 28–30 October 2019; pp. 450–453. [Google Scholar]
- Hashoul, D.; Haick, H. Sensors for detecting pulmonary diseases from exhaled breath. Eur. Respir. J. 2019, 28, 190011. [Google Scholar] [CrossRef]
- Diouf, A.; Moufid, M.; Bouyahya, D.; Osterlund, L.; El Bari, N.; Bouchikhi, B. An electrochemical sensor based on chitosan capped with gold nanoparticles combined with a voltammetric electronic tongue for quantitative aspirin detection in human physiological fluids and tablets. Mater. Sci. Eng. C 2020, 110, 110665. [Google Scholar] [CrossRef]
- Hu, W.; Wan, L.; Jian, Y.; Zou, Q.; Zhang, Z.; Wang, P. Electronic noses: From advanced materials to sensors aided with data processing. Adv. Mater. Technol. 2019, 4, 1800488. [Google Scholar] [CrossRef]
- De Vincentis, A.; Pennazza, G.; Santonico, M.; Vespasiani-Gentilucci, U.; Galati, G.; Gallo, P.; Vernile, C.; Pedone, C.; Antonelli Incalzi, R.; Picardi, A. Breath-print analysis by e-nose for classifying and monitoring chronic liver disease: A proof-of-concept study. Sci. Rep. 2016, 6, 25337. [Google Scholar] [CrossRef]
- Eng, K.; Alkhouri, N.; Cikach, F.; Mehta, R.; Hanouneh, I.A.; Grove, D.; Dweik, R.A. Analysis of breath volatile organic compounds in children with chronic liver disease compared to healthy controls. J. Breath Res. 2015, 9, 026002. [Google Scholar] [CrossRef]
- Morvan, M.; Talou, T.; Gaset, A.; Beziau, J.F. Electronic-nose systems for control quality applications in automotive industry. Sens. Actuators B Chem. 2000, 69, 384–392. [Google Scholar] [CrossRef]
- Zhu, L.; Seburg, R.A.; Tsai, E.; Puech, S.; Mifsud, J.C. Flavor analysis in a pharmaceutical oral solution formulation using an electronic nose. J. Pharm. Biomed. Anal. 2004, 34, 453–463. [Google Scholar] [CrossRef] [PubMed]
- Apetrei, I.M.; Apetrei, C. Detection of virgin olive oil adulteration using a voltammetric e-tongue. Comput. Electron. Agric. 2014, 108, 148–154. [Google Scholar] [CrossRef]
- Winkler, M.; Tuchs, K.D.; Hughes, K.; Barclay, G. Theoretical and practical aspects of military wireless sensor networks. J. Telecommun. Inf. Technol. 2008, 4, 37–45. [Google Scholar] [CrossRef]
- Martínez-Bisbal, M.C.; Loeff, E.; Olivas, E.; Medina, S.; Ibáñez, C.; Cifuentes, A. A voltammetric electronic tongue for the quantitative analysis of quality parameters in wastewater. Electroanalysis 2017, 29, 1147–1153. [Google Scholar] [CrossRef]
- De Vincentis, A.; Pennazza, G.; Santonico, M.; D’Amico, A.; Bernabei, R.; Haick, H. Breath-print analysis by e-nose may refine risk stratification for adverse outcomes in cirrhotic patients. Liver Int. 2017, 37, 242–250. [Google Scholar] [CrossRef]
- Muley, M.; Vespasiani-Gentilucci, U.; De Vincentis, A.; Corradini, S.G.; Santonico, M.; Bernabei, R. Voltammetric analysis for distinguishing portal hypertension-related from malignancy-related ascites: A proof-of-concept study. PLoS ONE 2020, 15, e0233350. [Google Scholar] [CrossRef]
- Saidi, T.; Moufid, M.; Zaim, O.; El Bari, N.; Bouchikhi, B. Voltammetric electronic tongue combined with chemometric techniques for direct identification of creatinine level in human urine. Measurement 2018, 115, 178–184. [Google Scholar] [CrossRef]
- Moufid, M.; Tiebe, C.; El Bari, N.; Bartholmai, M.; Bouchikhi, B. Advance in electronic nose technology developed for the detection and discrimination of ethanol, ammonia, and hydrogen sulfide gases. In Proceedings of the 2022 IEEE International Symposium on Olfaction and Electronic Nose (ISOEN), Aveiro, Portugal, 29 May–1 June 2022; pp. 1–3. [Google Scholar]
- Karami, H.; Rasekh, M.; Mirzaee-Ghaleh, E. Application of the E-nose machine system to detect adulterations in mixed edible oils using chemometrics methods. J. Food Process. Preserv. 2020, 44, e14696. [Google Scholar] [CrossRef]
- Righettoni, M.; Amann, A.; Pratsinis, S.E. Breath analysis by nanostructured metal oxides as chemo-resistive gas sensors. Mater. Today 2015, 18, 163–171. [Google Scholar] [CrossRef]
- Lawal, O.; Ahmed, W.M.; Nijsen, T.M.; Goodacre, R.; Fowler, S.J. Exhaled breath analysis: A review of ‘breath-taking’ methods for off-line analysis. Metabolomics 2017, 13, 110. [Google Scholar] [CrossRef] [PubMed]
- Beauchamp, J.; Herbig, J.; Gutmann, R.; Hansel, A. On the use of Tedlar® bags for breath-gas sampling and analysis. J. Breath Res. 2008, 2, 046001. [Google Scholar] [CrossRef]
- Ahmadou, D.; Laref, R.; Losson, E.; Siadat, M. Reduction of drift impact in gas sensor response to improve quantitative odor analysis. In Proceedings of the IEEE International Conference on Industrial Technology (ICIT), Toronto, ON, Canada, 22–25 March 2017; pp. 928–933. [Google Scholar]
- Zaim, O.; Saidi, T.; El Bari, N.; Bouchikhi, B. Assessment of “breath print” in patients with chronic kidney disease during dialysis by non-invasive breath screening of exhaled volatile compounds using an electronic nose. In Proceedings of the IEEE International Symposium on Olfaction and Electronic Nose (ISOEN), Fukuoka, Japan, 26–29 May 2019; pp. 1–4. [Google Scholar]
- Dragonieri, S.; Annema, J.T.; Schot, R.; Van der Schee, M.P.; Spanevello, A.; Carratù, P.; Resta, O. An electronic nose in the discrimination of patients with non-small cell lung cancer and COPD. Lung Cancer 2009, 64, 166–170. [Google Scholar] [CrossRef] [PubMed]
- Aït-Sahalia, Y.; Xiu, D. Principal component analysis of high-frequency data. J. Am. Stat. Assoc. 2019, 114, 287–303. [Google Scholar] [CrossRef]
- Bro, R.; Smilde, A.K. Principal component analysis. Anal. Methods 2014, 6, 2812–2831. [Google Scholar] [CrossRef]
- Bougrini, M.; Tahri, K.; Haddi, Z.; Saidi, T.; El Bari, N.; Bouchikhi, B. Detection of adulteration in argan oil by using an electronic nose and a voltammetric electronic tongue. J. Sens. 2014, 2014, 245831. [Google Scholar] [CrossRef]
- Guenther, N.; Schonlau, M. Support vector machines. Stata J. 2016, 16, 917–938. [Google Scholar] [CrossRef]
- Fawcett, T. An introduction to ROC analysis. Pattern Recognit. Lett. 2006, 27, 861–874. [Google Scholar] [CrossRef]
- Srimathi, U.; Nagarajan, V.; Chandiramouli, R. Germanane nanosheet as a novel biosensor for liver cirrhosis based on adsorption of biomarker volatiles: A DFT study. Appl. Surf. Sci. 2019, 475, 990–998. [Google Scholar] [CrossRef]
- Dadamio, J.; Van den Velde, S.; Laleman, W.; van Steenberghe, D. Breath biomarkers of liver cirrhosis. J. Chromatogr. B 2012, 905, 17–22. [Google Scholar] [CrossRef]
- Mashir, A.; Tamimi, A.R.; Laskowski, D.; Dweik, R.A. Exhaled breath analysis in patients with liver cirrhosis using soft ion flow tube mass spectrometry (SIFT-MS). In C38. Airway Inflammation: From Mechanisms to Noninvasive Biomarkers; American Thoracic Society: New York, NY, USA, 2011; p. A4466. [Google Scholar]


Disclaimer/Publisher’s Note: The statements, opinions and data contained in all publications are solely those of the individual author(s) and contributor(s) and not of MDPI and/or the editor(s). MDPI and/or the editor(s) disclaim responsibility for any injury to people or property resulting from any ideas, methods, instructions or products referred to in the content. |
© 2025 by the authors. Licensee MDPI, Basel, Switzerland. This article is an open access article distributed under the terms and conditions of the Creative Commons Attribution (CC BY) license (https://creativecommons.org/licenses/by/4.0/).