Article

A Disposable SWCNTs/AuNPs-Based Screen-Printed ISE at Different Temperatures to Monitor Ca2+ for Hypocalcemia Diagnosis

1
State Key Laboratory of Animal Nutrition, Institute of Animal Sciences, Chinese Academy of Agricultural Sciences, Beijing 100193, China
2
College of Animal Science and Technology, China Agricultural University, Beijing 100193, China
*
Authors to whom correspondence should be addressed.
These authors contributed equally to this work.
Chemosensors 2025, 13(7), 252; https://doi.org/10.3390/chemosensors13070252 (registering DOI)
Submission received: 12 June 2025 / Revised: 4 July 2025 / Accepted: 10 July 2025 / Published: 12 July 2025
(This article belongs to the Section Electrochemical Devices and Sensors)

Abstract

In this paper, screen-printed ion-selective electrodes combined with single-walled carbon nanotubes (SWCNTs) and gold nanoparticles (AuNPs) were used to rapidly and accurately measure serum Ca2+ concentration. Due to the susceptibility of cows to hypocalcemia after delivery, this disease can affect the health of cows and reduce milk production. Therefore, the development of an economical and swift detection method holds paramount importance for facilitating early diagnosis and subsequent treatment. In this study, by combining the high electrical conductivity and large surface area of SWCNTs with the strong catalytic activity of AuNPs, a SWCNTs/AuNPs composite with high sensitivity and good stability was prepared, achieving efficient selective recognition and signal conversion of Ca2+. The experimental results indicate that the screen-printed electrode modified with SWCNTs/AuNPs exhibited excellent performance in the determination of Ca2+ concentration. Its linear response range is 10−5.5–10−1 M, covering the normal and pathological concentration range of Ca2+ in cow blood, and the detection limit is far below the clinical detection requirements. In addition, the electrode also has good anti-interference ability and fast response time (about 15 s), showing good performance in the range of 5–45 °C. In practical applications, the combination of the electrode and portable detection equipment can realize the field rapid determination of cow blood Ca2+ concentration. This method is easy to operate, cost-effective, and easy to promote, providing strong technical support for the health management of dairy farms.

1. Introduction

Cow hypocalcemia, a nutritional metabolic disorder triggered by a decrease in blood calcium levels, typically occurs post-calving and can be categorized into clinical and subclinical forms [1]. Clinical hypocalcemia generally occurs in the first 48–72 h after a cow gives birth, with a temporary imbalance in the concentration of calcium ions (Ca2+) in the blood [2]. This disease has caused huge economic losses to cattle farms, mainly due to treatment costs, secondary complications, and the resulting deaths [3]. Ca is related to muscle contraction. During periods of low blood calcium, cows are unable to maintain the contraction and relaxation of the cardiovascular system and gastrointestinal tract, which may lead to the death of cows. Ca deficiency can also lead to a decrease in immune function and also increase the risk of postpartum conditions such as mastitis, endometritis, and the displacement of abomasum [3,4,5,6]. Therefore, it is necessary to develop a method that can quickly and accurately measure the calcium ion concentration in the blood.
Traditional liquid contact ion-selective electrodes have difficulties in miniaturization and multi-device integration. Compared to other types, solid contact ion-selective electrodes (SC-ISE) show a greater ease of design and assembly, making them easier to miniaturize construction and flexible applications [7]. They can also be combined with printing technology to produce low-cost and high-yield sensor arrays [8]. Production process unification and quality specification can enable SC-ISE to integrate with laboratory equipment [9,10]. SC-ISE has the advantages of simple manufacturing, low cost, timeliness, small size, and reliability, has been widely used in many fields such as biomedicine, environment, agriculture, etc., and has realized efficient and rapid ion detection [11]. Generally speaking, SC-ISE is mainly composed of three parts, namely conductive substrate, solid contact layer, and ion-selective membrane (ISM) [12].
The potential drift of SC-ISE can be reduced by larger interface capacitance and lower water-layer resistance between the conductive substrate and ISM. An approach based on nanomaterials as an intermediate layer has been shown to improve the potential stability and repeatability of SC-ISE. Gold nanoparticles [13] and carbon-based nanomaterials such as fullerene [14], single-walled and multi-walled carbon nanotubes (CNTs) [15,16] have been used to manufacture SC-ISE. In particular, large double-layer capacitors with carbon-based nanomaterials can significantly reduce the potential drift of SC-ISE. In addition, due to the high hydrophobicity of carbon materials, no obvious water layer is formed between conductive substrates and ISM, making them superior to other materials like conductive polymers for use as intermediate layers in SC-ISEs [17]. Single-walled carbon nanotubes (SWCNTs), as biocompatible nanomaterials with excellent structure and mechanical and electronic properties, are widely used in the manufacturing of electrochemical sensors [18]. All atoms in SWCNTs are located on the surface and can detect small changes in surface current and local chemical environment. The preparation process of SWCNTs is convenient and efficient, allowing for the flexible use of spray technology or drip casting to achieve uniform deposition on the surface of a variety of substrate materials. In addition, the network structure of SWCNTs is deposited in a replicable manner, making it easier for nanotubes to interconnect and providing a much larger surface area than bare electrodes to enhance electrical signals [19].
Nanoparticles and nanomaterials have unique physical, chemical, and electronic properties and are applied in the manufacturing of electrochemical sensors [20,21]. In particular, gold nanoparticles (AuNPs) have excellent biocompatibility and electronic and catalytic properties, making them attractive sensing and electrocatalytic materials [22]. In addition, AuNPs has become a research hotspot due to their excellent high specific surface area and unique interface properties, and have shown good application potential in the field of electrochemical sensors [23]. The combination of SWCNTs and AUNPs combined the excellent properties of the two materials, which showed important properties and application potential in the field of catalytic reactions and nanotechnology [24]. In addition, these materials exhibit excellent hydrophobic properties and are not sensitive to changes in light and oxygen, which makes them ideal for sensor transducers [25].
Screen-printed electrodes (SPE) are considered to be inexpensive, mass-produced, disposable electrochemical analysis devices [26]. No cumbersome preprocessing steps are required to use them and the technical requirements for personnel are not high. These small devices are simple to operate and can meet the needs of fast and real-time monitoring in the field [27]. With the rapid development of nanomaterials, the electrochemical performance of SPE has been continuously improved in terms of specificity and sensitivity, expanding the application scope and fields of SPE in terms of the following: the detection of metal ions and organic compounds [28,29], the preparation of enzyme biosensors and immunosensors [30,31], lithium battery manufacturing [32], and solar cells [33].
In this study, SWCNTs/AuNPs were used as ion electron conversion layers to prepare calcium ion-selective electrodes (Ca-ISE) SPE/SWCNTs/AuNPs/Ca-ISM on SPE. The electrode modified by SWCNTs/AuNPs had a large double-layer capacitance, high electron transfer rate, and a large active surface area, which improved the sensitivity of the sensor. By designing an experimental program to measure and optimize the conditions of the developed sensor, the effectiveness of the device was evaluated, and it was effectively applied to the accurate determination of Ca2+ concentration in cow blood samples. In addition, the temperature changes in on-site environments such as pastures can affect the detection accuracy of traditional ISE. This study particularly considered the usage environment of 5–45 °C and combined the artificial neural network model for temperature compensation to ensure the accuracy of Ca2+ detection in variable temperature scenarios.

2. Materials and Methods

2.1. Materials and Reagents

SWCNTs, HAuCl4, CaCl2, and NaCl were purchased from Sigma-Aldrich (Beijing, China). The calcium ionophore ETH 129 (N,N,N′,N′-tetracyclohexyl-3-oxapentanediamide) and tetrahydrofuran (THF) were sourced from Shanghai Jizhi Biochemical Technology Co., Ltd. (Shanghai, China). Additionally, Shanghai Yuanye Biotechnology Co., Ltd. (Shanghai, China) supplied Sodium tetrakis [3,5-bis (trifluoromethyl) phenyl] borate (NaTFPB), 2-Nitrophenyl octyl ether (O-NPOE), and polyvinyl chloride (PVC). For the SPE, Ningbo Mxense Bio-Tech Co., Ltd. (Ningbo, China) provided the material with a 2.5 mm diameter working electrode.

2.2. Apparatus and Measurements

Electrochemical tests such as cyclic voltammetry (CV) and electrochemical impedance spectroscopy (EIS) were conducted on the CHI 760E workstation with a standard three-electrode setup. The working electrode consisted of the SPE electrode (SPE/SWCNTs/AuNPs/Ca-ISM), with an Ag/AgCl electrode serving as the reference and a platinum electrode as the counter electrode. Field emission scanning electron microscopy (FE-SEM) images were captured using an FE-SEM SU8040 (Hitachi High-Tech Corporation, Tokyo, Japan). Raman spectrum was collected using a Renishaw in Via imaging microscope (532 nm diode and Ar ion laser). The contact angle measurement device (CSCDIC-100, Dongguan Shengding Precision Instrument Co., Ltd., Dongguan, China) was used to determine the surface hydrophobicity of the modified SPE.

2.3. Electrode Preparation Process

Figure 1 shows the manufacturing process of the working electrode (SPE/SWCNTs/AuNPs/Ca-ISM). Before modification, a cyclic potential scan was performed on the bare SPE in a 2.5 mM [Fe(CN)6]4−/3− solution within a potential range of −0.6 V ± 1.6 V to remove surface impurities. After scanning, the SPE was rinsed with ultrapure water and dried with nitrogen for later use. Subsequently, 10 μL of SWCNTs solution (1.0 mg/mL) was coated on the electrode surface and dried to obtain SPE/SWCNTs. SPE/SWCNTs was immersed in a mixture of 5 mL of 0.3 mM HAuCl4 and 0.01 M Na2SO4 by cyclic voltammetry and scanned at a rate of 100 mV/s for approximately 120 s to form SPE/SWCNTs/AuNPs. Finally, the electrode surface was washed with ultrapure water and air-dried at room temperature.
The Ca–ion-selective membrane (Ca-ISM) solution was prepared by mixing 1% of the Ca2+ ionophore ETH 129, 0.2% NaTFPB, 65.8% O-NPOE, and 33% PVC to create 360 mg of the membrane formulation, which was then dissolved in 3 mL of THF. A 20 μL portion of the Ca-ISM solution was applied to the bare SPE, SPE/SWCNTs, and SPE/SWCNTs/AuNPs, respectively. The prepared electrodes were represented as SPE/Ca-ISM, SPE/SWCNTs/Ca-ISM, and SPE/SWCNTs/AuNPs/Ca-ISM, respectively. After Ca-ISM covered the electrode, the solvent was evaporated at room temperature for 24 h. Before each measurement, the electrodes were adjusted in a 10−3 M CaCl2 solution for 3 h.

2.4. Sample Measurement

Blood samples were obtained from the tail veins of cows at the China–Israel demonstration Dairy Farm (Beijing, China). The samples were centrifuged at 3000 rpm for 10 min at room temperature, and the serum was separated for further analysis. The pH of the serum was adjusted to 7.4 using a 0.1 M Tris-HCl buffer. The animal procedures were approved by the Animal Care and Use Committee of the Chinese Academy of Agricultural Sciences (Beijing, China) (IAS2021-237).

3. Results and Discussion

3.1. Characterization of Electrode Preparation Process

Figure 2 presents SEM images of the fabricated electrodes, including SPE, SPE/SWCNTs, SPE/SWCNTs/AuNPs, and SPE/SWCNTs/AuNPs/Ca-ISM. The bare SPE surface (Figure 2A) exhibits a moderately rough morphology, characterized by a uniform distribution of particles and the absence of discernible cracks or defects. Small pores, which can facilitate ion transport, are also evident [34]. Figure 2B clearly illustrates a dense, randomly networked structure of SWCNTs, often observed as individual tubes or small bundles with multiple interconnected points [35]. In Figure 2C, AuNPs are observed to be uniformly dispersed on the SWCNTs’ surface, exhibiting a spherical morphology. After modification with Ca-ISM, a smooth and flat membrane surface is observed, indicating that Ca-ISM has successfully covered the electrode surface modified by SWCNTs/AuNPs (2D). The film layer has no obvious cracks or pores, confirming the uniform spreading and curing effect of the film solution during the electrode preparation process, which provides a stable interface basis for ion-selective recognition. The above results indicate that SWCNTs, AuNPs, and Ca-ISM have been successfully integrated into the SPE substrate.

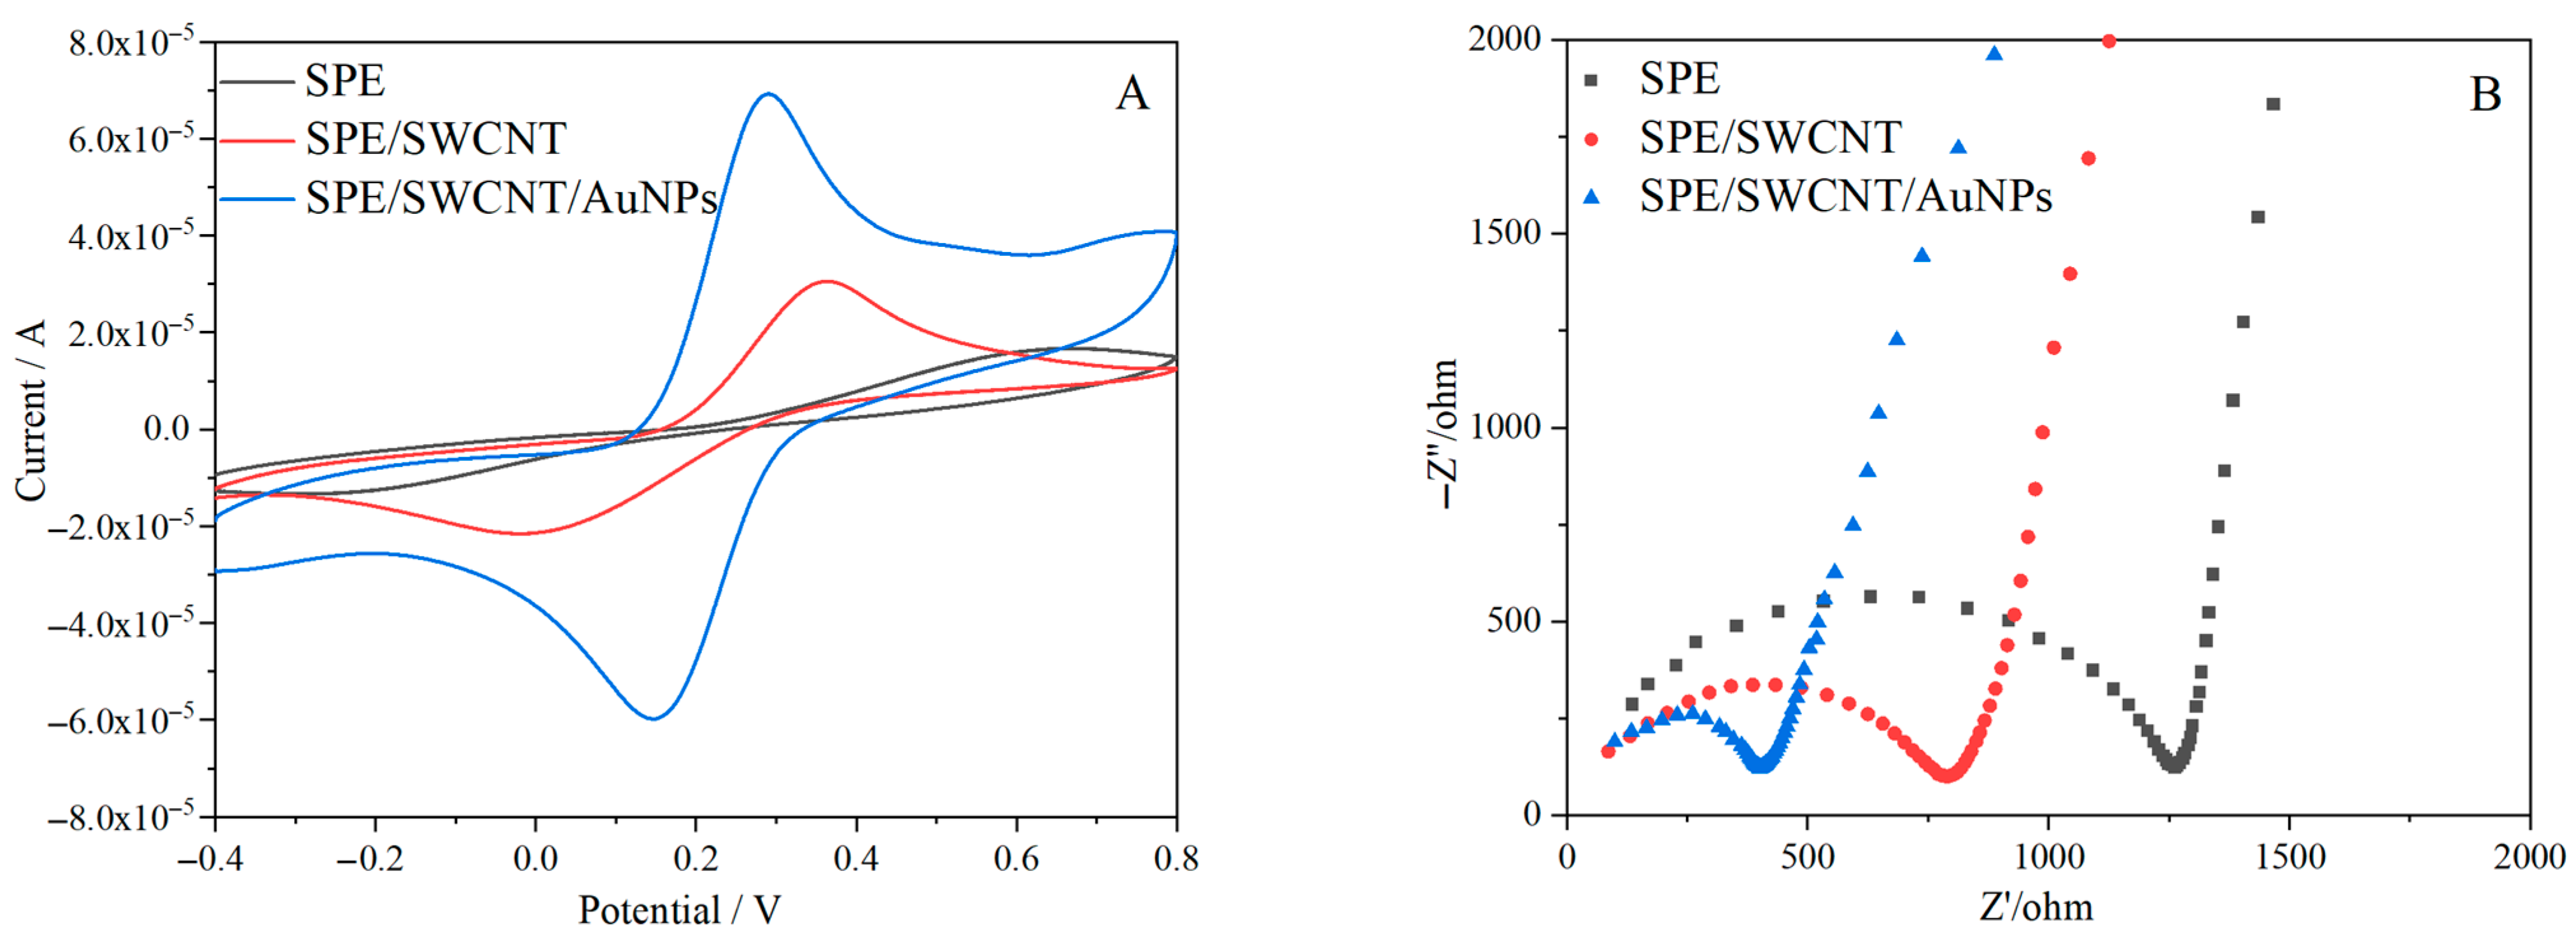
3.2. Electrochemical Characterization of the Fabricated Sensor

To assess the impact of modifications on electrode performance, CV and EIS were employed using a 5.0 mM [Fe(CN)6]4−/3− solution as the electrolyte. Figure 3A presents the CV curves of the electrodes before and after modification with SWCNTs and AuNPs, respectively. It is well-established that a higher redox peak current indicates improved electrode conductivity [36]. The bare SPE exhibited a peak potential difference of 920 mV and a peak current of 17 μA, suggesting poor conductivity. Upon SWCNTs modification, the peak potential difference decreased to 390 mV, while the peak current increased to 31 μA, representing a 55% enhancement in conductivity. The subsequent electrodeposition of AuNPs further boosted the peak current to 69 μA. The observed increase in conductivity can be attributed to the expanded surface area of the modified SPE, coupled with the superior electronic properties of SWCNTs and AuNPs [18].
To investigate the charge transport and ion diffusion properties of the fabricated SPE/SWCNTs/AuNPs electrode, EIS measurements were conducted. The Nyquist plots, presented in Figure 3B, were acquired over a frequency range of 100 kHz to 0.1 Hz. The observed semi-circular behavior in the high-frequency range is indicative of charge transfer resistance at the electrode–electrolyte interface, while the linear trend in the low-frequency range reflects the diffusion-controlled regime of electrolyte ions through the electrode surface [37]. Comparative analysis revealed a significant reduction in impedance values for the modified electrodes compared to the unmodified SPE. This improvement can be attributed to the microporous structure of SWCNTs, which provides a high specific surface area, facilitating rapid ion diffusion within the pores and enhancing electrolyte penetration, thereby leading to an increase in specific capacitance [38]. The electrochemical deposition of AuNPs onto the SWCNTs surface further decreased the resistance, suggesting that the combination of SWCNTs and AuNPs synergistically enhances electron transfer kinetics, resulting in a reduction in charge transfer resistance [39].

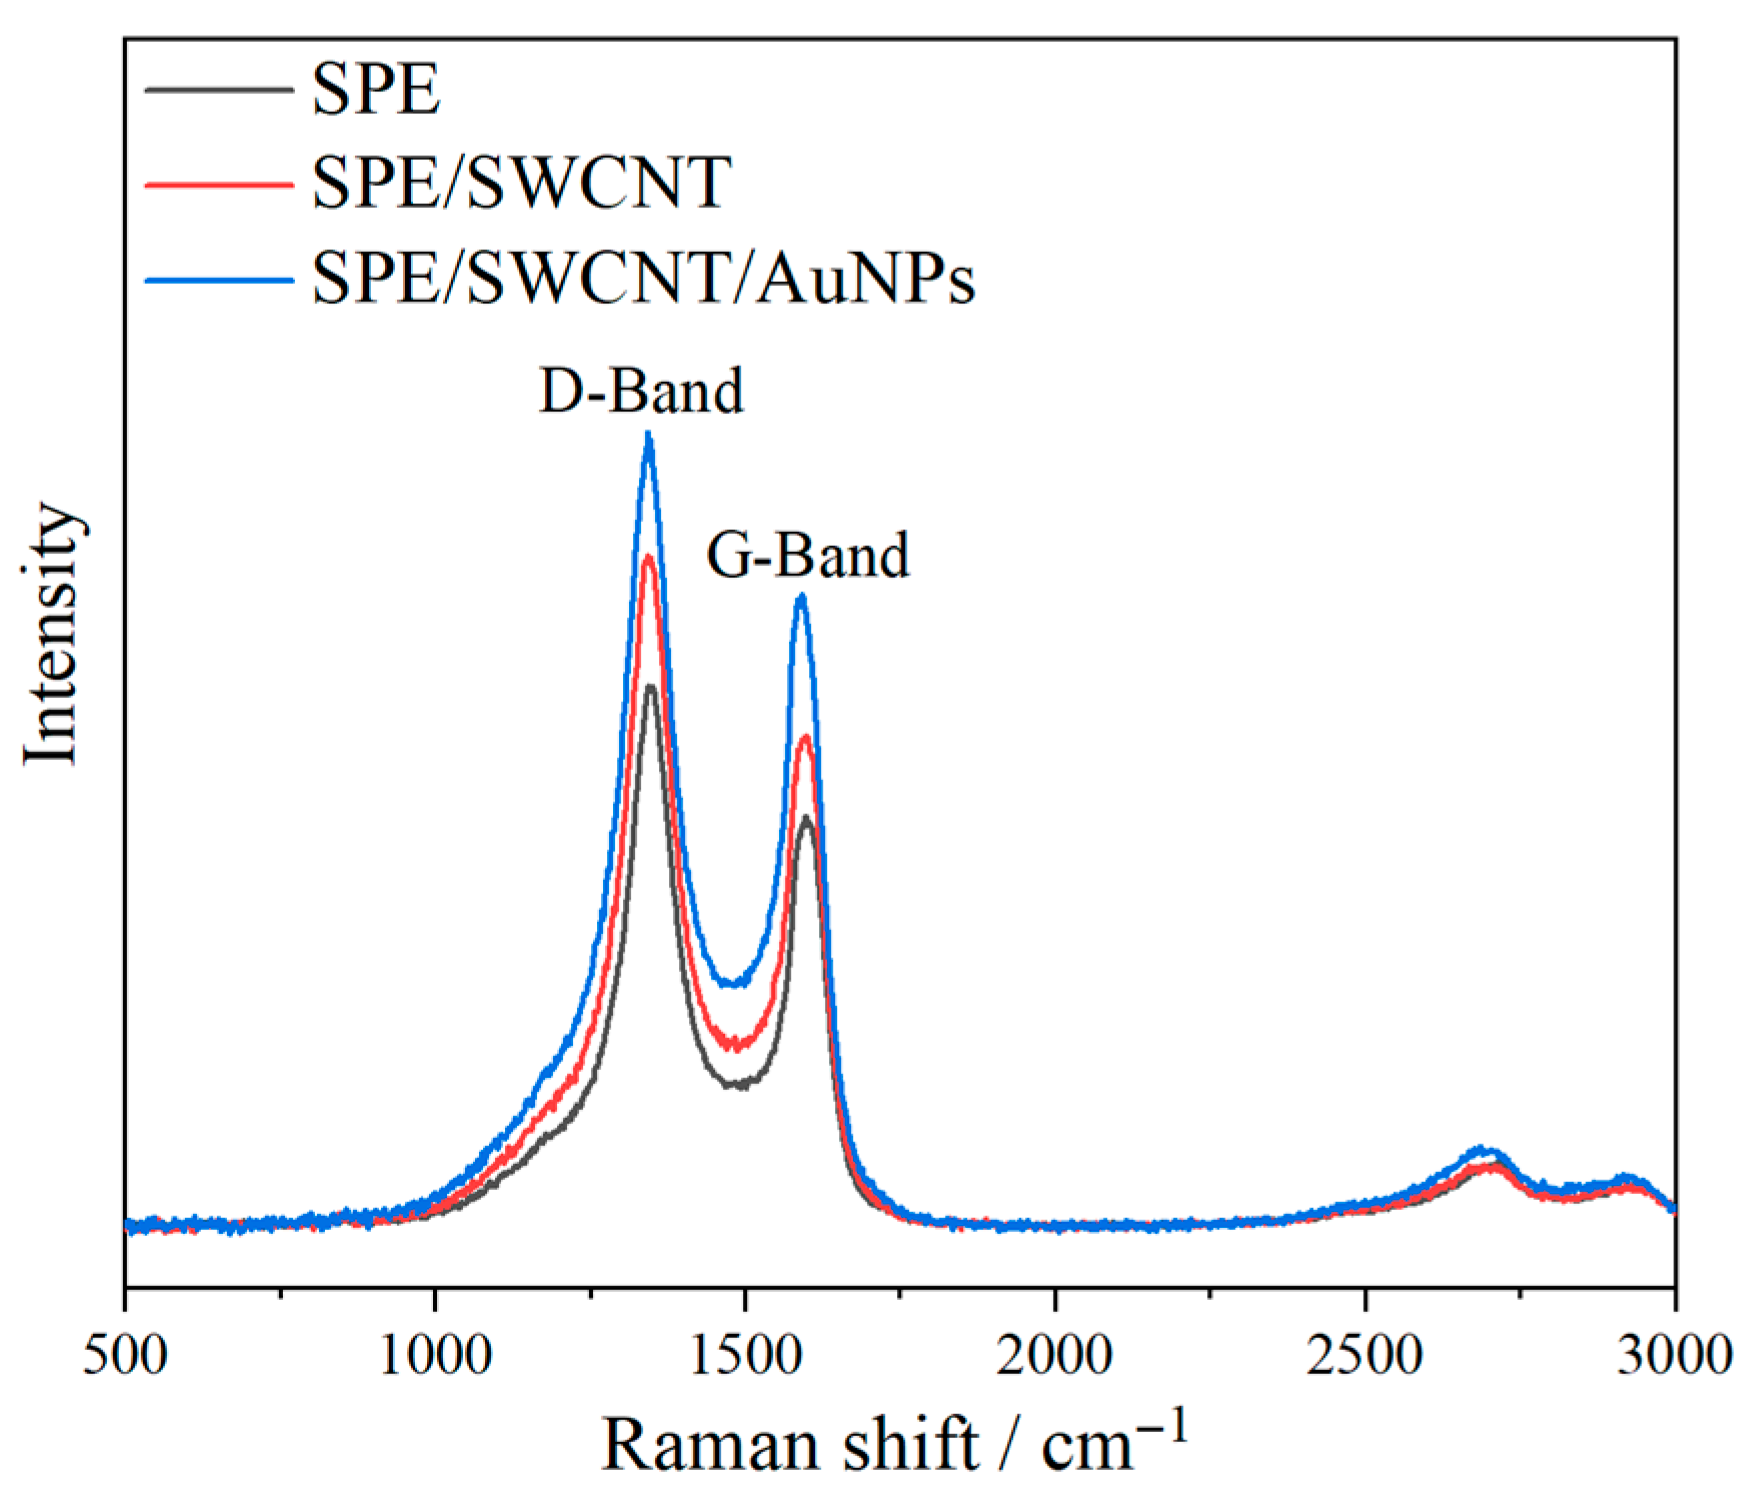
3.3. Raman Spectroscopy

Raman spectroscopy was used to deeply analyze the microstructure characteristics of carbon materials on the electrode surface. As shown in Figure 4, after modification, SWCNTs exhibit distinct D bands (~1350 cm−1, defect vibration) and G bands (~1590 cm−1, graphitization vibration), with an intensity ratio ID/IG of 0.82, indicating that SWCNTs have a low defect density and a highly ordered sp2 conjugated structure [40,41]. This feature is directly related to its excellent electronic conductivity, providing an ideal substrate for the subsequent uniform deposition of AuNPs. After AuNPs modification, the intensities of the D band and G band increased by 19% and 29%, respectively. This is attributed to the surface-enhanced Raman effect of AuNPs—the electromagnetic field coupling effect at the interface between AuNPs and SWCNTs significantly enhanced the Raman scattering cross-section of carbon materials [42,43]. Meanwhile, the spectral peak positions did not shift significantly, confirming that the deposition of AuNPs did not damage the lattice structure of SWCNTs.

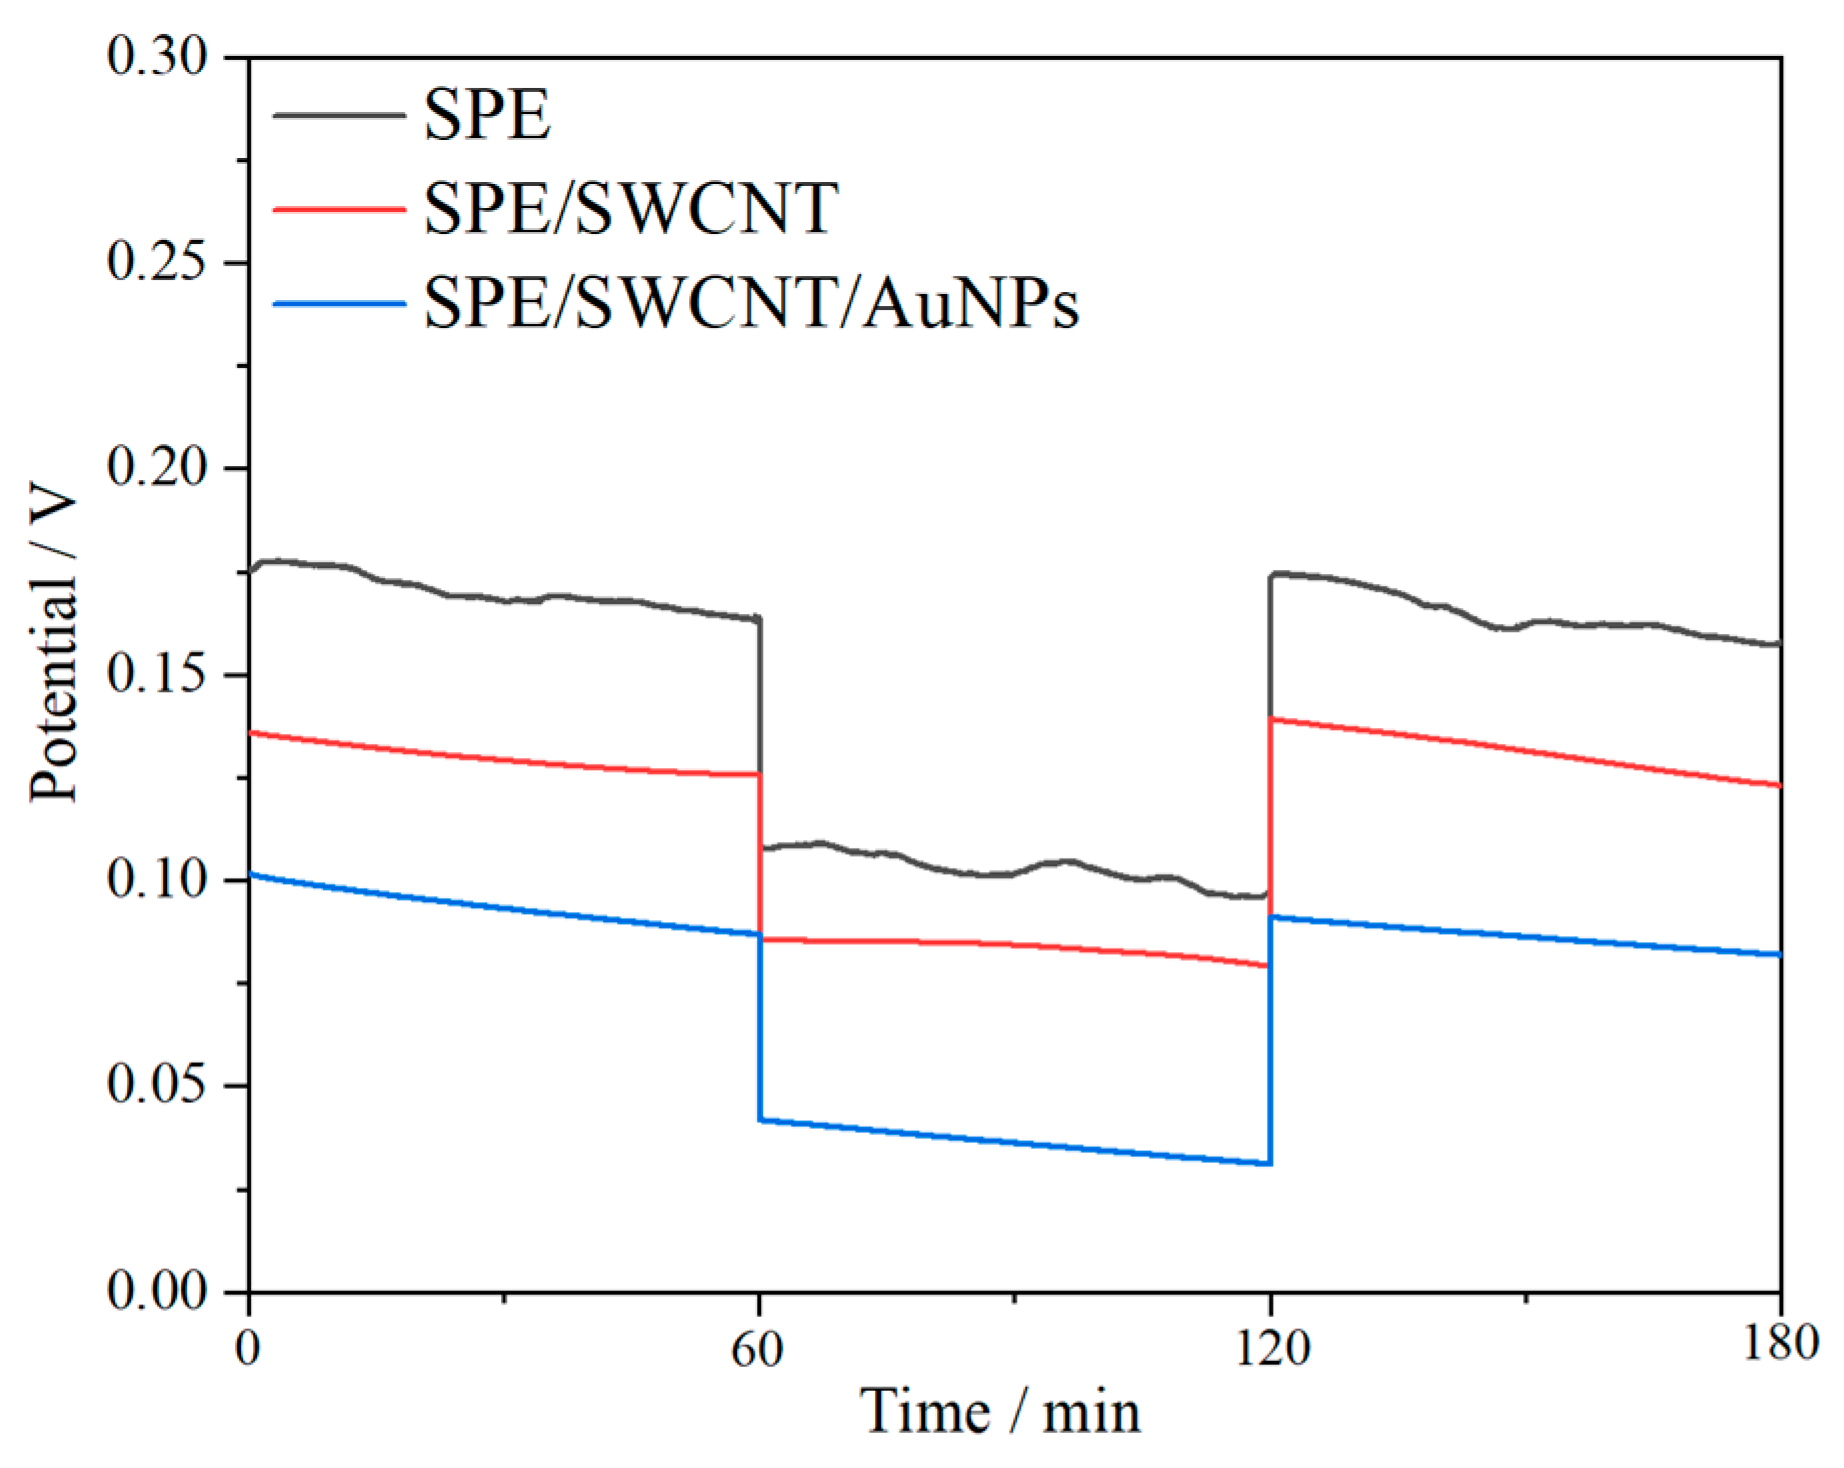
3.4. Water Layer Test

A critical challenge associated with solid-contact ISEs is the potential formation of an unwanted water layer between the solid-contact layer and the ISM. This water layer can act as a reservoir for ions, leading to interfacial contamination and compromised detection limits [44,45]. Consequently, it is imperative to evaluate the sensor for the presence of such water layers. Figure 5 presents the potential responses of SPE/Ca-ISM, SPE/SWCNTs/Ca-ISM, and SPE/SWCNTs/AuNPs/Ca-ISM in 10−2 M CaCl2, 10−2 M NaCl, and 10−2 M CaCl2 solutions, respectively. The SPE/Ca-ISM electrode exhibited notable potential drift in different solutions, indicative of a water layer forming between the electrode surface and the ISM, a significant limitation for practical sensor applications. In contrast, the SPE/SWCNTs/Ca-ISM and SPE/SWCNTs/AuNPs/Ca-ISM electrodes demonstrated superior stability without substantial potential drift. This enhanced performance can be attributed to the hydrophobic nature of SWCNTs and AuNPs, which effectively inhibits the formation of water layers. These findings align with the observations reported by Hernandez et al. [46].

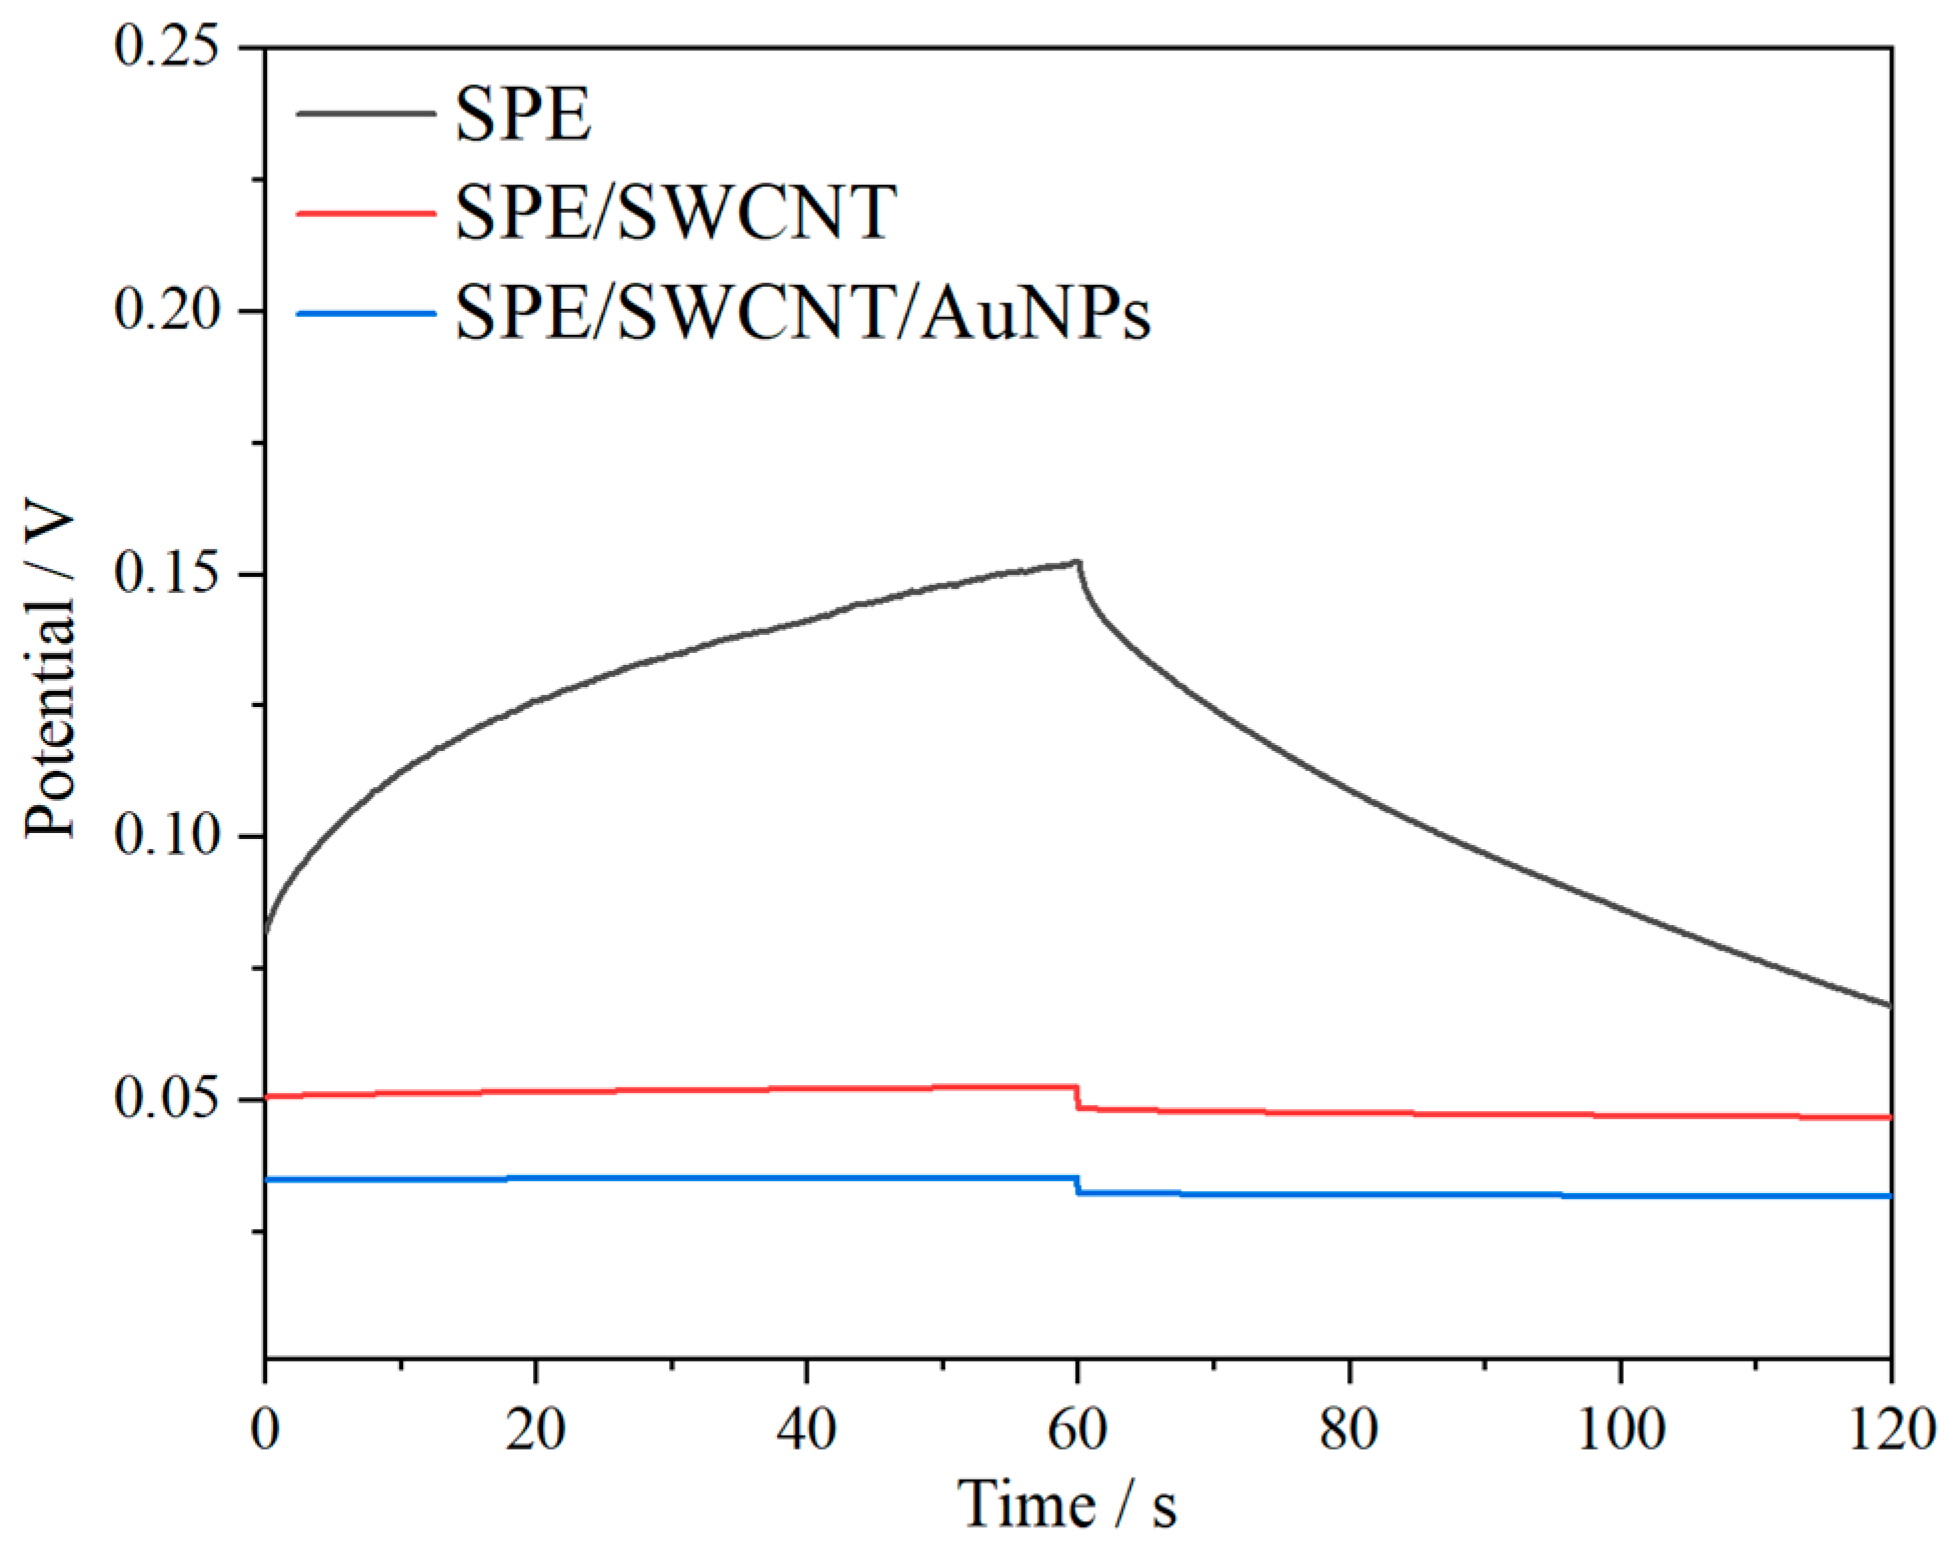
3.5. Chronopotentiometry

Chronopotentiometry was employed to assess the capacitance of the solid contact layer and the short-term potential stability of the ISEs [47]. Figure 6 presents the chronopotentiograms of SPE/Ca-ISM, SPE/SWCNTs/Ca-ISM, and SPE/SWCNTs/AuNPs/Ca-ISM. A constant current of ±1 nA was applied to the electrode for 60 s while the resulting potential changes were observed. The short-term potential stability was evaluated using the formula ΔE/Δt = I/C, where I represents the applied current (±1 nA), Δt is the current application time (60 s), and C is the capacitance [48]. The calculated potential drift for SPE/Ca-ISM was 1400 μV/s, corresponding to a capacitance of 0.7 μF. In contrast, SPE/SWCNTs/Ca-ISM and SPE/SWCNTs/AuNPs/Ca-ISM exhibited significantly reduced potential drifts of 32.3 and 9.1 μV/s, respectively, with capacitances of 31.3 and 109.9 μF. These findings demonstrate that the utilization of SWCNTs/AuNPs as solid contact layers substantially enhances the short-term potential stability and capacitance of the Ca2+-ISE, thereby facilitating the fabrication of reliable solid-contact ISE.

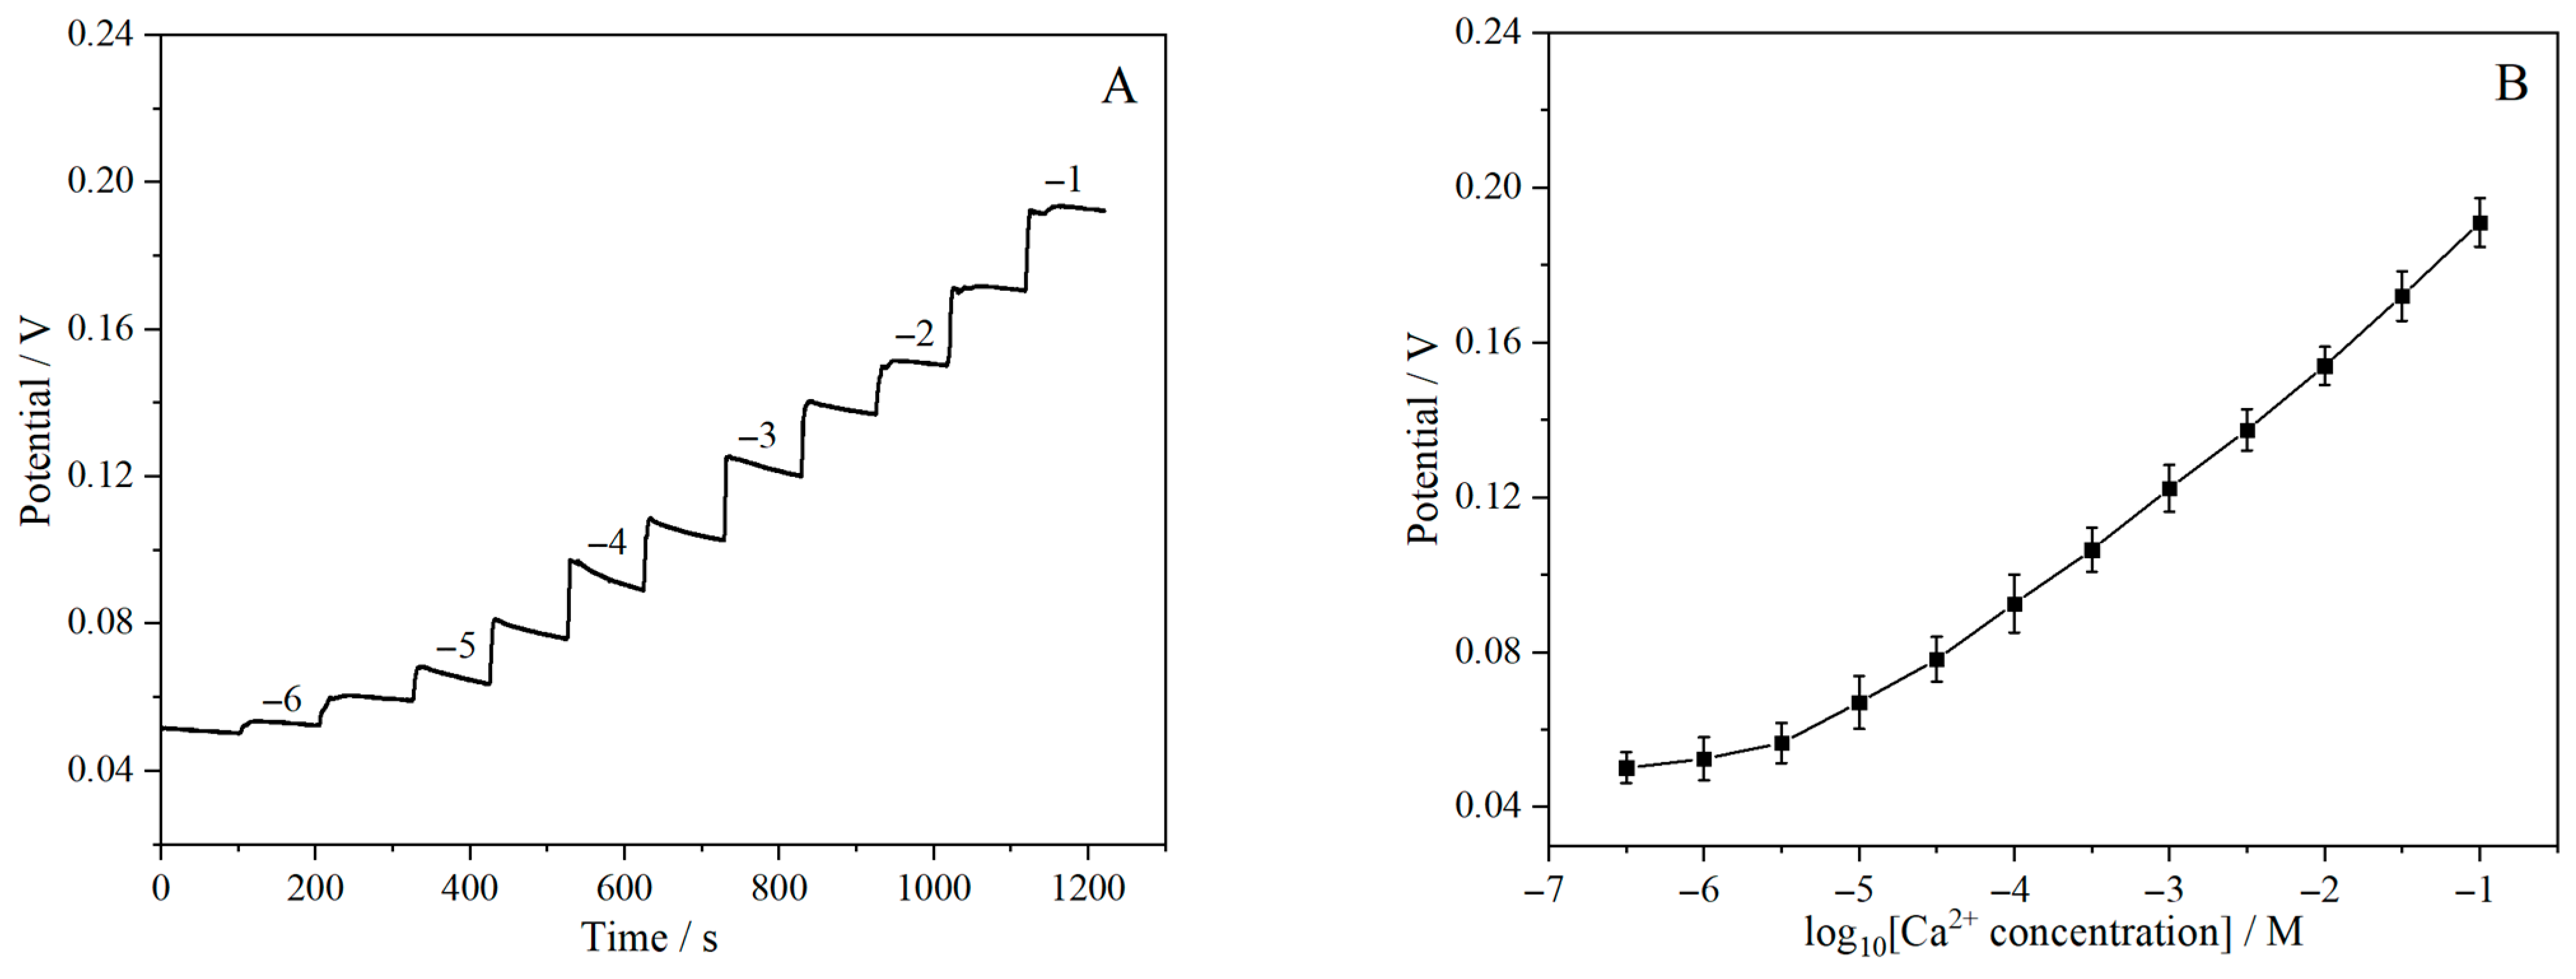
3.6. Potential Response

To characterize the dynamic potential response and establish calibration curves for the SPE/SWCNTs/AuNPs electrode, measurements were conducted in CaCl2 solutions spanning a concentration range of 10−6–10−1 M. As illustrated in Figure 7A and Figure 7B, respectively, the electrode exhibited a Nernst response within the concentration range of 10−5.5–10−1 M, with a slope of 30 ± 0.3 mV/decade, an R2 value of 0.9934, and a detection limit of 10−5.5 M. Notably, the developed electrode demonstrated a rapid response time of approximately 15 s, significantly outperforming liquid-contact ISEs. This marked improvement in response time can be attributed to the elimination of the internal solution, which has been identified as a major contributor to sluggish response kinetics in traditional ISEs [47].

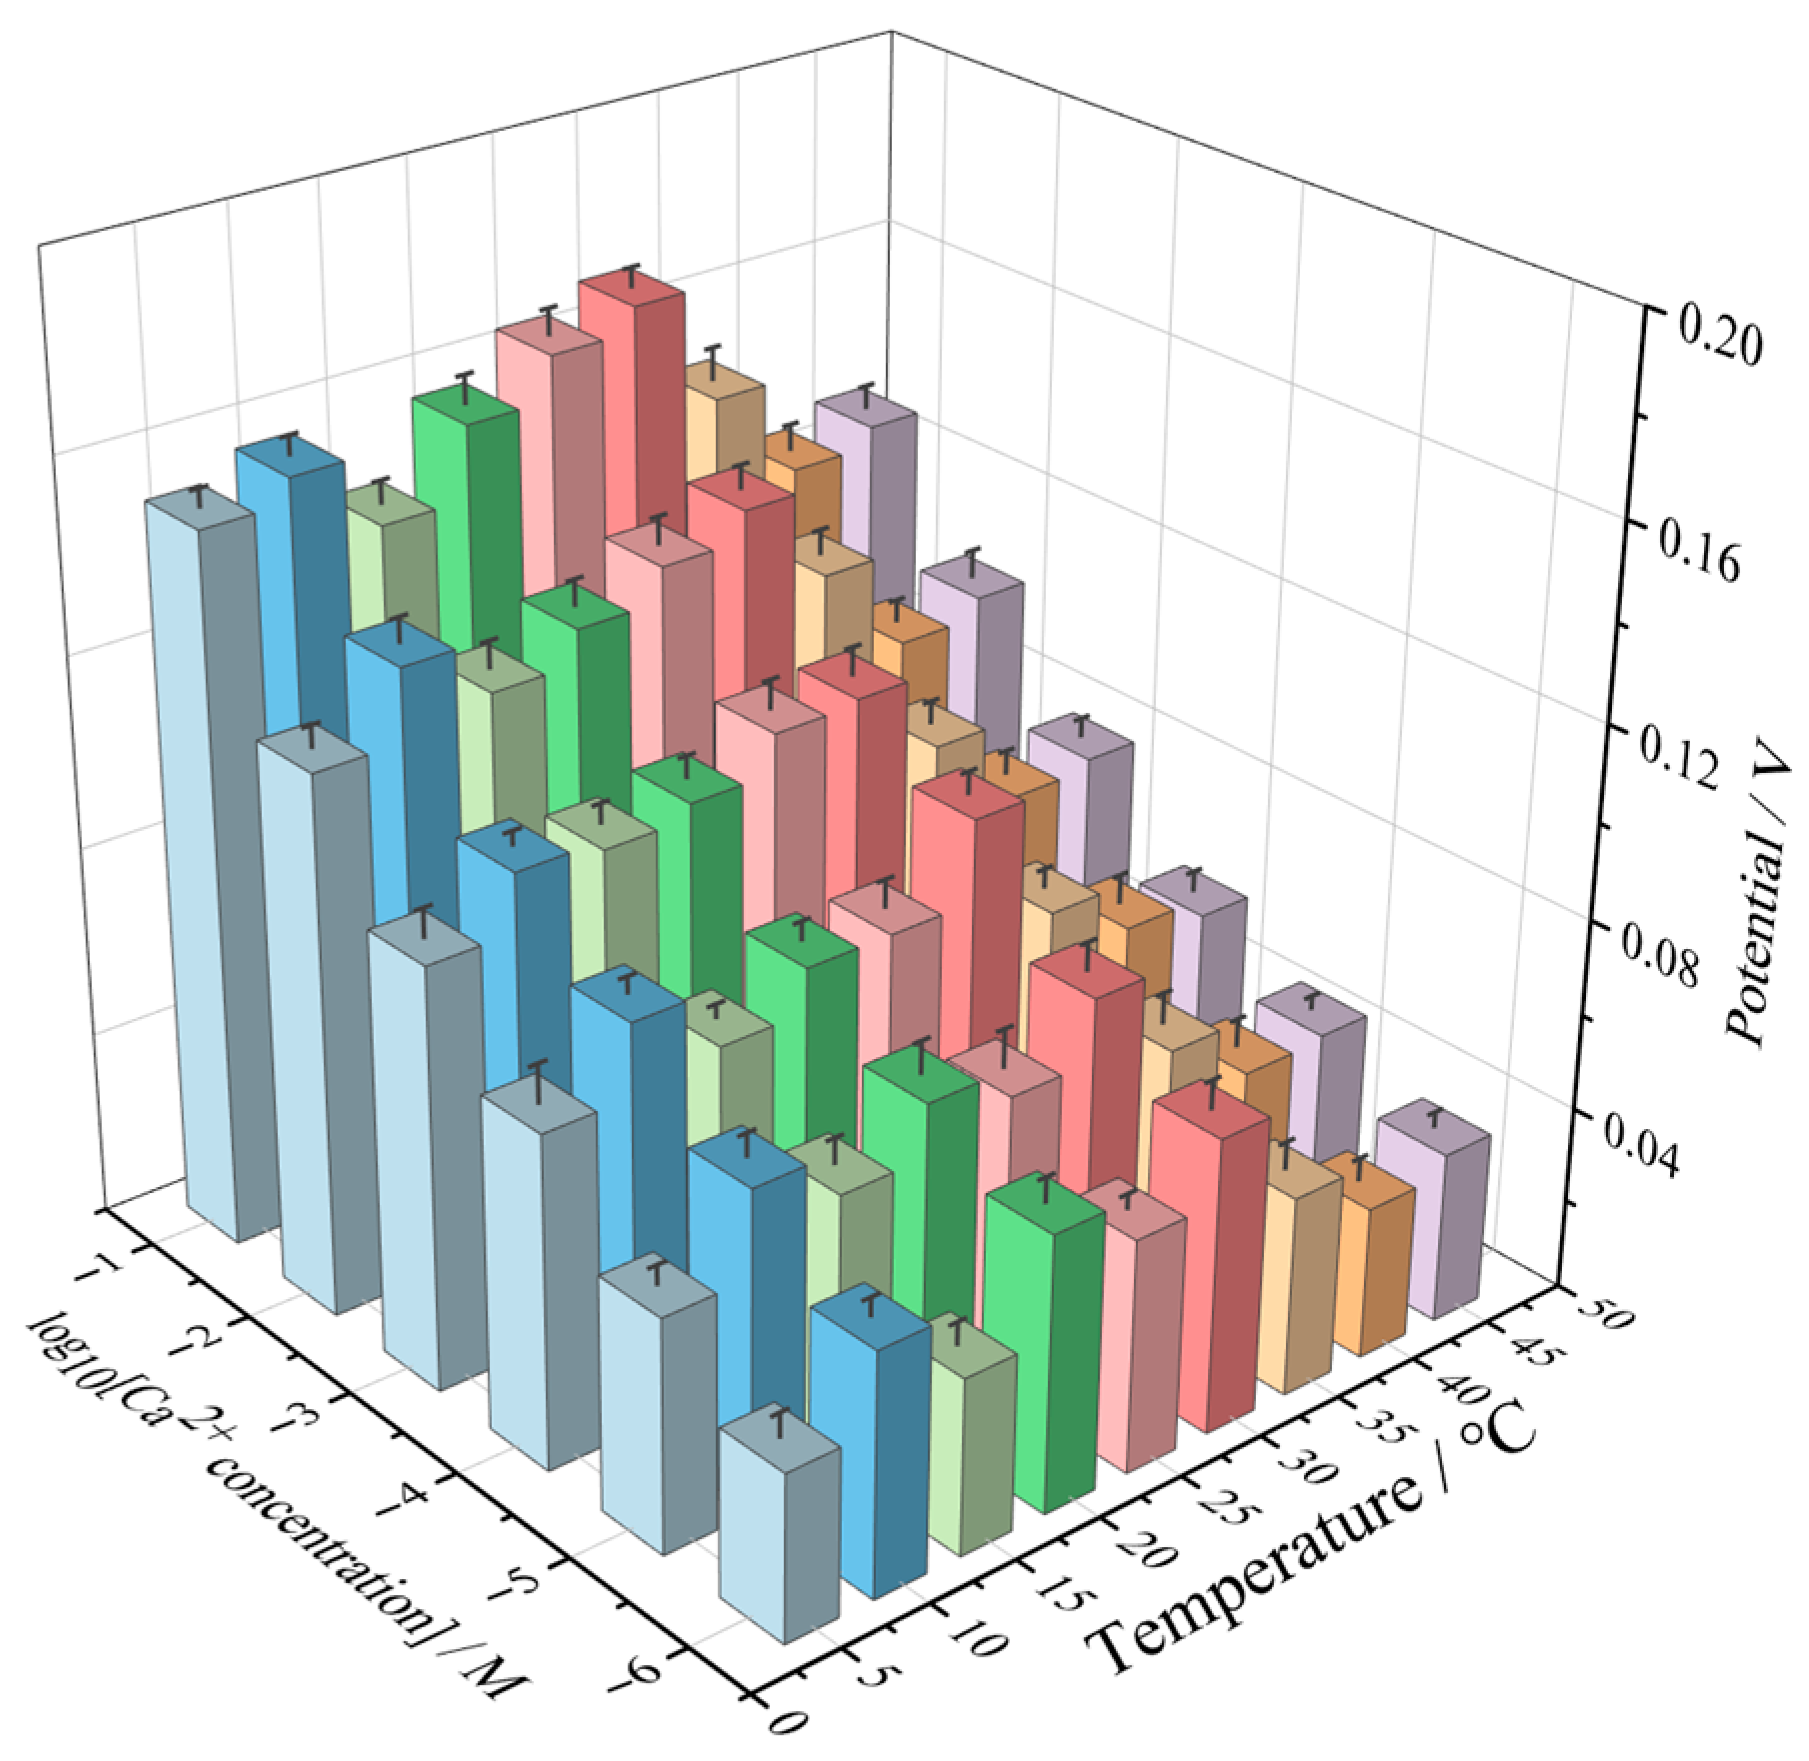
3.7. Effect of Temperature and Ca2+ Concentration on Electrical Signal

The performance of ISEs is inherently influenced by temperature variations, which can be particularly significant in on-site analytical applications [49]. To assess the impact of temperature on measurement accuracy, the potential response of the Ca-ISE was evaluated across a range of temperatures and calcium ion concentrations, as depicted in Figure 8. The solution temperatures varied from 5 to 45 °C, while the calcium ion standard solutions spanned concentrations from 10−6 to 10−1 M. Despite temperature fluctuations, minimal changes were observed in the potential values of calcium ions at a given concentration. On one hand, temperature variations can affect the ion activity coefficient, thereby altering the correlation between ion activity and concentration [50]. On the other hand, both the standard potential and the Nernst slope coefficient are temperature-dependent [51]. Consequently, temperature-induced changes can lead to deviations in electrode response. However, the observed strong linear correlation between potential response and Ca2+ concentration, with slopes ranging from 0.0184 to 0.023 and R2 values ranging from 0.963 to 0.9971 (Table 1), indicates that the prepared electrode maintains reliable performance within the temperature range of 5 to 45 °C, exhibiting minimal deviations from Nernst behavior.

3.8. Data Preprocessing

Data should be preprocessed during modeling. In order to reduce the interference caused by different orders of magnitude and improve the convergence efficiency of the neural network, data should be normalized according to specific formulas.
Y = l o g 10 ( C ) / 6
X = [ 1 , t , t 2 , s , s 2 , t s ]
t = T/50, s = S × 5
where C is the concentration of Ca2+, T and S are the actual temperature and electrical signal, and t and s are the data after normalization.

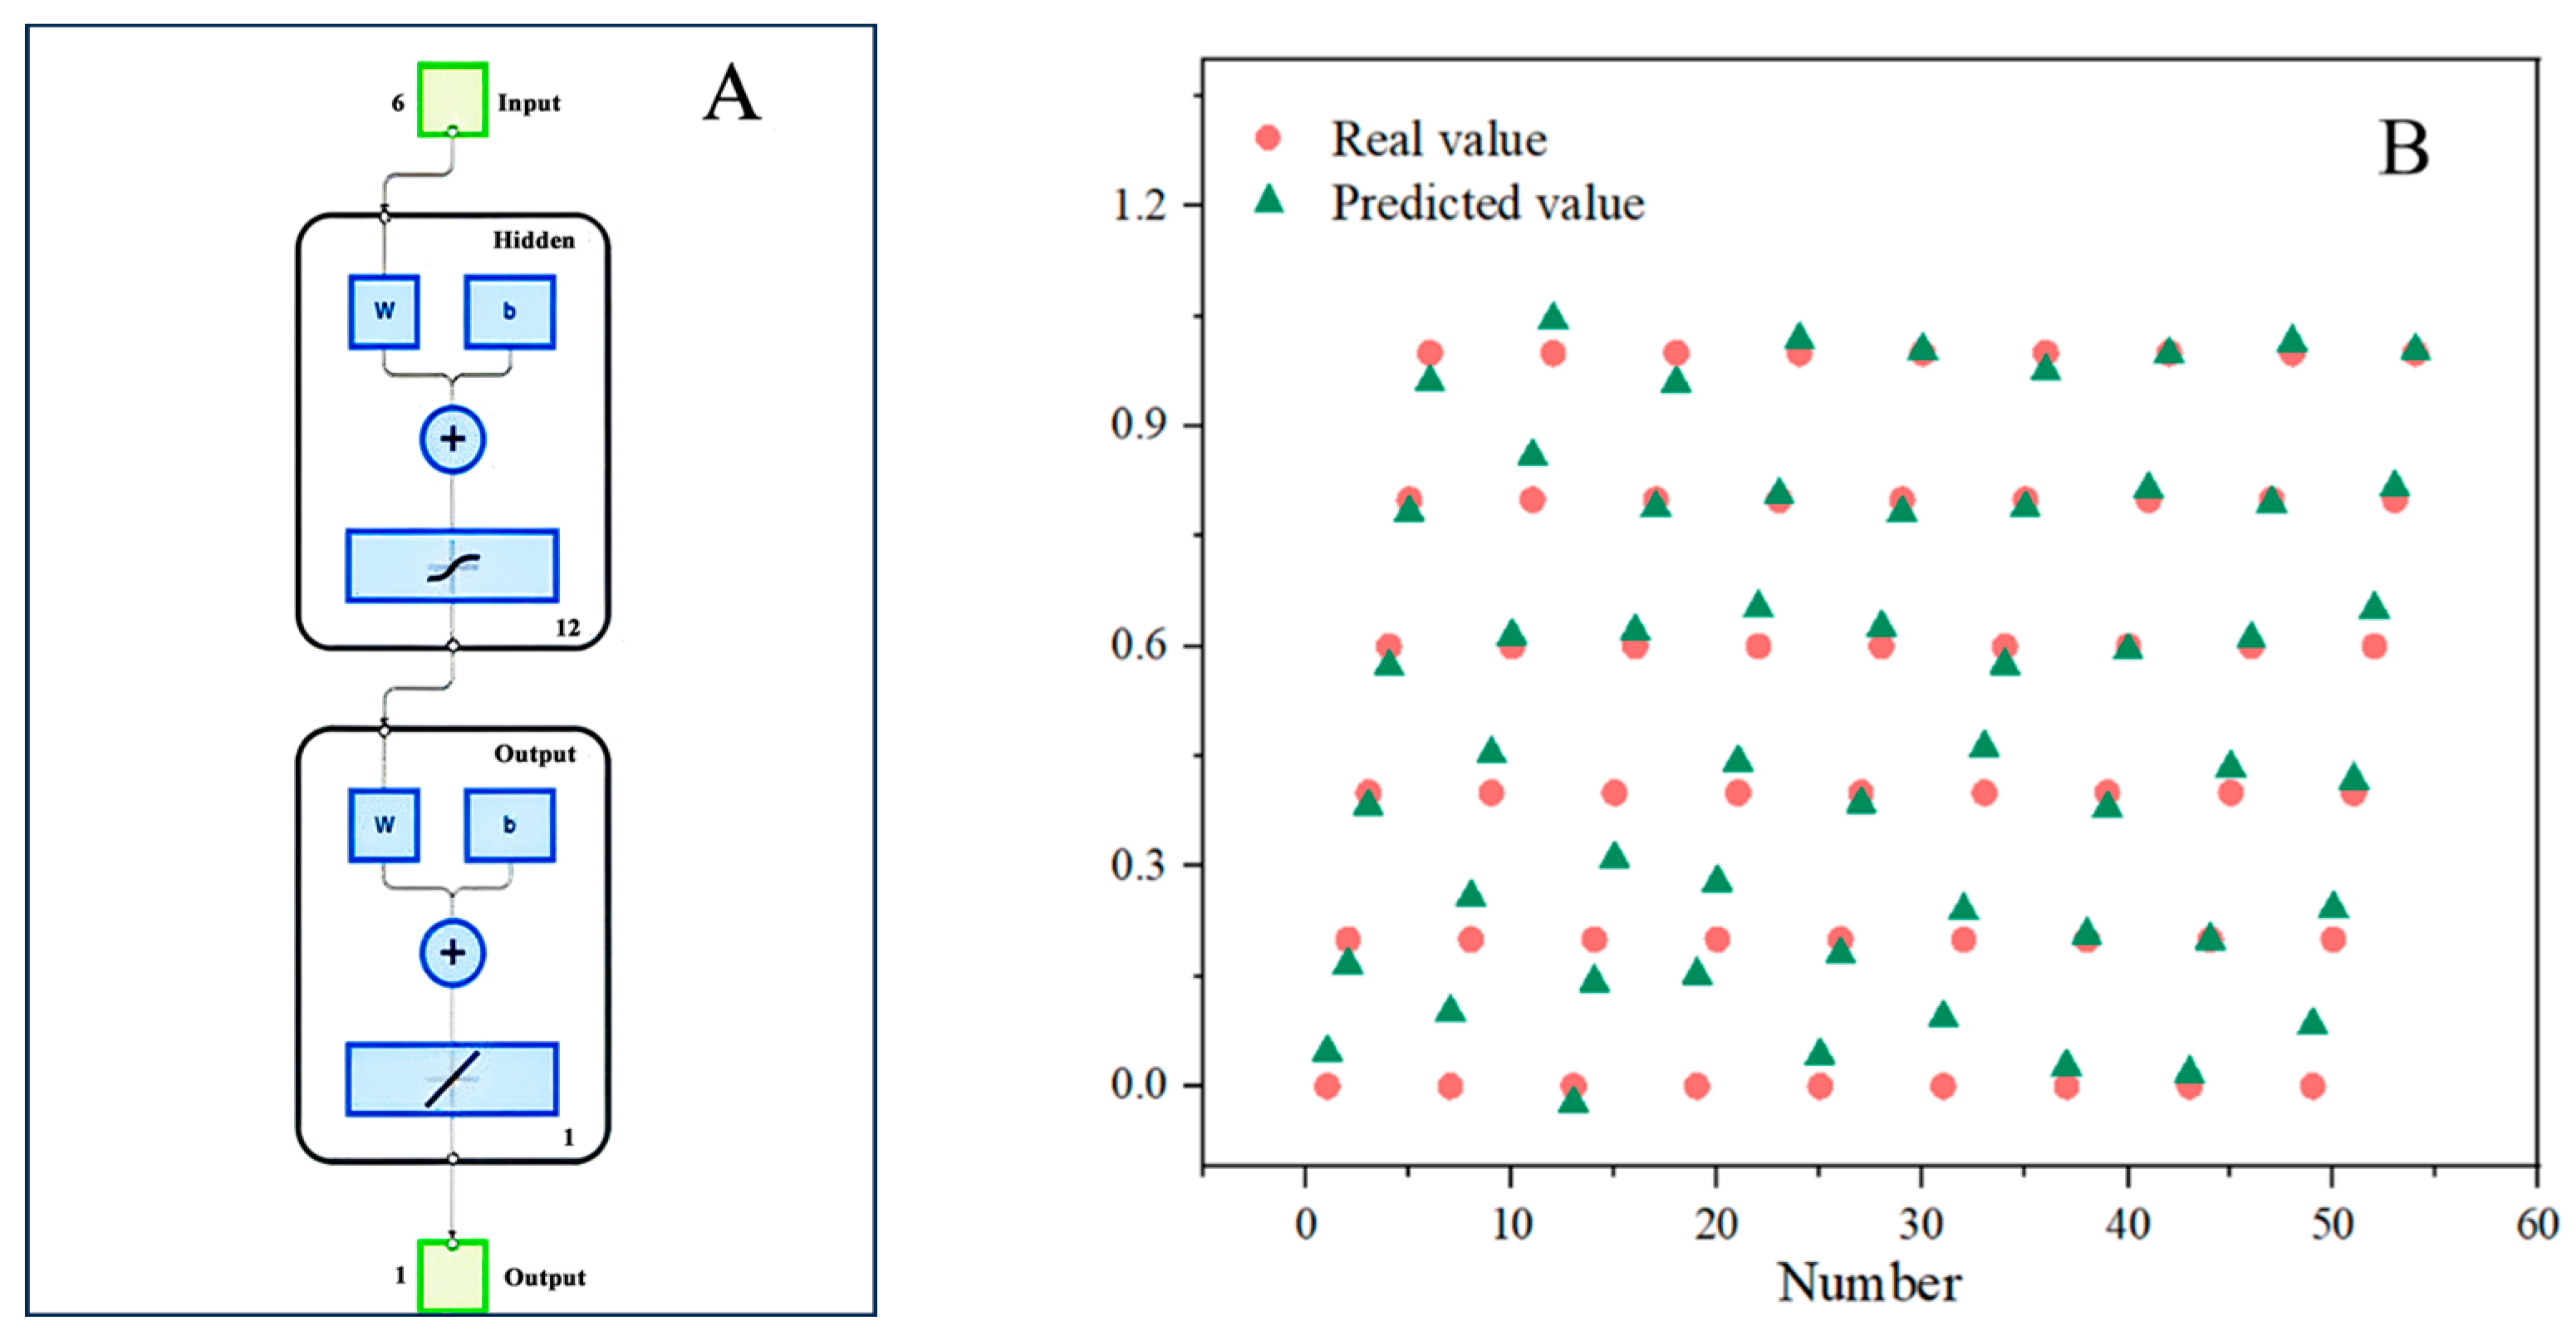
3.9. Artificial Neural Network Model

Artificial neural networks (ANN) are composed of multiple interconnected neurons that form a network through weighted connections. This network can learn features from data and perform self-optimization, thereby enabling the prediction or classification of unknown data. The model consists of three components: the input layer, hidden layer, and output layer (Figure 9A). In this model, the X matrix serves as the input layer, with temperature (5 °C to 45 °C, a total of nine gradients) as columns and Ca2+ concentration (10−6–10−1 M, a total of six levels) as rows, forming a data matrix of nine columns and six rows. The Y matrix serves as the output layer, appearing as a single column matrix containing 54 rows of data. The data of the X matrix is randomly divided into three parts: 70% of the data is used as training samples, 15% is used as testing samples, and 15% is used as validation samples. Through the hidden layer structure of 12 neurons (trained 500 times using the Levenberg–Marquardt algorithm), the complex correlation between temperature and concentration can be adaptively learned. Figure 9B presents a comparison between the predicted results and actual data, where the correlation coefficient R is as high as 0.992, which strongly proves the high correlation between the predicted and observed values.
The traditional Nernst linear calibration is based on the calibration curve at a single temperature. Due to the neglect of the nonlinear influence of temperature on the ion activity coefficient and the membrane potential slope, it shows a large error: Its root mean square error (RMSE) is 0.087 mM, the mean absolute error (MAE) is 0.069 mM, and R2 is 0.921. In contrast, the ANN model achieves the fitting of nonlinear relationships by integrating temperature (T), electrical signal (S), and their quadratic terms and interaction terms: RMSE decreased to 0.032 mM (a 63% reduction), MAE decreased to 0.025 mM (a 64% reduction), and R2 increased to 0.992, indicating a significant improvement in the consistency between the predicted values and the true values.

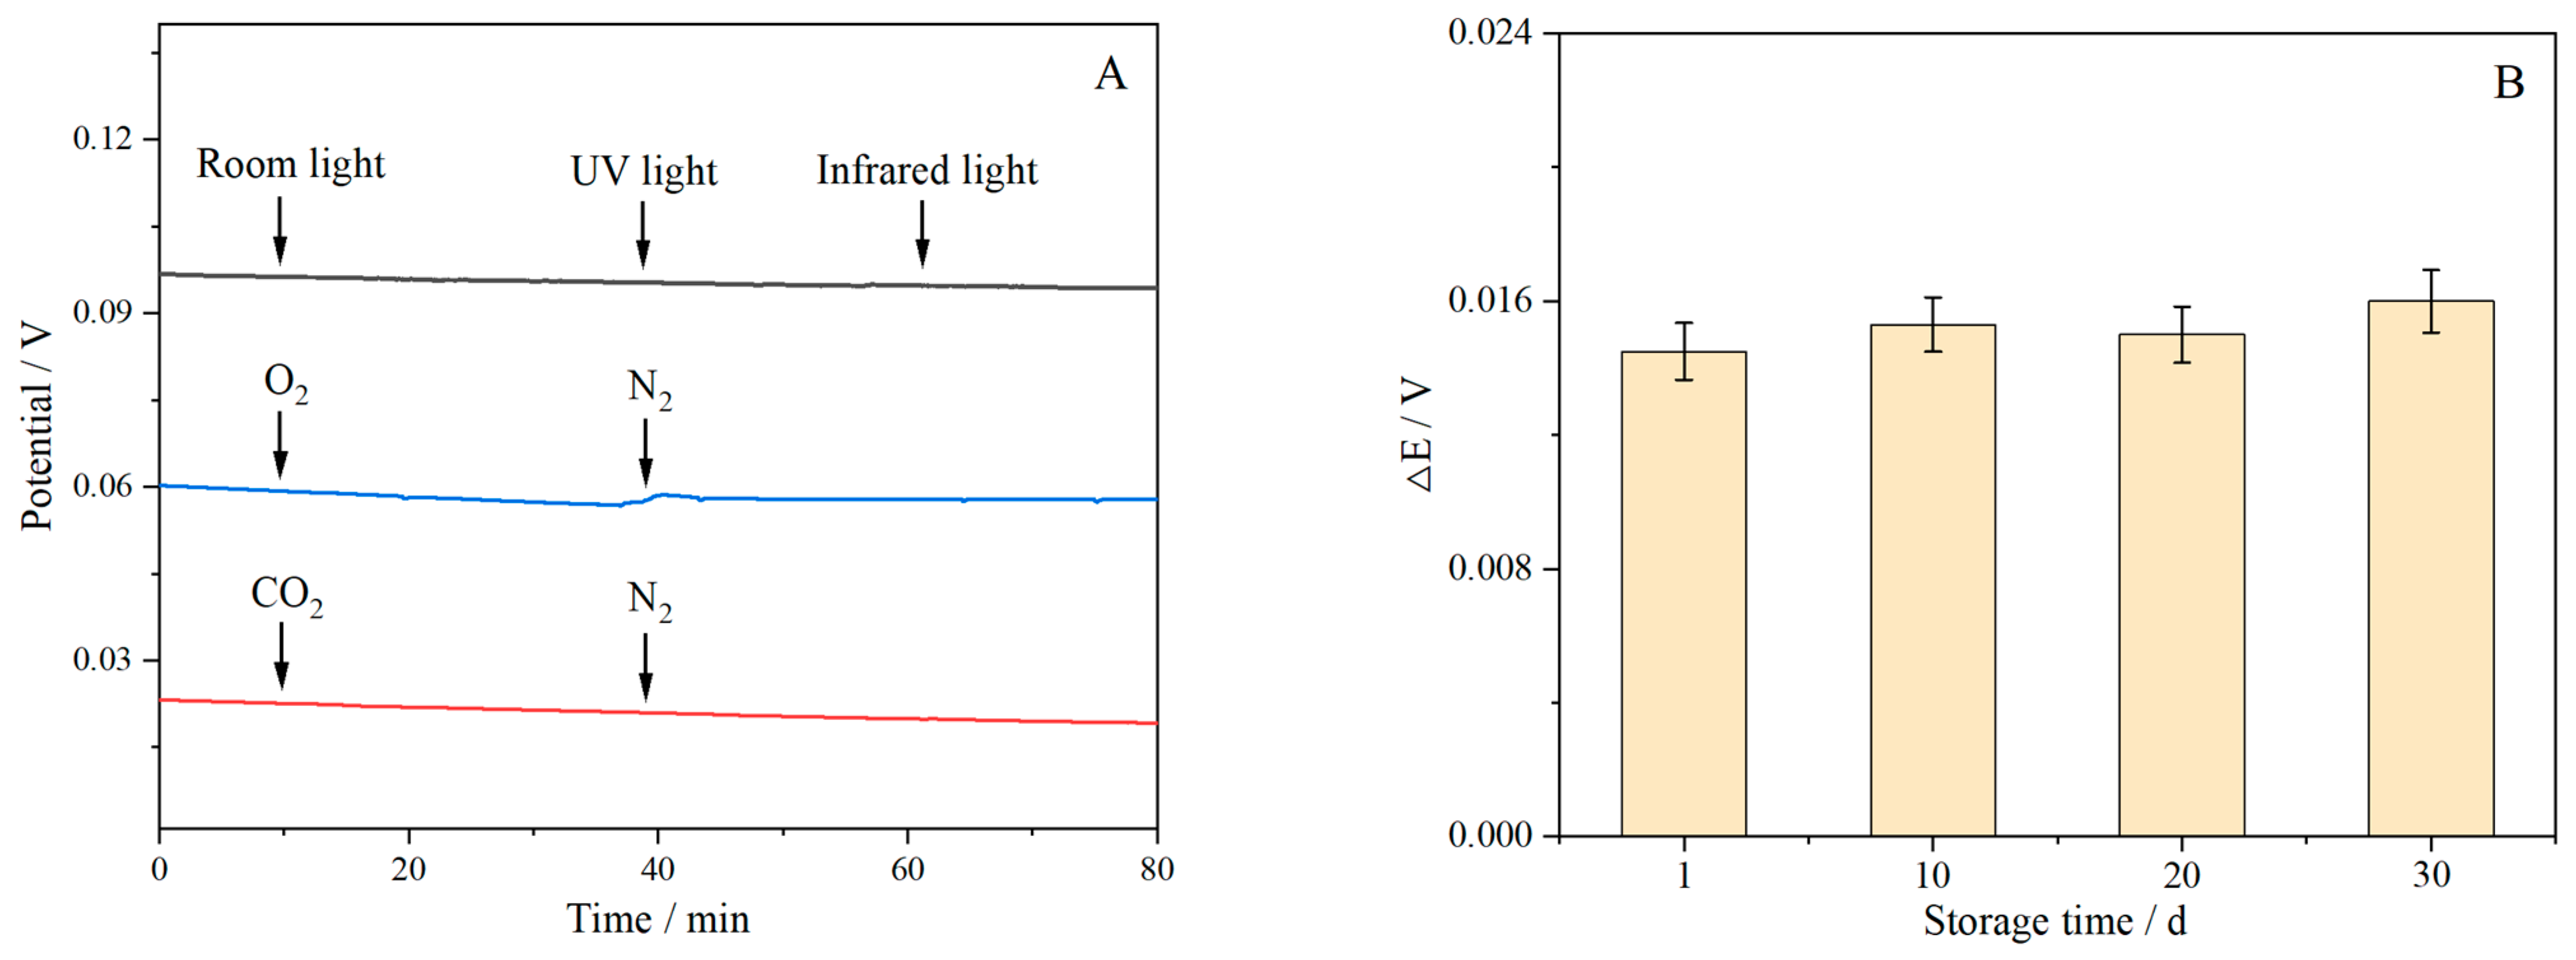
3.10. Interference Test and Stability

O2, CO2, and light are the main factors affecting the stability of SC-ISEs [8]. O2 and CO2 can diffuse into the ISM, reacting with redox-active substances or water, which alters the local pH within the ISM and impacts electrode stability [52]. Furthermore, solid contact layers with photosensitive properties are also susceptible to interference from ambient light. The anti-interference ability of the electrode can be evaluated by recording its potential in 10−2 M CaCl2. Prior to testing, the electrode was equilibrated in the solution for 10 min. To evaluate the effects of O2 and CO2, these gases were introduced into the solution for 30 min each, followed by a 30 min purging with N2. As depicted in Figure 10, no significant potential interference was observed, suggesting that O2 and CO2 have a negligible impact on the electrode’s stability. This may be attributed to the absence of a water layer between the Ca-ISM and conversion layer, preventing CO2 from reacting with water to form carbonic acid and thus avoiding pH changes. Additionally, the absence of redox-active substances in the conversion layer precludes reactions with O2, further minimizing potential interference [53]. To evaluate photosensitivity, the electrodes were exposed to room light, ultraviolet light, and infrared light individually. The results presented in Figure 10A indicate that SPE/SWCNTs/AuNPs/Ca-ISM is not susceptible to light-induced interference. These findings collectively demonstrate the robust potential stability of the sensor, attributable to the unique properties of the SWCNTs/AuNP-based ion–electron conversion layer. In addition, the potential change of the sensor within 30 days is very small, demonstrating satisfactory stability (Figure 10B).

3.11. Comparison of Different Ca-ISEs

Table 2 presents a comparative analysis of the detection capabilities of the sensor (SPE/SWCNTs/AuNPs/Ca-ISM) developed in this study with other reported calcium ion sensors. While most existing sensors exhibit comparable linear ranges and detection limits, the sensor presented here adequately meets the requirements for measuring Ca2+ concentrations (1.06–1.33 mM) typically encountered in bovine serum. Moreover, the synergistic combination of SPE and ISMs enhances the selectivity, stability, and miniaturization potential of the proposed electrode. Notably, the elimination of complex sample pretreatment procedures enables rapid on-site Ca2+ determination, further highlighting the practical advantages of this innovative sensing platform.

3.12. Determination of Ca2+ in Samples

To validate the accuracy and practicality of the proposed sensor (SPE/SWCNTs/AuNPs/Ca-ISM) for practical applications, blood samples of dairy cows were collected and measured. Following the sample preparation protocol outlined in Section 2.4, the analytical results are tabulated in Table 3; the original measured values can be found in the Supplementary Materials. The sensor exhibited a commendable sample recovery rate ranging from 94.48% to 101.50%. The slight difference in the recovery rate might be due to the competitive adsorption of cations such as Na+ and K+ in the serum with Ca2+ on the surface of the ion-selective membrane, or the different binding forces of proteins in the serum samples with Ca2+. Meanwhile, the initial pH differences among different samples may still affect the ion activity. The relative standard deviation (RSD) is less than 3.5%. These findings unequivocally demonstrate the sensor’s reliability and suitability for the precise determination of Ca2+ levels in real samples.

4. Conclusions

In this study, we successfully developed a screen-printed ion-selective electrode modified with SWCNTs and AuNPs for the determination of Ca2+ concentration in cow blood. Within the temperature range of 5–45 °C, the electrode can maintain high sensitivity and detection accuracy, with stable detection performance and a linear range of 10−5.5–10−1 M. It can cover the normal and pathological concentration range of Ca2+ in cow blood. The combination of the large surface area of SWCNTs and the excellent conductivity of AuNPs significantly enhanced the selective recognition and electrochemical signal transduction ability of the electrode for Ca2+. Compared with traditional detection methods, this method not only improved detection efficiency but also reduced detection costs, making it easier to promote and use in practical application scenarios such as ranches. The stable response of this sensor within the range of 5 to 45 °C has solved the problem of fluctuation in detection accuracy of traditional ISE in the ranch environment, enabling the real-time monitoring of blood calcium in dairy cows in different seasons and providing technical support for the early diagnosis of clinical hypocalcemia.

Supplementary Materials

The following supporting information can be downloaded at: https://www.mdpi.com/article/10.3390/chemosensors13070252/s1, Table S1 (Excel format): The original measurement value of Ca2+ in the blood of dairy cows.

Author Contributions

Conceptualization, Z.Y. and H.W.; methodology, Y.H. and R.C.; investigation, Z.Y., R.C., and Y.H.; writing—original draft preparation, Z.Y.; writing—review and editing, H.W. and B.X.; supervision, X.T.; project administration, X.T. and B.X.; funding acquisition, X.T. and B.X. All authors have read and agreed to the published version of the manuscript.

Funding

This research was funded by National Natural Science Foundation of China (No.32202738), Ningxia Key Research and Development Project (2022BBF02020), Guangxi Innovation-Driven Development Special Project (Guike AA22068099), State Key Laboratory of Animal Nutrition and Feeding (No.2004DA125184G2405), and Central Public-interest Scientific Institution Basal Research Fund (YWF-ZYSQ-10).

Institutional Review Board Statement

The study was conducted at the Institute of Animal Science of the Chinese Academy of Agricultural Sciences (Beijing, China), and the animal procedures were approved by the Animal Care and Use Committee of the Chinese Academy of Agricultural Sciences (Beijing, China) (IAS2021-237).

Informed Consent Statement

Not applicable.

Data Availability Statement

All data generated or analyzed during this study are included in this article.

Conflicts of Interest

The authors declare no conflicts of interest.

References

  1. Arechiga-Flores, C.F.; Cortés-Vidauri, Z.; Hernández-Briano, P.; Lozano-Domínguez, R.R.; López-Carlos, M.A.; Macías-Cruz, U.; Avendaño-Reyes, L. Hypocalcemia in the dairy cow. Review. Rev. Mex. Cienc. Pecu. 2022, 13, 1025–1054. [Google Scholar] [CrossRef]
  2. Quiroz-Rocha, G.F.; LeBlanc, S.J.; Duffield, T.F.; Wood, D.; Leslie, K.E.; Jacobs, R.M. Reference limits for biochemical and hematological analytes of dairy cows one week before and one week after parturition. Can. Vet. J.-Rev. Vet. Can. 2009, 50, 383–388. [Google Scholar]
  3. Doehring, C.; Sundrum, A. The informative value of an overview on antibiotic consumption, treatment efficacy and cost of clinical mastitis at farm level. Prev. Vet. Med. 2019, 165, 63–70. [Google Scholar] [CrossRef] [PubMed]
  4. Martinez, N.; Risco, C.A.; Lima, F.S.; Bisinotto, R.S.; Greco, L.F.; Ribeiro, E.S.; Maunsell, F.; Galvão, K.; Santos, J.E.P. Evaluation of peripartal calcium status, energetic profile, and neutrophil function in dairy cows at low or high risk of developing uterine disease. J. Dairy Sci. 2012, 95, 7158–7172. [Google Scholar] [CrossRef]
  5. Mulligan, F.T.; O’Grady, L.; Rice, D.A.; Doherty, M.L. A herd health approach to dairy cow nutrition and production diseases of the transition cow. Anim. Reprod. Sci. 2006, 96, 331–353. [Google Scholar] [CrossRef]
  6. Kimura, K.; Reinhardt, T.A.; Goff, J.P. Parturition and hypocalcemia blunts calcium signals in immune cells of dairy cattle. J. Dairy Sci. 2006, 89, 2588–2595. [Google Scholar] [CrossRef]
  7. Nyein, H.Y.Y.; Bariya, M.; Kivimäki, L.; Uusitalo, S.; Liaw, T.S.; Jansson, E.; Ahn, C.H.; Hangasky, J.A.; Zhao, J.Q.; Lin, Y.J.; et al. Regional and correlative sweat analysis using high-throughput microfluidic sensing patches toward decoding sweat. Sci. Adv. 2019, 5, eaaw9906. [Google Scholar] [CrossRef]
  8. Hu, J.B.; Stein, A.; Bühlmann, P. Rational design of all-solid-state ion-selective electrodes and reference electrodes. Trac-Trend Anal. Chem. 2016, 76, 102–114. [Google Scholar] [CrossRef]
  9. Lewenstam, A. Routines and Challenges in Clinical Application of Electrochemical Ion-Sensors. Electroanalsis 2014, 26, 1171–1181. [Google Scholar] [CrossRef]
  10. Zuliani, C.; Diamond, D. Opportunities and challenges of using ion-selective electrodes in environmental monitoring and wearable sensors. Electrochim. Acta 2012, 84, 29–34. [Google Scholar] [CrossRef]
  11. Shao, Y.Z.; Ying, Y.B.; Ping, J.F. Recent advances in solid-contact ion-selective electrodes: Functional materials, transduction mechanisms, and development trends. Chem. Soc. Rev. 2020, 49, 4405–4465. [Google Scholar] [CrossRef] [PubMed]
  12. Liu, S.; Yin, T.; Li, Z.; Wang, J. Potentiometric/time resolved chronopotentiometric sensing for an all-solid-state ion-selective electrode based on MXene/MWCNTs as solid contact. Sens. Actuators B Chem. 2024, 405, 135269. [Google Scholar] [CrossRef]
  13. Yu, Y.; Zhu, Q.Y.; Xiang, F.F.; Hu, Y.; Zhang, L.J.; Xu, X.J.; Liu, N.N.; Huang, S.M. Applying AuNPs/SWCNT to fabricate electrical nanogap device for DNA hybridization detection. Carbon 2020, 157, 40–46. [Google Scholar] [CrossRef]
  14. Fouskaki, M.; Chaniotakis, N. Fullerene-based electrochemical buffer layer for ion-selective electrodes. Analyst 2008, 133, 1072–1075. [Google Scholar] [CrossRef]
  15. Wang, S.; Li, L.; Jin, H.L.; Yang, T.; Bao, W.W.; Huang, S.M.; Wang, J.C. Electrochemical detection of hepatitis B and papilloma virus DNAs using SWCNT array coated with gold nanoparticles. Biosens. Bioelectron. 2013, 41, 205–210. [Google Scholar] [CrossRef]
  16. Gao, Y.; Cao, Y.; Yang, D.G.; Luo, X.J.; Tang, Y.M.; Li, H.M. Sensitivity and selectivity determination of bisphenol A using SWCNT-CD conjugate modified glassy carbon electrode. J. Hazard. Mater. 2012, 199, 111–118. [Google Scholar] [CrossRef]
  17. Ping, J.F.; Wang, Y.X.; Ying, Y.B.; Wu, J. Application of Electrochemically Reduced Graphene Oxide on Screen-Printed Ion-Selective Electrode. Anal. Chem. 2012, 84, 3473–3479. [Google Scholar] [CrossRef]
  18. Rizwan, M.; Elma, S.; Lim, S.A.; Ahmed, M.U. AuNPs/CNOs/SWCNTs/chitosan-nanocomposite modified electrochemical sensor for the label-free detection of carcinoembryonic antigen. Biosens. Bioelectron. 2018, 107, 211–217. [Google Scholar] [CrossRef]
  19. Crespo, G.A.; Macho, S.; Bobacka, J.; Rius, F.X. Transduction Mechanism of Carbon Nanotubes in Solid-Contact Ion-Selective Electrodes. Anal. Chem. 2009, 81, 676–681. [Google Scholar] [CrossRef]
  20. Gao, Y.S.; Zhu, X.F.; Xu, J.K.; Lu, L.M.; Wang, W.M.; Yang, T.T.; Xing, H.K.; Yu, Y.F. Label-free electrochemical immunosensor based on Nile blue A-reduced graphene oxide nanocomposites for carcinoembryonic antigen detection. Anal. Biochem. 2016, 500, 80–87. [Google Scholar] [CrossRef]
  21. Lim, S.A.; Yoshikawa, H.; Tamiya, E.; Yasin, H.M.; Ahmed, M.U. A highly sensitive gold nanoparticle bioprobe based electrochemical immunosensor using screen printed graphene biochip. RSC Adv. 2014, 4, 58460–58466. [Google Scholar] [CrossRef]
  22. Guo, S.; Wang, E. Synthesis and electrochemical applications of gold nanoparticles. Anal. Chim. Acta 2007, 598, 181–192. [Google Scholar] [CrossRef]
  23. Curulli, A.; Bianchini, C.; Zane, D. Electrochemical Sensing Platform Based on Single-Walled Carbon Nanotubes (SWCNTs)/Gold Nanoparticles (AuNps) Nanocomposite. Electrocatalsis 2012, 3, 30–38. [Google Scholar] [CrossRef]
  24. Eder, D. Carbon nanotube-inorganic hybrids. Chem. Rev. 2010, 110, 1348–1385. [Google Scholar] [CrossRef]
  25. Zhu, J.W.; Li, X.; Qin, Y.; Zhang, Y.H. Single-piece solid-contact ion-selective electrodes with polymer-carbon nanotube composites. Sens. Actuat B-Chem. 2010, 148, 166–172. [Google Scholar] [CrossRef]
  26. Ping, J.F.; Wang, Y.X.; Fan, K.; Wu, J.; Ying, Y.B. Direct electrochemical reduction of graphene oxide on ionic liquid doped screen-printed electrode and its electrochemical biosensing application. Biosens. Bioelectron. 2011, 28, 204–209. [Google Scholar] [CrossRef] [PubMed]
  27. Li, M.; Li, D.W.; Xiu, G.L.; Long, Y.T. Applications of screen-printed electrodes in current environmental analysis. Curr. Opin. Electrochem. 2017, 3, 137–143. [Google Scholar] [CrossRef]
  28. Schwarz, J.; Trommer, K.; Gerlach, F.; Mertig, M. All-solid-state screen-printed sensors for potentiometric calcium (II) determinations in environmental samples. Am. J. Anal. Chem. 2018, 9, 113–123. [Google Scholar] [CrossRef]
  29. Silva, L.R.; Rodrigues, J.G.; Franco, J.P.; Santos, L.P.; D’Elia, E.; Romão, W.; Ferreira, R.D.Q. Development of a portable electroanalytical method using nickel modified screen-printed carbon electrode for ethinylestradiol determination in organic fertilizers. Ecotoxicol. Environ. Saf. 2021, 208, 111430. [Google Scholar] [CrossRef]
  30. Andreescu, S.; Noguer, T.; Magearu, V.; Marty, J.-L. Screen-printed electrode based on AChE for the detection of pesticides in presence of organic solvents. Talanta 2002, 57, 169–176. [Google Scholar] [CrossRef]
  31. Piermarini, S.; Migliorelli, D.; Volpe, G.; Massoud, R.; Pierantozzi, A.; Cortese, C.; Palleschi, G. Uricase biosensor based on a screen-printed electrode modified with Prussian blue for detection of uric acid in human blood serum. Sens. Actuat B-Chem. 2013, 179, 170–174. [Google Scholar] [CrossRef]
  32. Gören, A.; Mendes, J.; Rodrigues, H.M.; Sousa, R.E.; Oliveira, J.; Hilliou, L.; Costa, C.M.; Silva, M.M.; Lanceros-Méndez, S. High performance screen-printed electrodes prepared by a green solvent approach for lithium-ion batteries. J. Power Sources 2016, 334, 65–77. [Google Scholar] [CrossRef]
  33. Kim, J.; Duraisamy, N.; Lee, T.M.; Kim, I.; Choi, K.H. Screen printed silver top electrode for efficient inverted organic solar cells. Mater. Res. Bull. 2015, 70, 412–415. [Google Scholar] [CrossRef]
  34. Thakur, B.; Bernalte, E.; Smith, J.P.; Foster, C.W.; Linton, P.E.; Sawant, S.N.; Banks, C.E. Utilising copper screen-printed electrodes (CuSPE) for the electroanalytical sensing of sulfide. Analyst 2016, 141, 1233–1238. [Google Scholar] [CrossRef] [PubMed]
  35. Viet, N.X.; Ukita, Y.; Chikae, M.; Ohno, Y.; Maehashi, K.; Matsumoto, K.; Viet, P.H.; Takamura, Y. Fabrication of new single-walled carbon nanotubes microelectrode for electrochemical sensors application. Talanta 2012, 91, 88–94. [Google Scholar] [CrossRef] [PubMed]
  36. Zhao, Y.L.; Zhang, H.Y.; Li, Y.; Wang, X.A.; Zhao, L.; Xu, J.H.; Zhan, Z.K.; Zhang, G.L.; Li, W.J. Glycated Hemoglobin Electrochemical Immunosensor Based on Screen-Printed Electrode. Biosensors 2022, 12, 902. [Google Scholar] [CrossRef]
  37. Shokry, A.; Karim, M.; Khalil, M.; Ebrahim, S.; El Nady, J. Supercapacitor based on polymeric binary composite of polythiophene and single-walled carbon nanotubes. Sci. Rep. 2022, 12, 11278. [Google Scholar] [CrossRef]
  38. Li, T.; Zhu, W.; Shen, R.; Wang, H.Y.; Chen, W.; Hao, S.J.; Li, Y.X.; Gu, Z.G.; Li, Z.J. Three-dimensional conductive porous organic polymers based on tetrahedral polythiophene for high-performance supercapacitors. New J. Chem. 2018, 42, 6247–6255. [Google Scholar] [CrossRef]
  39. Joksovic, S.; Kundacina, I.; Milosevic, I.; Stanojev, J.; Radonic, V.; Bajac, B. Single-Walled Carbon Nanotube-Modified Gold Leaf Immunosensor for Detection. ACS Omega 2024, 9, 22277–22284. [Google Scholar] [CrossRef]
  40. Jorio, A.; Pimenta, M.A.; Souza, A.G.; Saito, R.; Dresselhaus, G.; Dresselhaus, M.S. Characterizing carbon nanotube samples with resonance Raman scattering. New J. Phys. 2003, 5, 139. [Google Scholar] [CrossRef]
  41. Araujo, P.T.; Terrones, M.; Dresselhaus, M.S. Defects and impurities in graphene- like materials. Mater. Today 2012, 15, 98–109. [Google Scholar] [CrossRef]
  42. Maluta, J.R.; Canevari, T.C.; Machado, S.A.S. Sensitive determination of nitric oxide using an electrochemical sensor based on MWCNTs decorated with spherical Au nanoparticles. J. Solid. State Electr. 2014, 18, 2497–2504. [Google Scholar] [CrossRef]
  43. Ondera, T.J.; Hamme, A.T. A gold nanopopcorn attached single-walled carbon nanotube hybrid for rapid detection and killing of bacteria. J. Mater. Chem. B 2014, 2, 7534–7543. [Google Scholar] [CrossRef] [PubMed]
  44. Fibbioli, M.; Morf, W.E.; Badertscher, M.; de Rooij, N.F.; Pretsch, E. Potential drifts of solid-contacted ion-selective electrodes due to zero-current ion fluxes through the sensor membrane. Electroanalsis 2000, 12, 1286–1292. [Google Scholar] [CrossRef]
  45. Michalska, A.; Dumańska, J.; Maksymiuk, K. Lowering the detection limit of ion-selective plastic membrane electrodes with conducting polymer solid contact and conducting polymer potentiometric sensors. Anal. Chem. 2003, 75, 4964–4974. [Google Scholar] [CrossRef]
  46. Hernández, R.; Riu, J.; Rius, F.X. Determination of calcium ion in sap using carbon nanotube-based ion-selective electrodes. Analyst 2010, 135, 1979–1985. [Google Scholar] [CrossRef]
  47. Ping, J.F.; Wang, Y.X.; Wu, J.; Ying, Y.B. Development of an all-solid-state potassium ion-selective electrode using graphene as the solid-contact transducer. Electrochem. Commun. 2011, 13, 1529–1532. [Google Scholar] [CrossRef]
  48. Bobacka, J. Potential stability of all-solid-state ion-selective electrodes using conducting polymers as ion-to-electron transducers. Anal. Chem. 1999, 71, 4932–4937. [Google Scholar] [CrossRef]
  49. Vaughan-Jones, R.D.; Kaila, K. The sensitivity of liquid sensor, ion-selective microelectrodes to changes in temperature and solution level. Pflügers Arch. 1986, 406, 641–644. [Google Scholar] [CrossRef]
  50. Huang, Z.-Q. The Introduction of Electrolyte Solution Theory; Science Press in Beijing: Beijing, China, 1983. [Google Scholar]
  51. Zhang, L.; Zhang, M.; Sheng, M. Development of a Multi-Channel Soil Macronutrient Detection System Using Ion-Selective Electrode; American Society of Agricultural and Biological Engineers: St. Joseph, MI, USA, 2012; p. 1. [Google Scholar]
  52. Zeng, X.; Qin, W. A solid-contact potassium-selective electrode with MoO2 microspheres as ion-to-electron transducer. Anal. Chim. Acta 2017, 982, 72–77. [Google Scholar] [CrossRef]
  53. Hu, J.B.; Zou, X.U.; Stein, A.; Bühlmann, P. Ion-Selective Electrodes with Colloid-Imprinted Mesoporous Carbon as Solid Contact. Anal. Chem. 2014, 86, 7111–7118. [Google Scholar] [CrossRef] [PubMed]
  54. Jansod, S.; Cherubini, T.; Soda, Y.; Bakker, E. Optical Sensing with a Potentiometric Sensing Array by Prussian Blue Film Integrated Closed Bipolar Electrodes. Anal. Chem. 2020, 92, 9138–9145. [Google Scholar] [CrossRef] [PubMed]
  55. Teekayupak, K.; Lomae, A.; Agir, I.; Chuaypen, N.; Dissayabutra, T.; Henry, C.S.; Chailapakul, O.; Ozer, T.; Ruecha, N. Large-scale fabrication of ion-selective electrodes for simultaneous detection of Na+, K+, and Ca2+ in biofluids using a smartphone-based potentiometric sensing platform. Microchim. Acta 2023, 190, 237. [Google Scholar] [CrossRef] [PubMed]
  56. Yin, T.; Yu, H.; Ding, J.; Qin, W. An integrated screen-printed potentiometric strip for determination of Ca2+ in seawater. J. Electrochem. Soc. 2019, 166, B589. [Google Scholar] [CrossRef]
Figure 1. The preparation process of SPE/SWCNTs/AuNPs/Ca-ISM.
Chemosensors 13 00252 g001
Figure 2. SEM images of bare SPE (A), SPE/SWCNTs (B), SPE/SWCNTs/AuNPs (C), and SPE/SWCNTs/AuNPs/Ca-ISM (D).
Chemosensors 13 00252 g002
Figure 3. (A) CV of SPE, SPE/SWCNTs, and SPE/SWCNTs/AuNPs at a scanning rate of 100 mV/s under the conditions of 5.0 mM [Fe(CN)6]4−/3− and 0.1 M KCl. (B) EIS of SPE, SPE/SWCNTs, and SPE/SWCNTs/AuNPs in 5.0 mM [Fe(CN)6]4−/3− and 0.1 M KCl solutions at 100 kHz–0.1 Hz (potential = 0.2 V).
Chemosensors 13 00252 g003
Figure 4. Raman spectra of SPE, SPE/SWCNTs, and SPE/SWCNTs/AuNPs at 532 nm.
Chemosensors 13 00252 g004
Figure 5. Water layer testing of SPE/Ca-ISM, SPE/SWCNTs/Ca-ISM, and SPE/SWCNTs/AuNPs/Ca-ISM electrodes. The electrode potentials were measured successively at 10−2 M CaCl2, 10−2 M NaCl, and 10−2 M CaCl2 for 60 min.
Chemosensors 13 00252 g005
Figure 6. Chronopotentiograms of SPE/Ca-ISM, SPE/SWCNTs/Ca-ISM, and SPE/SWCNTs/AuNPs/Ca-ISM after applying a constant current of ±1 nA to the electrode in a 10−2 M CaCl2 solution for 60 s, respectively.
Chemosensors 13 00252 g006
Figure 7. (A) Electrode potential response to Ca2+ concentration and (B) the corresponding calibration curve.
Chemosensors 13 00252 g007
Figure 8. Potential comparison of Ca-ISE at different temperatures (5, 10, 15, 20, 25, 30, 35, 40, and 45 °C) and concentrations (10−6, 10−5, 10−4, 10−3, 10−2, and 10−1 M).
Chemosensors 13 00252 g008
Figure 9. (A) the structure of the artificial neural network and (B) the calculated real and predicted values.
Chemosensors 13 00252 g009
Figure 10. (A) The impact of various light conditions (black line), O2 (blue line), and CO2 (red line) on the potential stability of SPE/SWCNTs/AuNPs/Ca-ISM in a 10−2 M CaCl2. (B) Stability of the SPE/SWCNTs/AuNPs/Ca-ISM.
Chemosensors 13 00252 g010
Table 1. Linear regression equations and R2 values of Ca-ISE at different temperatures.
Temperature (°C)EquationR2
5y = 0.0209x + 0.15750.9654
10y = 0.0195x + 0.16850.9776
15y = 0.0219x + 0.16030.9928
20y = 0.0205x + 0.16710.963
25y = 0.023x + 0.17570.9806
30y = 0.023x + 0.19440.9895
35y = 0.0218x + 0.16550.9971
40y = 0.0184x + 0.13870.9959
45y = 0.0207x + 0.14750.9942
Table 2. Performance comparison of SPE/SWCNTs/AuNPs/Ca-ISM with other sensors.
SensorLinear Range
(M)
Response Time
(s)
Detection Limit
(M)
Slope
(mV/Decade)
Storage Time
(d)
Ref.
Ca/SWCNT/ISM10−5~10−2.5-10−6.228.721[46]
Ca-BPE10−4~10−2--29.6 ± 0.630[54]
Ca2+-ISE10−4~10−11010−528.7 ± 0.230[55]
SPE-II/Ca2+-ISE10−5~10−1-10−626.7 ±1.3-[56]
SPE/ERGNO/Ca-ISM10−5.6~10−1.61010−5.829.190[17]
SPE/SWCNTs/AuNPs/Ca-ISM10−5.5~10−11510−5.530 ± 0.330This work
Table 3. Detection of Ca2+ in blood samples from dairy cows (n = 3).
No.Added (mM)Found (mM)Recovery (%)RSD (%)
1-1.23-3.3
20.101.35101.502.9
30.201.4198.603.5
40.301.4896.732.7
50.401.5494.482.2
Disclaimer/Publisher’s Note: The statements, opinions and data contained in all publications are solely those of the individual author(s) and contributor(s) and not of MDPI and/or the editor(s). MDPI and/or the editor(s) disclaim responsibility for any injury to people or property resulting from any ideas, methods, instructions or products referred to in the content.

