Abstract
In this work, a glassy carbon electrode (GCE) modified with reduced graphene oxide and β-cyclodextrin (rGO/β-CD) nanocomposite was developed for the electrochemical detection of nitrofurantoin (NFT). The structural and morphological characteristics of the synthesized nanocomposite were determined using scanning electron microscopy (SEM), Raman spectroscopy, X-ray diffraction (XRD), and X-ray photoelectron spectroscopy (XPS). Moreover, the electrochemical behavior of the modified electrodes was thoroughly examined using cyclic voltammetry (CV) and electrochemical impedance spectroscopy (EIS), with the rGO/β-CD-modified glassy carbon electrode (GCE) demonstrating superior electron transfer capability. Key experimental parameters, including scan rate, material loading, and solution pH, were systematically optimized. After optimizing the experimental conditions, the modified sensor showed excellent electrocatalytic performance and selectivity toward NFT, achieving a broad linear detection range from 0.5 to 120 μM, a low limit of detection (LOD) of 0.048 μM, and a high sensitivity of 12.1 µA µM–1 cm–2 using differential pulse voltammetry (DPV). Furthermore, the fabricated electrode exhibited good anti-interference ability, stability, precision, and real-time applicability for NFT detection in a wastewater sample. These results highlight the potential of the rGO/β-CD nanocomposite as a high-performance platform for electrochemical sensing applications.
1. Introduction
Nitrofurantoin (NFT) is a broad-spectrum antibiotic from the nitrofuran family that is widely used to treat Escherichia coli and Enterococcus-induced urinary tract infections (UTIs) [1,2]. Its effectiveness against Gram-negative as well as Gram-positive bacteria also makes it valuable in livestock and poultry farming for preventing infections and promoting growth [3]. However, excessive use of NFT can cause a range of adverse health effects, including mild symptoms such as headache, drowsiness, nausea, vomiting, loss of appetite, and numbness, but in more severe cases, it may be associated with carcinogenicity, teratogenesis, hepatotoxicity, and mutagenicity [4,5]. NFT is still prescribed for UTIs in pregnant women in some countries despite its potential to induce hemolytic anemia in newborns by damaging fetal red blood cells [6]. However, stringent bans on the drug have been implemented across numerous countries and territories, including the European Union, the United States, and several Asian nations [7,8]. Nevertheless, due to its potent efficacy and affordability, illegal usage persists, particularly in veterinary applications and livestock production, leading to residues in food products [8]. Therefore, developing rapid and sensitive methods for NFT detection is vital in public health monitoring to ensure food safety and environmental protection.
Several analytical techniques have been used for the detection and quantification of NFT, including mass spectrometric detection [9], molecular luminescence [10], spectrophotometry [11], and high-performance liquid chromatography (HPLC) with spectrophotometric detection [12]. Although these methods are effective for NFT quantification, they typically require extensive sample preparation and depend on complex, expensive instrumentation. In contrast, electrochemical methods offer significant advantages, such as simpler and more cost-effective equipment, the ease of miniaturization and portability, and minimal sample pretreatment requirements [13,14,15].
Graphene, a two-dimensional (2D) material composed of a single layer of carbon atoms arranged in a compact honeycomb-like lattice, has attracted significant attention since its discovery in 2004 [16,17]. Its unique nanostructure imparts exceptional characteristics, including an ultrahigh surface area (~2630 m2 g−1), outstanding electrical conductivity, superior electron mobility at room temperature, remarkable mechanical strength, and high thermal conductivity (>3000 W m−1 K−1) [18,19,20]. These characteristics make it a highly promising material for various applications, including nanoelectronics [21], energy storage devices (such as capacitors) [22], advanced nanocomposites [23], transparent conductive films [24], and sensors and biosensors [25,26]. However, graphene has a tendency to form agglomerates due to van der Waals interactions and strong π–π stacking. This leads to poor dispersibility and low solubility in water, limiting its use in further applications [27]. To address this challenge, extensive research has been dedicated to enhancing graphene’s properties by introducing functional groups through covalent or noncovalent modifications.
β-Cyclodextrin (β-CD) is a cyclic oligosaccharide made up of seven glucose units. Because of its effective film-forming ability and inclusion properties, β-CD has been extensively applied as a dispersing agent for insoluble substances and nanomaterials [28,29]. Its toroidal cavities enable it to host a variety of molecules, making it suitable for the noncovalent functionalization of graphene in nanocomposite production [20,30]. Although β-CD is water-soluble, the hydrophilic and planar characteristics of graphene oxide (GO) can be partially retained after reduction, allowing effective immobilization of β-CD molecules on the rGO surface [31]. Furthermore, the presence of oxygen-containing functional groups such as hydroxyl, epoxide, carbonyl, and carboxyl in GO and partially reduced GO enhances its surface wettability, which promotes strong physical adsorption and interaction with the hydrophilic exterior of β-CD. These interactions collectively contribute to the formation of a stable and uniform rGO/β-CD film on the glassy carbon electrode surface [32]. Therefore, the synergistic combination of cyclodextrins (CDs) and graphene nanomaterials (GNs) integrates GN’s exceptional conductivity and excellent surface area with CD’s molecular recognition capabilities, enabling advanced applications across optoelectronics, electrocatalysis, sensing, and electronic devices [20,28,30,33,34,35].
In this study, we synthesized reduced graphene oxide/β-cyclodextrin (rGO/β-CD) for the sensitive detection of NFT. The as-prepared rGO/β-CD nanocomposite was comprehensively characterized using Raman spectroscopy, X-ray diffraction (XRD), X-ray photoelectron spectroscopy (XPS), and scanning electron microscopy (SEM). Finally, the electrochemical performance of the rGO/β-CD-modified glassy carbon electrode (rGO/β-CD/GCE) was evaluated for its NFT detection ability using cyclic voltammetry (CV), electrochemical impedance spectroscopy (EIS), and differential pulse voltammetry (DPV). The results showed that the modified rGO/β-CD/GCE had improved electrochemical activity to NFT at pH 7 (0.1 M PBS) compared to that of rGO and bare electrodes, showcasing its potential in antibiotic detection.
2. Materials and Methods
2.1. Materials
Graphite powder, β-cyclodextrin (β-CD), ammonia solution (25–28 wt.%), hydrazine hydrate (50 wt.%), NFT, and all other reagents were of analytical grade and used without any further purification. Phosphate buffer solution (PBS, 0.1 M, pH 5–9) was prepared by dissolving Na2HPO4 and NaH2PO4 in Millipore water, followed by pH adjustment using 0.1 M HCl or NaOH. All solutions were prepared using Millipore water.
2.2. Instruments
Various techniques were employed to characterize the synthesized rGO/β-CD nanocomposite. X-ray diffraction (XRD, Rigaku MiniFlex600, Rigaku Corporation, Tokyo, Japan) was used to analyze the crystal structure, while X-ray photoelectron spectroscopy (XPS, K-Alpha, Thermo Fisher Scientific, Waltham, MA, USA) confirmed the elemental composition and chemical states, particularly of carbon and oxygen. The surface morphology and microstructure were examined using scanning electron microscopy (SEM, ZEISS Sigma 500, Carl Zeiss, Oberkochen, Germany). Electrochemical measurements were performed using a (CHI 770E electrochemical workstation, CH Instruments, Bee Cave, TX, USA) in a standard three-electrode configuration, consisting of a platinum wire as the counter electrode, Ag/AgCl as the reference electrode, and a GCE as the working electrode.
2.3. Synthesis of rGO/β-CD Nanocomposite
Graphene oxide (GO) was synthesized from graphite powder using a previously reported modified Hummers’ method [36]. For the synthesis of the β-CD/rGO nanohybrid, 20 mg of GO was initially dispersed in 20 mL of deionized water via sonication. Subsequently, 1 g of β-CD was introduced to the GO dispersion under vigorous stirring for 2 h. Afterward, 1 mL of ammonia solution and 600 μL of hydrazine hydrate were introduced into the mixture. The resulting solution was heated to 90 °C with continuous stirring at 1500 rpm for 4 h. The resulting black precipitate was collected by centrifugation at 13,000 rpm for 30 min at 4 °C, washed three times with deionized water, and dried overnight at 70 °C (Scheme 1). For comparative tests, rGO was synthesized under the same conditions but without the addition of β-CD.
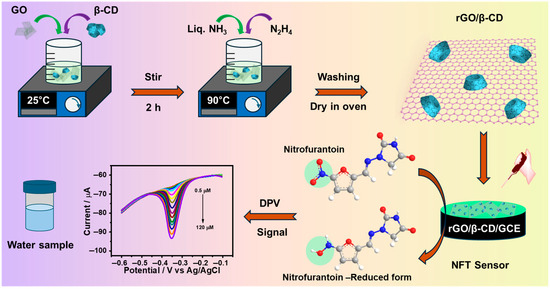
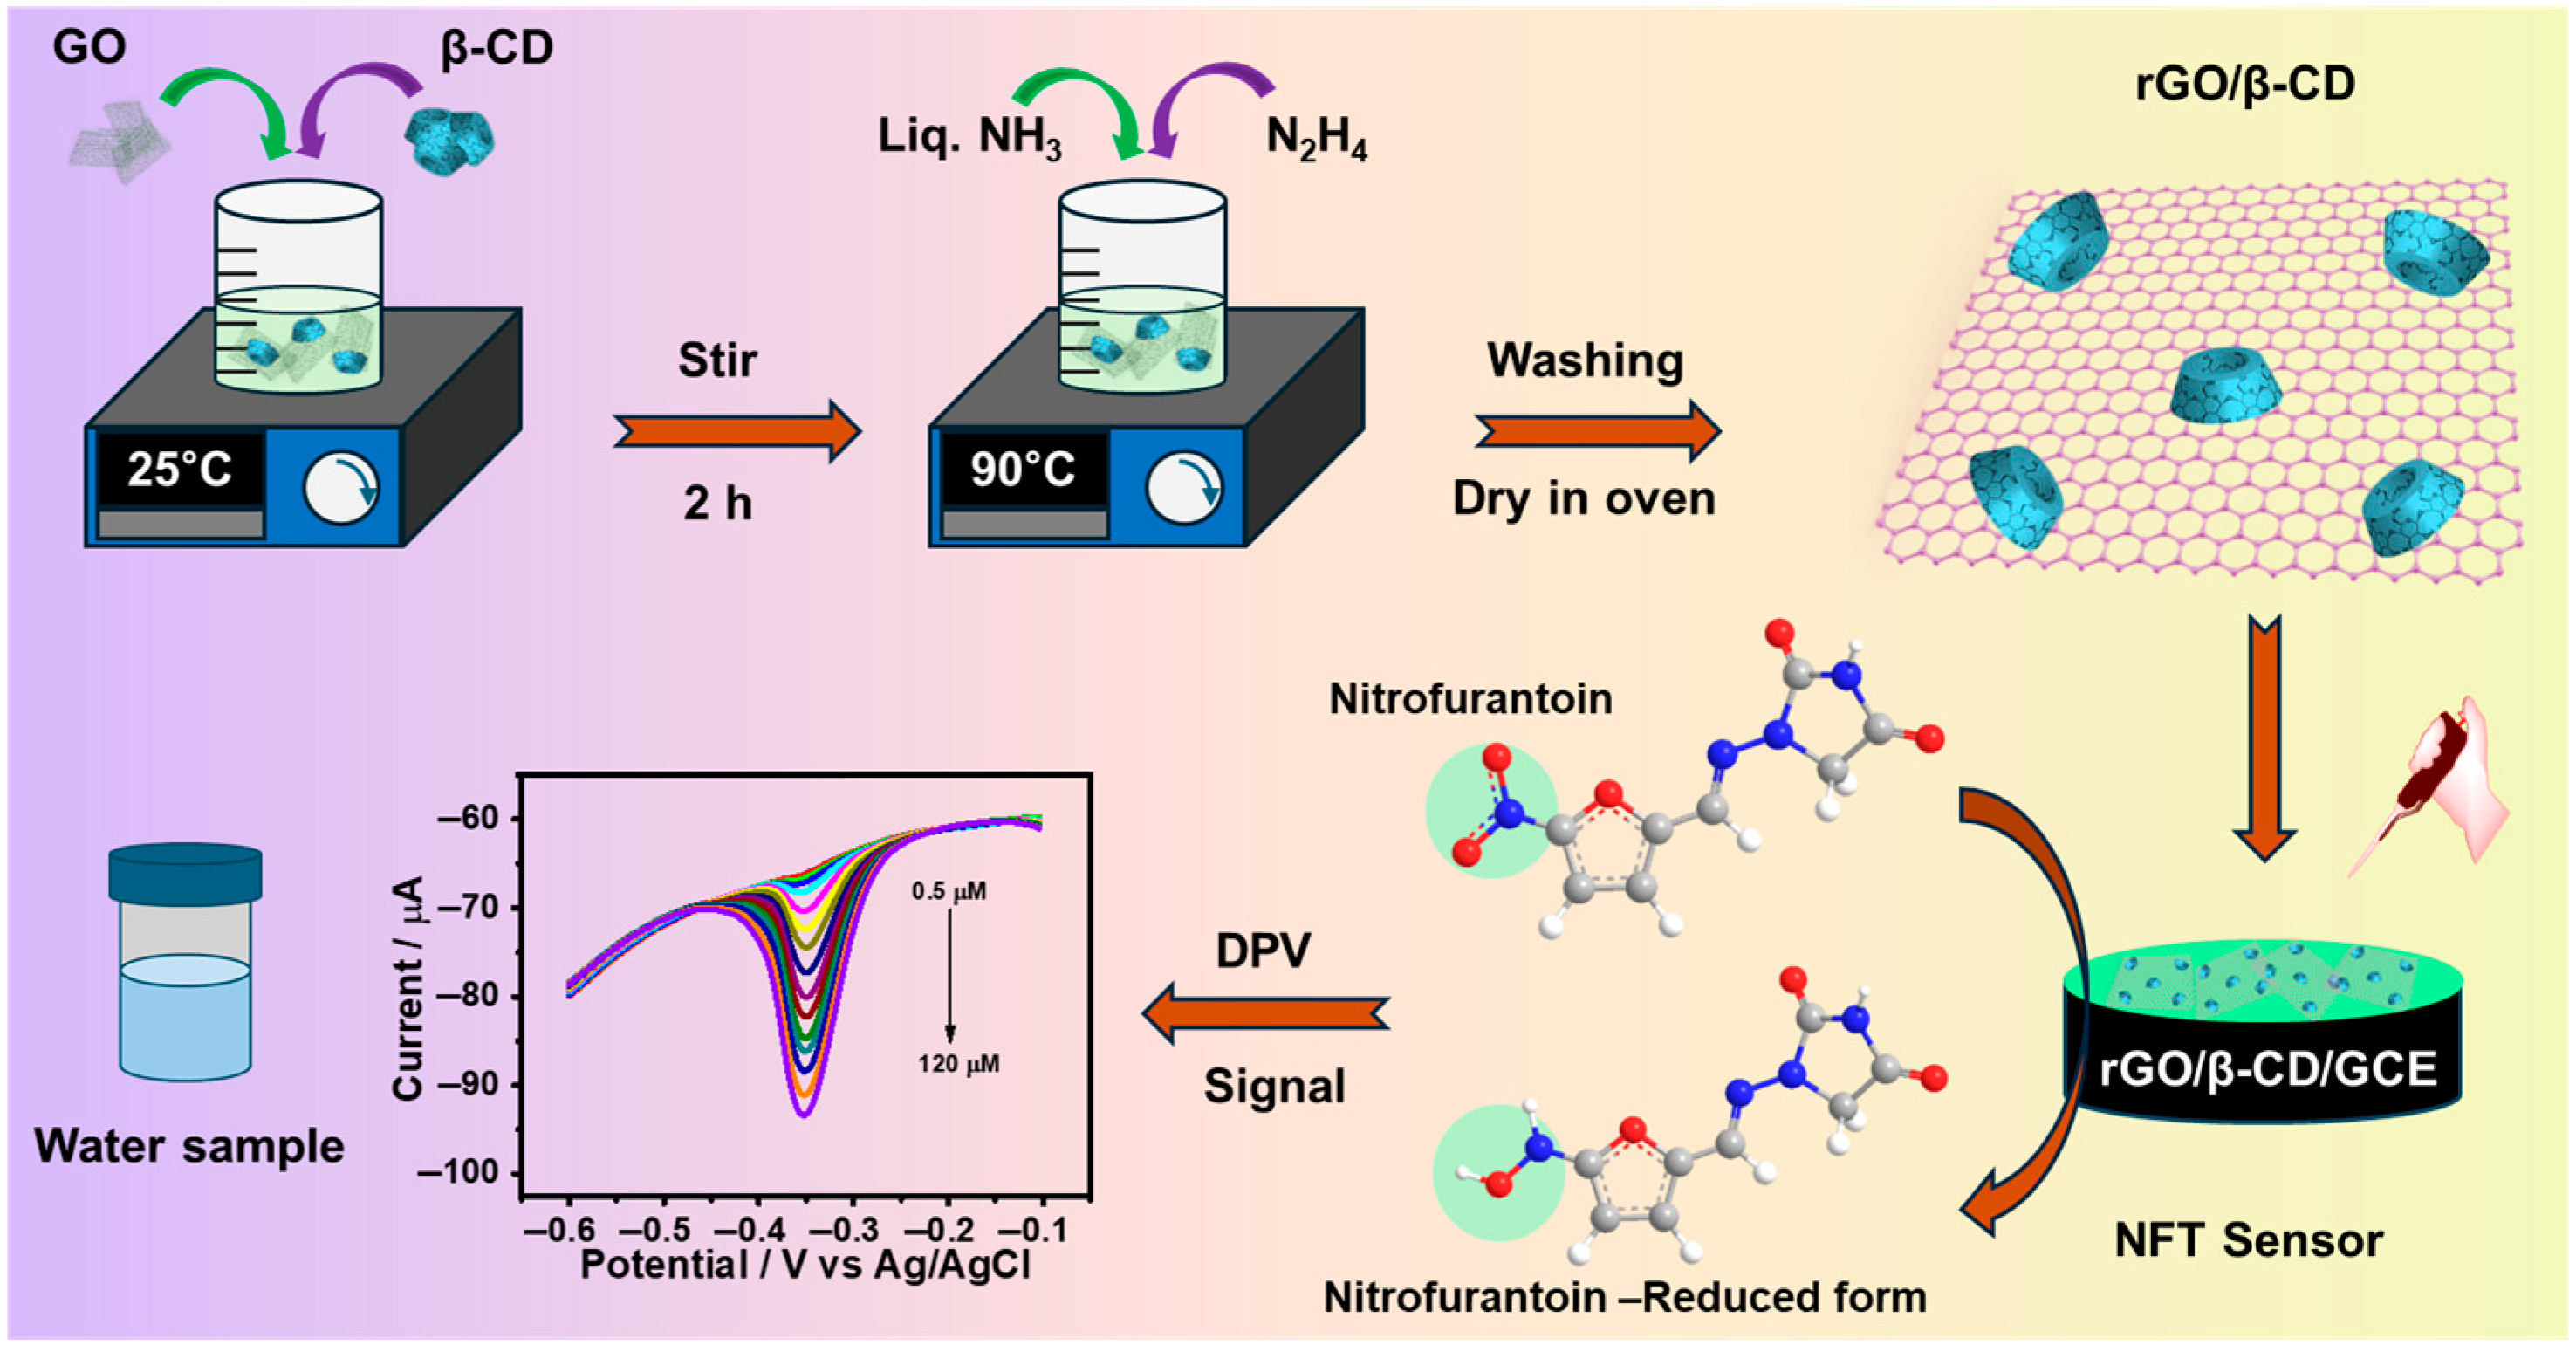
Scheme 1.
Schematic illustration of the synthesis of the rGO/β-CD nanocomposite and its application in the electrochemical detection of NFT.
2.4. Fabrication of a rGO/β-CD/GCE Modified Electrode
Firstly, the bare glassy carbon electrode (GCE, diameter: 3 mm) was polished stepwise with alumina slurry of decreasing particle sizes (1.0, 0.3, and 0.05 μm), followed by thorough cleaning with ethanol and ultrapure water under ultrasonic agitation. The electrode was then air-dried at room temperature. Next, a dispersion of rGO/β-CD was prepared by ultrasonically dispersing 1 mg of rGO/β-CD nanocomposite in 1 mL of water. Finally, 6 μL of the prepared dispersion was carefully drop-cast onto the cleaned GCE surface and allowed to dry naturally at room temperature; the resulting rGO/β-CD-modified GCE (rGO/β-CD/GCE) was then ready for subsequent electrochemical experiments.
3. Results and Discussion
3.1. Physical Characterization of the rGO/β-CD Nanocomposite
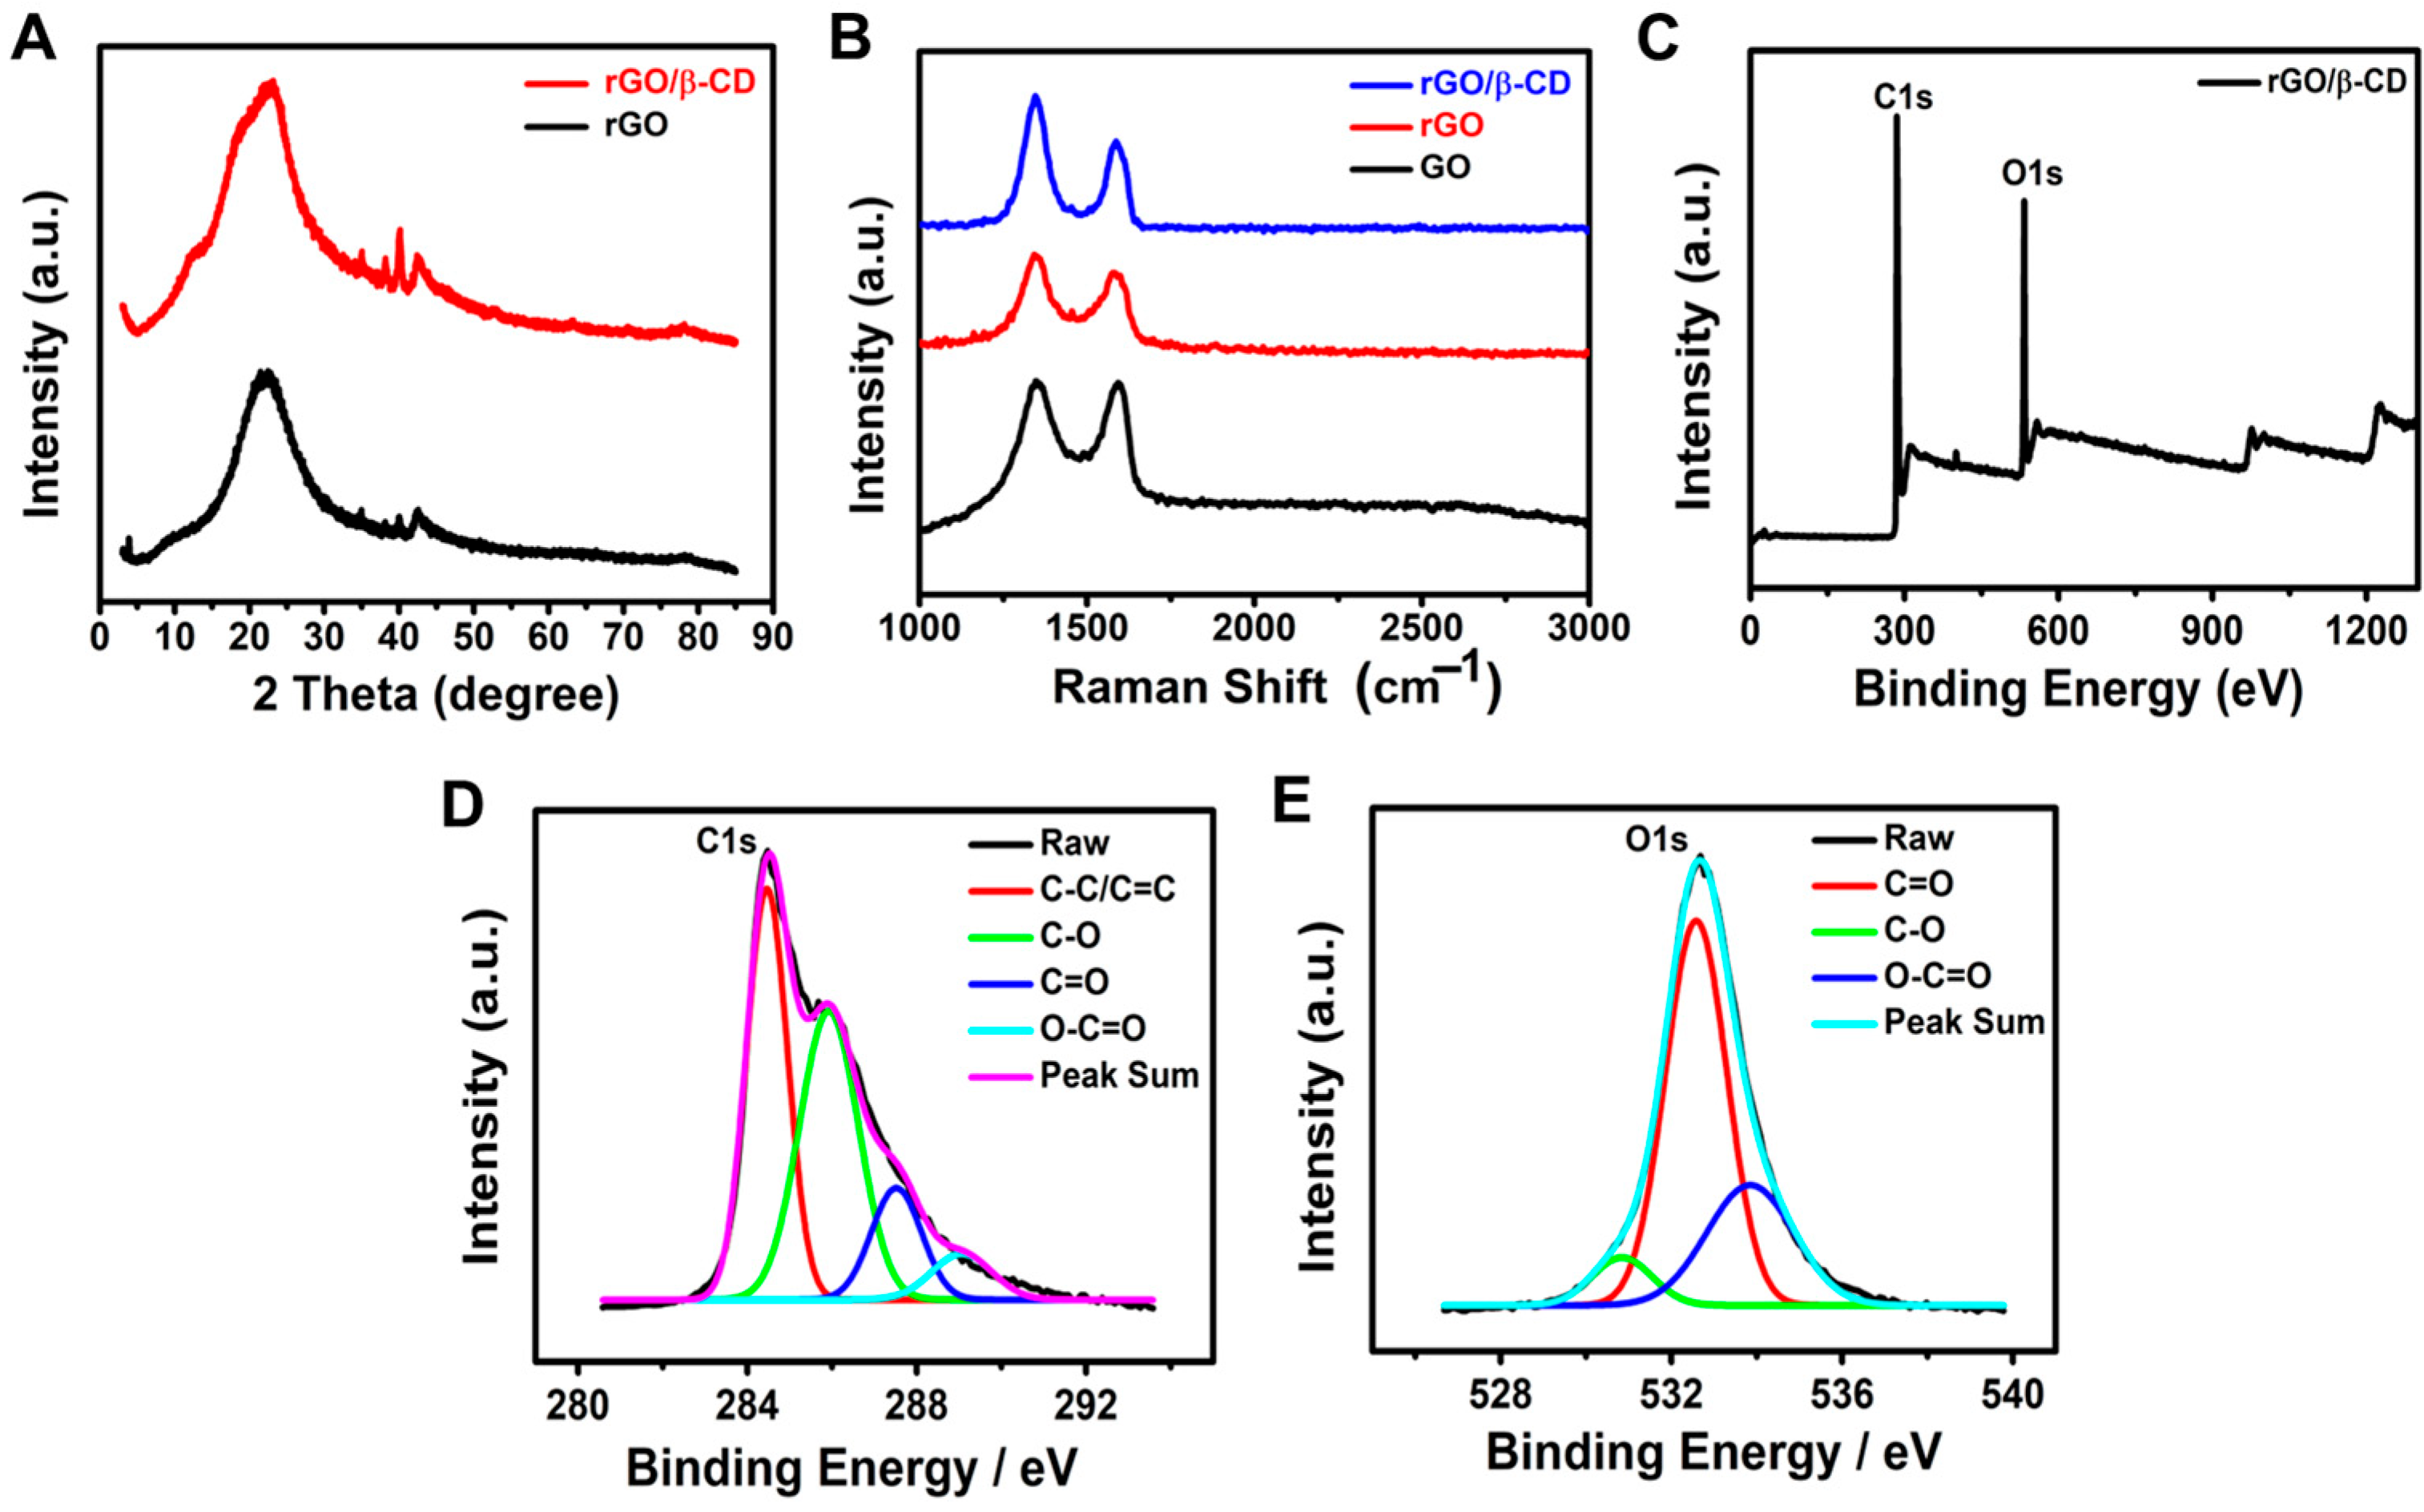
X-ray diffraction (XRD) analysis was performed to investigate the crystalline structure and phase evolution of the synthesized materials. As shown in Figure 1A, the XRD pattern of rGO displayed two characteristic peaks at 2θ = 22.82° and 42.54°, corresponding to the (002) and (100) planes, respectively. These peaks indicate the successful reduction of GO and partial restoration of its graphitic structure [37]. Upon modification with β-CD, the rGO/β-CD composite exhibited similar peaks at 2θ = 22.96° and 42.42°, along with the appearance of a new diffraction peak at 2θ = 40.14°. This additional peak may suggest the effective incorporation of β-CD onto the rGO surface and possible interactions between the rGO sheets and β-CD molecules. No significant shift in the (002) and (100) peaks was observed, confirming the successful synthesis of the rGO/β-CD composite without the alteration of the crystalline structure of pristine rGO [38,39,40,41,42].

Figure 1.
(A) XRD patterns of rGO, β-CD, and rGO/β-CD nanocomposite; (B) Raman spectra; (C–E) XPS analysis of rGO/β-CD: (C) full survey and high-resolution spectra of (D) C 1s and (E) O 1s.
Raman spectroscopy, a widely used technique for identifying structural defects in graphene-based materials [43], was employed to characterize GO, rGO, and the rGO/β-CD nanocomposite (Figure 1B). All samples exhibited two prominent peaks: the D band (~1350 cm−1), associated with the vibrational modes of disordered or sp3-hybridized carbon atoms, and the G band (~1580 cm−1), corresponding to the in-plane vibrations of sp2-hybridized carbon atoms. The intensity ratio of these bands (I_D/I_G) serves as a key indicator of defect density and graphitization degree [44]. The I_D/I_G ratio increased from 1.01 for GO to 1.17 for rGO, indicating an increase in structural defects and a reduction in the size of sp2 domains upon reduction. When β-CD was introduced, the I_D/I_G ratio further increased to 1.46, suggesting additional defects were introduced by β-CD, potentially due to surface functionalization on both sides of the graphene sheets [38,45]. These observations are consistent with previous studies that highlighted the role of β-CD in modifying the structure of graphene oxide.
X-ray photoelectron spectroscopy (XPS) was used to confirm the successful synthesis and functionalization of the rGO/β-CD nanocomposite by providing elemental and bonding information. The wide-scan survey spectrum (Figure 1C) showed prominent C 1s and O1s peaks, indicating that the material was primarily composed of carbon and oxygen. The deconvoluted C1s spectrum (Figure 1D) exhibited peaks at 284.4 eV (C–C/C=C), representing the restored sp2 carbon framework, and at 285.9, 287.5, and 289.1 eV, corresponding to C–O, C=O, and O–C=O groups, respectively [46]. These oxygen-containing groups arise from both residual oxygen from GO and the hydroxyl/carboxyl functionalities introduced by β-CD. Similarly, the O 1s spectrum (Figure 1E) showed peaks at 530.8 eV (C=O), 532.6 eV (C–O), and 533.8 eV (O–C=O), further confirming the coexistence of multiple oxygen functionalities [47]. These XPS results confirm the successful attachment of β-CD molecules onto the rGO surface.
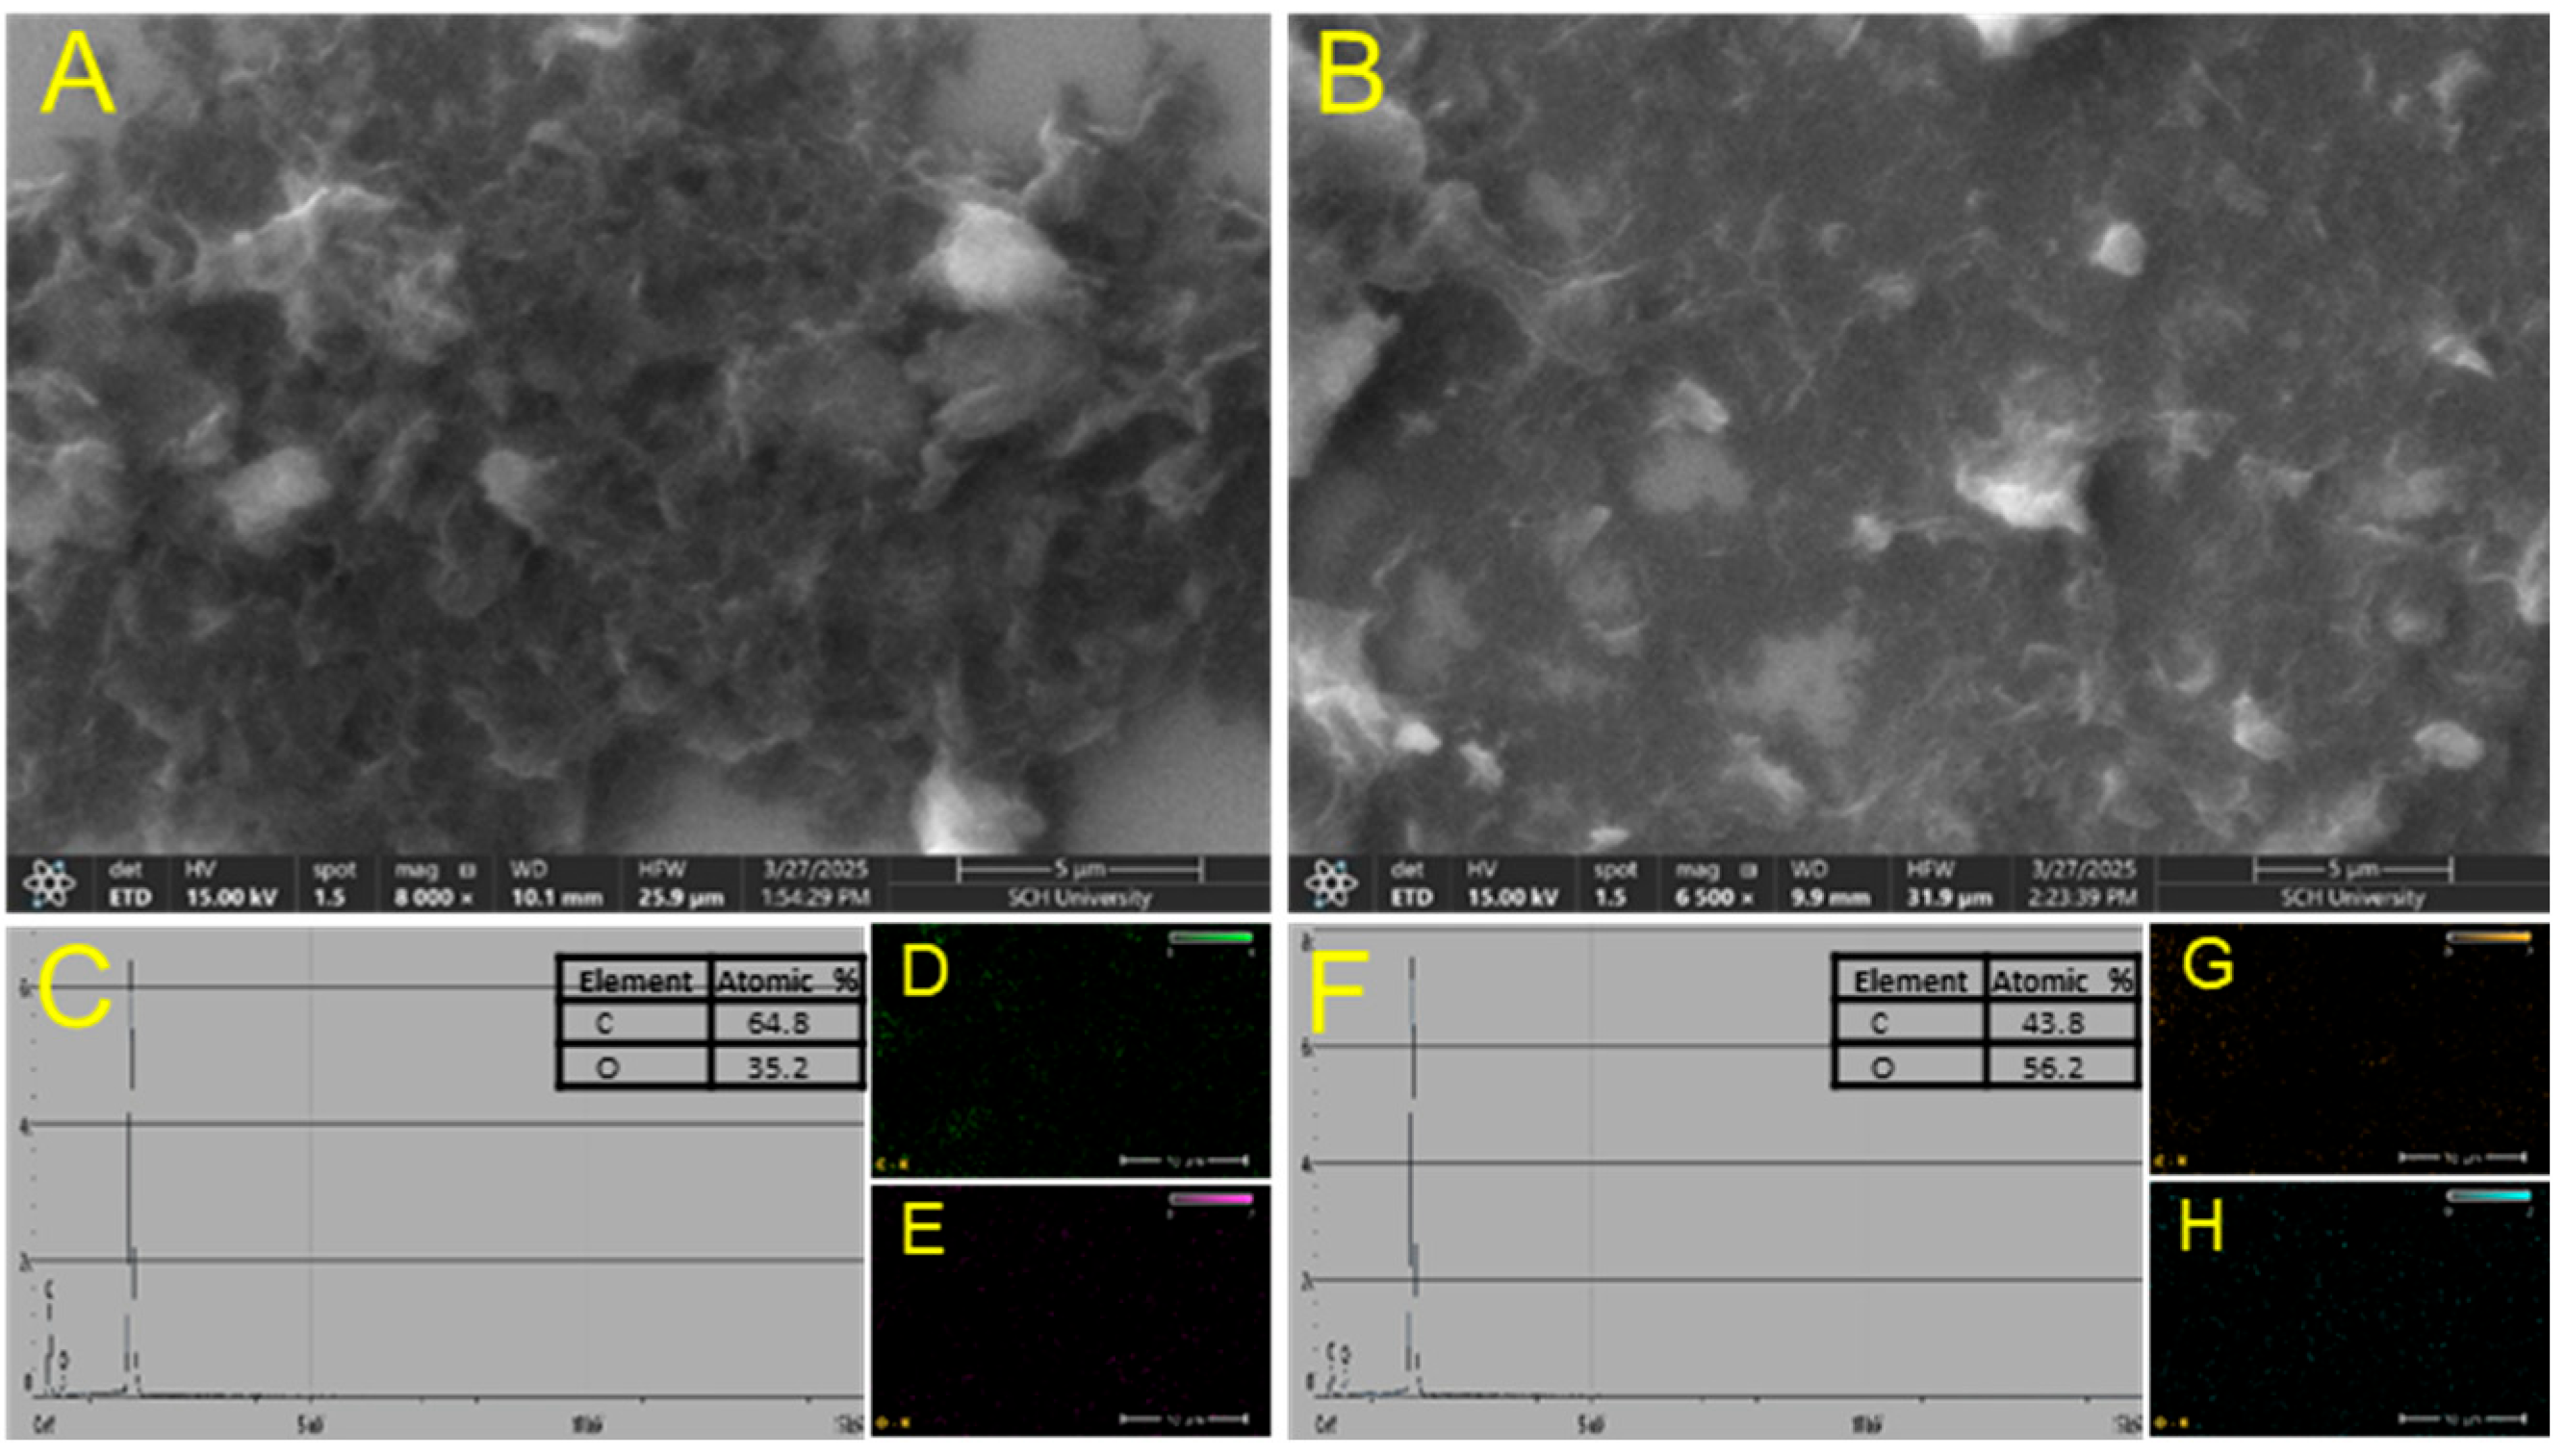
As shown in Figure 2, the surface morphologies of rGO and rGO/β-CD were examined using scanning electron microscopy (SEM). The SEM image of rGO (Figure 2A) revealed a typical wrinkled and layered sheet-like structure characteristic of rGO, indicating partial restoration of the sp2-hybridized carbon framework. In contrast, the rGO/β-CD composite (Figure 2B) exhibited a more disordered and rough surface morphology, with a slightly thicker and aggregated texture. This morphological change can be attributed to the successful functionalization of rGO with β-CD molecules; these molecules disrupt the smooth graphene sheets and introduce additional surface roughness. The observed transformation confirms the effective incorporation of β-CD onto the rGO surface and aligns well with the spectroscopic analysis results.
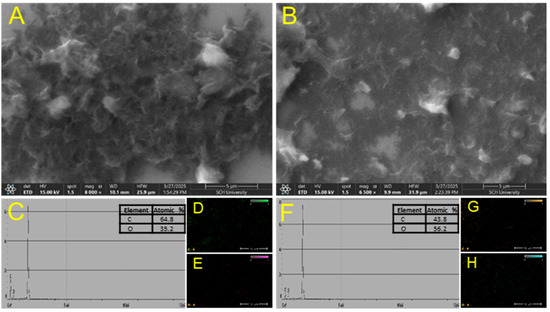
Figure 2.
SEM images of (A) rGO and (B) rGO/β-CD composite; (C) EDS spectrum of rGO; (D,E) EDS mapping of rGO; (F) EDS spectrum of rGO/β-CD; (G,H) EDS mapping of rGO/β-CD.
To further verify the presence of oxygen-containing hydrophilic functional groups in the rGO/β-CD composite compared to rGO, energy-dispersive X-ray spectroscopy (EDS) analysis was performed. Both rGO and rGO/β-CD exhibited characteristic elemental peaks for carbon and oxygen. Notably, the rGO/β-CD composite showed a significantly higher oxygen content (56.2%) than rGO (35.2%) (Figure 2C–H). This considerable increase in oxygen content indicates the successful attachment of β-CD onto the rGO surface, confirming the formation of the rGO/β-CD composite and the presence of abundant hydroxyl and other oxygen functionalities introduced through β-CD functionalization.
3.2. Electrochemical Behavior of rGO/β-CD/GCE
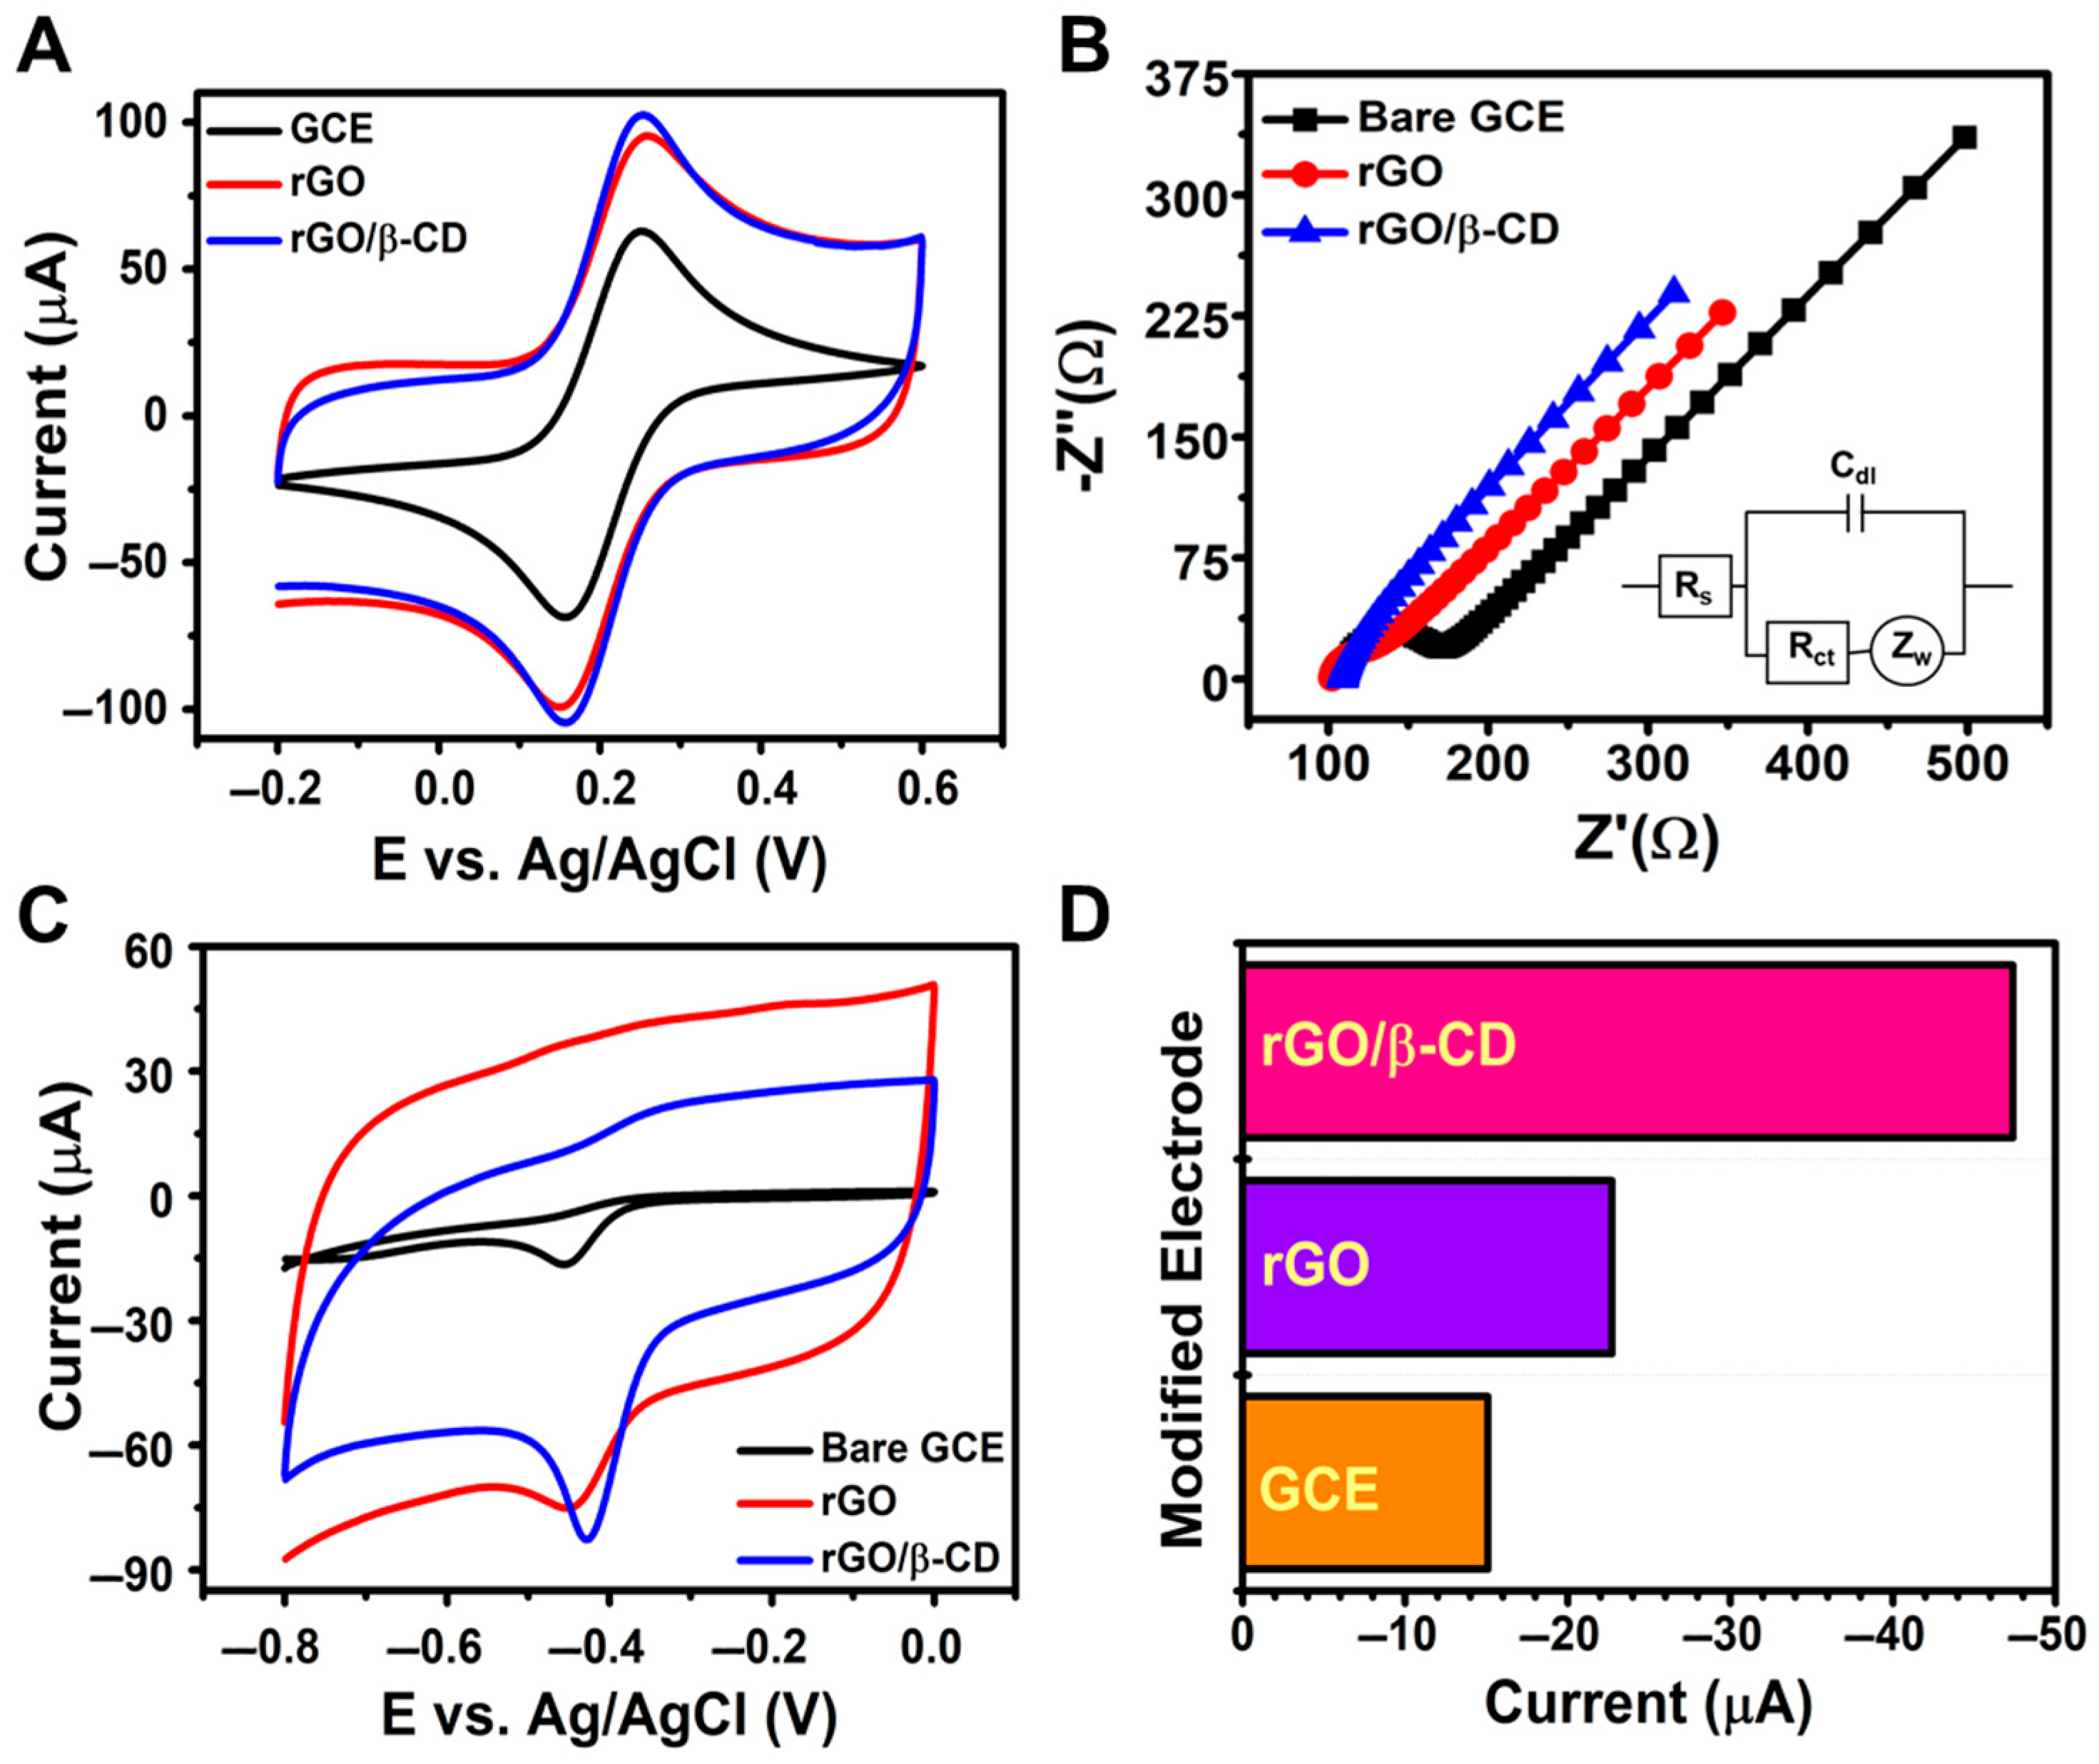
The electrochemical properties of bare GCE, rGO/GCE, and rGO/β-CD/GCE were examined using CV and EIS in a 5 mM [Fe(CN)6]3− solution with 0.1 M KCl as the supporting electrolyte (Figure 3A,B). The electrochemical performance of the fabricated electrodes was evaluated using CV, with the results presented in Figure 3A. Among the tested electrodes, rGO/β-CD/GCE exhibited the highest peak current and the smallest peak-to-peak separation (ΔEp), indicating enhanced redox activity in the [Fe(CN)6]3− system. The ΔEp values for bare GCE, rGO/GCE, and rGO/β-CD/GCE were 0.109 V, 0.095 V, and 0.093 V, respectively. The lower ΔEp of rGO/β-CD/GCE reflects its faster electron transfer kinetics and reduced interfacial resistance. The rGO/β-CD-modified electrode exhibits a significantly higher charging current compared to the bare GCE, as shown in Figure 3A,C. This increase can be attributed to the enhanced electroactive surface area and high electrical conductivity of rGO, which leads to greater double-layer capacitance. Such behavior has been previously reported for rGO/β-CD-modified electrodes, where the elevated background current is the result of greater surface roughness and an increased number of active sites [30,48,49].

Figure 3.
(A) CV curves at 100 mV s−1; (B) Nyquist plots for bare GCE, rGO/GCE, and rGO/β-CD/GCE in 0.1 M KCl containing 5 mM [Fe(CN)6]3−; (C) CV curves in 0.1 M PBS (pH 7.0) with 500 μM NFT; (D) bar chart comparing the Ipc values of different electrodes.
Additionally, as shown in Figure S1A and the corresponding linear plots in Figure S1D, both the anodic (Ipa) and cathodic (Ipc) peak currents increased linearly with the square root of the scan rate, confirming that the redox process at the rGO/β-CD/GCE interface is governed by a diffusion-controlled mechanism. These findings highlight the enhanced electrochemical behavior of the rGO/β-CD-modified electrode.
In Figure 3B, the impedance data were fitted using the Randles equivalent circuit, which includes solution resistance (Rs), charge transfer resistance (Rct), Warburg impedance (Zw), and double-layer capacitance (Cdl). Nyquist plots revealed two distinct regions: a semicircular region at high frequency (Rct) and a linear region at low frequency (Zw). The calculated Rct values for bare GCE, rGO/GCE, and rGO/β-CD/GCE were 53.72 Ω, 22.64 Ω, and 0.037 Ω, respectively. The significantly decreased charge transfer resistance can be attributed to the synergistic effect between reduced graphene oxide and β-cyclodextrin, which facilitates efficient electron transport and enhances the conductivity of the electrode interface; this is consistent with previously reported results for rGO/β-CD nanocomposites that suggested these types of nanocomposites had excellent electrical conductivity and fast electron transfer kinetics [50,51]. The substantial decrease in Rct upon modification with rGO and further with β-CD indicates a significant improvement in electron transfer efficiency and interfacial conductivity, confirming the superior electrochemical performance of the rGO/β-CD/GCE.
The electroactive surface area (EASA) was estimated using the Randles–Ševčík equation [52],
where Ip represents the peak current, D is the diffusion coefficient of the redox probe, ν is the scan rate, A is the EASA, and n is the number of electrons transferred. Among the three electrodes, rGO/β-CD/GCE demonstrated notably higher peak currents, as seen in Figure S1. The calculated EASAs for bare GCE, rGO/GCE, and rGO/β-CD/GCE were 0.060 cm2, 0.062 cm2, and 0.070 cm2, respectively. The increase in this value confirms that β-CD incorporation enhances the electrode’s electrochemically active surface, thereby improving electron transfer and facilitating the redox reaction.
Ip = (2.69 × 10⁵)n3/2D1/2Av1/2C
As shown in Figure 3C, the electroanalytical performance of the electrodes toward NFT was evaluated in 0.1 M PBS (pH 7.0) containing 500 μM NFT. The bare GCE showed a reduction peak at −0.456 V with a cathodic current (Ipc) of −15.1 μA. Upon rGO modification, the reduction peak shifted slightly to −0.453 V and the current increased to −22.71 μA, suggesting improved electron transfer. Notably, the rGO/β-CD/GCE electrode displayed a more positive reduction potential (−0.429 V) and a significantly enhanced Ipc (−47.38 μA), outperforming both bare GCE and rGO/GCE.
These results clearly indicate that β-CD enhances the electrochemical activity of the sensor, likely due to host–guest interactions that enrich NFT at the electrode surface and facilitate charge transfer. As shown in Figure 3D, the rGO/β-CD/GCE exhibited the highest reduction current among the three electrodes. This improvement is attributed to the synergistic effect between rGO and β-CD: rGO offers a highly conductive network for rapid electron transport, while β-CD provides molecular recognition sites that increase the local concentration of NFT near the electrode. This combined effect significantly enhances electron transfer rates and improves the sensor’s sensitivity.
3.3. Optimization of Electrochemical Detection Parameters
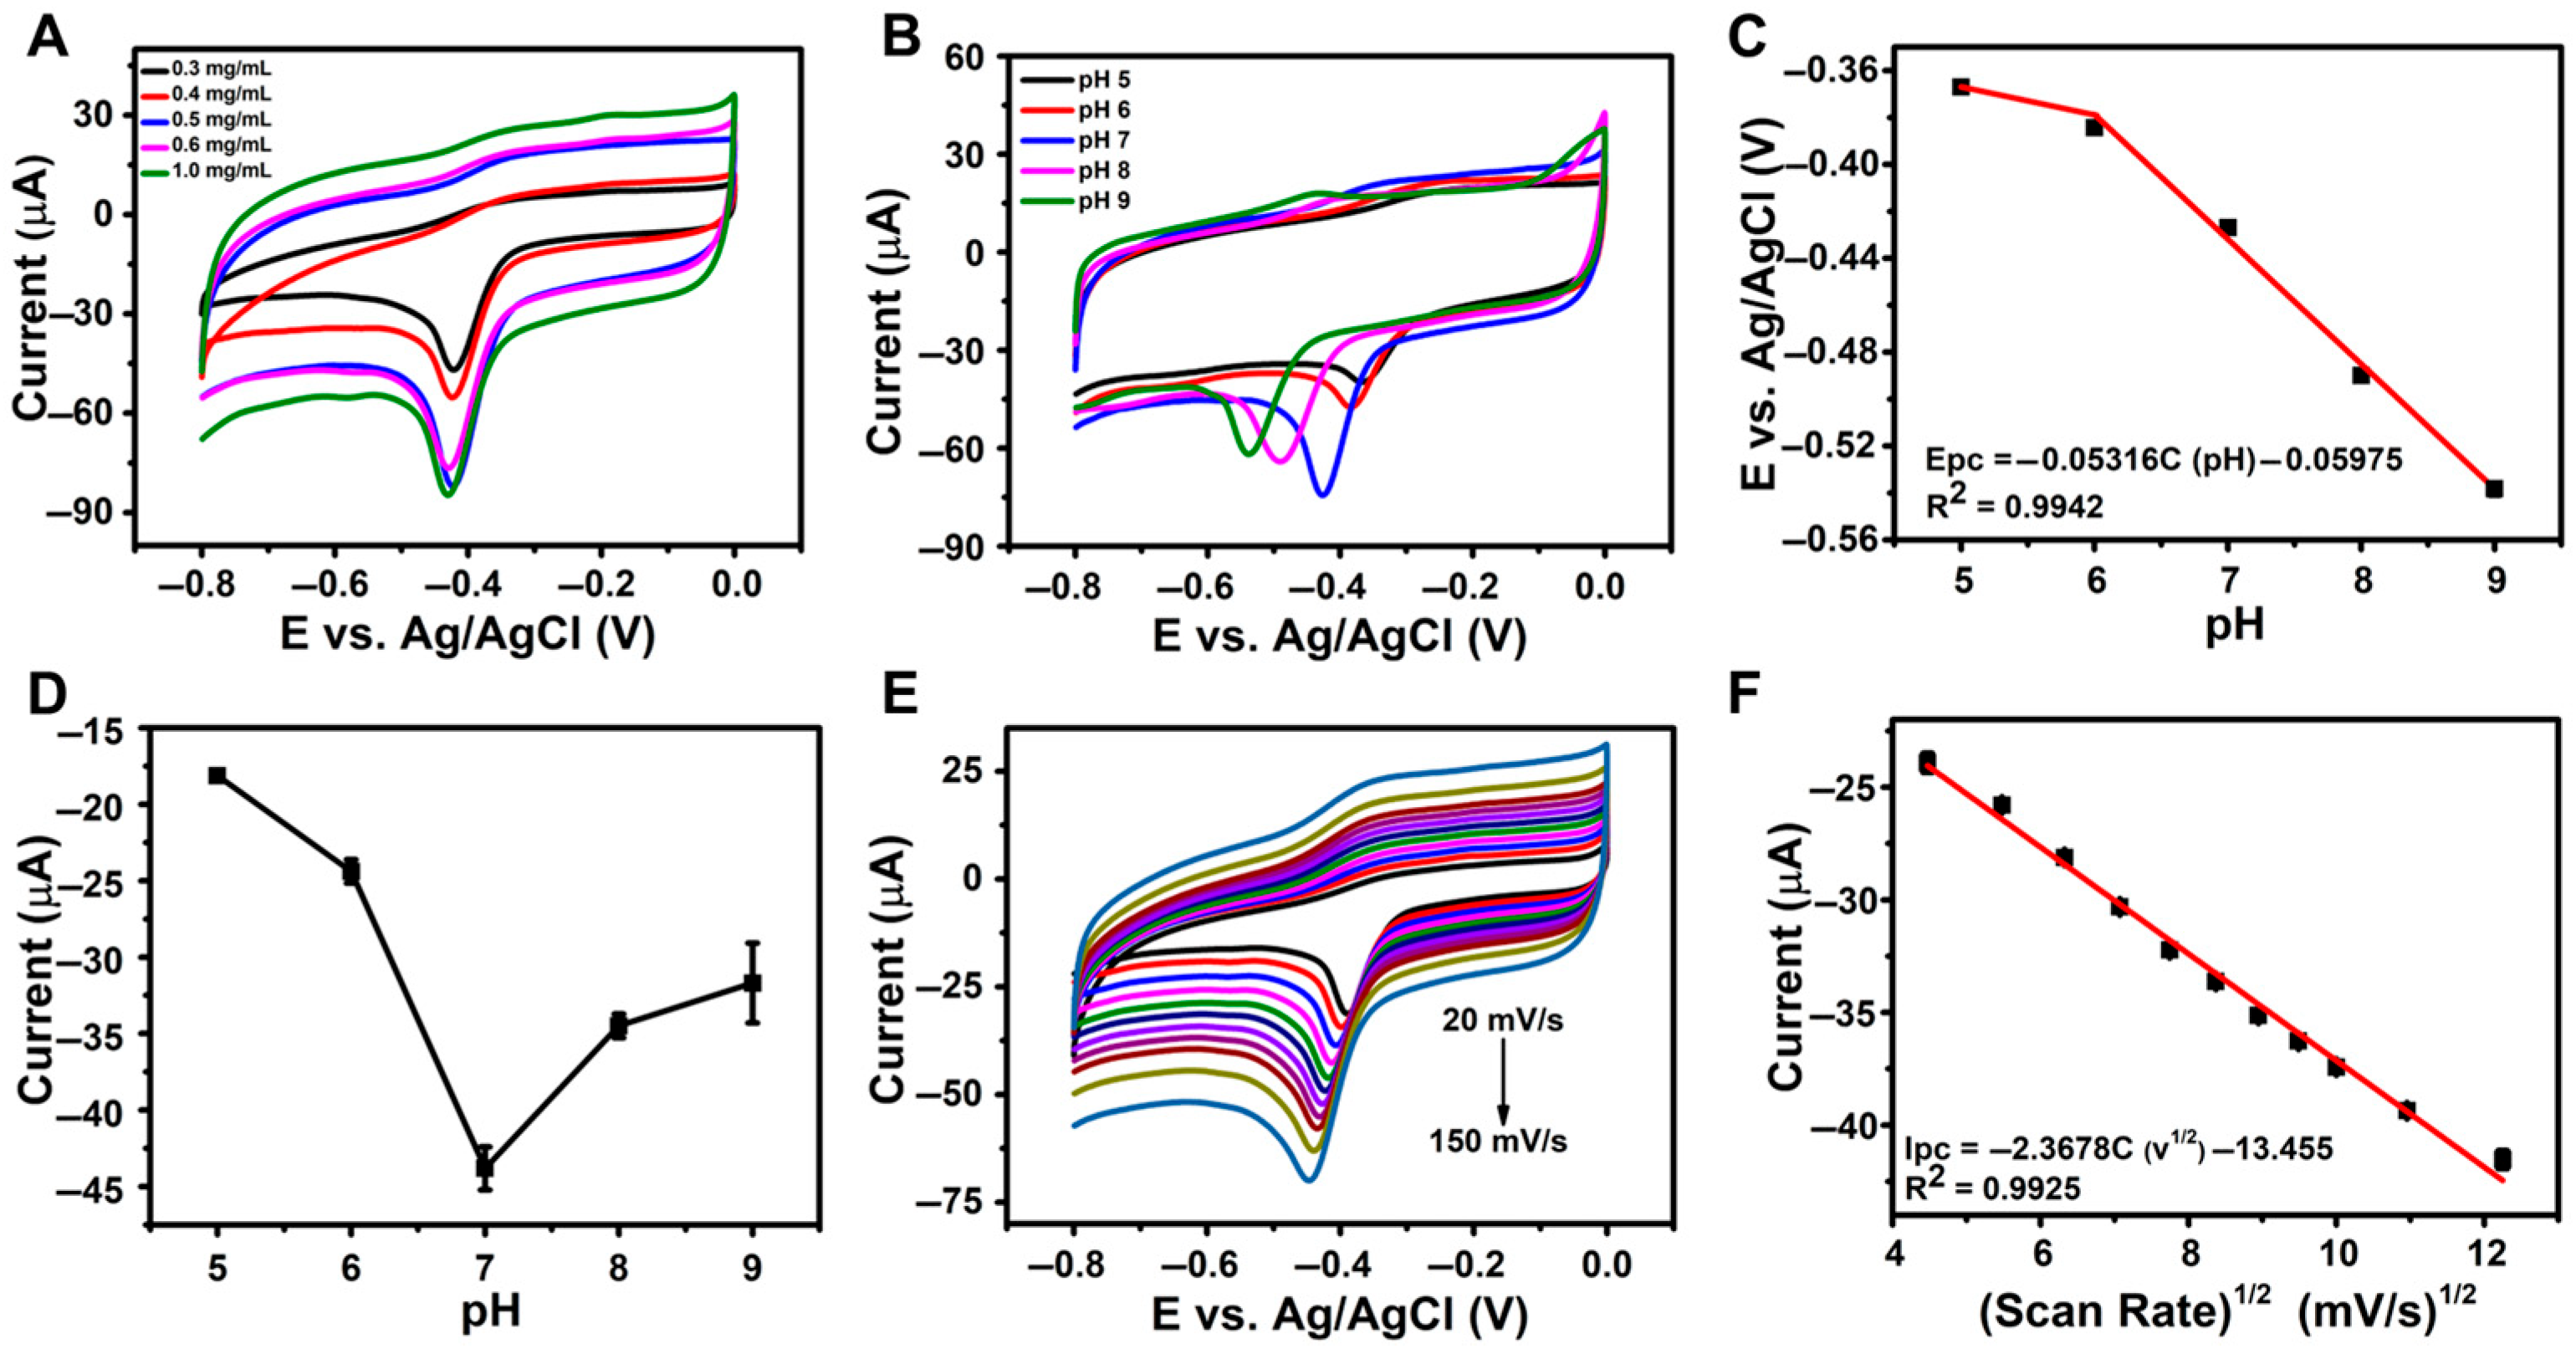
The influence of the rGO/β-CD loading concentration on the electroreduction of NFT was systematically examined, and the corresponding CV responses are illustrated in Figure 4A. As the concentration increased from 0.3 mg/mL to 0.5 mg/mL, the reduction current of NFT progressively increased, indicating improved electron transfer efficiency. However, when the concentration exceeded 0.5 mg/mL, a noticeable decline in the reduction current was observed. This decrease can be attributed to the formation of a thicker film on the electrode surface, which potentially hinders electron transport and limits accessibility to the electroactive surface. Therefore, 0.5 mg/mL was selected as the optimal loading concentration for sensor fabrication to achieve maximum sensitivity in NFT detection.

Figure 4.
(A) CV curves for varying rGO/β-CD loading concentrations; (B) CV curves of 500 µM NFT at rGO/β-CD/GCE in PBS (pH 5–9); (C) the linear plot between pH versus reduction peak potential (Epc); (D) plot of peak current vs. pH at 100 mV s−1; (E) CV curves in PBS (pH 7.0) at scan rates from 20 to 200 mV s−1; (F) the linear plot of square root of scan rate vs. peak current (Ipc).
The pH of the electrolyte significantly affects the behavior of the analyte and the efficiency of electron transfer at the electrode interface, making it a critical factor in sensor performance. To evaluate the effect of pH on the electrochemical reduction of NFT, CV measurements were conducted using the rGO/β-CD/GCE in 500 µM NFT solutions across a pH range of 5.0 to 9.0 and at a scan rate of 100 mV s−1. The results (Figure 4B) revealed that the reduction peak potential (Ep) shifted linearly with pH, following the equation Epc = −0.05316C (pH) − 0.05975 (R2 = 0.9942), as shown in Figure 4C. This slope closely matches the theoretical Nernstian value of −0.059 V/pH [53], suggesting that the electrochemical reduction of NFT involves an equal number (1:1) of protons and electrons.
Furthermore, as seen in Figure 4D, the peak current increased from pH 5.0 to 7.0, reaching a maximum at pH 7.0, and then decreased at higher pH values. These findings confirm that pH 7.0 is optimal for NFT reduction and was thus chosen for all subsequent electrochemical experiments.
To gain further insight into the electrochemical kinetics of NFT reduction at the rGO/β-CD/GCE electrode, CV was conducted at varying scan rates ranging from 20 to 200 mV s−1 in 0.1 M PBS (pH 7.0) containing 500 µM NFT. As shown in Figure 4E, the reduction peak current (Ip) increased progressively with the scan rate, indicating enhanced electron transfer. A linear relationship was observed between Ip and the square root of scan rate (v1/2), as depicted in Figure 4F. The corresponding regression equation was Ipc (µA) = −2.3678C (v1/2) − 13.455, with a correlation coefficient (R2 = 0.9925). This linearity confirms that the electrochemical reduction of NFT at the rGO/β-CD/GCE interface is primarily governed by a diffusion-controlled process.
3.4. Electrochemical Sensing Performance and Reliability Evaluation
Differential pulse voltammetry (DPV), recognized for its high sensitivity, wide linear range, low detection limit, and operational simplicity, was employed to evaluate the electrochemical sensing performance of the rGO/β-CD/GCE sensor for NFT detection. Measurements were performed in 0.1 M phosphate buffer solution (PBS, pH 7.0) at varying NFT concentrations, as illustrated in Figure 5A. A progressive increase in the cathodic peak current (Ipc) was observed as the NFT concentration was increased from 0.5 to 120 µM.
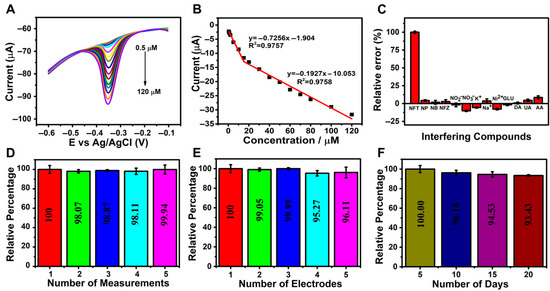
Figure 5.
(A) DPV curves and (B) the corresponding calibration plot of cathodic peak current (Ipc) versus NFT concentration (0.5–120 µM); (C) bar chart showing current response in the presence of interfering species (NFT: 100 µM; interferents: 2 mM); (D) sensor repeatability over five consecutive measurements (n = 3); (E) sensor reproducibility across five independently prepared electrodes (n = 3); (F) long-term stability of the sensor over a 20-day period.
The corresponding calibration curve (Figure 5B) exhibited two distinct linear regions, likely due to differences in mass transport behavior at low and high concentrations; lower concentrations facilitate faster electron transfer to the electrode surface. The linear equations describing the relationship between Ipc and NFT concentrations were Ipc (μA) = −0.7256C [μM] − 1.904 (R2 = 0.9757) for 0.5–15 µM and Ipc (μA) = −0.1927C [μM] − 10.053 (R2 = 0.9758) for 15–120 µM, confirming the high sensitivity of the sensor toward NFT. The calculated limit of detection (LOD) was 0.048 µM, which was determined using the formula LOD = 3S/m, where S is the standard deviation of the blank signal and m is the slope of the calibration curve [54]. The calculated sensitivity was 12.1 µA µM−1 cm−2.
Table 1 presents a comparative summary of the analytical performance of the developed sensor relative to previously reported sensors for NFT detection.

Table 1.
Comparison of the analytical performance of the prepared sensor and previously reported methods for NFT detection.
To assess the selectivity of the rGO/β-CD/GCE sensor, DPV measurements were conducted in the presence of various potentially interfering species. These included common biological compounds such as nitrophenol (NP), nitrobenzene (NB), furazolidone (NFZ), dopamine (DA), ascorbic acid (AA), glucose (Glu), and uric acid (UA), as well as inorganic ions such as K+, Na+, NO2−, NO3−, and Ni2+. Each interferent was added at a 20-fold higher concentration than 100 µM NFT in 0.1 M PBS (pH 7.0). The results showed negligible shifts in the reduction peak potential, indicating minimal interference.
Furthermore, the bar graph in Figure 5C illustrates the reduction current responses, which show a relative error of less than 10%, confirming the excellent selectivity of the developed sensor for NFT even in the presence of coexisting species.
In addition to sensitivity and selectivity, the reliability and practical applicability of the rGO/β-CD/GCE sensor were evaluated through repeatability, reproducibility, and long-term stability studies. As illustrated in Figure 5D, the sensor exhibited excellent repeatability, with minimal variation in voltammetric signals over five consecutive measurements using the same electrode. Reproducibility was also assessed; Figure 5E shows that five independently fabricated electrodes produced highly consistent responses.
Furthermore, the sensor retained approximately 93.0% of its initial peak current after 20 days of storage at room temperature, with measurements performed at five-day intervals (Figure 5F), indicating strong long-term stability. These findings collectively confirm the robustness and practical utility of the developed sensor.
3.5. Detection of NFT in Real Samples
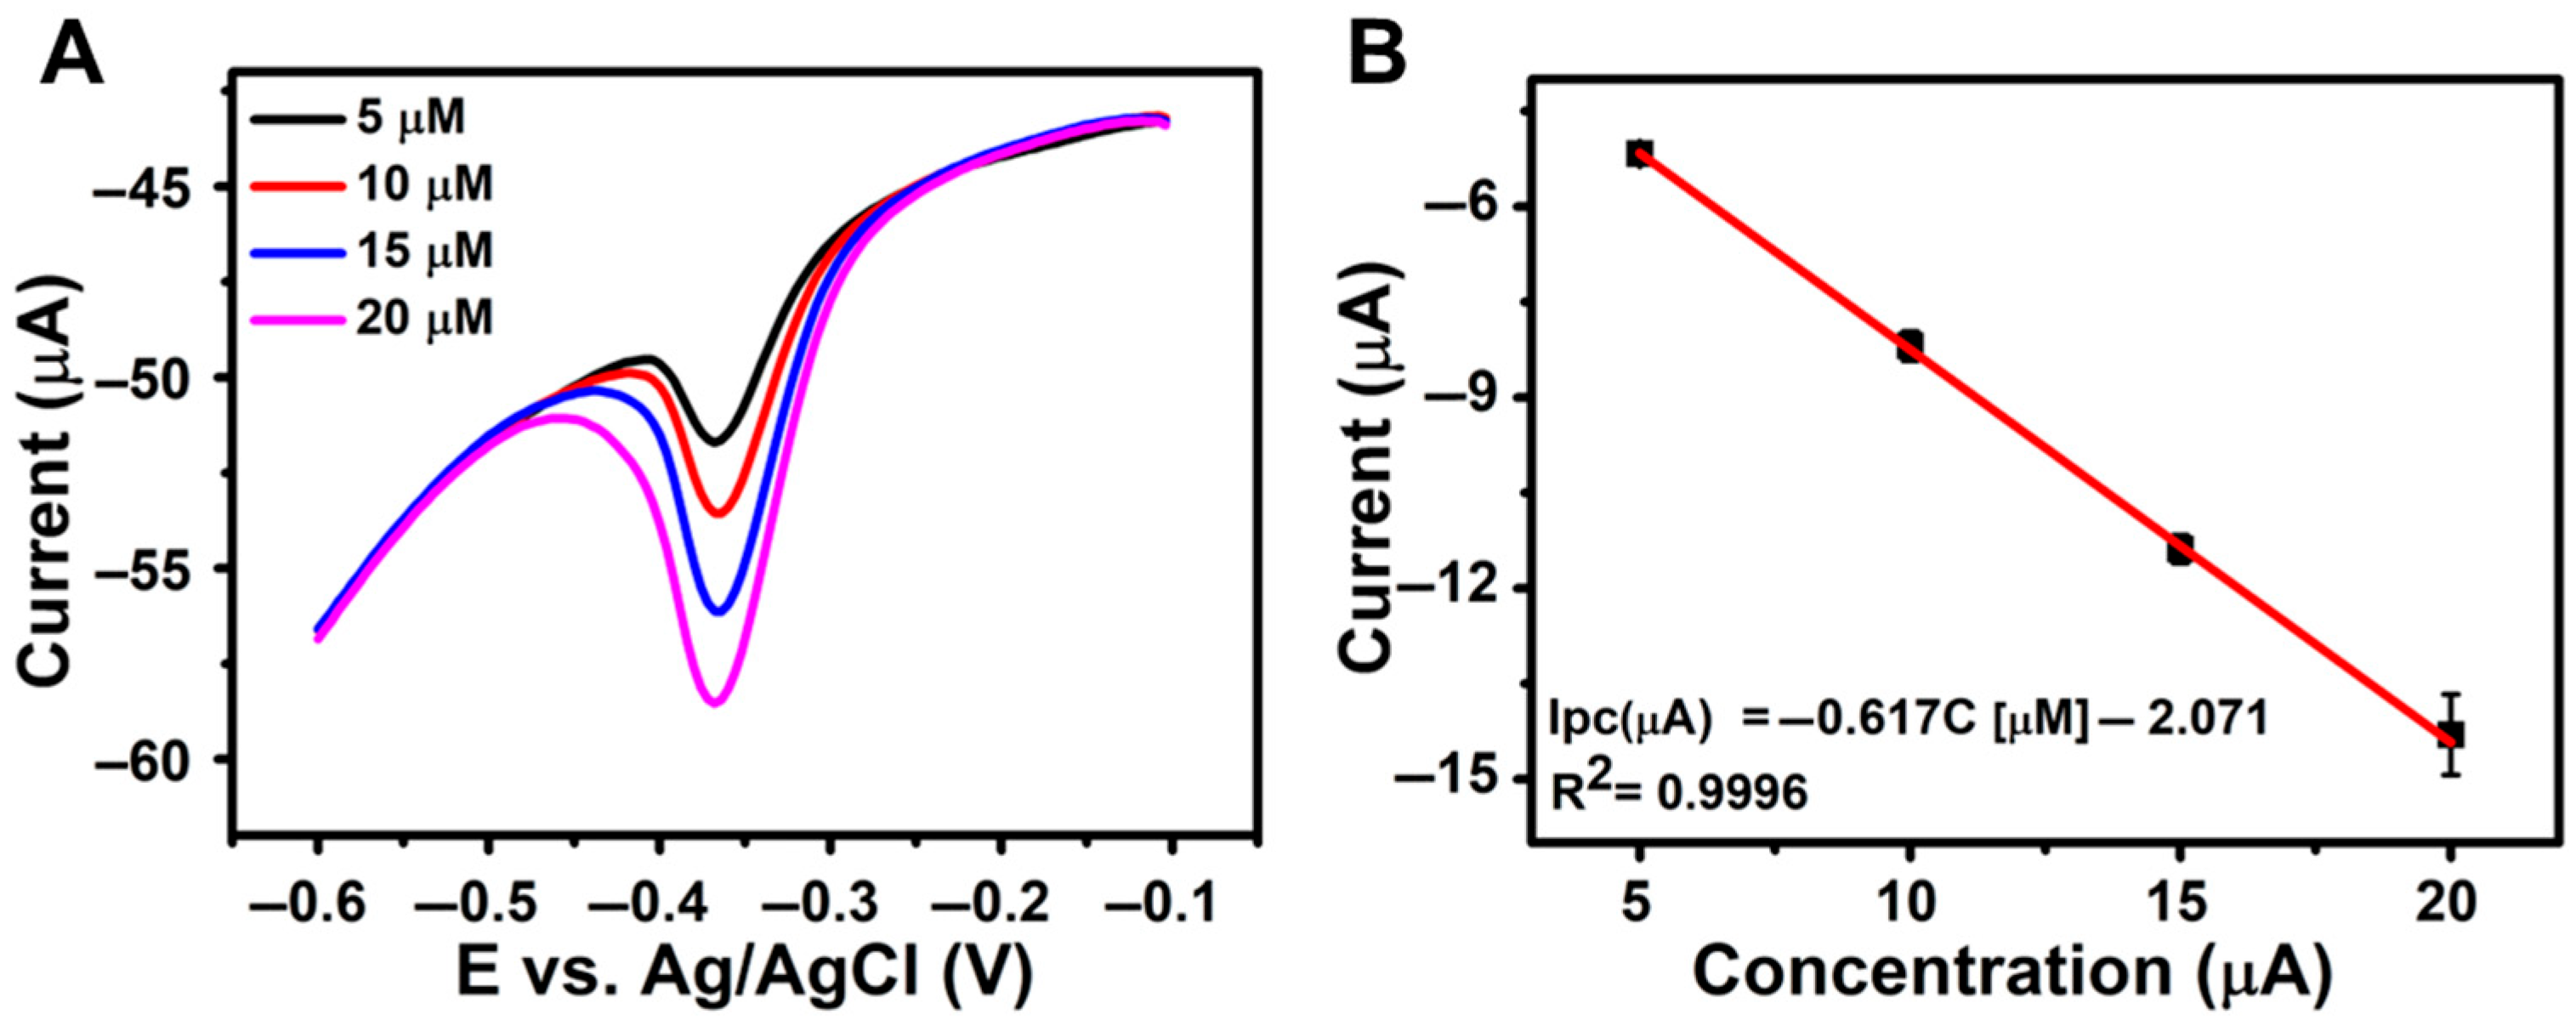
To evaluate the practical applicability of the developed rGO/β-CD/GCE sensor for real-world NFT detection, its performance was tested using wastewater samples spiked with varying concentrations of NFT in 0.1 M PBS (pH 7.0) (Figure 6A), along with the corresponding calibration curve (Figure 6B). As summarized in Table 2, the sensor achieved high recovery percentages with low relative standard deviation (RSD) values, confirming its accuracy and reliability in complex sample matrices. These results highlight the sensor’s strong potential for effective NFT monitoring in environmental analysis.
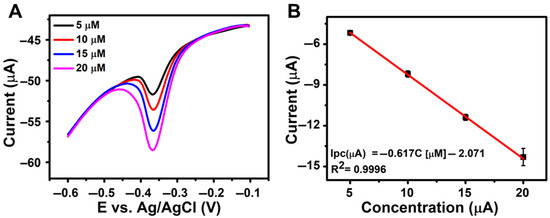
Figure 6.
(A) DPV responses of rGO/β-CD/GCE for wastewater samples spiked with known NFT concentrations in 0.1 M PBS (pH 7.0); (B) Corresponding linear calibration plot of concentration vs. peak current (Ipc).
Table 2.
Detection of NFT concentrations in real samples using rGO/β-CD/GCE.
4. Conclusions
An rGO/β-CD nanocomposite was successfully synthesized using a simple chemical method and employed to fabricate a modified glassy carbon electrode (GCE) for the sensitive electrochemical detection of nitrofurantoin (NFT). The resulting sensor exhibited outstanding electrochemical performance, attributed to the nanocomposite’s high electrochemically active surface area (EASA), good water dispersibility, improved electrical conductivity, and strong electrocatalytic activity. Differential pulse voltammetry (DPV) studies revealed a broad linear detection range, an impressively low detection limit, excellent anti-interference capability, and high sensitivity. These results showcase the rGO/β-CD/GCE sensor’s high sensitivity, reproducibility, and selectivity, indicating its strong potential for practical applications in real-sample analysis and environmental monitoring.
Supplementary Materials
The following supporting information can be downloaded at: https://www.mdpi.com/article/10.3390/chemosensors13070247/s1, Figure S1: CV curves recorded at various scan rates (20–200 mV s−1) for: (A) rGO/β-CD/GCE; (B) rGO/GCE; (C) bare GCE; (D) Linear plot of v1/2 versus redox peak currents (Ipa and Ipc) at rGO/β-CD/GCE; (E) rGO/GCE; (F) bare GCE in 5 mM [Fe(CN)6]3− containing 0.1 M KCl.
Author Contributions
Conceptualization, A.A.; methodology, A.A.; software, A.A. and G.V.P.; validation, A.A.; formal analysis and validation, S.J.J. and D.E.O.; investigation, A.A. and V.V.; resources, T.H.K.; data curation, A.A.; writing—original draft preparation, A.A.; writing—review and editing, A.A., V.V. and T.H.K.; visualization, A.A.; supervision, T.H.K.; funding acquisition, T.H.K. All authors have read and agreed to the published version of the manuscript.
Funding
This work was financially supported by the National Research Foundation of Korea (NRF) grant funded by the Korea Government (MSIT and MOE) (NRF-2025-00559158 and NRF-2021R1A6A1A03039503). This research was supported by Korea Basic Science Institute (National research Facilities and Equipment Center) grant funded by the Ministry of Education (2022R1A6C101B794). This research was supported by ‘regional innovation mega project’ program through the Korea Innovation Foundation funded by Ministry of Science and ICT(2023-DD-UP-0007). This work was also supported by the Soonchunhyang University research fund.
Institutional Review Board Statement
Not applicable.
Informed Consent Statement
Not applicable.
Data Availability Statement
Data will be made available upon request.
Conflicts of Interest
The authors declare no conflicts of interest.
References
- Li, M.; Zhe, T.; Li, R.; Bai, F.; Jia, P.; Xu, Z.; Wang, X.; Bu, T.; Wu, H.; Wang, L. ZIF-Derived Co Nanoparticles Embedded into N-Doped Carbon Nanotube Composites for Highly Efficient Electrochemical Detection of Nitrofurantoin in Food. Food Chem. 2023, 418, 135948. [Google Scholar] [CrossRef] [PubMed]
- Kokulnathan, T.; Wang, T.-J. Synthesis and Characterization of 3D Flower-like Nickel Oxide Entrapped on Boron Doped Carbon Nitride Nanocomposite: An Efficient Catalyst for the Electrochemical Detection of Nitrofurantoin. Compos. Part B Eng. 2019, 174, 106914. [Google Scholar] [CrossRef]
- Sridharan, G.; Godwin, C.J.T.; Atchudan, R.; Arya, S.; Govindasamy, M.; Osman, S.M.; Sundramoorthy, A.K. Iron Oxide Decorated Hexagonal Boron Nitride Modified Electrochemical Sensor for the Detection of Nitrofurantoin in Human Urine Samples. J. Taiwan Inst. Chem. Eng. 2024, 163, 105320. [Google Scholar] [CrossRef]
- Athikomrattanakul, U.; Katterle, M.; Gajovic-Eichelmann, N.; Scheller, F.W. Development of Molecularly Imprinted Polymers for the Binding of Nitrofurantoin. Biosens. Bioelectron. 2009, 25, 82–87. [Google Scholar] [CrossRef]
- Vinoth Kumar, J.; Karthik, R.; Chen, S.-M.; Chen, K.-H.; Sakthinathan, S.; Muthuraj, V.; Chiu, T.-W. Design of Novel 3D Flower-like Neodymium Molybdate: An Efficient and Challenging Catalyst for Sensing and Destroying Pulmonary Toxicity Antibiotic Drug Nitrofurantoin. Chem. Eng. J. 2018, 346, 11–23. [Google Scholar] [CrossRef]
- Lee, A.C.; Mullany, L.C.; Koffi, A.K.; Rafiqullah, I.; Khanam, R.; Folger, L.V.; Rahman, M.; Mitra, D.K.; Labrique, A.; Christian, P.; et al. Urinary Tract Infections in Pregnancy in a Rural Population of Bangladesh: Population-Based Prevalence, Risk Factors, Etiology, and Antibiotic Resistance. BMC Pregnancy Childbirth 2019, 20, 1. [Google Scholar] [CrossRef]
- Cooper, K.M.; Mulder, P.P.J.; van Rhijn, J.A.; Kovacsics, L.; McCracken, R.J.; Young, P.B.; Kennedy, D.G. Depletion of Four Nitrofuran Antibiotics and Their Tissue-Bound Metabolites in Porcine Tissues and Determination Using LC-MS/MS and HPLC-UV. Food Addit. Contam. 2005, 22, 406–414. [Google Scholar] [CrossRef]
- O’Keeffe, M.; Conneely, A.; Cooper, K.M.; Kennedy, D.G.; Kovacsics, L.; Fodor, A.; Mulder, P.P.J.; van Rhijn, J.A.; Trigueros, G. Nitrofuran Antibiotic Residues in Pork: The FoodBRAND Retail Survey. Anal. Chim. Acta 2004, 520, 125–131. [Google Scholar] [CrossRef]
- Kaufmann, A.; Butcher, P.; Maden, K.; Walker, S.; Widmer, M. Determination of Nitrofuran and Chloramphenicol Residues by High Resolution Mass Spectrometry versus Tandem Quadrupole Mass Spectrometry. Anal. Chim. Acta 2015, 862, 41–52. [Google Scholar] [CrossRef]
- Ultrafast Green Synthesis of Silver Nanoparticles as Fluorescent Nanosensors for Determination of Isoniazid and Nitrofurantoin in Biological Fluids and Pharmaceuticals|Scientific Reports. Available online: https://www.nature.com/articles/s41598-025-98373-6 (accessed on 4 June 2025).
- Hadi, H.; Mouayed, M. Determination of Nitrofurantoin in Pharmaceutical Preparations Using Flow Injection-Spectrophotometry. J. Assoc. Arab Univ. Basic Appl. Sci. 2017, 24, 74–80. [Google Scholar] [CrossRef]
- Patel, D.S.; Sharma, N.; Patel, M.C.; Patel, B.N.; Shrivastav, P.S.; Sanyal, M. Quantitation of Nitrofurantoin in Human Plasma by Liquid Chromatography Tandem Mass Spectrometry. Acta Pharm. 2013, 63, 141–158. [Google Scholar] [CrossRef]
- Al, A.; Prasad, G.V.; Jang, S.J.; Kim, T.H. Flower-like Nickel Oxide/Carbon Nanotube Nanocomposite for Sensitive Electrochemical Detection of Alfuzosin. J. Electrochem. Sci. Technol. 2025, 12, 234. [Google Scholar] [CrossRef]
- Al, A.; Prasad, G.V.; Jang, S.J.; Oh, J.-W.; Kim, T.H. A MOF-Templated Double-Shelled Co3O4/NiCo2O4 Nanocomposite for Electrochemical Detection of Alfuzosin. Nanomaterials 2024, 14, 757. [Google Scholar] [CrossRef] [PubMed]
- Lopes, L.C.; Santos, A.; Bueno, P.R. An Outlook on Electrochemical Approaches for Molecular Diagnostics Assays and Discussions on the Limitations of Miniaturized Technologies for Point-of-Care Devices. Sens. Actuators Rep. 2022, 4, 100087. [Google Scholar] [CrossRef]
- Zhang, X.-J.; Wang, G.-S.; Cao, W.-Q.; Wei, Y.-Z.; Cao, M.-S.; Guo, L. Fabrication of Multi-Functional PVDF/RGO Composites via a Simple Thermal Reduction Process and Their Enhanced Electromagnetic Wave Absorption and Dielectric Properties. RSC Adv. 2014, 4, 18594–19601. [Google Scholar] [CrossRef]
- Butler, S.Z.; Hollen, S.M.; Cao, L.; Cui, Y.; Gupta, J.A.; Gutiérrez, H.R.; Heinz, T.F.; Hong, S.S.; Huang, J.; Ismach, A.F.; et al. Progress, Challenges, and Opportunities in Two-Dimensional Materials Beyond Graphene. ACS Nano 2013, 7, 2898–2926. [Google Scholar] [CrossRef] [PubMed]
- Graphene, Related Two-Dimensional Crystals, and Hybrid Systems for Energy Conversion and Storage|Science. Available online: https://www.science.org/doi/abs/10.1126/science.1246501 (accessed on 4 June 2025).
- Thermal Properties of Graphene and Nanostructured Carbon Materials|Nature Materials. Available online: https://www.nature.com/articles/nmat3064 (accessed on 4 June 2025).
- Pham, T.S.H.; Fu, L.; Mahon, P.; Lai, G.; Yu, A. Fabrication of β-Cyclodextrin-Functionalized Reduced Graphene Oxide and Its Application for Electrocatalytic Detection of Carbendazim. Electrocatalysis 2016, 7, 411–419. [Google Scholar] [CrossRef]
- Park, C.S.; Yoon, H.; Kwon, O.S. Graphene-Based Nanoelectronic Biosensors. J. Ind. Eng. Chem. 2016, 38, 13–22. [Google Scholar] [CrossRef]
- Miller, E.E.; Hua, Y.; Tezel, F.H. Materials for Energy Storage: Review of Electrode Materials and Methods of Increasing Capacitance for Supercapacitors. J. Energy Storage 2018, 20, 30–40. [Google Scholar] [CrossRef]
- Sonpir, R.; Dake, D.; Raskar, N.; Mane, V.; Dole, B. Smart and Advanced Nanocomposites of rGO-Based Ni-Doped Co3O4/TiO2 for next-Level Photocatalysis and Gas Sensing Application. Environ. Sci. Pollut. Res. 2025, 32, 1308–1330. [Google Scholar] [CrossRef]
- Tian, Y.; Guo, N.; Wang, W.-Y.; Geng, W.; Jing, L.-C.; Wang, T.; Yuan, X.-T.; Zhu, Z.; Ma, Y.; Geng, H.-Z. Bilayer and Three Dimensional Conductive Network Composed by SnCl2 Reduced rGO with CNTs and GO Applied in Transparent Conductive Films. Sci. Rep. 2021, 11, 9891. [Google Scholar] [CrossRef] [PubMed]
- Vinothkumar, V.; Sekhar, Y.C.; Chen, S.-M.; Kim, T.H. Development of Sensitive Mn@TiO2/RGO Nanocomposite-Based Sensor for the Detection of Sunset Yellow in Food Samples. FlatChem 2025, 51, 100861. [Google Scholar] [CrossRef]
- Abbas, N.; Jang, S.J.; Kim, T.H. Cytosine-Rich Oligonucleotide and Electrochemically Reduced Graphene Oxide Nanocomposite for Ultrasensitive Electrochemical Ag+ Sensing. Nanomaterials 2024, 14, 775. [Google Scholar] [CrossRef]
- Xu, L.Q.; Wang, L.; Zhang, B.; Lim, C.H.; Chen, Y.; Neoh, K.-G.; Kang, E.-T.; Fu, G.D. Functionalization of Reduced Graphene Oxide Nanosheets via Stacking Interactions with the Fluorescent and Water-Soluble Perylene Bisimide-Containing Polymers. Polymer 2011, 52, 2376–2383. [Google Scholar] [CrossRef]
- Guo, Y.; Guo, S.; Ren, J.; Zhai, Y.; Dong, S.; Wang, E. Cyclodextrin Functionalized Graphene Nanosheets with High Supramolecular Recognition Capability: Synthesis and Host−Guest Inclusion for Enhanced Electrochemical Performance. ACS Nano 2010, 4, 4001–4010. [Google Scholar] [CrossRef] [PubMed]
- Rekharsky, M.V.; Inoue, Y. Complexation Thermodynamics of Cyclodextrins. Chem. Rev. 1998, 98, 1875–1918. [Google Scholar] [CrossRef] [PubMed]
- Fu, L.; Lai, G.; Yu, A. Preparation of β-Cyclodextrin Functionalized Reduced Graphene Oxide: Application for Electrochemical Determination of Paracetamol. RSC Adv. 2015, 5, 76973–76978. [Google Scholar] [CrossRef]
- Zhao, Y.; Zheng, X.; Wang, Q.; Zhe, T.; Bai, Y.; Bu, T.; Zhang, M.; Wang, L. Electrochemical Behavior of Reduced Graphene Oxide/Cyclodextrins Sensors for Ultrasensitive Detection of Imidacloprid in Brown Rice. Food Chem. 2020, 333, 127495. [Google Scholar] [CrossRef]
- Le, H.N.; Jeong, H. kyung β-Cyclodextrin–Graphite Oxide–Carbon Nanotube Composite for Enhanced Electrochemical Supramolecular Recognition. J. Phys. Chem. C 2015, 119, 18671–18677. [Google Scholar] [CrossRef]
- Jiang, Z.; Li, G.; Zhang, M. Electrochemical Sensor Based on Electro-Polymerization of β-Cyclodextrin and Reduced-Graphene Oxide on Glassy Carbon Electrode for Determination of Gatifloxacin. Sens. Actuators B Chem. 2016, 228, 59–65. [Google Scholar] [CrossRef]
- Ghanbari, M.H.; Shahdost-fard, F.; Khoshroo, A.; Rahimi-Nasrabadi, M.; Ganjali, M.R.; Wysokowski, M.; Rębiś, T.; Żółtowska-Aksamitowska, S.; Jesionowski, T.; Rahimi, P.; et al. A Nanocomposite Consisting of Reduced Graphene Oxide and Electropolymerized β-Cyclodextrin for Voltammetric Sensing of Levofloxacin. Microchim. Acta 2019, 186, 438. [Google Scholar] [CrossRef] [PubMed]
- Zor, E.; Bingol, H.; Ramanaviciene, A.; Ramanavicius, A.; Ersoz, M. An Electrochemical and Computational Study for Discrimination of d—And l -Cystine by Reduced Graphene Oxide/β-Cyclodextrin. Analyst 2015, 140, 313–321. [Google Scholar] [CrossRef]
- Hummers, W.S.; Offeman, R.E. Preparation of Graphitic Oxide. J. Am. Chem. Soc. 1958, 80, 1339. [Google Scholar] [CrossRef]
- Song, Z.; Wang, M.; Wang, Z.; Wang, Y.; Li, R.; Zhang, Y.; Liu, C.; Liu, Y.; Xu, B.; Qi, F. Insights into Heteroatom-Doped Graphene for Catalytic Ozonation: Active Centers, Reactive Oxygen Species Evolution, and Catalytic Mechanism. Environ. Sci. Technol. 2019, 53, 5337–5348. [Google Scholar] [CrossRef]
- Feng, X.; Qiu, B.; Dang, Y.; Sun, D. Enhanced Adsorption of Naproxen from Aquatic Environments by β-Cyclodextrin-Immobilized Reduced Graphene Oxide. Chem. Eng. J. 2021, 412, 128710. [Google Scholar] [CrossRef]
- Lai, K.C.; Lee, L.Y.; Hiew, B.Y.Z.; Thangalazhy-Gopakumar, S.; Gan, S. Environmental Application of Three-Dimensional Graphene Materials as Adsorbents for Dyes and Heavy Metals: Review on Ice-Templating Method and Adsorption Mechanisms. J. Environ. Sci. 2019, 79, 174–199. [Google Scholar] [CrossRef]
- Shi, Y.-C.; Wang, A.-J.; Wu, X.-L.; Chen, J.-R.; Feng, J.-J. Green-Assembly of Three-Dimensional Porous Graphene Hydrogels for Efficient Removal of Organic Dyes. J. Colloid Interface Sci. 2016, 484, 254–262. [Google Scholar] [CrossRef]
- Si, K.; Sun, C.; Cheng, S.; Wang, Y.; Hu, W. Cyclodextrin Functionalized Reduced Graphene Oxide for Electrochemical Chiral Differentiation of Tartaric Acid. Anal. Methods 2018, 10, 3660–3665. [Google Scholar] [CrossRef]
- Nikhil, S.; Karthika, A.; Suresh, P.; Suganthi, A.; Rajarajan, M. A Selective and Sensitive Electrochemical Determination of Catechol Based on Reduced Graphene Oxide Decorated β-Cyclodextrin Nanosheet Modified Glassy Carbon Electrode. Adv. Powder Technol. 2021, 32, 2148–2159. [Google Scholar] [CrossRef]
- Wang, J.; Chen, B. Adsorption and Coadsorption of Organic Pollutants and a Heavy Metal by Graphene Oxide and Reduced Graphene Materials. Chem. Eng. J. 2015, 281, 379–388. [Google Scholar] [CrossRef]
- Xie, G.; Xi, P.; Liu, H.; Chen, F.; Huang, L.; Shi, Y.; Hou, F.; Zeng, Z.; Shao, C.; Wang, J. A Facile Chemical Method to Produce Superparamagnetic Graphene Oxide–Fe3O4 Hybrid Composite and Its Application in the Removal of Dyes from Aqueous Solution. J. Mater. Chem. 2011, 22, 1033–1039. [Google Scholar] [CrossRef]
- Sun, Z.; Zhao, L.; Liu, C.; Zhen, Y.; Zhang, W.; Ma, J. A Novel 3D Adsorbent of Reduced Graphene Oxide-β-Cyclodextrin Aerogel Coupled Hardness with Softness for Efficient Removal of Bisphenol A. Chem. Eng. J. 2019, 372, 896–904. [Google Scholar] [CrossRef]
- Fang, Z.; Li, Q.; Su, L.; Chen, J.; Chou, K.-C.; Hou, X. Efficient Synergy of Photocatalysis and Adsorption of Hexavalent Chromium and Rhodamine B over Al4SiC4/rGO Hybrid Photocatalyst under Visible-Light Irradiation. Appl. Catal. B Environ. 2019, 241, 548–560. [Google Scholar] [CrossRef]
- Kang, Y.; Wang, L.; Wang, Y.; Zhang, H.; Wang, Y.; Hong, D.; Qv, Y.; Wang, S. Construction and Enhanced Gas Sensing Performances of CuO-Modified α-Fe2O3 Hybrid Hollow Spheres. Sens. Actuators B Chem. 2013, 177, 570–576. [Google Scholar] [CrossRef]
- Lu, D.; Lin, S.; Wang, L.; Shi, X.; Wang, C.; Zhang, Y. Synthesis of Cyclodextrin-Reduced Graphene Oxide Hybrid Nanosheets for Sensitivity Enhanced Electrochemical Determination of Diethylstilbestrol. Electrochim. Acta 2012, 85, 131–138. [Google Scholar] [CrossRef]
- Zhang, M.; Zhang, H.; Zhai, X.; Yang, X.; Zhao, H.; Wang, J.; Dong, A.; Wang, Z. Application of β-Cyclodextrin–Reduced Graphene Oxide Nanosheets for Enhanced Electrochemical Sensing of the Nitenpyram Residue in Real Samples. New J. Chem. 2017, 41, 2169–2177. [Google Scholar] [CrossRef]
- Yun, N.; Lu, C.; Sun, T.; Xu, B.; Song, Y.; Zong, Z.; Chen, K.; Huang, G.; Chen, X.; Gu, Q. High Sensitivity Detection of Capsaicin in Red Pepper Oil Based on Reduced Graphene Oxide Enhanced by β-Cyclodextrin. Food Anal. Methods 2023, 16, 318–329. [Google Scholar] [CrossRef]
- Mirzaei, B.; Zarrabi, A.; Noorbakhsh, A.; Amini, A.; Makvandi, P. A Reduced Graphene Oxide-β-Cyclodextrin Nanocomposite-Based Electrode for Electrochemical Detection of Curcumin. RSC Adv. 2021, 11, 7862–7872. [Google Scholar] [CrossRef]
- Vishwanath, M.S.; Swamy, B.E.K.; Vishnumurthy, K.A. Electrochemical Detection of Bisphenol A in Presence of Catechol and Hydroquinone at Copper Oxide Modified Carbon Paste Electrode. Mater. Chem. Phys. 2022, 289, 126443. [Google Scholar] [CrossRef]
- Gerent, G.G.; Spinelli, A. Magnetite-Platinum Nanoparticles-Modified Glassy Carbon Electrode as Electrochemical Detector for Nitrophenol Isomers. J. Hazard. Mater. 2017, 330, 105–115. [Google Scholar] [CrossRef]
- Silva, E.M.; Takeuchi, R.M.; Santos, A.L. Carbon Nanotubes for Voltammetric Determination of Sulphite in Some Beverages. Food Chem. 2015, 173, 763–769. [Google Scholar] [CrossRef] [PubMed]
- Fogg, A.G.; Ghawji, A.B. Reductive Amperometric Determination of Nitrofurantoin and Acetazolamide at a Sessile Mercury Drop Electrode Using Flow Injection Analysis. Analyst 1988, 113, 727–730. [Google Scholar] [CrossRef]
- Ghawji, A.B.; Fogg, A.G. Reduction in Size by Electrochemical Pre-Treatment at High Negative Potentials of the Background Currents Obtained at Negative Potentials at Glassy Carbon Electrodes and Its Application in the Reductive Flow Injection Amperometric Determination of Nitrofurantoin. Analyst 1986, 111, 157–161. [Google Scholar] [CrossRef]
- Aydoğdu, G.; Günendi, G.; Zeybek, D.K.; Zeybek, B.; Pekyardımcı, Ş. A Novel Electrochemical DNA Biosensor Based on Poly-(5-Amino-2-Mercapto-1,3,4-Thiadiazole) Modified Glassy Carbon Electrode for the Determination of Nitrofurantoin. Sens. Actuators B Chem. 2014, 197, 211–219. [Google Scholar] [CrossRef]
- Voltammetric Determination of Nitrofurantoin at a Mercury Meniscus Modified Silver Solid Amalgam Electrode—Krejčová—2015—Electroanalysis—Wiley Online Library. Available online: https://analyticalsciencejournals.onlinelibrary.wiley.com/doi/full/10.1002/elan.201400410 (accessed on 5 June 2025).
- Rudayni, H.A.; Chaudhary, A.A.; Abu-Taweel, G.M.; Shariq, M.; Imran, M. Hydrothermal Synthesis of CeO2 Nanoparticles and Its Application in Electrochemical Detection of Nitrofurantoin Antibiotics. Europhys. Lett. 2022, 137, 66005. [Google Scholar] [CrossRef]
- He, B.; Li, J. A Sensitive Electrochemical Sensor Based on Reduced Graphene Oxide/Fe3O4 Nanorod Composites for Detection of Nitrofurantoin and Its Metabolite. Anal. Methods 2019, 11, 1427–1435. [Google Scholar] [CrossRef]

Disclaimer/Publisher’s Note: The statements, opinions and data contained in all publications are solely those of the individual author(s) and contributor(s) and not of MDPI and/or the editor(s). MDPI and/or the editor(s) disclaim responsibility for any injury to people or property resulting from any ideas, methods, instructions or products referred to in the content. |
© 2025 by the authors. Licensee MDPI, Basel, Switzerland. This article is an open access article distributed under the terms and conditions of the Creative Commons Attribution (CC BY) license (https://creativecommons.org/licenses/by/4.0/).