Article

Vitamin K Epoxide Reductase Complex (VKORC1) Electrochemical Genosensors: Towards the Identification of 1639 G>A Genetic Polymorphism

by
Tiago Barbosa
1,2,
Stephanie L. Morais
1,
Renato Carvalho
1,2,
Júlia M. C. S. Magalhães
3,
Valentina F. Domingues
1,
Cristina Delerue-Matos
1,
Hygor Ferreira-Fernandes
4,
Giovanny R. Pinto
5,
Marlene Santos
2,6 and
Maria Fátima Barroso
1,*
1
REQUIMTE/LAQV, Instituto Superior de Engenharia do Porto, Instituto Politécnico do Porto, Rua Dr. António Bernardino de Almeida 431, 4249-015 Porto, Portugal
2
REQUIMTE/LAQV, Escola Superior de Saúde, Instituto Politécnico do Porto, Rua Dr. António Bernardino de Almeida, 400, 4200-072 Porto, Portugal
3
REQUIMTE/LAQV, Departamento de Engenharia Química, Faculdade de Engenharia, Universidade Do Porto, Rua Dr. Roberto Frias, 4200-465 Porto, Portugal
4
Instituto de Educação, Ciência e Técnologia Do Piauí (IFPI), Departamento de Informação, Ambiente, Saúde e Produção Alimentícia, Teresina 64280-000, PI, Brazil
5
Grupo de Estudos Em Genética Humana e Médica (GEHMED), Laboratório de Genética e Biologia Molecular, Departamento de Biomedicina, Universidade Do Delta Do Parnaíba (UFDPar), Parnaíba 64202-020, PI, Brazil
6
Grupo de Oncologia Molecular e Patologia Viral, Centro de Investigação, Instituto Português de Oncologia do Porto—Francisco Gentil, R. Dr. António Bernardino de Almeida 865, 4200-072 Porto, Portugal
*
Author to whom correspondence should be addressed.
Chemosensors 2025, 13(7), 248; https://doi.org/10.3390/chemosensors13070248
Submission received: 5 June 2025 / Revised: 3 July 2025 / Accepted: 5 July 2025 / Published: 10 July 2025

Abstract

Anticoagulants, including warfarin, are often administered to patients who are exhibiting early symptoms of thromboembolic episodes or who have already experienced such episodes. However, warfarin has a limited therapeutic index and might cause bleeding and other clinical problems. Warfarin inhibits the vitamin K epoxide reductase complex subunit 1 (VKORC1), an enzyme essential for activating vitamin K, in the coagulation cascade. Genetic factors, such as polymorphisms, can change the natural function of VKORC1, causing variations in the medication reaction among individuals. Hence, before prescribing warfarin, the patient’s genetic profile should also be considered. In this study, an electrochemical genosensor capable of detecting the VKORC1 1639 G>A polymorphism was designed and optimized. This analytical approach detects the electric current obtained during the hybridization reaction between two 52 base pair complementary oligonucleotide sequences. Investigating public bioinformatic platforms, two DNA sequences with the A and G single-nucleotide variants were selected and designed. The experimental protocol of the genosensor implied the formation of a bilayer composed of a thiolate DNA and an alkanethiol immobilized onto gold electrodes, as well as the formation of a DNA duplex using a sandwich-format hybridization reaction through a fluorescein labelled DNA signalling probe and the enzymatic amplification of the electrochemical signal, detected by chronoamperometry. A detection limit of 20 pM and a linear range of 0.05–1.00 nM was obtained. A clear differentiation between A/A, G/A and G/G genotypes in biological samples was successfully identified by his novel device.

1. Introduction

Cardiovascular diseases (CVDs) persist as the leading cause of premature mortality, disability and reduced quality of life. Since 1990 the number of CVDs events has nearly doubled [1,2]. Thus, with the increasing incidence of CVDs worldwide, there is an urgent need to develop therapeutic methodologies that can effectively improve a patient’s quality of life, as well as improve treatment effects [1]. Many studies in CVDs’ treatments have been made to prevent further complications and mitigate the frequency of these episodes [2,3]. Despite this, achieving an optimal therapeutic outcome remains a challenge due to the variability in drug-dose responses [1,4].
Pharmacogenetics, the investigation of genetic differences affecting medication responses, is essential for the early identification and diagnosis of CVDs. [5]. A key advancement in this field was the identification of specific genes and gene variations, i.e., polymorphisms associated with drug-dose response phenotypes [5,6,7]. By conducting genetic screening tests, variations in drug metabolism genes can help define a patient as either a poor, intermediate or rapid metabolizer in relation to the efficiency of their activity to certain drugs. So, understanding how a patient metabolizes a medication warrants safer treatments, ultimately enhancing clinical outcomes and lowering medical costs [5,8,9].
For instance, the vitamin K epoxide reductase complex subunit 1 (VKORC1) gene encodes an integral enzyme to the activation of vitamin K, subsequently affecting the blood clotting mechanisms [10]. Polymorphisms, specifically the VKORC1, c.-1639G>A single nucleotide polymorphism (SNP) is known to influence individual responses to anticoagulant therapies, such as warfarin, which are commonly used in the management of cardiovascular diseases [10,11]. This SNP is associated with an increased sensitivity to warfarin, thus lowering its dose requirements to approximately 3–10% of African populations, 40% of Europeans, and 90–95% in Asians [11]. So, the detection of VKORC1 functional polymorphisms has become critical in preventing adverse effects from inappropriate warfarin dosing.
For that, some molecular biology techniques, namely polymerase chain reaction (PCR) and real-time PCR (RT-PCR), are frequently used to detect VKORC1 polymorphisms and assess their impact on warfarin dosing [12,13]. However, the time-intensive nature of PCR testing, the need for specialized equipment, and the requirement for skilled personnel make it unsuitable for large-scale or resource-limited healthcare settings. Additionally, the high costs associated with sending samples to external laboratories present a barrier, particularly for small healthcare practices or situations involving a high volume of samples [13,14]. Hence, there is also a need for an alternative, cost-effective detection method that can easily be implemented in healthcare systems worldwide.
One example that can overcome these limitations is electrochemical biosensors, specifically electrochemical genosensors. These devices offer advantages such as low operational costs, portability, rapid processing and high sensitivity and accuracy [15]. Lázaro et al. [16] used recombinase polymerase amplification (RPA) and allele-specific ligation-isothermal in a multiplexed hybridization test based on Blu-Ray technology to distinguish VKORC1 and CYP2C9 SNPs from actual DNA sequences. Similarly, to assess the impact of the VKORC1 and CYP2C9 genotypes on warfarin dosage, Huang et al. [17] carried out electrochemical assays on a sandwich-format DNA sensor using a thiol capture and ferrocene-labelled signal probe to assess the impact of VKORC1 and CYP2C9 genotypes on warfarin dosage. This study not only reported the genotype and allelic frequencies of the VKORC1 and CYP2C9 gene in a large sample group (1285 patients) but also determined a dosage regime based on the obtained results. Additionally, the DNA hybridization and electrochemical detection steps only took 30 min to complete. Nevertheless, the initial electrode pretreatment and DNA capture/MCH immobilization steps required more time and higher DNA concentrations to obtain an electrochemical signal. Moreover, the study did not present the voltmeter measurements or any reference to the limits or concentration range; all results appear as an allelic frequency percentage. More recently, Sang et al. [18] developed a real-time, label-free magnetoelastic biosensor to detect VKORC1 gene variations, which could aid healthcare providers in making informed clinical decisions. This study utilized a specific avidin–biotin interaction recognition magnetoelastic (ME) biosensor on a Metglas alloy 2826 chip to detect VKORC1 genotypes. The developed sensor enabled fast and label-free responses, and their signals registered from a wireless transmission system. More importantly, a linear concentration range of 0.1 fM to 10 pM, with a detection limit (LOD) of 0.00389 fM (S/N = 3) was obtained. Nonetheless, the whole process required more expensive materials and complex procedures. DNA interactions were also only detected at higher temperatures (37 °C) and their results presented as resonance frequency shifts. Furthermore, this study presented no real DNA sample applications. In this study, an analytical device capable of discriminating the electrochemical signal between three VKORC1 SNP genotypes—the non-variant homozygous (A/A), the heterozygous (G/A) and homozygous variant (G/G) alleles—was developed.

2. Materials and Methods

2.1. Apparatus and Electrodes

An Autolab potenciostat (Metrohm, Herisau, Switzerland) controlled by NOVA 1.11.2 software was used to perform chronoamperometric readings. Screen printed gold electrodes (SPGEs) model C223AT (DropSens, Oviedo, Spain), combined with a cable connector DRP-CAC73499, were used as electrochemical transducers. The quantification of the purified ssDNA was performed using a Nanodrop spectrophotometer.

2.2. Reagents, Samples and Solutions

The lyophilized DNA salts sequences (Table 1) were obtained from Eurogentec, Seraing, Belgium. Details regarding the chemicals used are detailed in the supporting information.
The electrochemical methodology used implied the immobilization of the DNA-capture probe, which pairs both the completely complementary wild-type DNA-Target sequence (DNATA) as well as the partially complementary target probe (DNATG). Scheme 1 and Table 1 exhibit both DNA sequences.

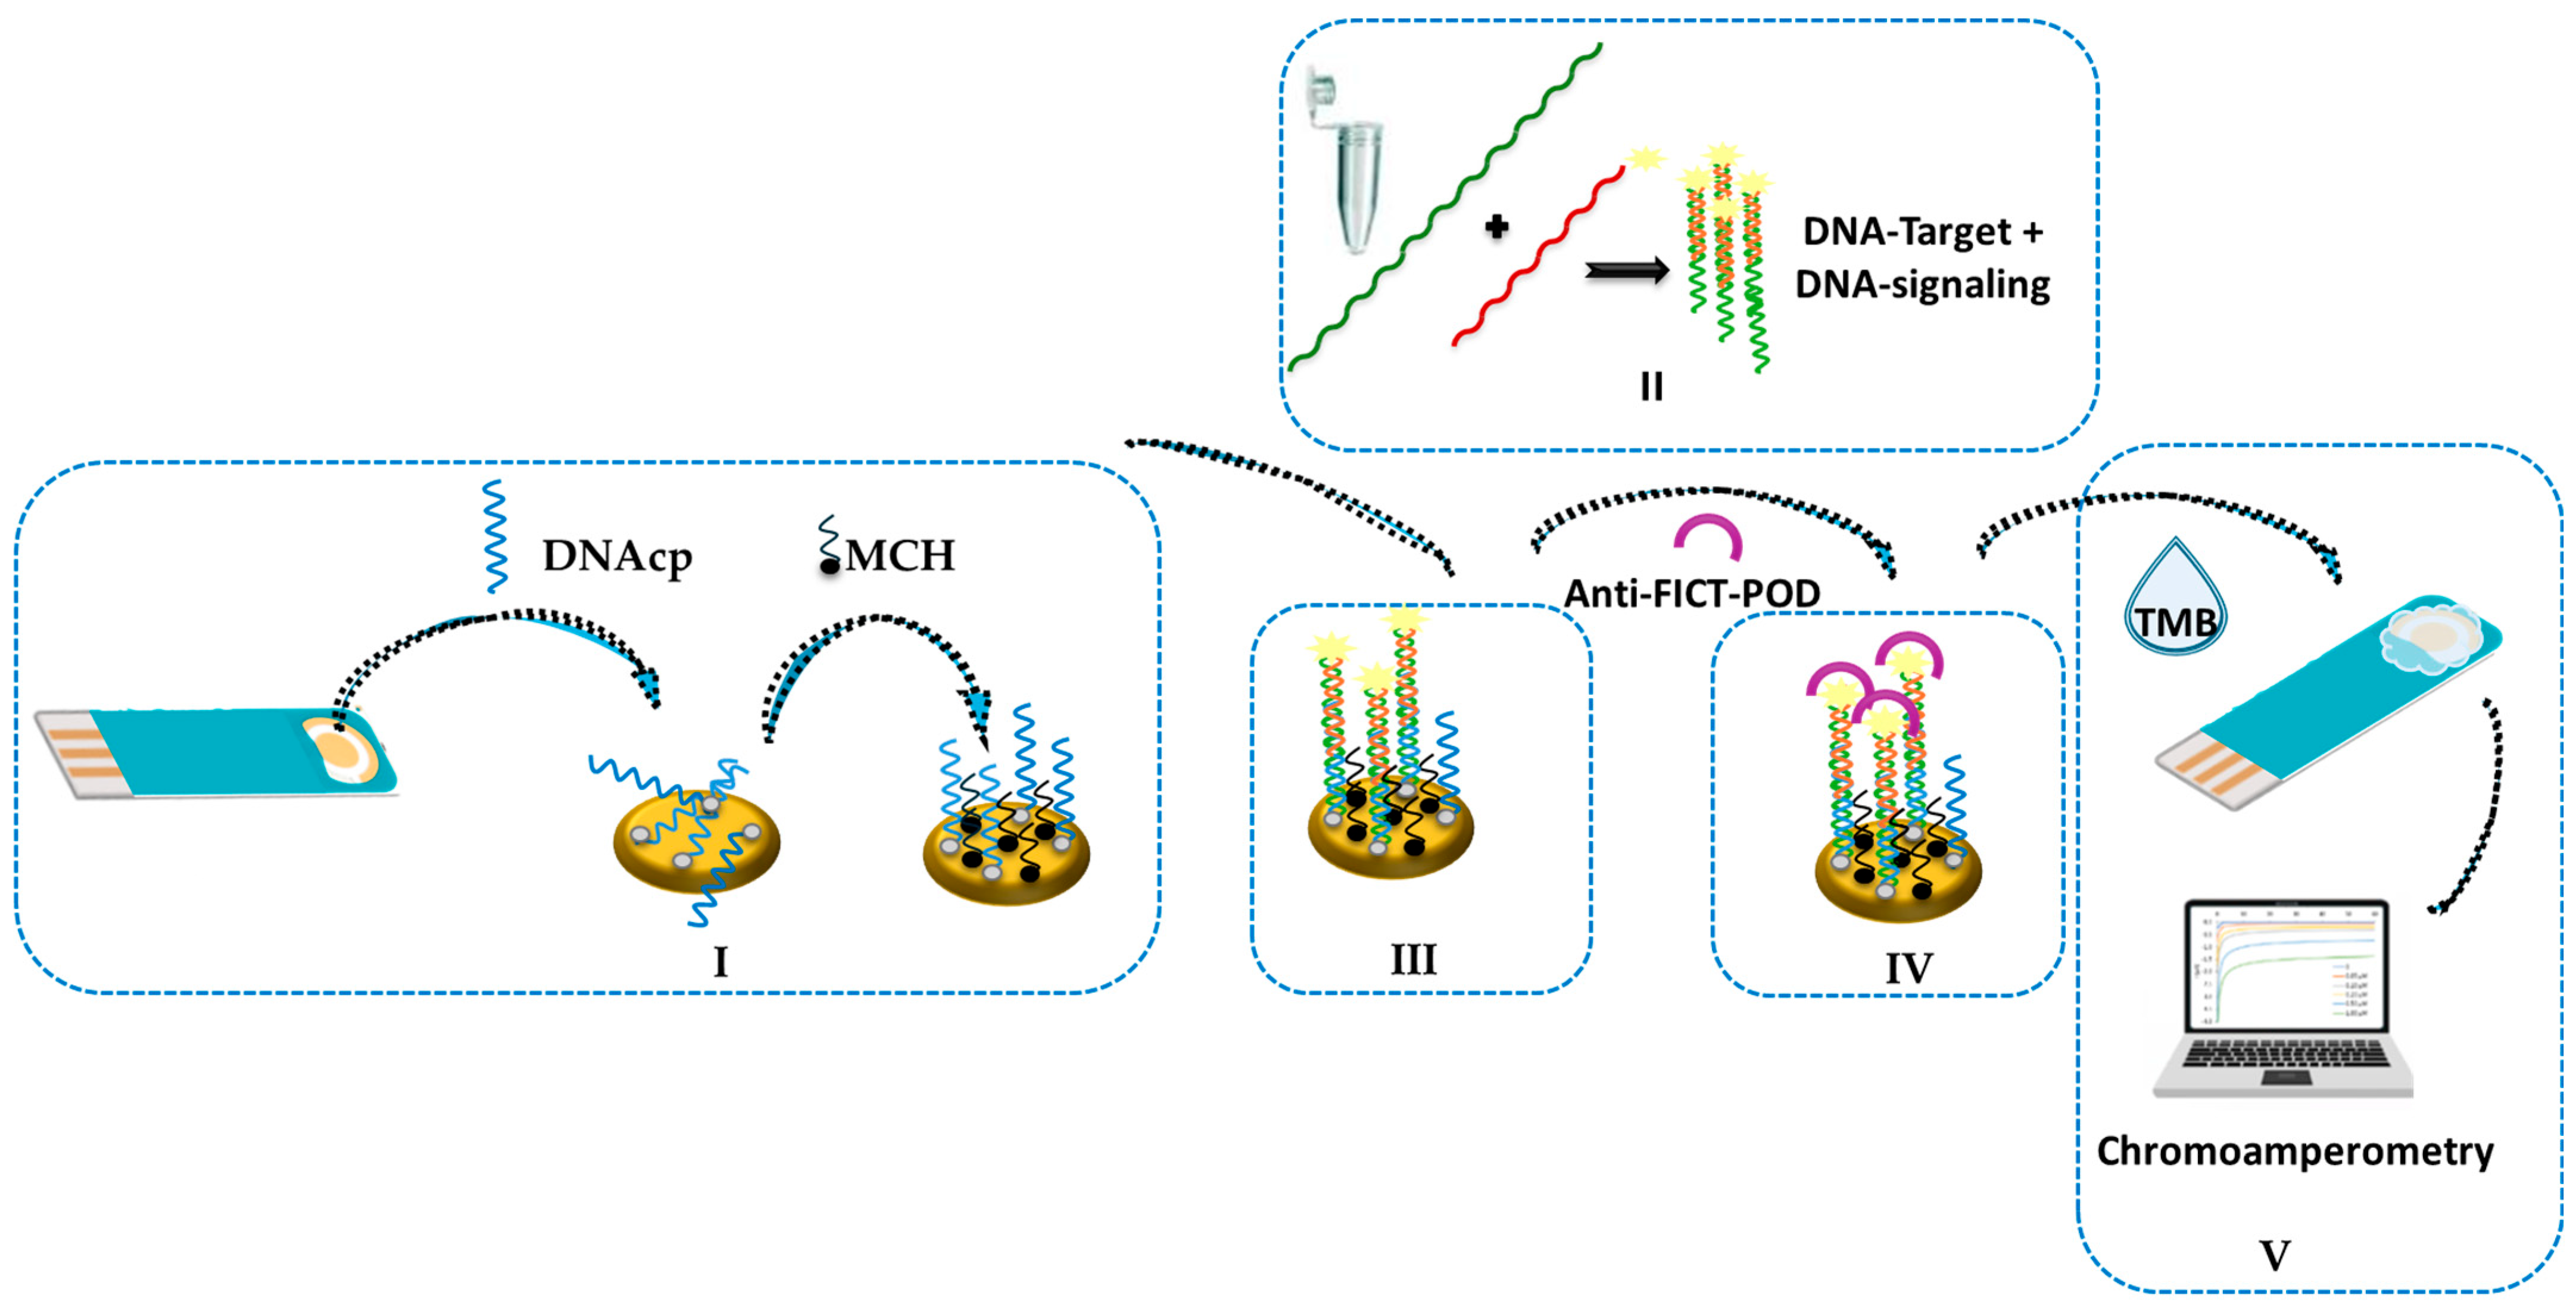
2.3. Electrochemical Genosensor Design

The elaboration of the electrochemical genosensor involved four experimental stages (Scheme 2): a) pre-treatment of the SPGEs; b) formation of a bilayer composed by ssDNA capture probe and MCH onto the gold surface; c) perform a sandwich DNA hybridization format; and d) chronoamperometric readings. The reported electrochemical genosensor was tested in biological samples obtained from the DNA bank of the population of Piauí, Brazil. The protocols used and the sensor preparation are described in detail in the supporting information.

3. Results and Discussion

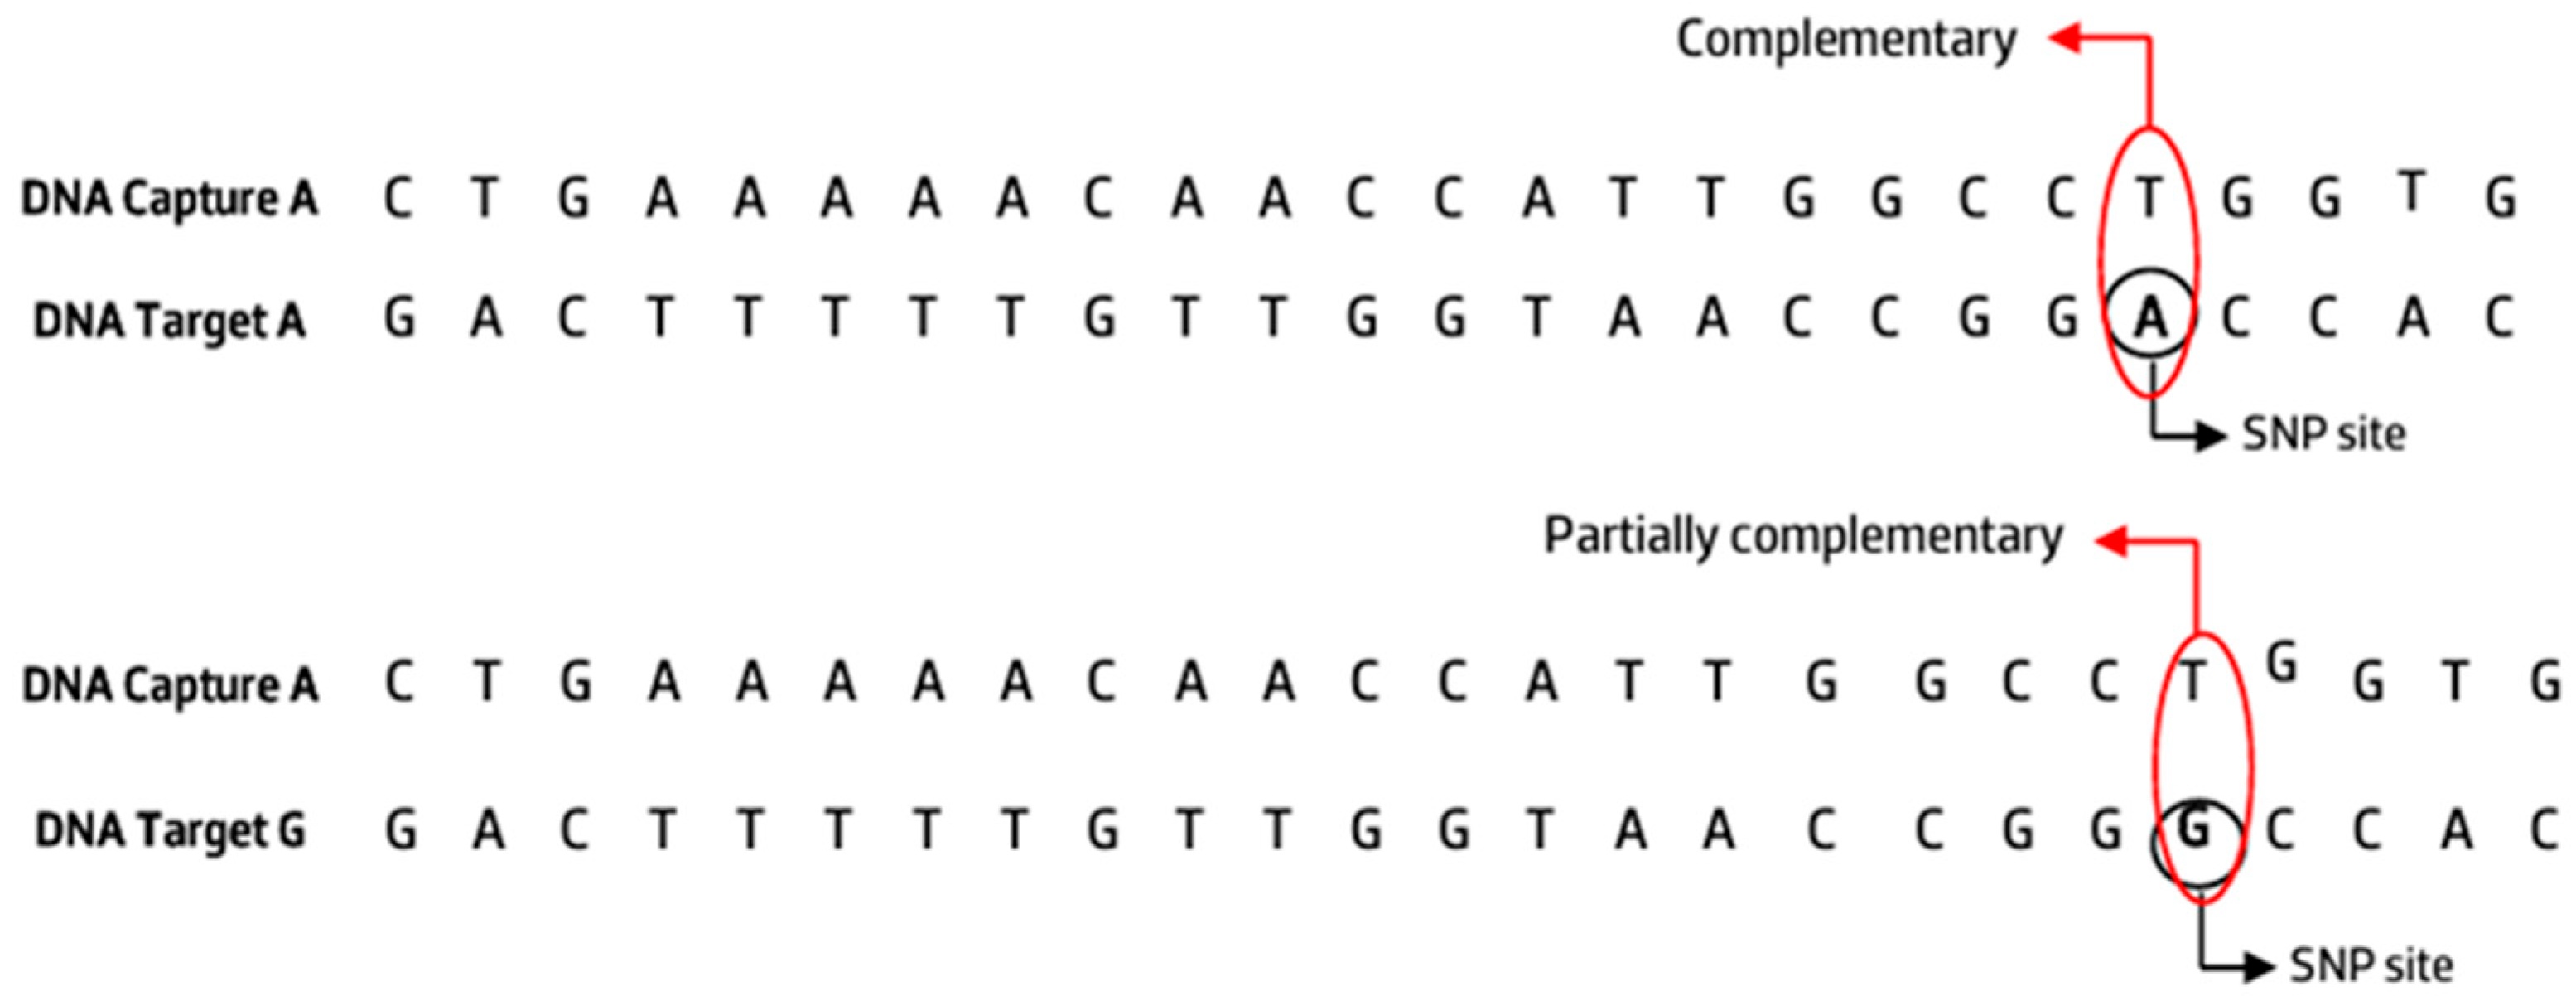
3.1. Selection of the VKORC1 SNP Probes

This work aimed to develop an electrochemical genosensor architecture capable of detecting and discriminating the electrochemical current between two polymorphic sequences (Scheme 3). According to Scheme 3, it is expected that when two DNA sequence are totally complementary (non-variant homozygous alleles), its dsDNA will generate the highest electrochemical currents when compared with the DNA that are not totally complementary (heterozygous and homozygous variant alleles). Thus, the electrical current variation obtained during testing these different situations can be used to detect the presence of SNP in VKORC1. For that, DNA oligonucleotide specific to the VKORC1 wild-type and SNP genetic variations are required. So, in this study, two 52-mer oligonucleotide target sequences were chosen and designed: the DNA-Target A (TA), corresponding to the wild-type genetic allele, and the genetic variant DNA-Target G (TG). DNA sequences (DNA capture, DNA signalling and DNA targets) were designed (Figure S1) and their energy was calculated to minimalize the formation of secondary structures that can impede the hybridization reaction. This evaluation is described in the supporting information.

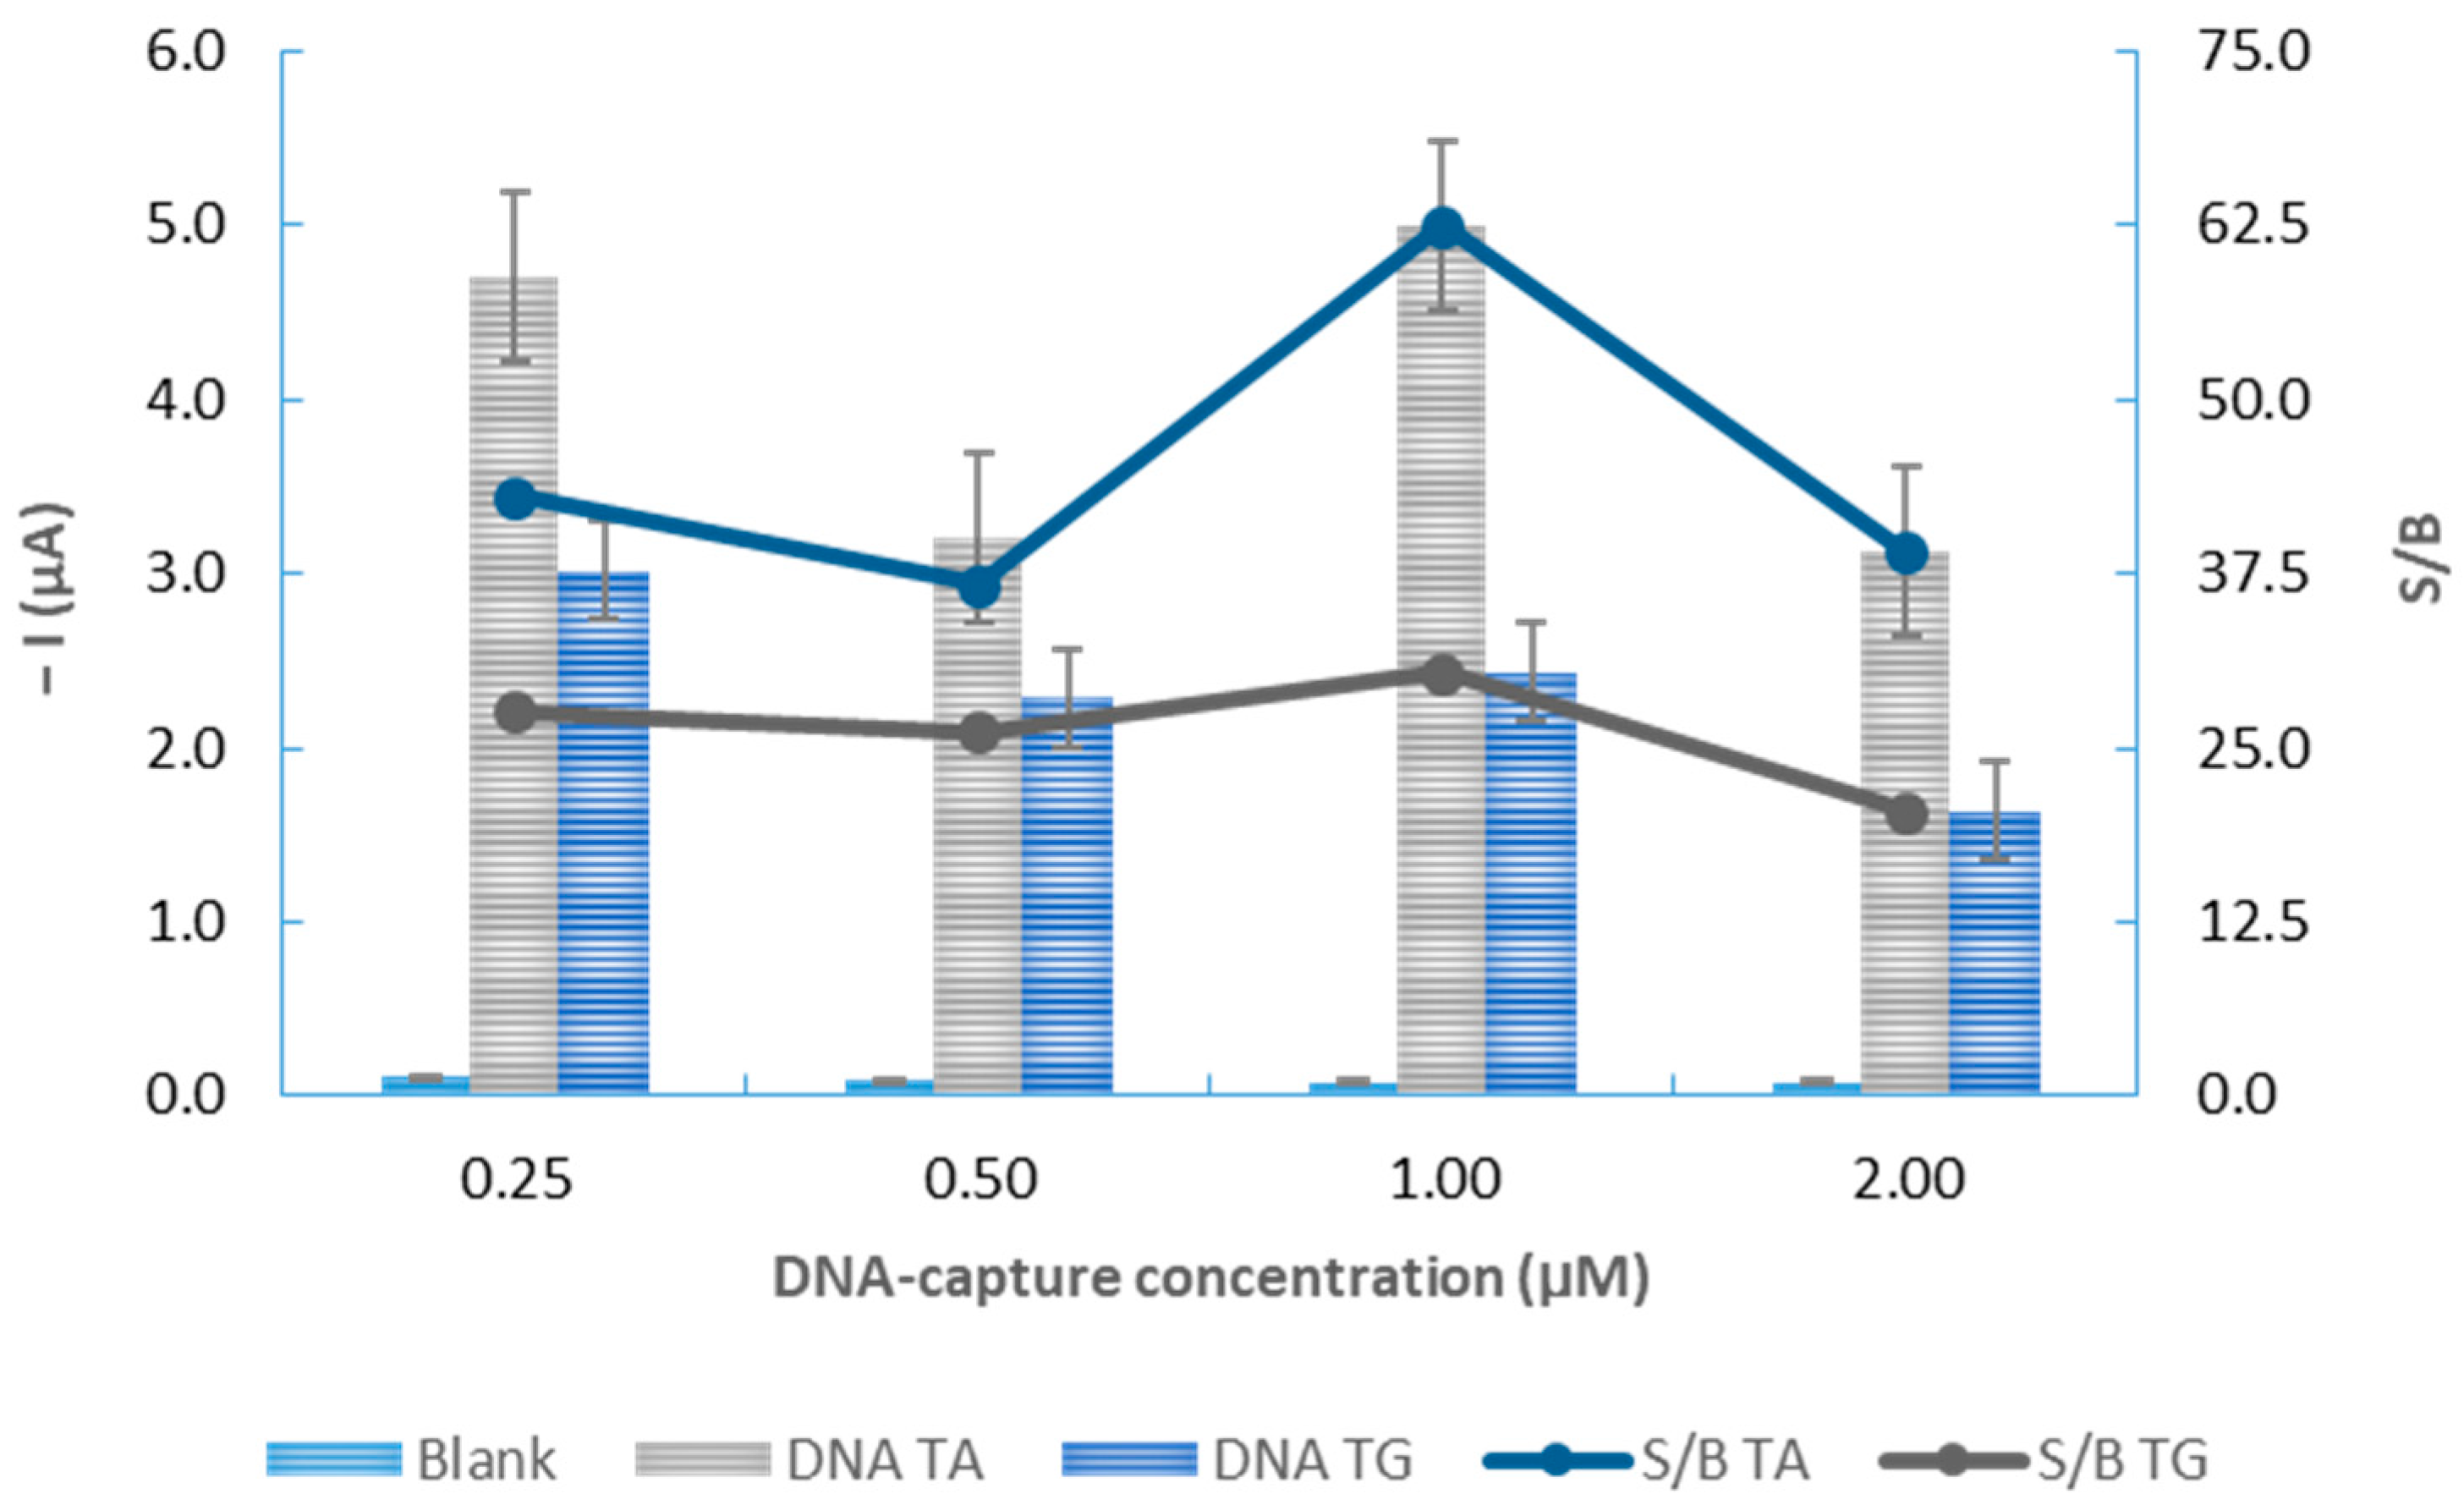
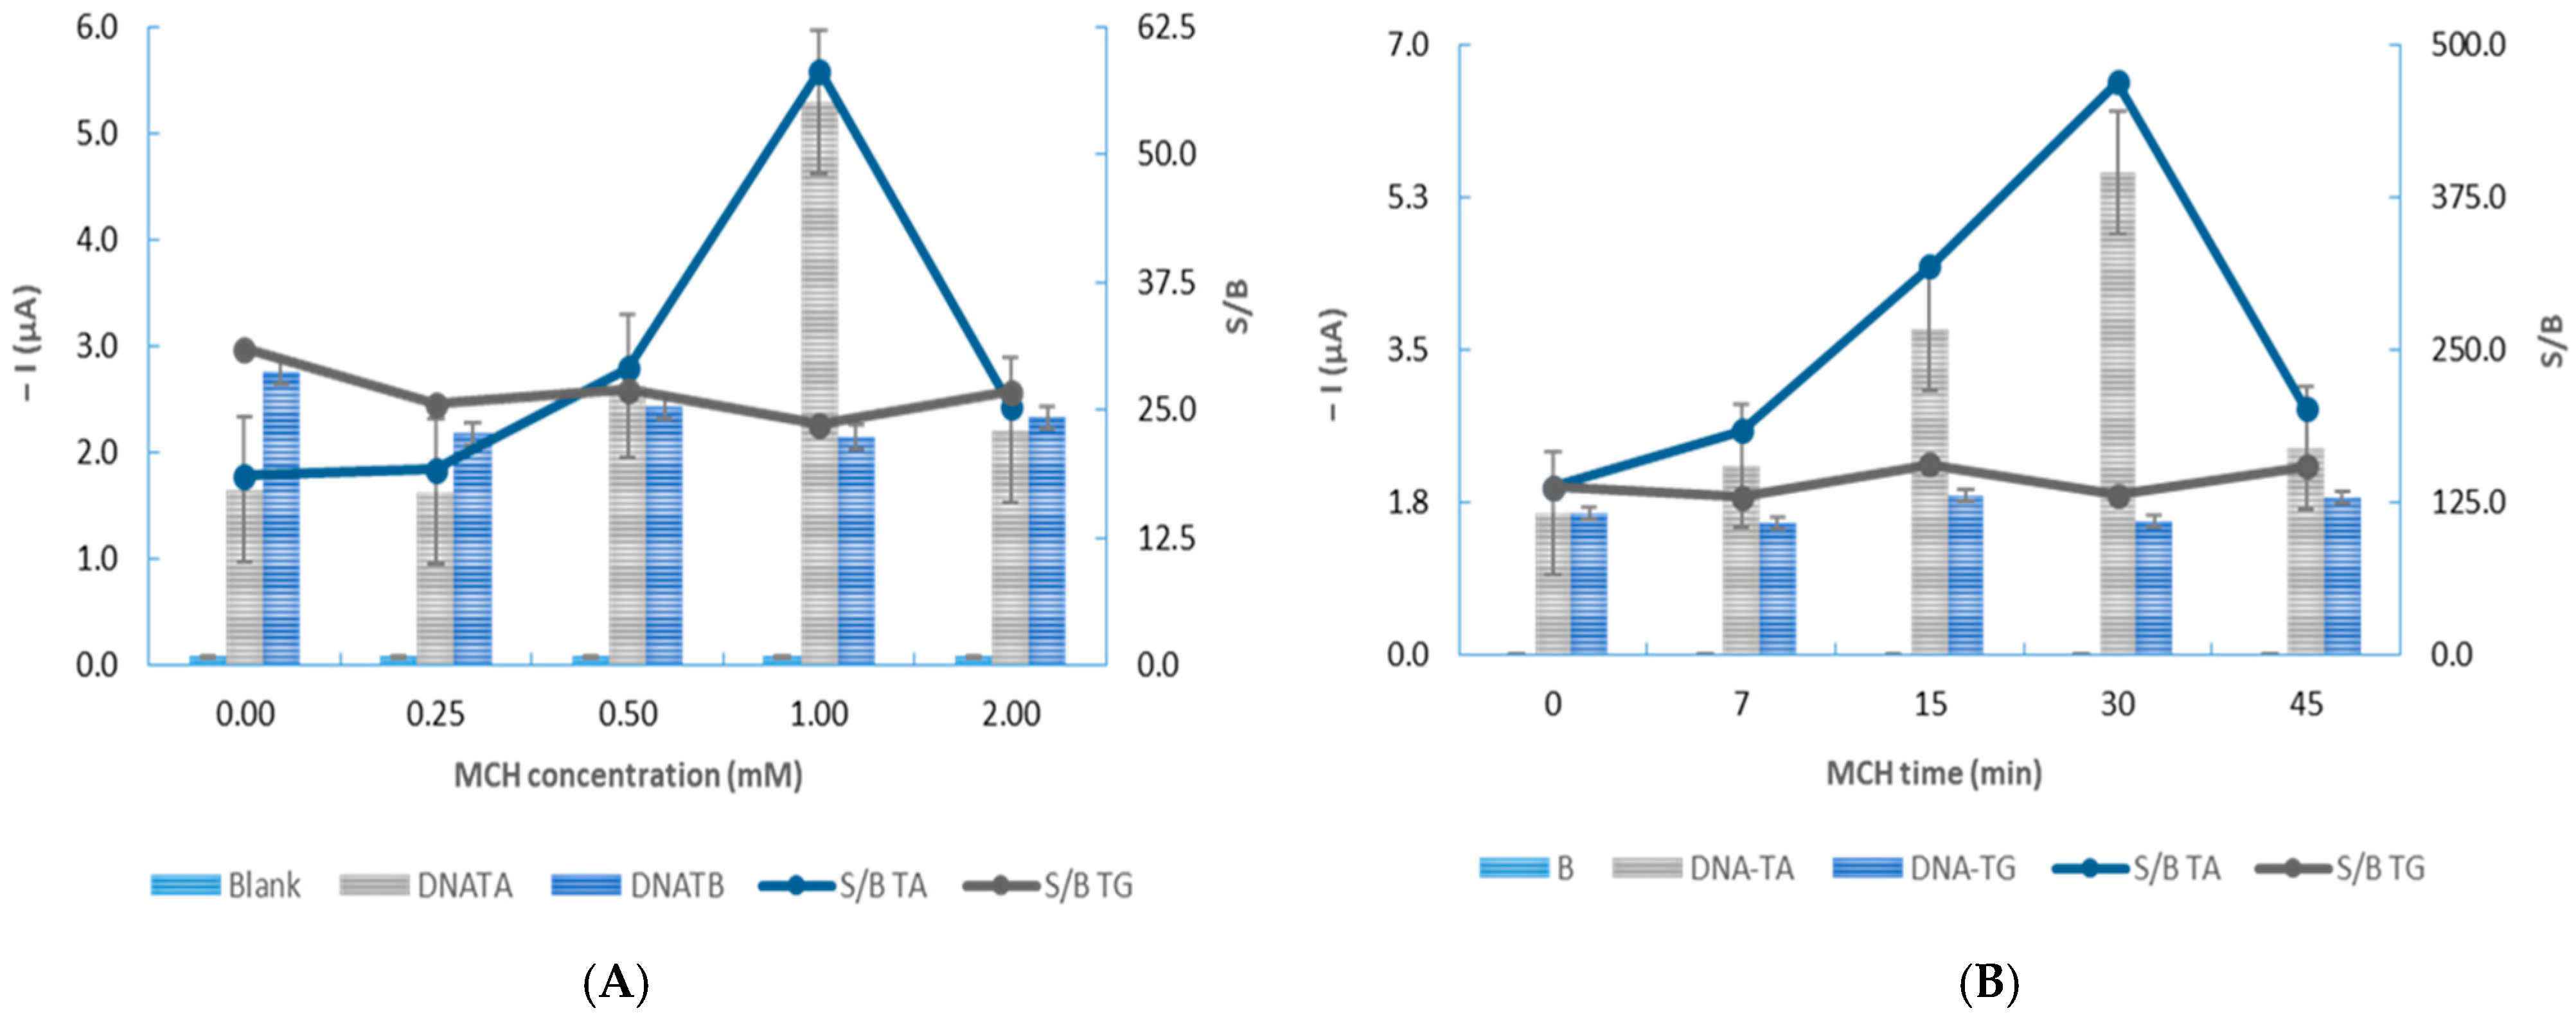
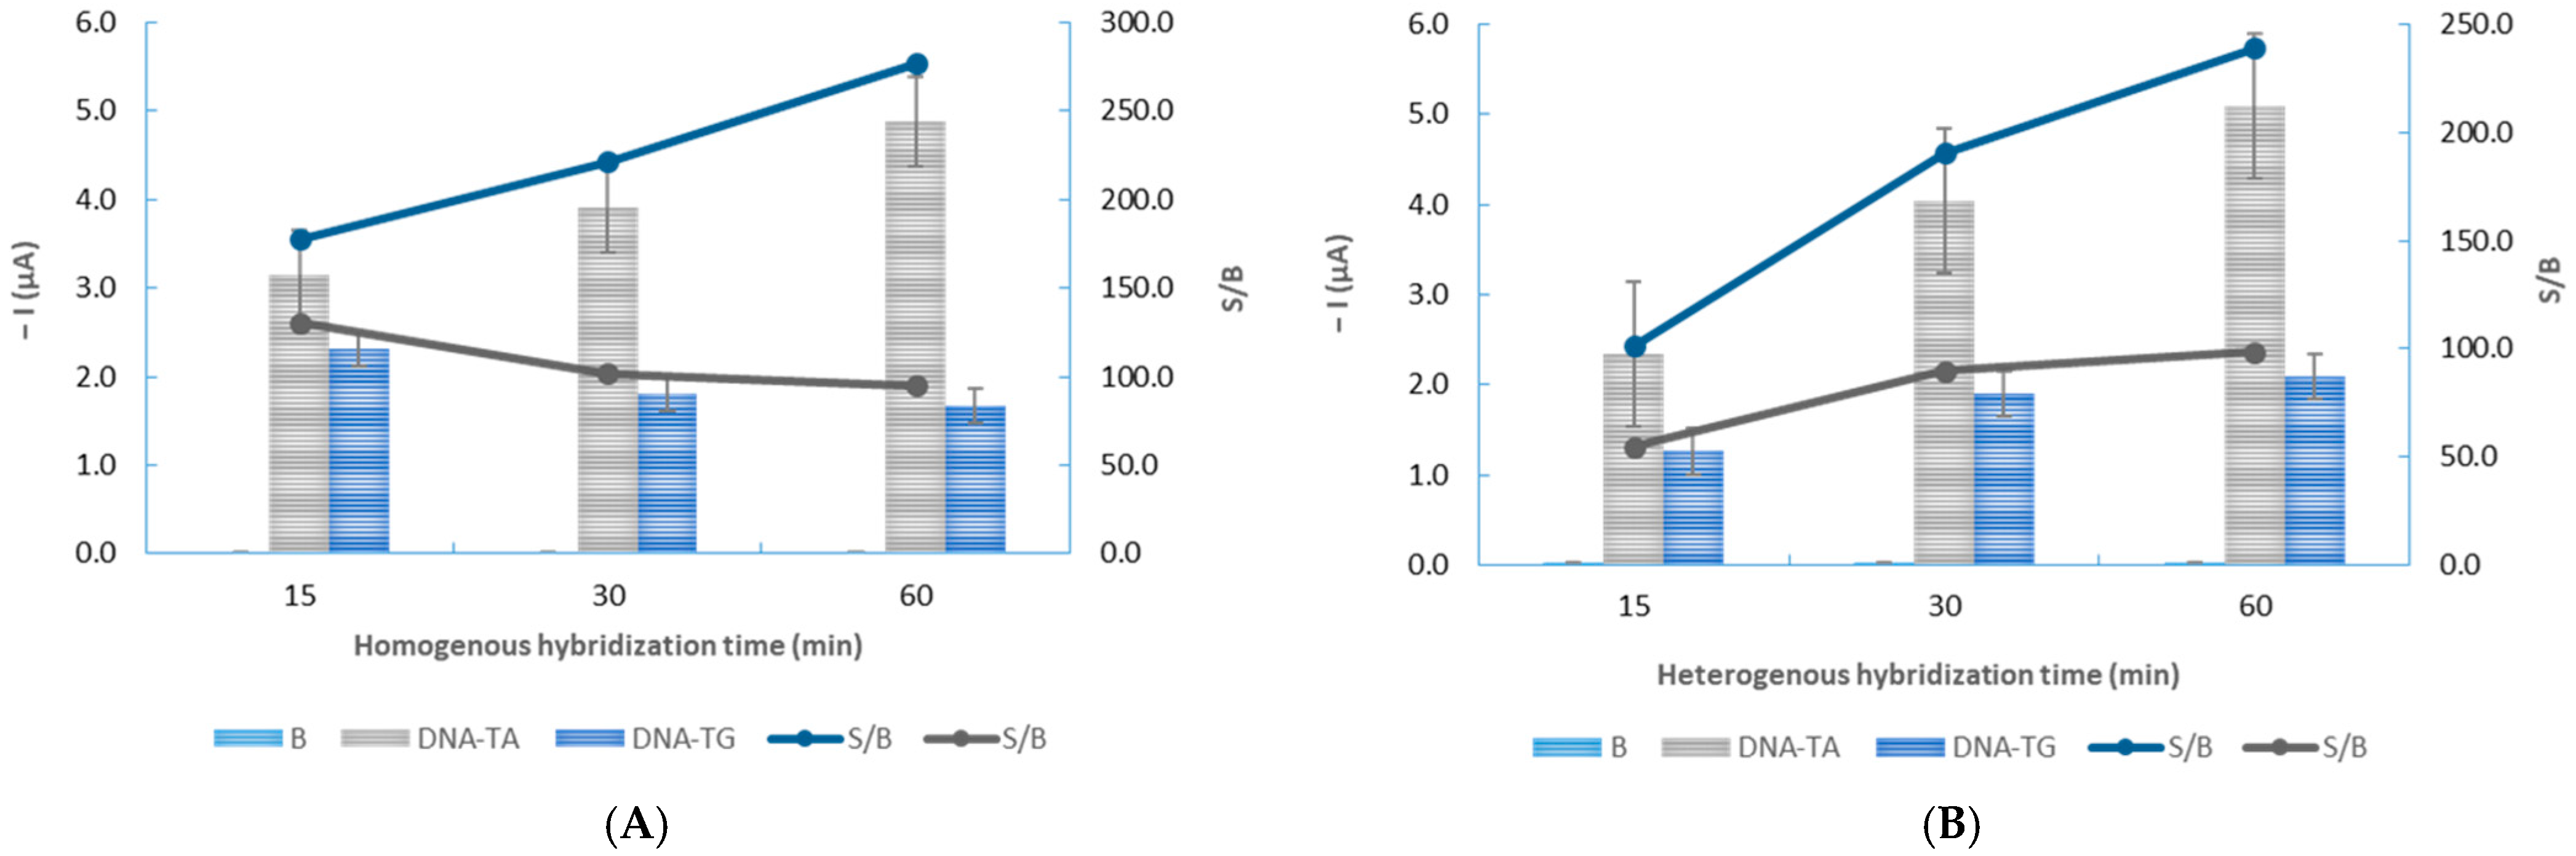
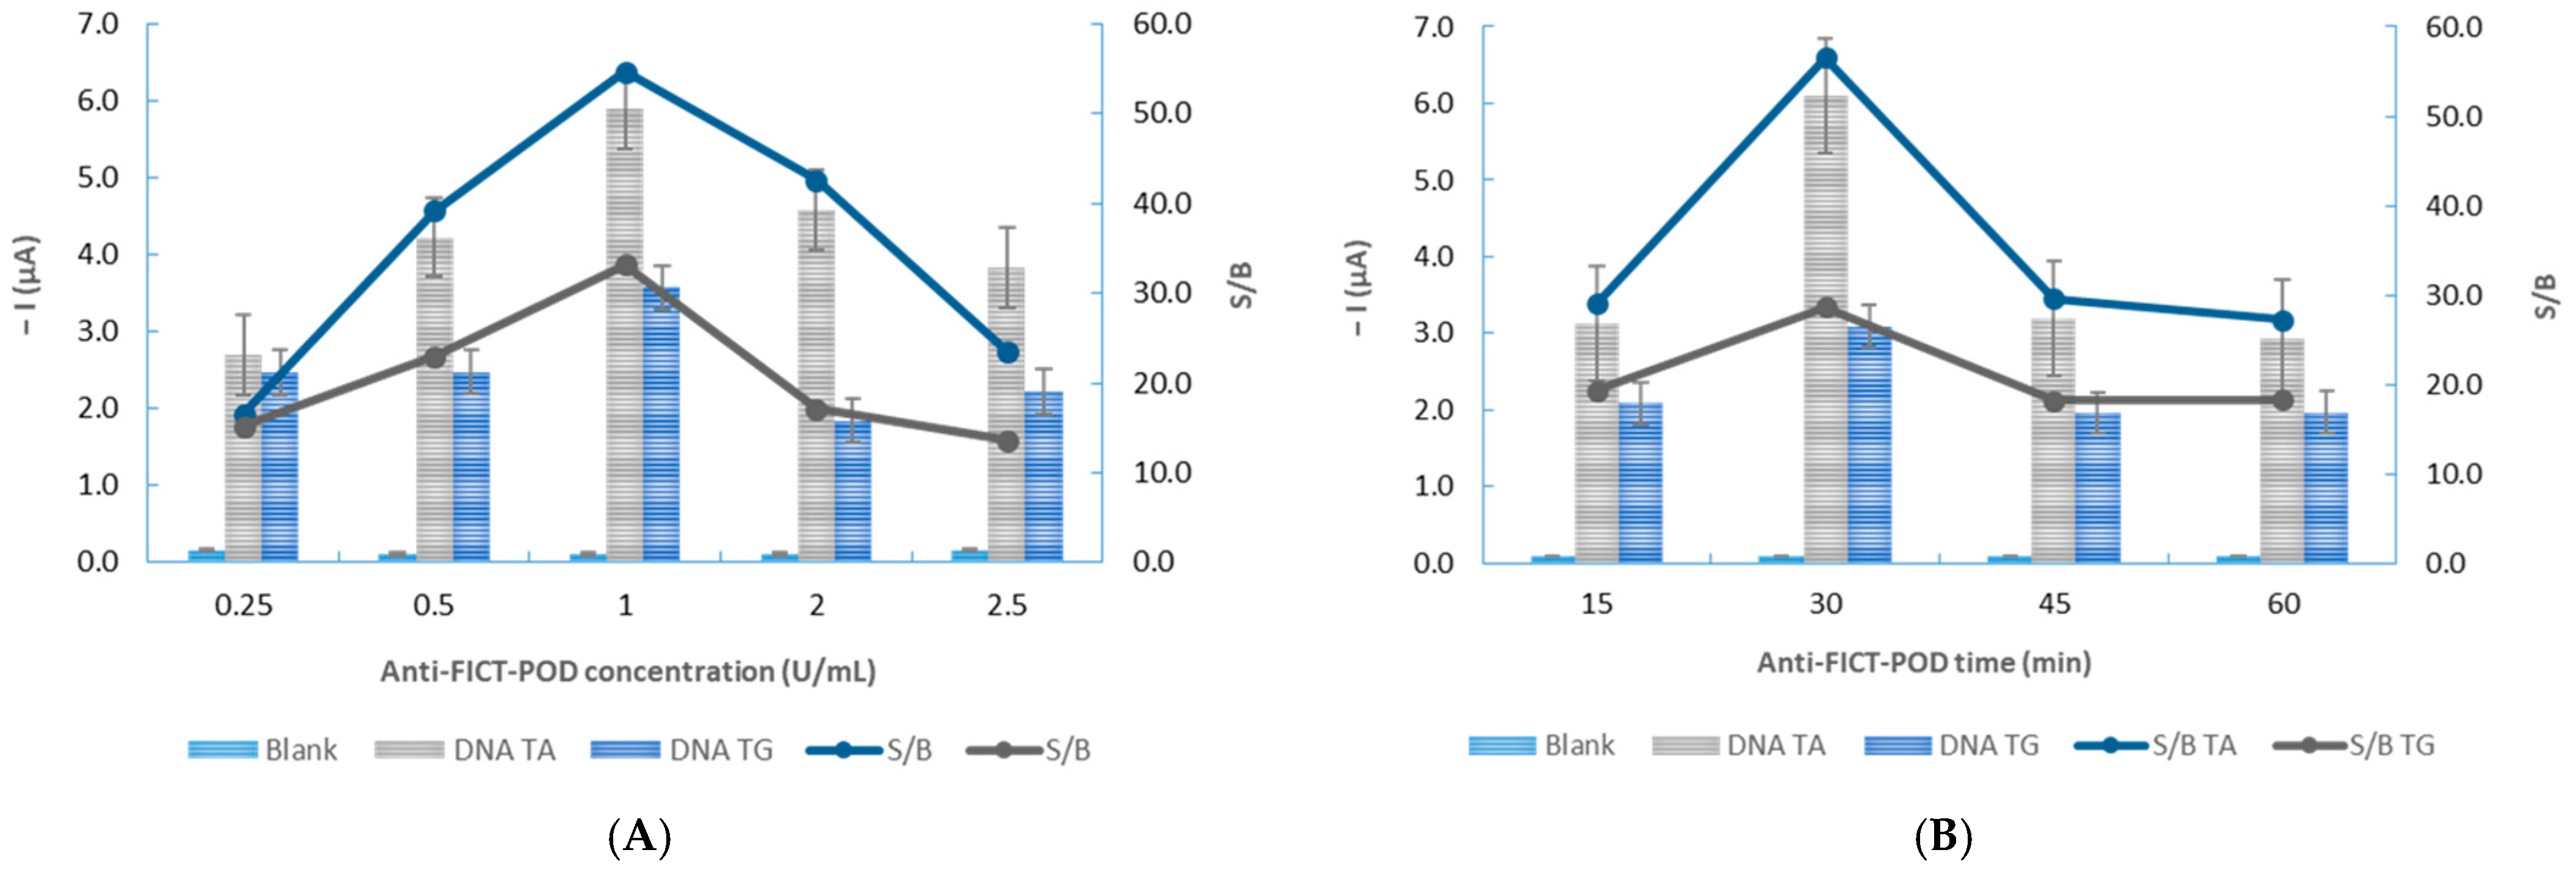
3.2. Optimization of the Experimental Variables

Two distinct electrochemical genosensors were created utilizing DNA-Target A and DNA-Target G as complementary sequences in order to investigate the impact of SNP on the electrochemical hybridization process. As indicated in Scheme 1 and Figure 1, DNA-Target A is completely complementary to the DNA capture probe, but DNA-Target G has one mismatch (at 32 bp, the adenine was replaced by guanine), indicating that it will be only partially complementary. So, for the building of the SNP-specific electrochemical genosensor, two 52-mer oligonucleotide sequences, one with (TA) and another with (TG) VKORC1 gene variation, were chosen (Table 1).
Analyzing Figure 1, it is possible to conclude that chronoamperometric signals were higher (2.74 times higher) when the DNA sequences were totally hybridized (DNA-Target A). So, this electrochemical genosensor can identify and discriminate the presence of a SNP in a DNA sequence.
The analytical features associated with the development of the genosensor device were optimized, such as the DNA, the anti-FICT-POD (antibody anti-fluorescein peroxidase enzyme) and MCH concentrations and the incubation times. The optimal analytical variable was chosen according to different factors, one of them being the highest ratio between the measured chronoamperometry currents for blank (B; does not contain target DNA) and 0.5nM of synthetic ssDNA target (S, signal). This ratio is called the S/B ratio, for signal-to-blank ratio. Some other factors taken into consideration are the chronoamperometric current value of the electrochemical signals and if there is a significant difference between the two DNA targets when it comes to the current value of their electrochemical signals, target A being the one with the higher signal, as it is the complementary DNA target to the DNA-capture probe used.
The first parameter optimized was the DNA-capture probe concentration. To assess the influence of the DNA-capture probe amount in the genosensor performance, different concentrations ranging from 0.25 to 2.00 µM were immobilized onto the surface of the SPGE and the chronoamperometric current intensities were evaluated (Figure 2). Higher concentrations were not tested, as previous studies demonstrated that they intensify nonspecific bindings on the electrode, causing large background currents [15].
As depicted in Figure 2 the highest S/B ratio for the non-variant TA (62.50) and variant TG (30.38) were acquired when 1.00 µM of the DNA-capture probe was applied. Moreover, the highest current intensity (5.35 µA) for the non-variant (TA) allele was also obtained with a 1.00 µM DNA-capture concentration, whereas the highest concentration (3.02 µA) for the variant TG allele was registered with the DNA-capture of 0.25 µM, followed by the 1.00 µM concentration.
Overall, higher intensities were registered with the non-variant TA probe, i.e., the fully complementary sequence presented a higher electrochemical signal than the TG variant probe. For both assays, the 2.00 µM concentration measured the lowest current intensities with an I value of 3.13 µA and 1.64 µA for the TA and TG, respectively. Hereafter, 1.00 μM of the DNA-capture probe will be used to optimize this analytical device.
The formation of a bilayer composed by DNA and MCH at the SPGE was also investigated. For that, the MCH concentration and incubation time ranging from 0.50 to 2.00 mM and 0 to 45 min were tested, respectively (Figure 3). The MCH was applied onto the electrochemical biosensor because MCH functions as a blocking agent and a spacer. As a blocking agent, MCH minimizes the non-specific interactions between the DNA bioreceptor and other molecules on the SPGE surface, improving the signal-to-noise ratio. As a spacer agent, MCH regulates the orientation of the DNA bioreceptors, allowing for better loading and interaction with the target analyte, improving the efficacy of the heterogenous hybridization.
The non-variant TA allele presented the higher current intensities overall. Analyzing Figure 3A, it is possible to verify that using 1.00 μM MCH (S/B 58.24) (Figure 3A). It obtained the highest Inc and S/B ratio. Furthermore, the lowest value (I = 1.65 µA) was registered in the absence of MCH, whereas the highest value (I = 5.53 µA) was found with 1.00 mM of MCH.
Regarding the variation TG alleles, the overall chronoamperometric current values remained comparatively constant. One interesting fact is that, contrary to the non-variant sequence, the highest S/B ratio (S/B = 31.01) and current value (I = 1.84 µA) were observed in the absence of MCH (Figure 3A).
Addressing the MCH incubation time, the optimal I and S/B ratio values for TA were obtained during 30 min of incubation (I = 5.36 µA and S/B = 470.02) (Figure 3B). After 15 min, the maximum S/B ratio and current intensity were noted for the probe containing our SNP (TG) (S/B = 156.17 and 1.84 µA, respectively).
These results indicate that increasing the MCH concentration resulted in higher current values as well as a more significant distinction between the signals read in the two different targets. So, 1 mM MCH and an incubation time of 30 min was used for the following experimental steps.
Maintaining the previously chosen optimized parameters three different times—15 min, 30 min and 60 min—for both the homogenous (Figure 4A) and heterogeneous (Figure 4B) hybridization, incubation times were tested.
According to the results presented in Figure 4A, TA and TG displayed contrary responses to one another, i.e., while the increasing incubation time produced higher S/B ratios and current intensities for TA, the passing time translated to a loss of signal for the TG variant. Thus, the best S/B ratio for the homogeneous incubation time was obtained for the non-variant TA probe after 60 min (S/B = 276.70). The same can be said for TA’s current intensity, with an intensity value of 4.89 µA. On the other hand, the best S/B ratio (S/B = 130.45) and current intensity (I = 2.30 µA) for the TG sequence was registered after 15 min.
Meanwhile, for the heterogeneous hybridization (Figure 4B), both sequences acquired higher S/B ratios and chronoamperometric signal values the longer the incubation time. The highest S/B ratio (S/B = 239.04) as well as the highest current intensities (5.09 µA) were obtained with a 60-min incubation period for TA. Since this heterogeneous hybridization incubation time also presented higher current intensities for TA than TG, an incubation period of 60 min was selected as the incubation time for both the homogeneous and heterogeneous hybridization incubation times to use in following optimizations.
Nonetheless, during the homogenous hybridization, the partial hybridization between the DNA-Target probe and the DNA signalling probe was performed. So, to verify the effect of the DNA-signalling probe on the genosensor performance current intensity, three different DNA signalling concentrations, ranging from 0.15 µM to 0.50 µM, were tested (Figure 5).
As seen in Figure 5, increasing the concentration of the DNA-signalling probe resulted in a decrease in the current intensity. Nevertheless, the concentration with the highest S/B ratio (194.51 for TA) was detected when 0.50 µM of the DNA-signalling probe was used. Whereas the TG assay with the lowest S/B ratio (75.93), as well as the smallest intensity (1.36 µA), was also observed when 0.50 µM DNA-signalling was used.
In addition, the TA and TG S/B ratios and chronoamperometric signals for both the 0.15 and 0.25 µM concentrations are awfully close (Figure 5). So, in this case, three parameters, namely the intensity of the electrochemical signals, S/B ratio and the difference between TA and TG’s signal intensity, were taken into consideration when selecting which concentration should be used for the following optimizations.
Therefore, although the 0.50 µM DNA-signalling concentration presents the lowest current intensities (3.48 µA), it was chosen as it has the highest TA S/B ratio as well as the biggest difference between the TA and TG DNA-Target intensities (TA/TG = 2.56). Hence, the following optimizations were performed with a 0.50 µM concentration for the DNA-signalling probe.
Next the influence of the antibody, i.e., anti-FITC-POD enzymes, concentration and incubation time, on the chronoamperometric signal was examined. To evaluate its impact on the genosensor’s performance, various amounts of the antibody, ranging from 0.25 to 2.5 U/mL (Figure 6A), were incubated over extended periods of time: 15 to 60 min (Figure 6B).
As observed in Figure 6A, higher S/B ratios (as well as the highest I) were calculated until 1.00 U/mL of the antibody was utilized to the modified DNA duplex, SPGE. Afterwards, for the 2.00 and 2.50 U/mL concentrations, there is a visible chronoamperometric current decrease for both target probes. So, the highest S/B ratio and electrical signal were measured when 1.00 U/mL was employed, with a S/B ratio of 54.67 and an I of 5.89 µA for TA and a S/B ratio of 33.17 and I = 3.58 for TG. Thus, the selected concentration of Anti-FIT-POD for the genosensor was 1.00 U/mL.
For the anti-FICT-POD incubation time (Figure 6B), the best results (highest S/B ratio, chronoamperometric signals and difference between TA and TG probes) were calculated after an incubation period of 30 min; TA and TG presented a S/B ratio of 56.60 and 28.67 and a current intensity of 6.10 and 3.09, respectively, with a TA/TG of 1.97.
Coincidently, all the other registered times exhibited similar intensities. The 45 min assay presented the second greatest S/B ratio (S/B.TA = 29.66 and S/B.TG = 18.25) and current intensity for both targets (3.20 and 1.97 µA for TA and TG, respectively), followed by the 15 min incubation period and the 60 min incubation, which registered the lowest TA value for all three parameters (S/B ratio, current intensity and difference between TA and TG). Table 2 presents a summary of the tested and selected variables for the genosensor design.

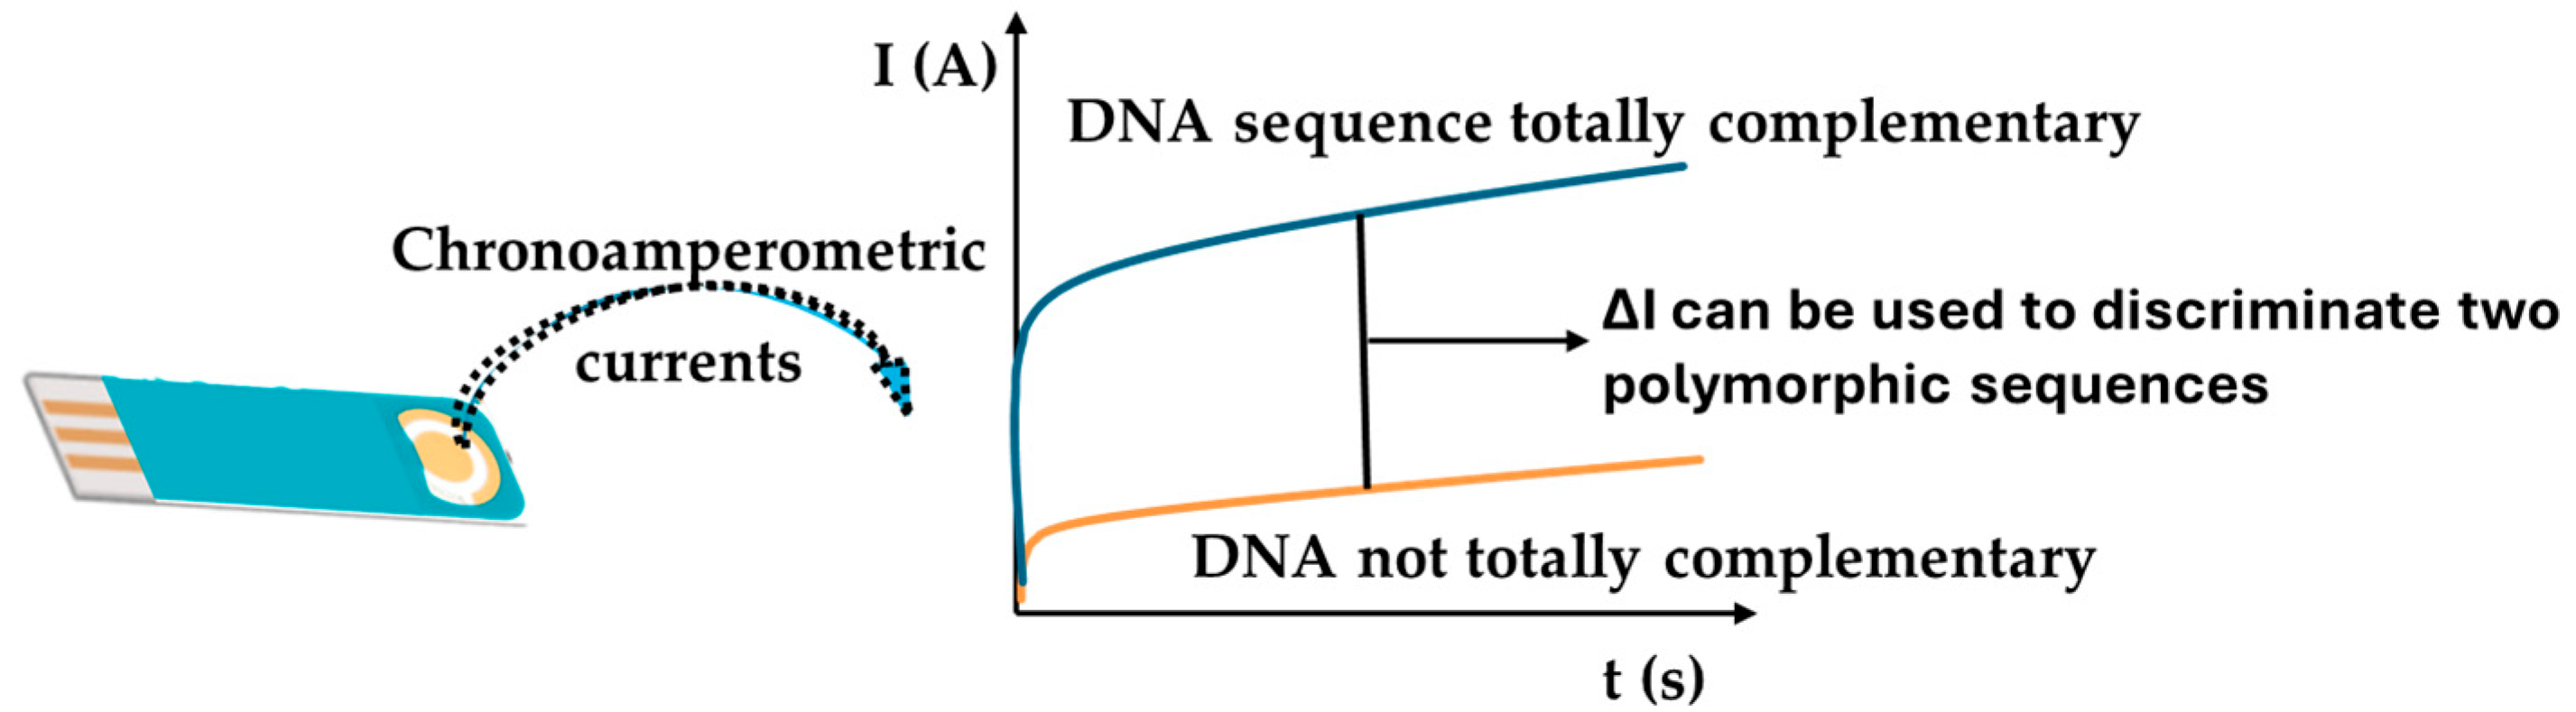
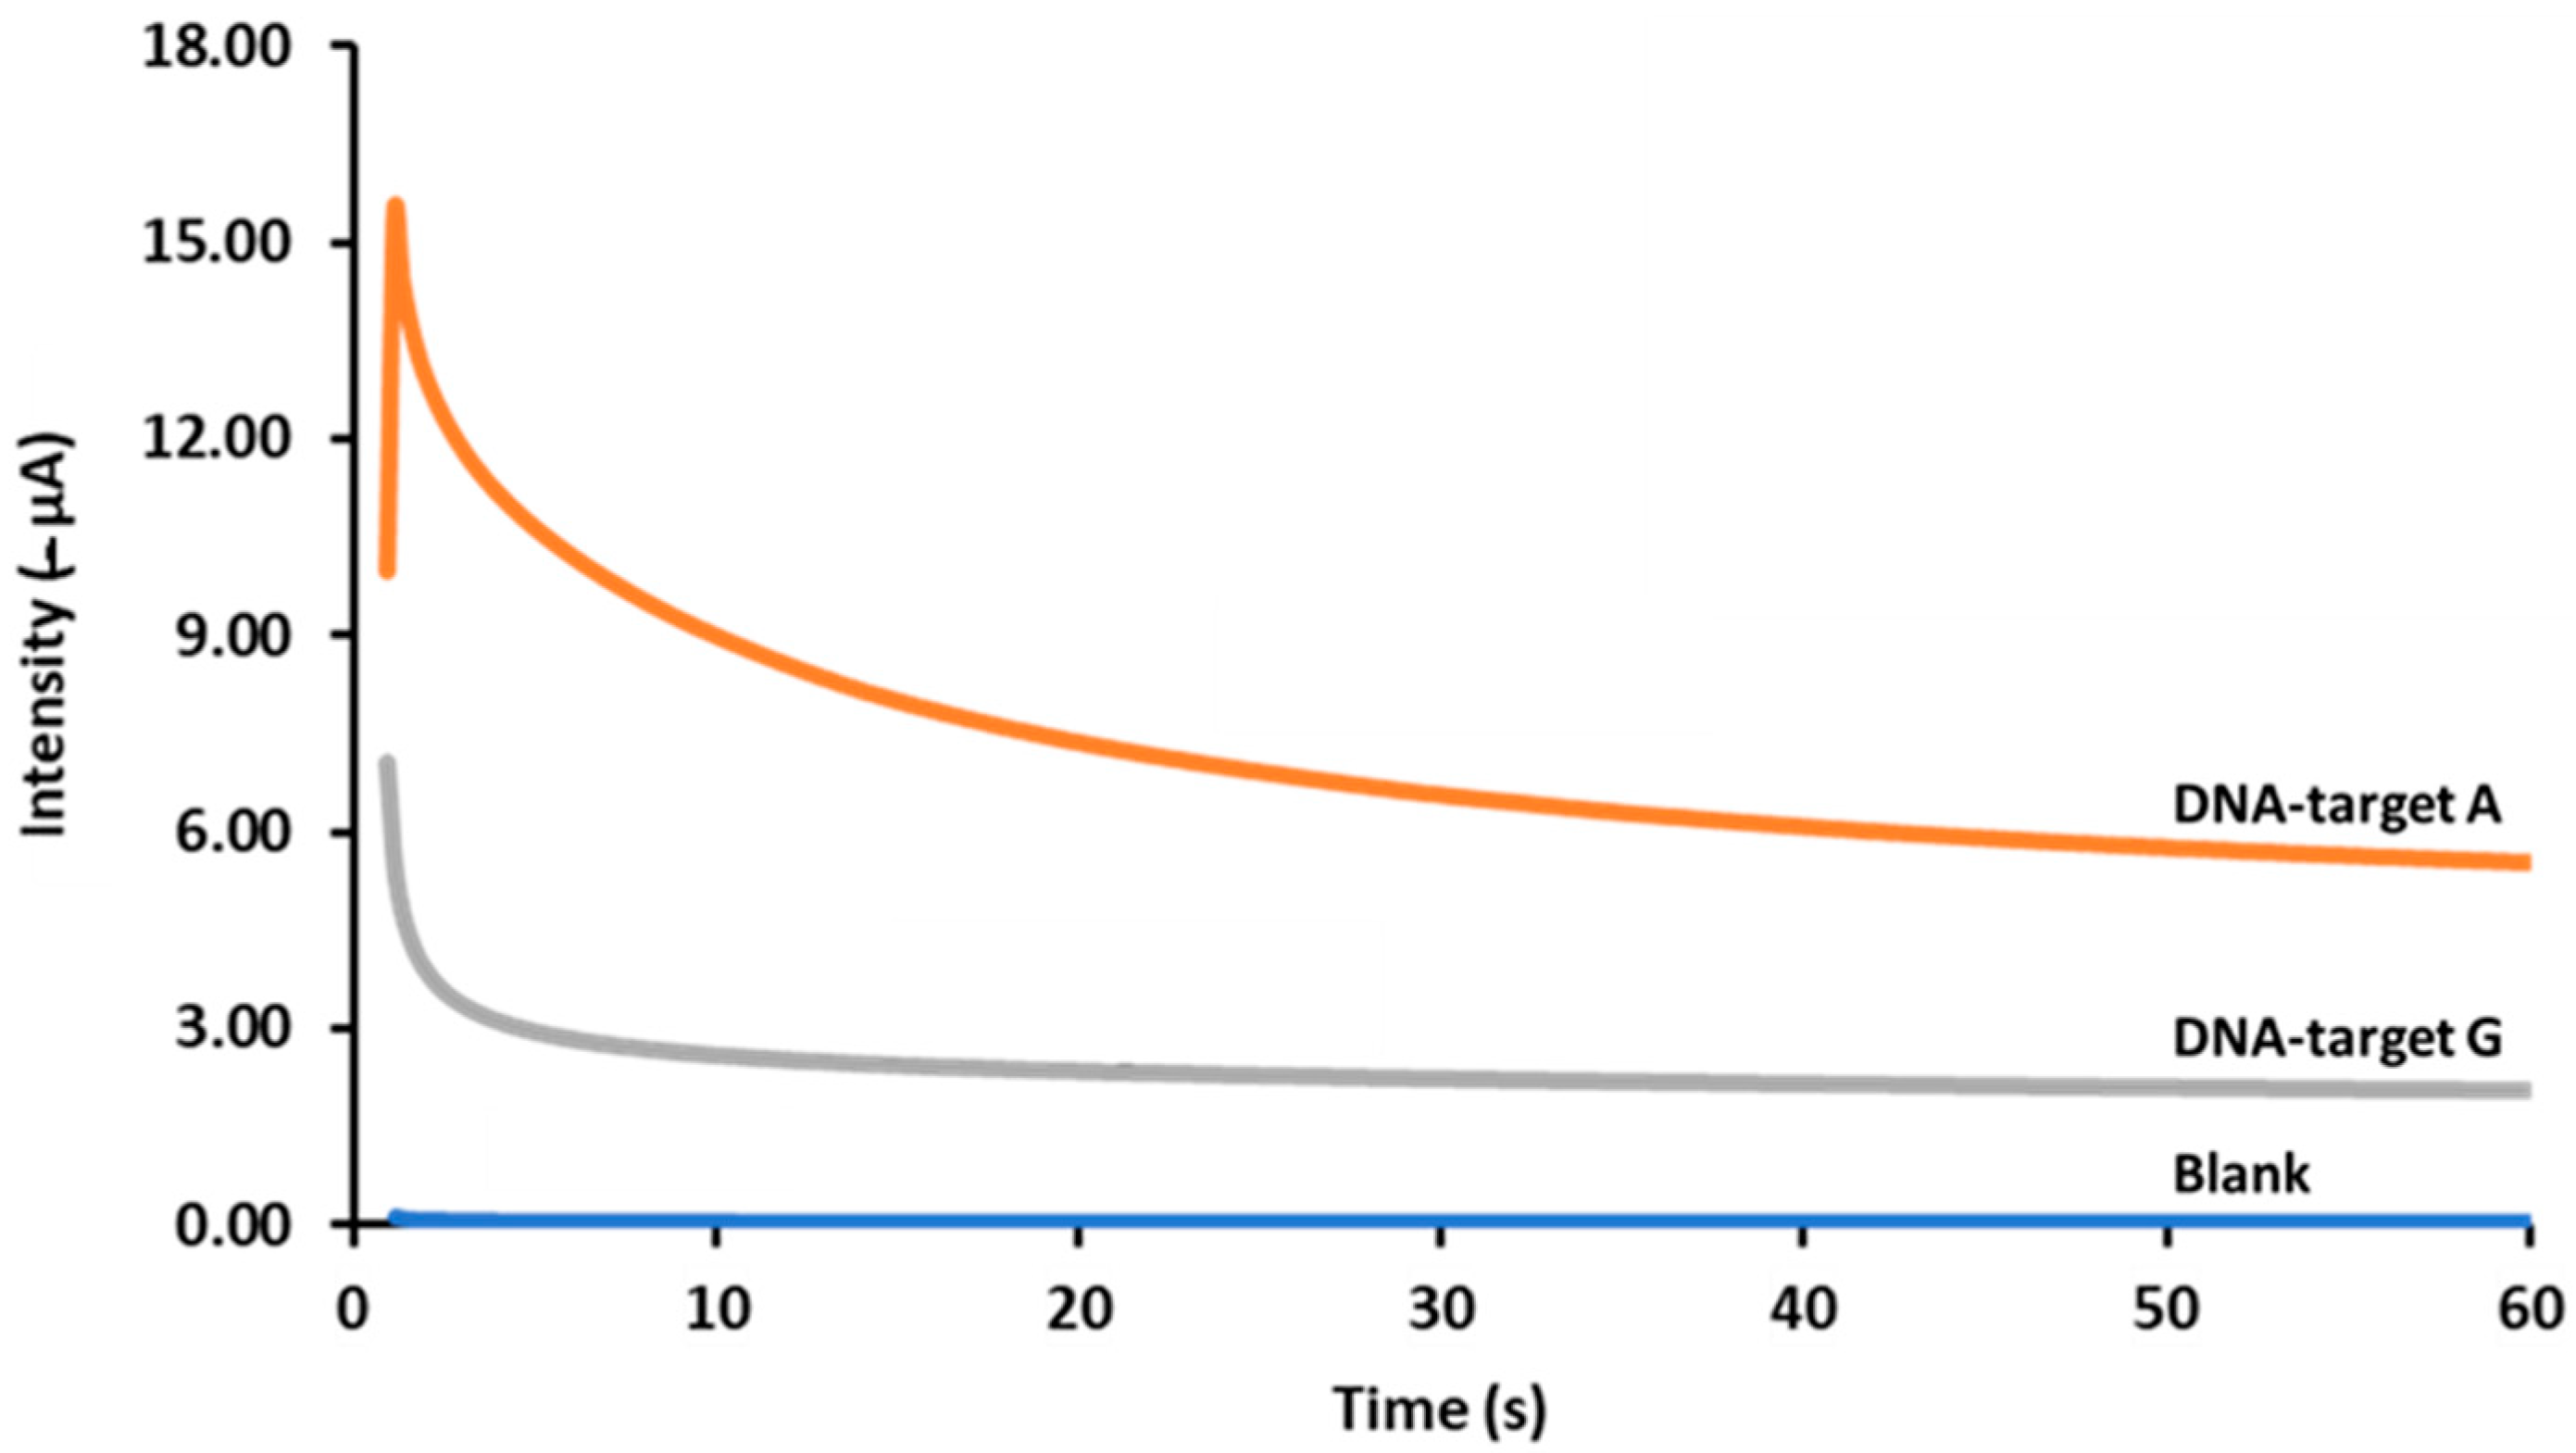
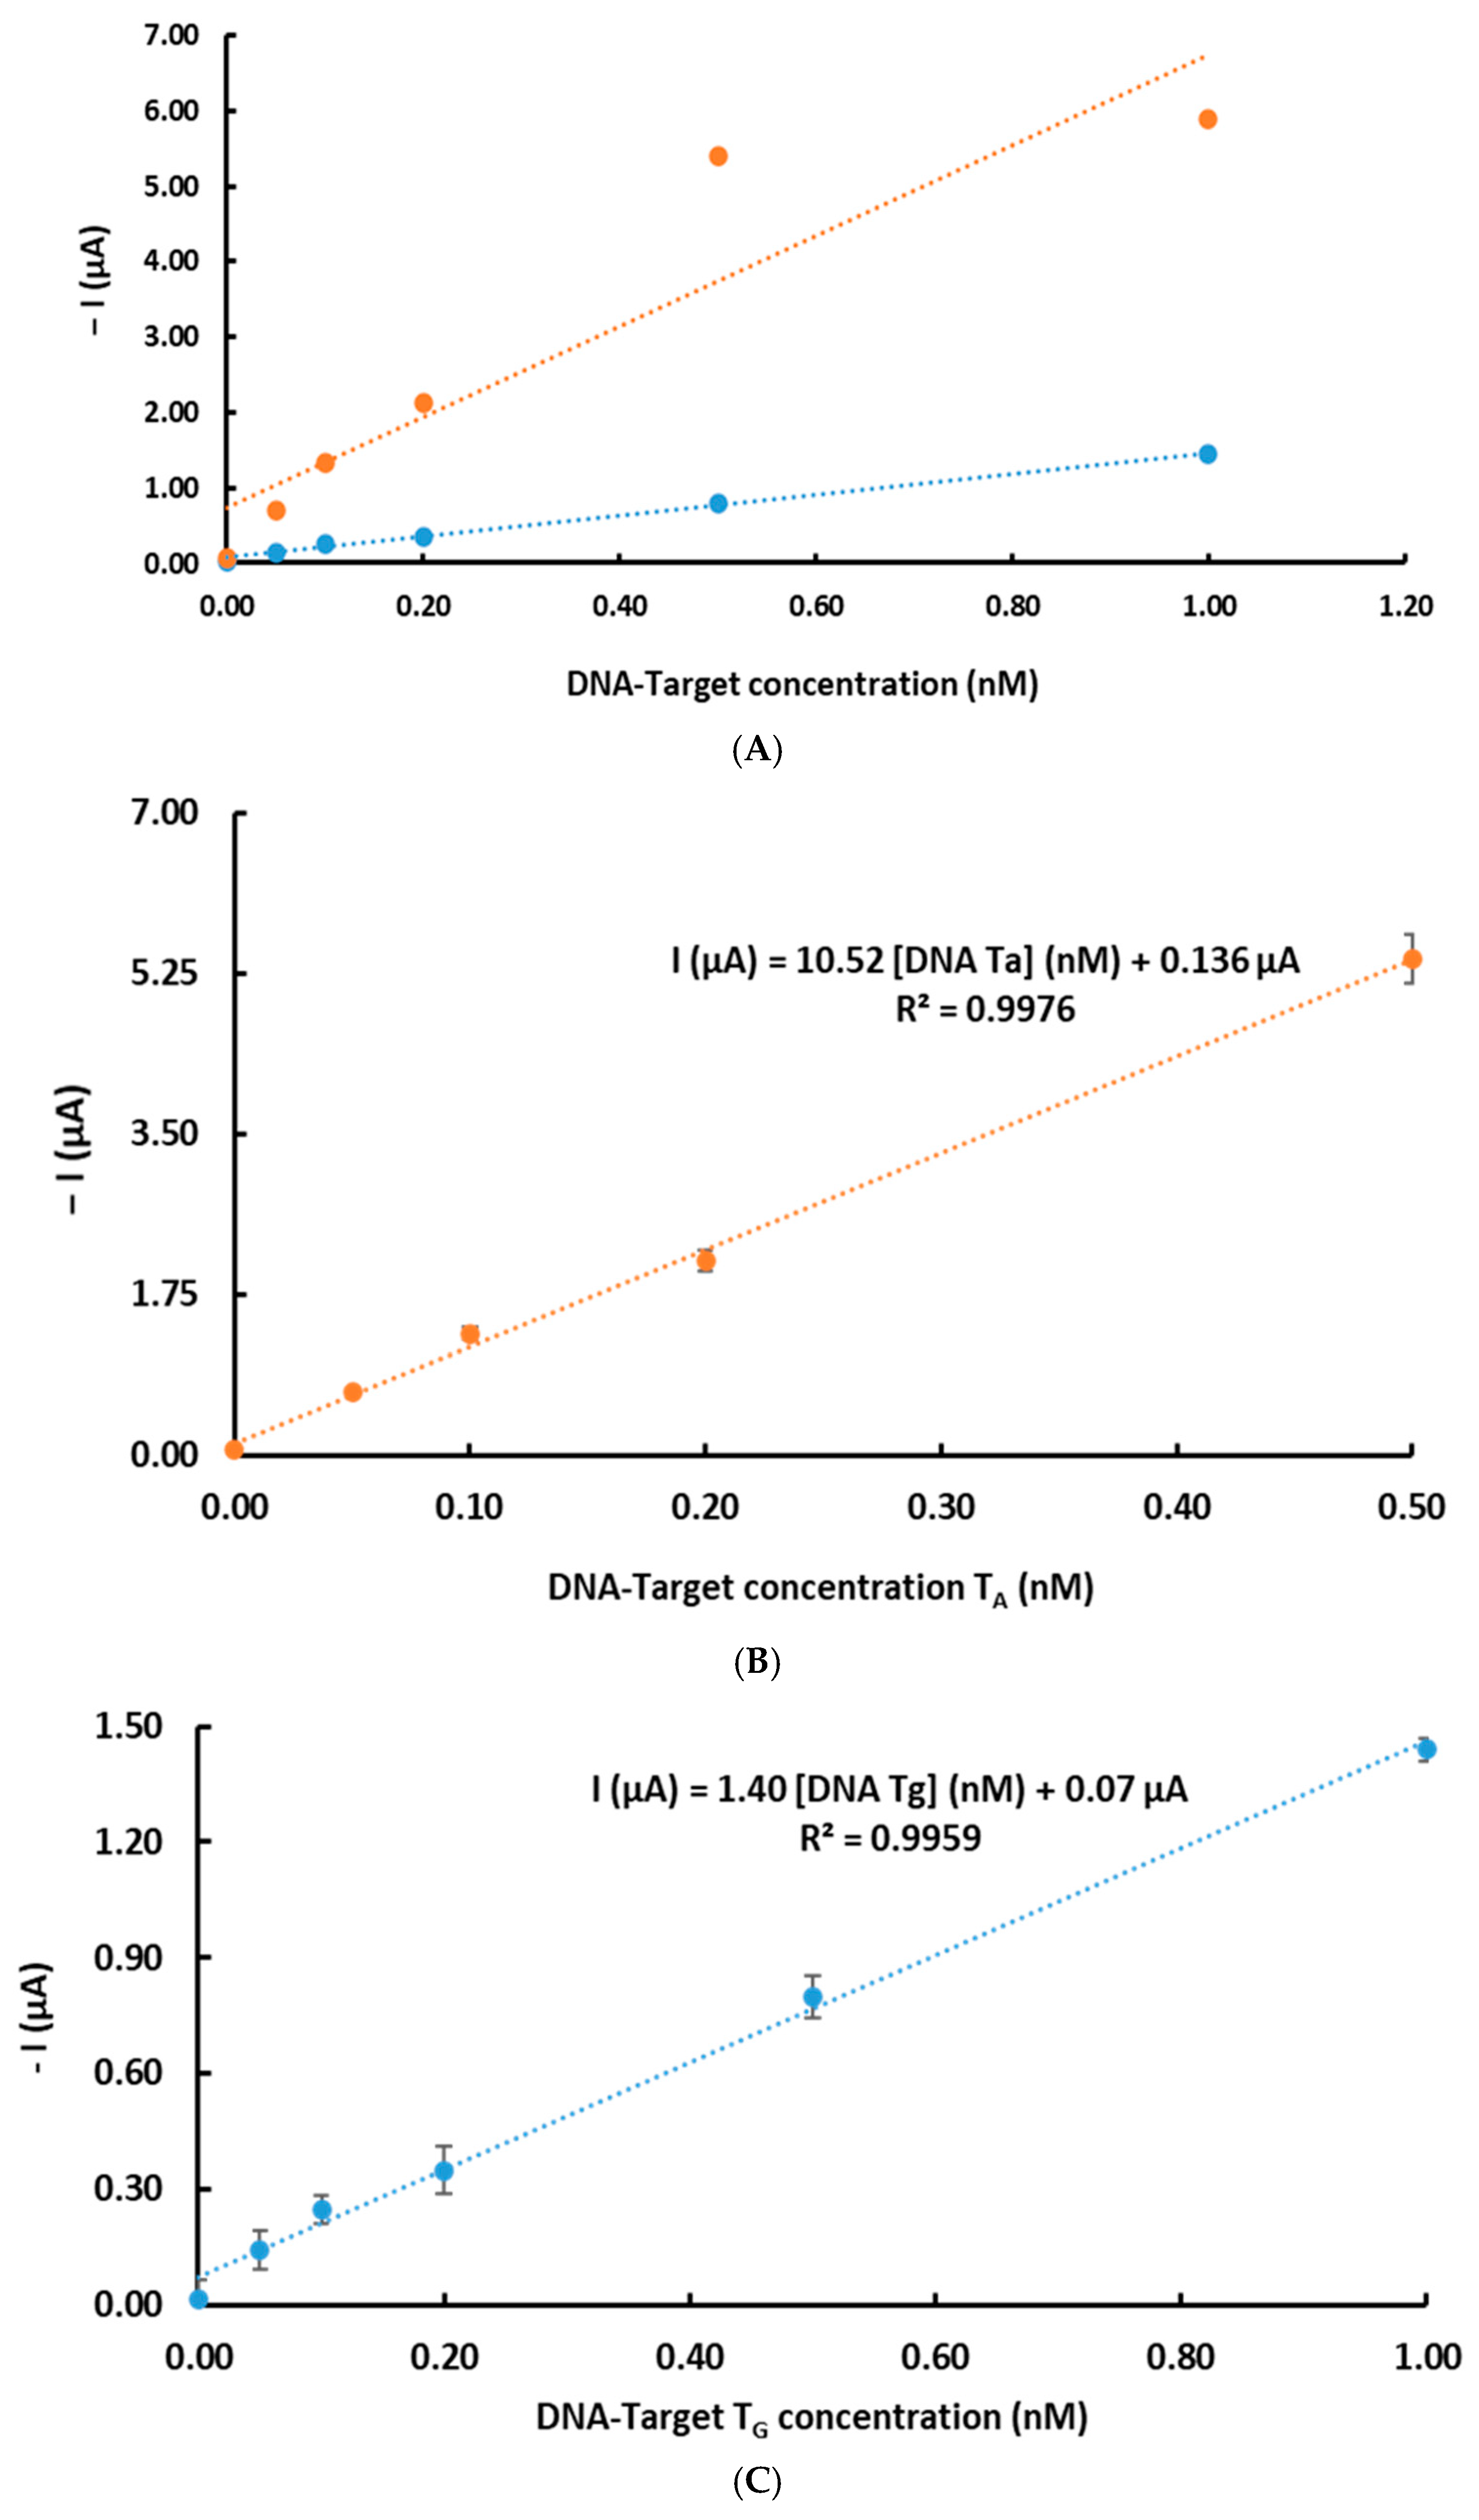
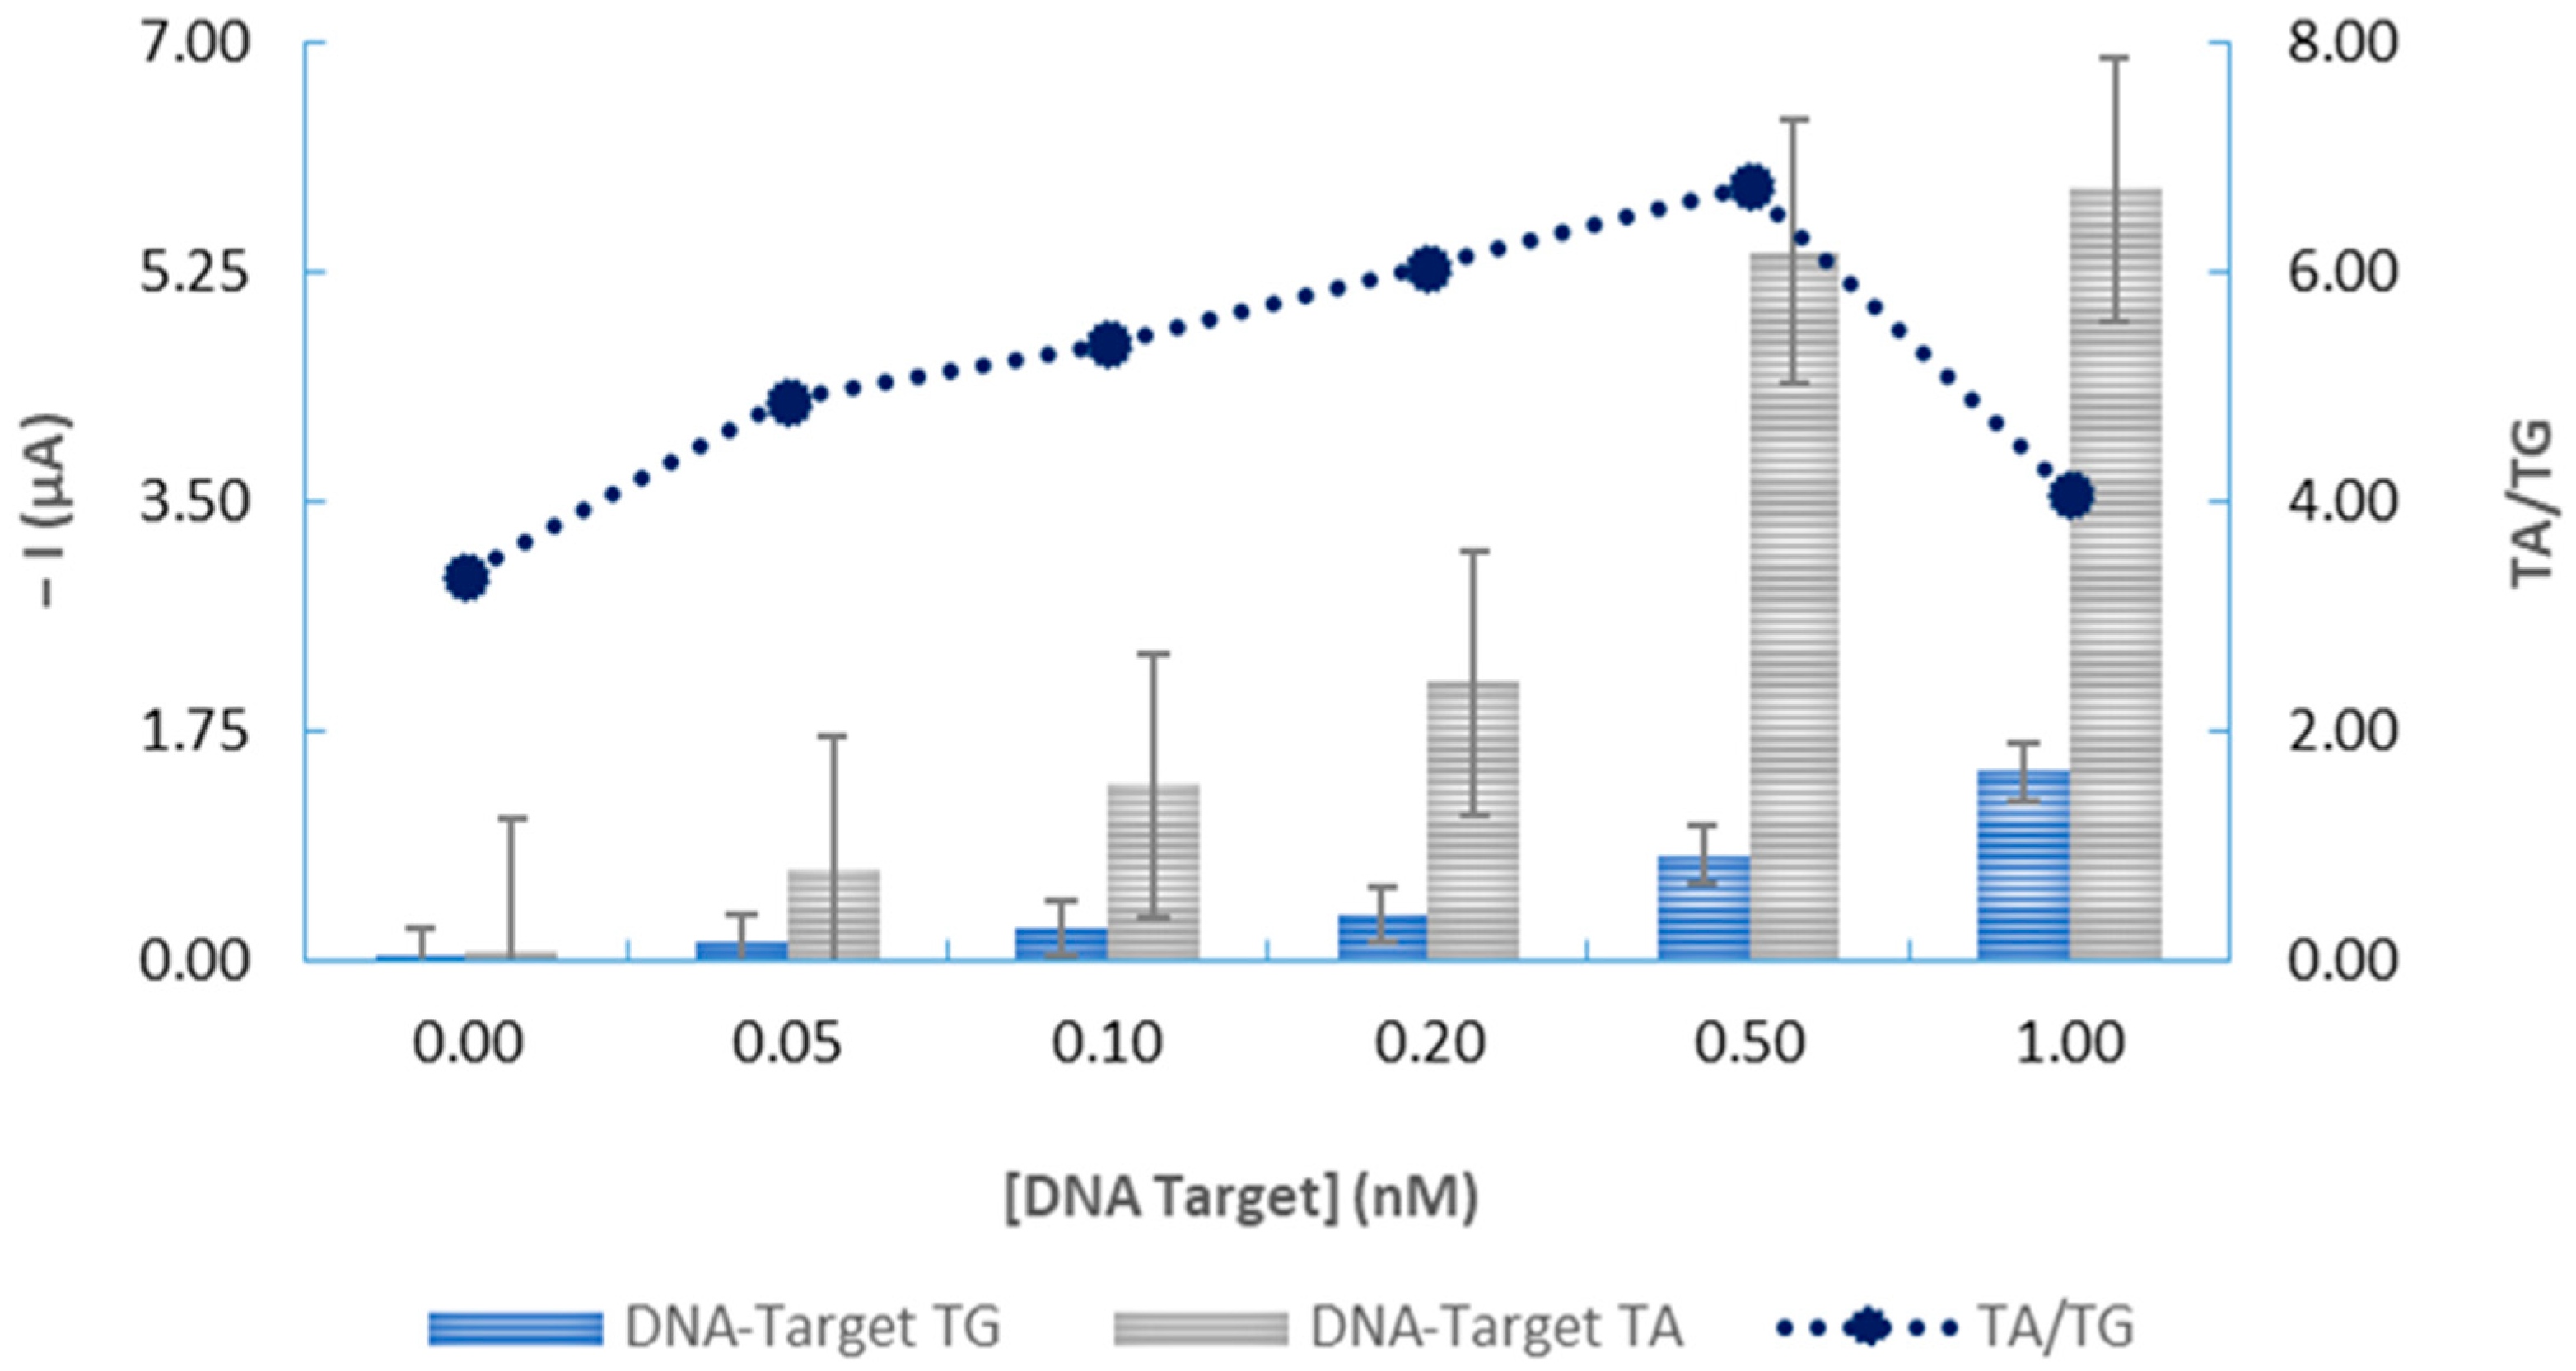
3.3. Analytical Characteristics and Genosensor Validation

By detecting the chronoamperometric signals from 0.05 to 1.00 nM of DNA, the impact of increasing 52-mer synthetic TA and TG concentrations on the analytical signal was assessed under the adjusted experimental settings (Table 2) (Figure 7A). According to the following equation, the chronoamperometric signals from 0.05 to 1.00 nM of DNA (Figure 7A) showed a linear regression (r2 = 0.998) between the synthetic DNA target concentration and the blank-subtracted chronoamperometric current intensity (I) in the 0.05 to 1.00 nM range (Figure 7B). Figure 7A shows the chronoamperometric signals from 0.05 to 1.00 nM of DNA.
I (µA) = 10.52 ± 0.14 (µA/nM) and 1.36 ± 0.07 (μA)
The limit of detection (LOD) and the limit of quantification (LOQ) calculated as three times and ten times the standard deviation of the blank assay divided by the slope of the calibration plot were 20.00 pM and 90.30 pM, respectively (Table 3).
The corresponding S/B ratio is displayed in dark blue for the TA allele and grey for the variant TG allele, whereas the current values of the non-variant TA probe and variant TG allele are shown in light grey and light blue, respectively. The standard deviation of the three replicates is estimated by error bars.
The developed genosensor was also evaluated to its accuracy and precision. For that, the repeatability of the analytical signals was assessed by performing inter-day readings and the reproducibility was achieved by carrying out three measurements in five consecutive days. Repeatability and reproducibility expressed as relative standard deviation were 6.549% and 5.41%, respectively.
Analyzing Figure 8, it is possible to verify that the developed device can detect and differentiate between the two polymorphic DNA sequences.

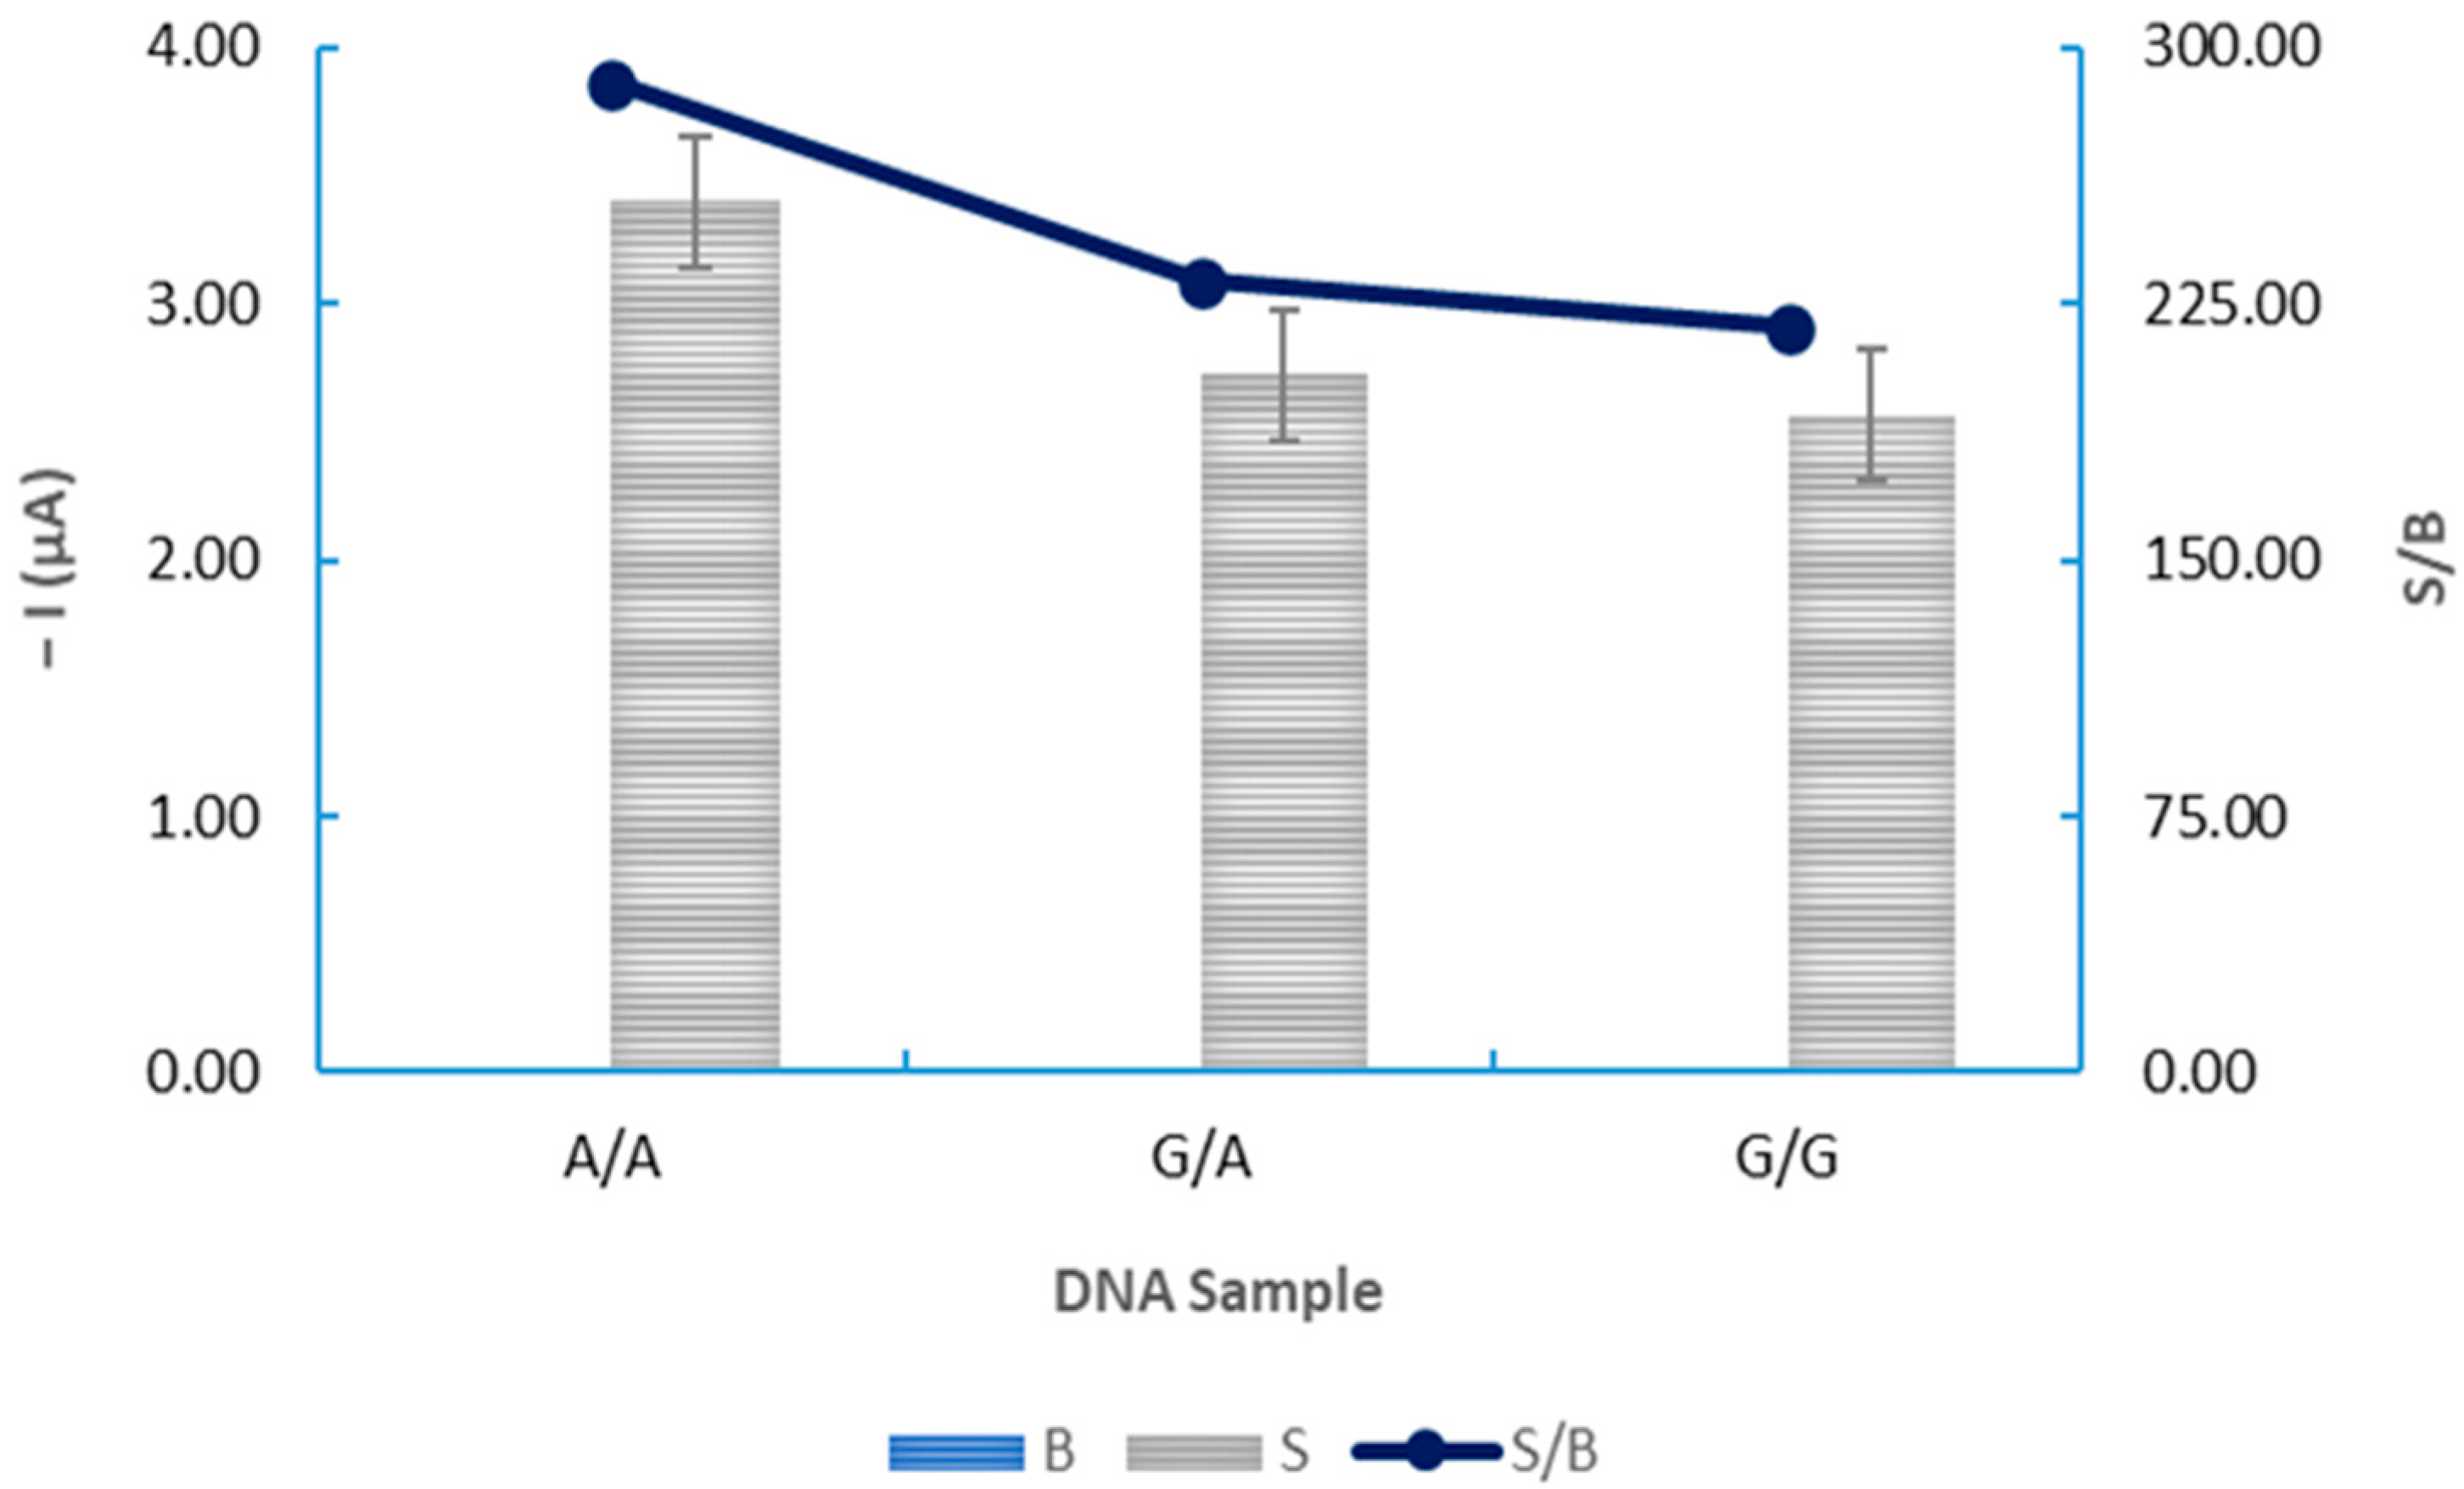
3.4. Application of the Electrochemical DNA-Based Biosensor to the Analysis of Biological DNA Samples

Following the optimization of the analytical conditions, genomic DNA obtained from the Piauí AIM Project DNA bank [19] was amplified by PCR and identified using the developed genosensor. The amplified fragments were then submitted to a denaturation process performed by heating up the oligonucleotide sequences to 98 ± 1 °C for 5 min and then cooled in an ice bath for 5 min. The three genotypes (homozygous wild-type A/A, heterogenous G/A and homozygous variant G/G) were found in the bank pool. Thus, the chronoamperometric measurements obtained for the amplified genomic DNA extracts from the three genotypes (A/A, G/A and G/G) and with the synthetic ssDNA TA and TG probes could be analyzed using the DNA-based biosensor that was designed for the VKORC1 SNP detection.
The chronoamperometric signals for the amplified genomic DNA were determined under the same conditions (Table 2) of the synthetic DNA. Figure 9 shows the results attained from the electrochemical signals when 1 nM was applied of the homozygous non-variant (A/A) dsDNA, heterozygous varied (G/A) dsDNA and homozygous SNP (G/G) samples.
Analyzing Figure 9, it is possible to observe is a clear difference between the three genotypes. The amplified genomic DNA of the non-variant A/A (completely complementary to the ssDNA-capture-T probe) sample presents both a higher S/B ratio (289.78) and current intensity (I = 3.40 μA) than the heterogenous G/A (S/B ratio and I = 231.99 and 2.72 μA, respectively) and homogeneous variant G/G (S/B ratio and I = 218.46 and 2.56 μA) samples. These results corroborate the sensor’s selectivity.
Compared to the conventional methods, namely PCR and isothermal amplification, this sensor is less labour-intensive, time consuming and uses a lot less reagents. Not to mention genosensors are less prone to false positives due to contaminants or the presence of artefacts and present a higher sensitivity enabling a clear discrimination between the three allelic variants in real DNA samples.
Like Lázaro et al., Huang et al. and Sang et al. [16,17,18], this developed device was also capable of detecting differences between the wild-type allele and SNP allele in the VKORC1 gene with high sensibility and selectivity. Every single work utilized a different detection technique and selected unique sensor surface designs, though all relied on DNA hybridization reactions. Nevertheless, this sensor presents a simpler protocol, and the obtained results are easily interpreted. Furthermore, the sensor is highly specific and sensitive, as it was able to differentiate between the three genotypes in real DNA samples at a 1 nM concentration.
To the best of our knowledge, this is the first and only study that has used chronoamperometry to detect SNPs in the VKORC1 gene. Although the quickest method (30 min) was developed by Huang et al. [17], the present work presents a higher accuracy in differentiating between the three genotypes.
Therefore, electrochemical DNA-based biosensors are an outstanding replacement for conventional genotyping techniques and present an appealing choice for clinicians looking to administer gene-directed warfarin medication. Nevertheless, as this electrochemical biosensor has only been tested in a laboratory setting, with a limited number of real genomic DNA samples, further development is needed before it can be marketed. Future improvements should focus on optimizing the stability, storage and logistics of the genosensor to ensure it maintains optimal performance.

4. Conclusions

A disposable SPGE capable of discriminating between VKORC1 genotypes was successfully developed and optimized. The electrochemical genosensor’s architecture, based on bilayers of thiolated ssDNA (SH-DNA) with MCH assembled on SPGEs, along with a sandwich-format hybridization strategy, enhanced the selectivity and signal amplification through the enzymatic action of POD, enabling sensitive detection via chronoamperometry. The optimizations culminated in an improved genosensor capable of discriminating between two VKORC1 SNPs (TA and TG), while simultaneously presenting higher S/B ratios and, consequently, a lowered detection limit.
Beyond these promising analytical results, the proposed genosensor demonstrates significant potential for clinical translation, particularly in personalized anticoagulant therapy. However, several challenges must be addressed before routine implementation can be realized. These include evaluating the sensor’s long-term stability under storage and operational conditions, assessing its performance in complex biological scenarios, and ensuring robustness across variable environmental factors. Furthermore, the integration of this platform into portable or point-of-care diagnostic devices remains a critical next step, as does the development of multiplexing capabilities to allow simultaneous detection of multiple pharmacogenetic markers.
In future work, efforts should focus on validating this system in real patient samples, automating the assay workflow, and exploring low-cost manufacturing techniques for large-scale deployment. With continued development, this genosensor could provide a rapid, affordable and decentralized alternative to traditional SNP genotyping methods, ultimately contributing to more precise warfarin dosing and a reduction in cardiovascular complications linked to VKORC1 variability.

Supplementary Materials

The following supporting information can be downloaded at: https://www.mdpi.com/article/10.3390/chemosensors13070248/s1, Figure S1: DNA structure of A) DNA Target A (TA); B) DNA Target G (TG); C) DNA-Capture probe and; D) DNA-Signalling probe [19,20].

Author Contributions

Conceptualization, H.F.-F., G.R.P. and M.F.B.; methodology, T.B., S.L.M., R.C., J.M.C.S.M., V.F.D., C.D.-M., H.F.-F., G.R.P., M.S. and M.F.B.; validation, T.B., S.L.M., R.C., J.M.C.S.M., V.F.D., C.D.-M., H.F.-F., G.R.P., M.S. and M.F.B.; formal analysis, T.B., S.L.M., R.C., J.M.C.S.M., V.F.D., C.D.-M., H.F.-F., G.R.P., M.S. and M.F.B.; investigation, T.B., S.L.M., R.C., J.M.C.S.M., V.F.D., C.D.-M., H.F.-F., G.R.P., M.S. and M.F.B.; resources, C.D.-M., H.F.-F., G.R.P., J.M.C.S.M. and M.F.B.; data curation, T.B., S.L.M., R.C., J.M.C.S.M., V.F.D., C.D.-M., H.F.-F., G.R.P., M.S. and M.F.B.; writing—original draft preparation, T.B., S.L.M., J.M.C.S.M., V.F.D., H.F.-F., G.R.P., M.S. and M.F.B.; writing—review and editing, S.L.M., C.D.-M., H.F.-F., G.R.P., M.S. and M.F.B.; visualization, T.B., S.L.M., J.M.C.S.M., V.F.D., C.D.-M., H.F.-F., G.R.P., M.S. and M.F.B.; supervision, J.M.C.S.M., V.F.D., C.D.-M., H.F.-F., G.R.P., M.S. and M.F.B.; project administration, J.M.C.S.M., V.F.D., C.D.-M., H.F.-F., G.R.P., M.S. and M.F.B.; funding acquisition, C.D.-M., J.M.C.S.M., H.F.-F., G.R.P., M.S. and M.F.B. All authors have read and agreed to the published version of the manuscript.

Funding

This project is part of the CYTED-rede Ibero-Americana project (GENOPSYSEN-ref:223RT0141) and received financial support from the PT national funds (FCT/MECI, Fundação para a Ciência e Tecnologia and Ministério da Educação, Ciência e Inovação) through the project UID/50006 -Laboratório Associado para a Química Verde - Tecnologias e Processos Limpos. This work also received financial support from the project “Challenging the Analytical Diagnosis of Neurodevelopmental Disorders: Pioneering Neurochemical Devices”, funded by FEDER funds (COMPETE 2030) and national funds by FCT/MECI, operation no. 15875, with reference COMPETE2030-FEDER-00699000.

Institutional Review Board Statement

The study was conducted in accordance with the Declaration of Helsinki and approved by the Research Ethics Committee of the Federal University of Piauí, Teresina, PI, Brazil.

Informed Consent Statement

Informed consent was obtained from all subjects involved in the study.

Data Availability Statement

The original contributions presented in this study are included in the article/supplementary material. Further inquiries can be directed to the corresponding author(s).

Acknowledgments

MFB is grateful for the FCT Investigator: 2020.03107.CEECIND-DOI:10.54499/2020.03107.CEECIND/CP1596/CT0005. Stephanie Morais (2023.028929.BD) is grateful to FCT and the European Union (EU) for their grants financed by POPH-QREN-Tipologia 4.1-Formação Avançada, funded by Fundo Social Europeu (FSE) and Ministério da Ciência, Tecnologia e Ensino Superior (MCTES).

Conflicts of Interest

The authors declare no conflicts of interest. The funders had no role in the design of the study; in the collection, analyses, or interpretation of data; in the writing of the manuscript; or in the decision to publish the results.

Abbreviations

The following abbreviations are used in this manuscript:
PCRPolymerase chain reaction
RT-PCRReal time polymerase chain reaction
VKORC1Vitamin K epoxide reductase complex subunit 1
SNPSingle nucleotide polymorphism
DNADeoxyribonucleic acid

References

  1. Zhang, B.; Schmidlin, T. Recent Advances in Cardiovascular Disease Research Driven by Metabolomics Technologies in the Context of Systems Biology. Npj. Metab. Health Dis. 2024, 2, 25. [Google Scholar] [CrossRef] [PubMed]
  2. Roth, G.A.; Mensah, G.A.; Johnson, C.O.; Addolorato, G.; Ammirati, E.; Baddour, L.M.; Barengo, N.C.; Beaton, A.Z.; Benjamin, E.J.; Benziger, C.P.; et al. Global Burden of Cardiovascular Diseases and Risk Factors, 1990-2019: Update From the GBD 2019 Study. J. Am. Coll. Cardiol. 2020, 76, 2982–3021. [Google Scholar] [CrossRef] [PubMed]
  3. Mensah, G.A.; Roth, G.A.; Fuster, V. The Global Burden of Cardiovascular Diseases and Risk Factors. J. Am. Coll. Cardiol. 2019, 74, 2529–2532. [Google Scholar] [CrossRef] [PubMed]
  4. Leopold, J.A.; Loscalzo, J. Emerging Role of Precision Medicine in Cardiovascular Disease. Circ. Res. 2018, 122, 1302–1315. [Google Scholar] [CrossRef] [PubMed]
  5. Krasi, G.; Precone, V.; Paolacci, S.; Stuppia, L.; Nodari, S.; Romeo, F.; Perrone, M.; Bushati, V.; Dautaj, A.; Bertelli, M. Genetics and Pharmacogenetics in the Diagnosis and Therapy of Cardiovascular Diseases. Acta Biomed. 2019, 90, 7–19. [Google Scholar] [CrossRef] [PubMed]
  6. Auwerx, C.; Sadler, M.C.; Reymond, A.; Kutalik, Z. From Pharmacogenetics to Pharmaco-Omics: Milestones and Future Directions. Hum. Genet. Genom. Adv. 2022, 3, 100100. [Google Scholar] [CrossRef] [PubMed]
  7. Dhingra, R.; Vasan, R.S. Biomarkers in Cardiovascular Disease: Statistical Assessment and Section on Key Novel Heart Failure Biomarkers. Trends Cardiovasc. Med. 2017, 27, 123–133. [Google Scholar] [CrossRef] [PubMed]
  8. Shubbar, Q.; Alchakee, A.; Issa, K.W.; Adi, A.J.; Shorbagi, A.I.; Saber-Ayad, M. From Genes to Drugs: CYP2C19 and Pharmacogenetics in Clinical Practice. Front. Pharmacol. 2024, 15, 1326776. [Google Scholar] [CrossRef] [PubMed]
  9. Su, J.; Yang, L.; Sun, Z.; Zhan, X. Personalized Drug Therapy: Innovative Concept Guided With Proteoformics. Mol. Cell Proteom. 2024, 23, 100737. [Google Scholar] [CrossRef]
  10. Cross, B.; Turner, R.M.; Zhang, J.E.; Pirmohamed, M. Being Precise with Anticoagulation to Reduce Adverse Drug Reactions: Are We There Yet? Pharmacogenomics J. 2024, 24, 7. [Google Scholar] [CrossRef] [PubMed]
  11. Dean, L. Warfarin Therapy and VKORC1 and CYP Genotype. In Medical Genetics Summaries; Pratt, V., McLeod, H., Rubinstein, W., Dean, L., Kattman, B., Malheiro, A., Eds.; National Center for Biotechnology Information: Bethesda, MD, USA, 2012. [Google Scholar]
  12. Poopak, B.; Rabieipoor, S.; Safari, N.; Naraghi, E.; Sheikhsofla, F.; Khosravipoor, G. Identification of CYP2C9 and VKORC1 Polymorphisms in Iranian Patients Who Are under Warfarin Therapy. Int. J. Hematol. Oncol. Stem Cell Res. 2015, 9, 185–192. [Google Scholar] [PubMed] [PubMed Central]
  13. Tamura, T.; Katsuda, N.; Hamajima, N. A PCR Method for VKORC1 G-1639A and CYP2C9 A1075C Genotyping Useful to Warfarin Therapy among Japanese. Springerplus 2014, 3, 499. [Google Scholar] [CrossRef] [PubMed]
  14. Maass, K.F.; Barfield, M.D.; Ito, M.; James, C.A.; Kavetska, O.; Kozinn, M.; Kumar, P.; Lepak, M.; Leuthold, L.A.; Li, W.; et al. Leveraging Patient-Centric Sampling for Clinical Drug Development and Decentralized Clinical Trials: Promise to Reality. Clin. Transl. Sci. 2022, 15, 2785–2795. [Google Scholar] [CrossRef] [PubMed]
  15. Morais, S.L.; Barros, P.; Santos, M.; Delerue-Matos, C.; Gomes, A.C.; Fátima Barroso, M. Electrochemical Genosensor for the Detection of Alexandrium Minutum Dinoflagellates. Talanta 2021, 222, 121416. [Google Scholar] [CrossRef] [PubMed]
  16. Lázaro, A.; Yamanaka, E.S.; Maquieira, Á.; Tortajada-Genaro, L.A. Allele-Specific Ligation and Recombinase Polymerase Amplification for the Detection of Single Nucleotide Polymorphisms. Sens. Actuators B Chem. 2019, 298, 126877. [Google Scholar] [CrossRef]
  17. Huang, T.-S.; Zhang, L.; He, Q.; Li, Y.-B.; Dai, Z.-L.; Zheng, J.-R.; Cheng, P.-Q.; He, Y.-S. DNA Sensors to Assess the Effect of VKORC1 and CYP2C9 Gene Polymorphisms on Warfarin Dose Requirement in Chinese Patients with Atrial Fibrillation. Australas Phys. Eng. Sci. Med. 2017, 40, 249–258. [Google Scholar] [CrossRef] [PubMed]
  18. Sang, S.; Guo, X.; Wang, J.; Li, H.; Ma, X. Real-Time and Label-Free Detection of VKORC1 Genes Based on a Magnetoelastic Biosensor for Warfarin Therapy. J. Mater. Chem. B. 2020, 8, 6271–6276. [Google Scholar] [CrossRef] [PubMed]
  19. Lopes, T.R.; Santos, S.; Ribeiro-dos-Santos, Â.; Resque, R.L.; Pinto, G.R.; Yoshioka, F.K.N. Population Data of the 46 Insertion–Deletion (INDEL) Loci in Population in Piauí State, Northeastern Brazil. Forensic Sci. Int. Genet. 2014, 9, 13–15. [Google Scholar] [CrossRef] [PubMed]
  20. Zuker, M. Mfold Web Server for Nucleic Acid Folding and Hybridization Prediction. Nucleic Acids Res. 2003, 31, 3406–3415. [Google Scholar] [CrossRef] [PubMed]
Scheme 1. DNA probe sequences.
Chemosensors 13 00248 sch001
Scheme 2. Genosensor design: I) formation of a bilayer composed of DNAcp (DNA capture probe) and MCH (mercaptohexanol) onto golf surface; II) homogenous hybridization between DNA-Target and DNA signalling (fluorescein label); III) heterogenous hybridization; IV) hybridization signalization with anti-FICT-POD (antibody anti-fluorescein peroxidase enzyme); and V) electrochemical detection via chronoamperometry (TMB: Tetramethylbenzidine electroactive subtract).
Chemosensors 13 00248 sch002
Scheme 3. Expected chronoamperometric signals for the VKORC1 non-variant homozygous and heterozygous variant alleles.
Chemosensors 13 00248 sch003
Figure 1. Chronoamperograms obtained for the blank assay and when it was used, the DNA-Target-A and DNA-Target G as DNA complementary sequence.
Chemosensors 13 00248 g001
Figure 2. The influence of the concentration of the DNA-capture probe on the chronoamperometric signals. The influence of the concentration of the DNA-capture probe on the chronoamperometric response. The corresponding S/B ratio is displayed in dark blue for the TA allele and grey for the variant TG allele, whereas the current values of the non-variant TA probe and variant TG allele are shown in light grey and light blue, respectively. The standard deviation of three replicates is estimated by error bars.
Chemosensors 13 00248 g002
Figure 3. Chronoamperometric signals acquired when investigating the increase in MCH (A) concentration and (B) incubation time. Current values of the non-variant TA probe and variant TG allele represented in light grey and light blue, respectively, and the corresponding S/B ratio in dark blue for the TA allele and grey for TG. Error bars estimate the standard deviation of three replicates.
Chemosensors 13 00248 g003
Figure 4. Chronoamperometric signals obtained when increasing (A) homogeneous and (B) heterogeneous hybridization incubation time. The S/B ratio is displayed in dark blue for the TA allele and grey for the variant TG allele, whereas the current values of the non-variant TA probe and variant TG allele are shown in light grey and light blue, respectively. The standard deviation of three replicates is estimated by error bars.
Chemosensors 13 00248 g004
Figure 5. Chronoamperometric responses registered when varying the DNA-signalling probe. The S/B ratio is displayed in dark blue for the TA allele and grey for the variant TG allele, whereas the current values of the non-variant TA probe and variant TG allele are shown in light grey and light blue, respectively. The standard deviation of three replicates is estimated by error bars.
Chemosensors 13 00248 g005
Figure 6. Effect of the antibody (A) concentration and (B) incubation time on the chronoamperometric response. The S/B ratio is displayed in dark blue for the TA allele and grey for the variant TG allele, whereas the current values of the non-variant TA probe and variant TG allele are shown in light grey and light blue, respectively. The standard deviation of three replicates is estimated by error bars.
Chemosensors 13 00248 g006
Figure 7. Chronoamperometric responses for (A) the blank subtracted current intensities and (B) calibration curve of the wild-type DNA-Target A and (C) DNA-Target G variant concentrations.
Chemosensors 13 00248 g007
Figure 8. Influence of the synthetic wild-type DNA-target A (TA) and polymorphic DNA-target G (TG) concentration on the chronoamperometric responses. The current values of the non-variant TA are represented in grey, the altered TG probe in light blue, and the corresponding Target-A/Target-G (TA/TG) ratio in dark blue. Error bars estimate the standard deviation of three replicates.
Chemosensors 13 00248 g008
Figure 9. Comparison of the electrochemical signals obtained from 1 nM of the A/A and vG/A and G/G amplified DNA. Current values of the blank assays (B) in light blue, amplified DNA in grey and corresponding S/B ratios in dark blue. Error bars estimate the standard deviation of three replicates.
Chemosensors 13 00248 g009
Table 1. ssDNA oligonucleotide sequences.
OligonucleotideSequence 5′ → 3′Bp
DNA-Capture probeSHC6OH–CTGAAAAACAACCATTGGCCTGGTG25
DNA-Signalling probeCGGTGGCTCACGCCTATAATCCTAGCA- FITC27
DNA-Target A (TA)TGCTAGGATTATAGGCGTGAGCCACCGCACCAGGCCAATGGTTGTTTTTCAG52
DNA-Target G (TG)TGCTAGGATTATAGGCGTGAGCCACCGCACCGGGCCAATGGTTGTTTTTCAG52
Table 2. Tested variables for the electrochemical genosensor construction.
TA
VariablesTested RangeSelected Value
DNA-capture probe concentration (µM)0.25–2.001.00
MCH concentration (mM)0.50–2.001.00
MCH incubation time (min)0–4530
Homogeneous hybridization incubation time (min)30–6060
Antibody incubation time (min)15–6030
Heterogeneous hybridization incubation time (min)15–6060
DNA-signalling concentration (µM)0.15–0.500.50
Antibody concentration (U/mL)0.25–2.51.00
Table 3. Analytical parameters.
ParametersDNA-Target ADNA-Target G
Linearity (nM)0.05–0.500.05–1.00
Slope (µA/nM)10.521.39
Interception (µA)0.410.07
Correlation (R)0.9980.996
Slope standard deviation (µA/nM)0.060.04
Interception standard deviation (µA/nM)0.030.005
LD (pM)20.022.4
LQ (pM)90.386.4
Repeatability6.545.21
Reproducibility (%)5.414.86
Disclaimer/Publisher’s Note: The statements, opinions and data contained in all publications are solely those of the individual author(s) and contributor(s) and not of MDPI and/or the editor(s). MDPI and/or the editor(s) disclaim responsibility for any injury to people or property resulting from any ideas, methods, instructions or products referred to in the content.

