Article

Giant Chemo-Resistive Response of POSS Nano-Spacers in PS- and PMMA-Based Quantum Resistive Vapour Sensors (vQRS) Used for Cancer Biomarker Analysis

by
Abhishek Sachan
1,2,
Mickaël Castro
1,
Veena Choudhary
2 and
Jean-François Feller
1,*
1
Smart Plastics Group, IRDL CNRS 6027, University of South Brittany (UBS), 56321 Lorient, France
2
Centre for Polymer Science & Engineering, Indian Institute of Technology (IIT), Delhi 110016, India
*
Author to whom correspondence should be addressed.
Chemosensors 2025, 13(7), 226; https://doi.org/10.3390/chemosensors13070226
Submission received: 30 April 2025 / Revised: 16 June 2025 / Accepted: 18 June 2025 / Published: 21 June 2025

Abstract

The detection of volatile organic compound (VOC) biomarkers from the volatolome for the anticipated diagnosis of severe diseases such as cancers is made difficult due to the presence of high quantities of H2O in the collected samples. It has been shown that water molecules tend to compete or combine themselves with analytes, which requires either their removal or the development of more sensitive and discriminant sensors. In this later prospect, a positive effect of poly(hedral oligomeric silsesquioxanes) (POSS) is sought out to enhance the sensitivity of carbon nanotube-based quantum resistive vapour sensors (vQRS). POSS, once copolymerized with methyl methacrylate or styrene, can be used as nano-spacers amplifying the disconnection of the nano-junctions due to swelling of the polymer upon the diffusion of VOC. The amplitude of this phenomenon, which is at the origin of the chemo-resistive behaviour of vQRS, was compared with that of homologue transducers made of poly(styrene) (PS) and poly(methyl methacrylate) (PMMA)-coated carbon nanotube (CNT) random networks. The presence of POSS in PS-based sensors has enhanced their sensitivity by 213 times for toluene, by 268 times for acetone, by 4 times for ethanol, and by 187 times for cyclohexane. Similarly, the presence of POSS in PMMA chains increases the sensitivity of sensors to cyclohexane by 10 times, to ethanol by 45 times, to toluene by 244 times, and to acetone and butanone by 4 times. All transducers were made by spray layer by layer (sLbL) to obtain a hierarchically structured conducting architecture. The transducers’ surface was characterized by scanning electron microscopy (SEM) and atomic force microscopy (AFM) to observe the CNT coating and dispersion level in the matrix. All sensors were tested with twenty-one VOC part of lung and skin cancer biomarkers by using a dynamic vapour analysis (DVA). The vQRS based on POSS copolymers demonstrated much larger chemo-resistive responses (AR) than the sensors based only on pure polymers and were found to be very selective towards cyclohexane and hexene-1. The PMMA-co-POSS/CNT sensor was able to detect down to 12 ppm of VOC with a very high signal-to-noise ratio (SNR) and to discriminate six VOC among them all with a PCA (principal component analysis) projection.

1. Introduction

The design of highly selective and sensitive volatile organic compound (VOC) sensors is a crucial step in the achievement of an accurate diagnosis for the anticipated detection of severe diseases such as lung cancer [1,2,3,4,5,6,7,8], prostate cancer [9,10], breast cancer [11,12], or melanoma [13,14] using electronic noses (e-noses). E-noses have been developed by mimicking the mammal sense of olfaction more than three decades ago [15,16,17,18]. Similarly to a nose, several non-specific chemical transducers are assembled into arrays to capture olfactive prints after the extraction and treatment of pertinent features from chemo-resistive sensor signals (Figure 1). Provided that the e-nose composition is optimized to ensure a sharp discrimination of target volatiles and that it has been trained with enough VOC of different natures, it is possible to classify unknown vapour artifacts to determine if they fit the fixed criteria or not. One application of e-noses in the medical field has focused the attention of researchers, the anticipated diagnostic of diseases from the human volatolome. This non-intrusive technique is especially promising as it can provide a way to assess the illness of patients at an early stage to make eventual treatments more effective [19].
Generally, the volatiles of interest in exhaled breath of healthy humans, such as toluene, hexene, and cyclohexane, are present at concentrations between 10 and 100 ppb (part per billion), but this range can reach the ppm level for lung cancer patients, which makes their detection easier [12,21,22]. The VOC coming out from industries as wastes or by-products, from paint, varnishes, or composites, are also of growing concern for health. These VOC cause short- as well as long-term effects on the eyes, throat, and nervous system [23,24]. Thus, developing portable, convenient, accurate, and low-consumption tools for the detection of these VOC is crucial for human health improvement. Electronic noses (e-noses) composed of arrays of quantum resistive vapour sensors (vQRS) have a huge potential to anticipate severe diseases at a relatively low cost [25,26,27,28,29]. A vast majority of the world population could benefit from this simple health-monitoring device that would help to decrease mortality. However, some issues in this technique prevent the easy identification of olfactive prints, resulting from a difficulty to uncouple the effect of vapours’ concentration from the affinity of analyte molecules for transducer’s macromolecules. Hence, it is of interest to implement more specific functional groups and better electron transfer ability to vapour transducers in the e-nose [30]. Different types of sensors based on metal oxide [31,32,33,34,35,36], intrinsically conducting polymers [37,38,39,40,41], and conducting polymer nanocomposite (CPC) [2,27,42,43,44,45] have already been tested for gas and VOC detection. CPC-based sensors operate at room temperature, have a low consumption, and have been proved to be effective in the detection of both polar and non-polar VOC [46]. They present the advantages such as allowing for the combination of many different polymer matrices and nanofillers to design a conducting architecture with effective nano-junctions for the fabrication of sensitive and selective chemo-resistive transducers. The principle of detection of these sensors is based on the physicochemical interactions between the solvent molecules and the macromolecules from the matrix [46]. The absorption of the solvent molecules inside the CPC transducer swells the polymer, in particular, at CNT/CNT nano-junctions, which results in the generation of tunnelling conduction, further disconnecting the conducting pathways, and finally yielding an exponential increase in the transducer’s resistance [47]. This change in resistance at the macroscale is recorded as the sensor’s response. Thus, the sensitivity of vQR depends on the number of nano-junctions (active sites for analyte adsorption) on the amplitude of the disconnections (average gap between CNTs) and on the quality of the local swelling of functional molecules (polymers) by analyte vapour molecules (similar solubility parameter). One strategy to enhance the sensitivity of detection of the selected VOC biomarkers is to favour the swelling of the polymer matrix by increasing the free volumes to make vapour molecules’ diffusion and absorption easier. To reach this objective, it is possible to incorporate within polymer chains some specific nanoparticles that can act as nano-spacers and increase the distance between them, such as poly(hedral oligomeric silsesquioxanes) (POSS) that have recently been used in nanocomposites. The chemical formula of the POSS molecule is SinO1.5n, and it is generally structured under the form of a cage with high Si atoms 0.53 nm in edge size [48]. Depending on the applications required (copolymerization and blending), the functionality and size of the groups attached to the Si atoms can be varied [49,50]. To improve its solubility in macromolecules together with its dispersion and adhesion in polymer matrices, different types of organic chains can be attached to the POSS cage [51]. The advantage of POSS is that many different groups can be attached to Si atoms to modify the original properties of the polymers, such as their segmental dynamics, which can significantly modify their glass transition temperature (Tg) [52]. Interestingly, some reactive functional groups of POSS molecules can be copolymerized with conventional monomers to synthesize an organic–inorganic hybrid material, increase surface area, decrease the Tg, and improve flexibility compared to the pristine polymer [53,54]. POSS-related materials have found many applications in fields such as hybrid nanocomposites [55], polymer-based electrolytes [56,57], polymer-based optoelectronics [58], or biomaterials [59,60]. Concerning vapour-sensing applications, POSS has already been proven to be effective in improving the sensitivity of vQRS. POSS was used for the first time to covalently or non-covalently bond to the CNT surface [61], to provide vQRS with new functionality for the selective detection of acetone or cyclohexane, and also to increase the free volume in the CPC to speed up the diffusion of analytes. Usually, moisture is found to decrease both PECVD CNT [62] and sLbL nanostructured functionalized CNT [63] sensors’ response to VOC. But, more recently, copolymers of POSS and PMMA or PS have demonstrated their ability to reach the subppm range of detection of NH3 and CH2O vapours in the presence of water [64]. It was also shown that amorphous polymers can absorb vapours very efficiently [65]. There is also an interest in using amorphous polymer matrices that will not contain denser crystalline phases as barriers towards gas diffusion, like poly(styrene) (PS) and poly(methyl methacrylate) (PMMA). Interestingly, such polymers can be copolymerized with reactive POSS to enhance absorption in the matrices. Wu et al. have showed that the POSS-copolymerized PS has no crystallization and a higher level of plasticization with increased free volume in the matrix [60,66,67]. Similarly, PMMA-co-POSS macromolecular chains have very low crystallinity [68] and a lower Tg than that of pure polymer [69]. It was also found that POSS molecules had a strong plasticizing effect, which suggests that they can effectively interspace polymer chains, which is expected to favour the vapour diffusion in transducers and ensure shorter response times [70]. Therefore, the organic functionalities present in POSS molecules and their cage structure could increase the volume expansion in the vicinity of the nano-junctions, which should result in a more effective disconnection of the conducting network, thus increasing the sensitivity of vQRS [71].
All these considerations have been integrated in the present study to optimize the design of sensors for the detection of lung cancer biomarkers. vQRS were made of random networks of CNTs functionalized with copolymers of POSS with PS and PMMA by spray LbL to ensure good control of the conducting nanoarchitecture. The selectivity of the derived vQRS has been analysed by exposing them to a set of twenty-one different VOC, including lung cancer biomarkers at saturation, and their sensitivity was investigated by decreasing the concentration of analytes down to the ppm range. The chemo-resistive properties of vQRS with and without POSS were compared to examine a possible positive spacing effect in relation to the selectivity and the sensitivity of transducers.

2. Materials and Methods

2.1. Materials

The NC 7000 grade of carbon nanotubes (CNTs) used was kindly provided by Nanocyl SA (Sambreville, Belgium). A multiwalled CNT with a 9.5 nm average diameter and a 1.5 µm average length were prepared by the catalytic carbon vapour deposition (CCVD) method with a degree of purity of 90%. The CNTs were used as such without any purification. Poly(styrene-co-[propyl methacryl-hepta isobutyl-PPS]) or PS-co-POSS, and poly(methyl methacrylate-co-[propyl methacryl-hepta isobutyl-PPS]) or PMMA-co-POSS were obtained from Sigma-Aldrich (Paris, France). Both copolymers have 45 wt. % of POSS in the random copolymer. Poly(methyl methacrylate) (PMMA) with an average molar mass of Mw = 12,000 g·mol−1 was purchased from Sigma-Aldrich (Paris, France). The poly(styrene) (PS) obtained from Acros Organics (Paris, France) had a Mw = 250,000 g·mol−1. All solvents used in the experiments were also obtained from Sigma-Aldrich (Paris, France) and used without any further purification.

2.2. Fabrication of Sensors

vQRS were prepared by the spray layer-by-layer (sLbL) method developed by our group [46,72]. Firstly, the four polymers (PS, PMMA, POSS-co-PS, and POSS-co-PMMA) were dissolved in chloroform before the CNTs were ultrasonicated for 6 h at 50 °C with a Branson 3510 with a power of 100 W at a frequency of 40 kHz. Then, in standard conditions, about 2 wt. % of the CNTs (i.e., 200 mg of CPC) was dispersed in 20 cm3 of chloroform. Later, the CPC transducers were nano-architectured by the assembly of 30 nm nanolayers onto interdigitated electrodes (IDEs) composed of 25% Ag/75% Pd tracks separated by 15 mm of ceramic gap and prepared by cleaving 22 nF capacitors. The electrodes were polished and then cleaned with ethanol to remove any contamination from their surface. The sLbL device is composed of a nozzle mounted onto a 3D printer frame driving its x/y movement and controlled with Valve Mate 8040 (Nordson, Westlake, USA) at a scan speed of Vs = 50 mm·s−1, a flow rate index of 2, a target-to-nozzle distance of 8 cm, and an air pressure ps = 0.1 MPa. After fabrication, the vapour sensors were conditioned at 30 °C in a controlled atmosphere for one night. The resulting transducers’ initial resistance to PS-co-POSS/CNT and PMMA-co-POSS/CNT measured, respectively, R0 = 17.9 ± 3 kΩ and R0 = 21.6 ± 5 kΩ, whereas that of PS-CNT and PMMA-CNT was R0 = 18.2 ± 6 kΩ and R0 = 11.7 ± 4 kΩ.

2.3. Techniques Used for the Morphological Characterization

The characterization of the nano-morphology of sensing films prepared by sLbL was achieved with a Bruker-Veeco (Paris, France) AFM (atomic force microscopy) with a calibre multimode scanning probe at room temperature using the TM mode (light tapping), whereas a Zeiss (Oberkochen, Germany) EVO 50 scanning electronic microscope (SEM) allowed for an investigation of the morphology of POSS-CNT transducers at the nanoscale.

2.4. Characterization of the Chemo-Resistive Properties by Dynamic Vapour Sensing (DVS)

The chemo-resistive properties were tested by recording the variations in relative electrical resistance of vQRS. Typically, the sensors were exposed to ten successive cycles of 5 min N2/5 min volatile. The first cycle is generally not used for the calculation of the average chemo-resistive amplitude as it is often different. The response time is usually less than the second, and if the base line can drift, it does not affect the amplitude. As signals are symmetrical upon sorption and desorption, we assume that all molecules are released from transducers after exposition.
These vapours were generated at saturation by bubbling nitrogen gas in a column containing the VOC and at the ppm level by using an OVG4 oven coupled with a OWLSTONE Ltd. (Cambridge, UK) generator. Solvent permeation tubes were prepared and calibrated to be used in the OVG4 oven with five solvents. The solvent vapour testing was assisted by mass flow controllers and electrically controlled valves. The flow of solvent vapours in both conditions was fixed at a rate of Qv = 100 cm3·min−1. The sensors were kept in a cell of 100 × 10 × 3 mm3 dimensions and connected to a Keithley 6517 (Beaverton, USA) that recorded signals with the Labview 2017 software. The responses are expressed as the relative resistance amplitude (AR) given by Equation (1).
A R = R R 0 R 0
where R0 is the initial resistance of sensors in dry nitrogen stream and R is the resistance in the presence of a pure solvent.

3. Results and Discussion

3.1. Morphological Characterization of vQRS Transducers

The vQRS prepared by sLbL were characterized by SEM and AFM. The surface morphology and the transducing layer thickness were analysed by SEM, and the coating of CNT with the copolymer matrix was observed from AFM. In Figure 2, SEM images of PS-CNT and PS-co-POSS/CNT are compared. The porous morphology of the surface observed is the result of the solvent evaporation during the drying of the sprayed layers after welding of the CPC µdroplets. The PS-CNT film had an uneven surface covered with µholes of random sizes (Figure 2a), whereas a relatively smoother surface was obtained with the PS-co-POSS/CNT films that also comprised smaller µholes evenly distributed throughout the surface (Figure 2b). This suggests that the porosity of the matrix was decreased by the presence of POSS in the polymer chain. The presence of a larger number of tiny holes in the PS-co-POSS/CNT films compared to PS-CNT films is assumed to increase the specific surface available for analyte diffusion and enhance the transducer’s sensitivity. All sensing films were composed of four sprayed layers, leading to the same thickness that was measured by SEM from the image in Figure 2c, and evaluated to be about 3.4 µm. It can be seen from the same image that the cross section of the sensing film had a porous nature, which must favour the VOC molecules’ diffusion and therefore enhance the chemo-resistive response.
In the AFM images of Figure 3a,b, the surface of the sensing film observed between µholes appears smooth and homogenous at the nanoscale. Comparing these figures more precisely clearly shows a carbon nanotube about 700 nm long, well coated with the polymer matrix.

3.2. Effects of POSS on the Chemo-Resistive Behaviour of vQRS

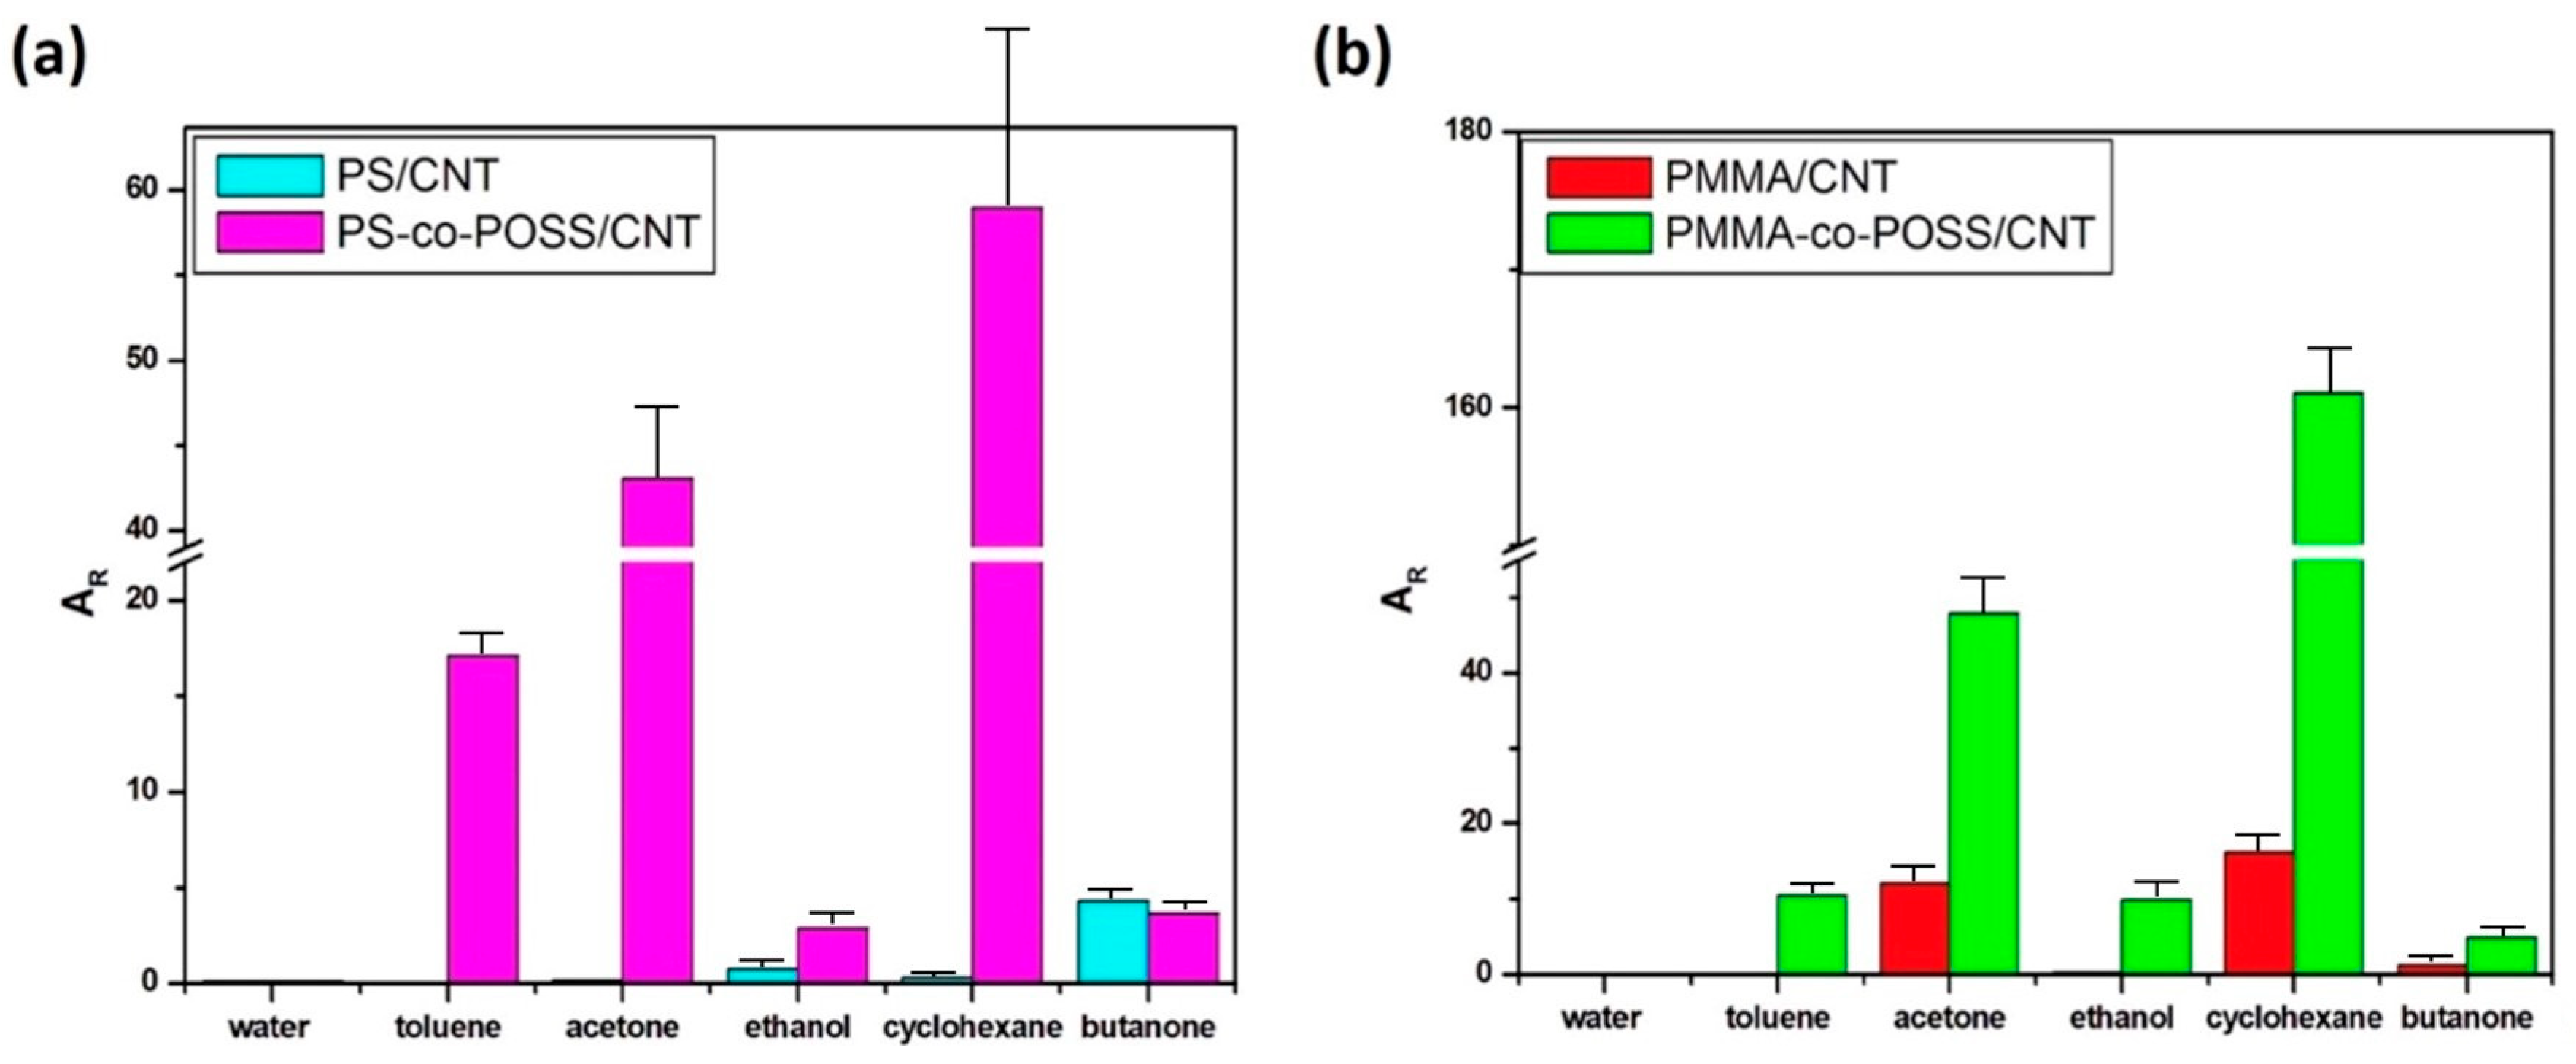
To investigate the effect of POSS on vQRS chemo-resistive behaviour, different transducers were synthesized by non-covalently functionalizing CNT with two kinds of amorphous polymer matrices (PS and PMMA) filled or not with POSS molecules. POSS molecules are assumed to act as nano-spacers between macromolecules, especially at CNT–CNT nano-junctions, thus increasing the amplitude of disconnections in the conducting architecture and consequently the sensitivity of sensors. To check this assumption, the chemo-resistive responses of PS-CNT and PMMA-CNT were compared to those of PS-co-POSS/CNT and PMMA-co-POSS/CNT upon exposure to five saturated VOC (toluene, acetone, ethanol, butanone, and cyclohexane) and water as a reference. The average relative amplitudes of the responses AR of all sensors are summarized in Figure 4a,b for PS and PMMA matrices, respectively.
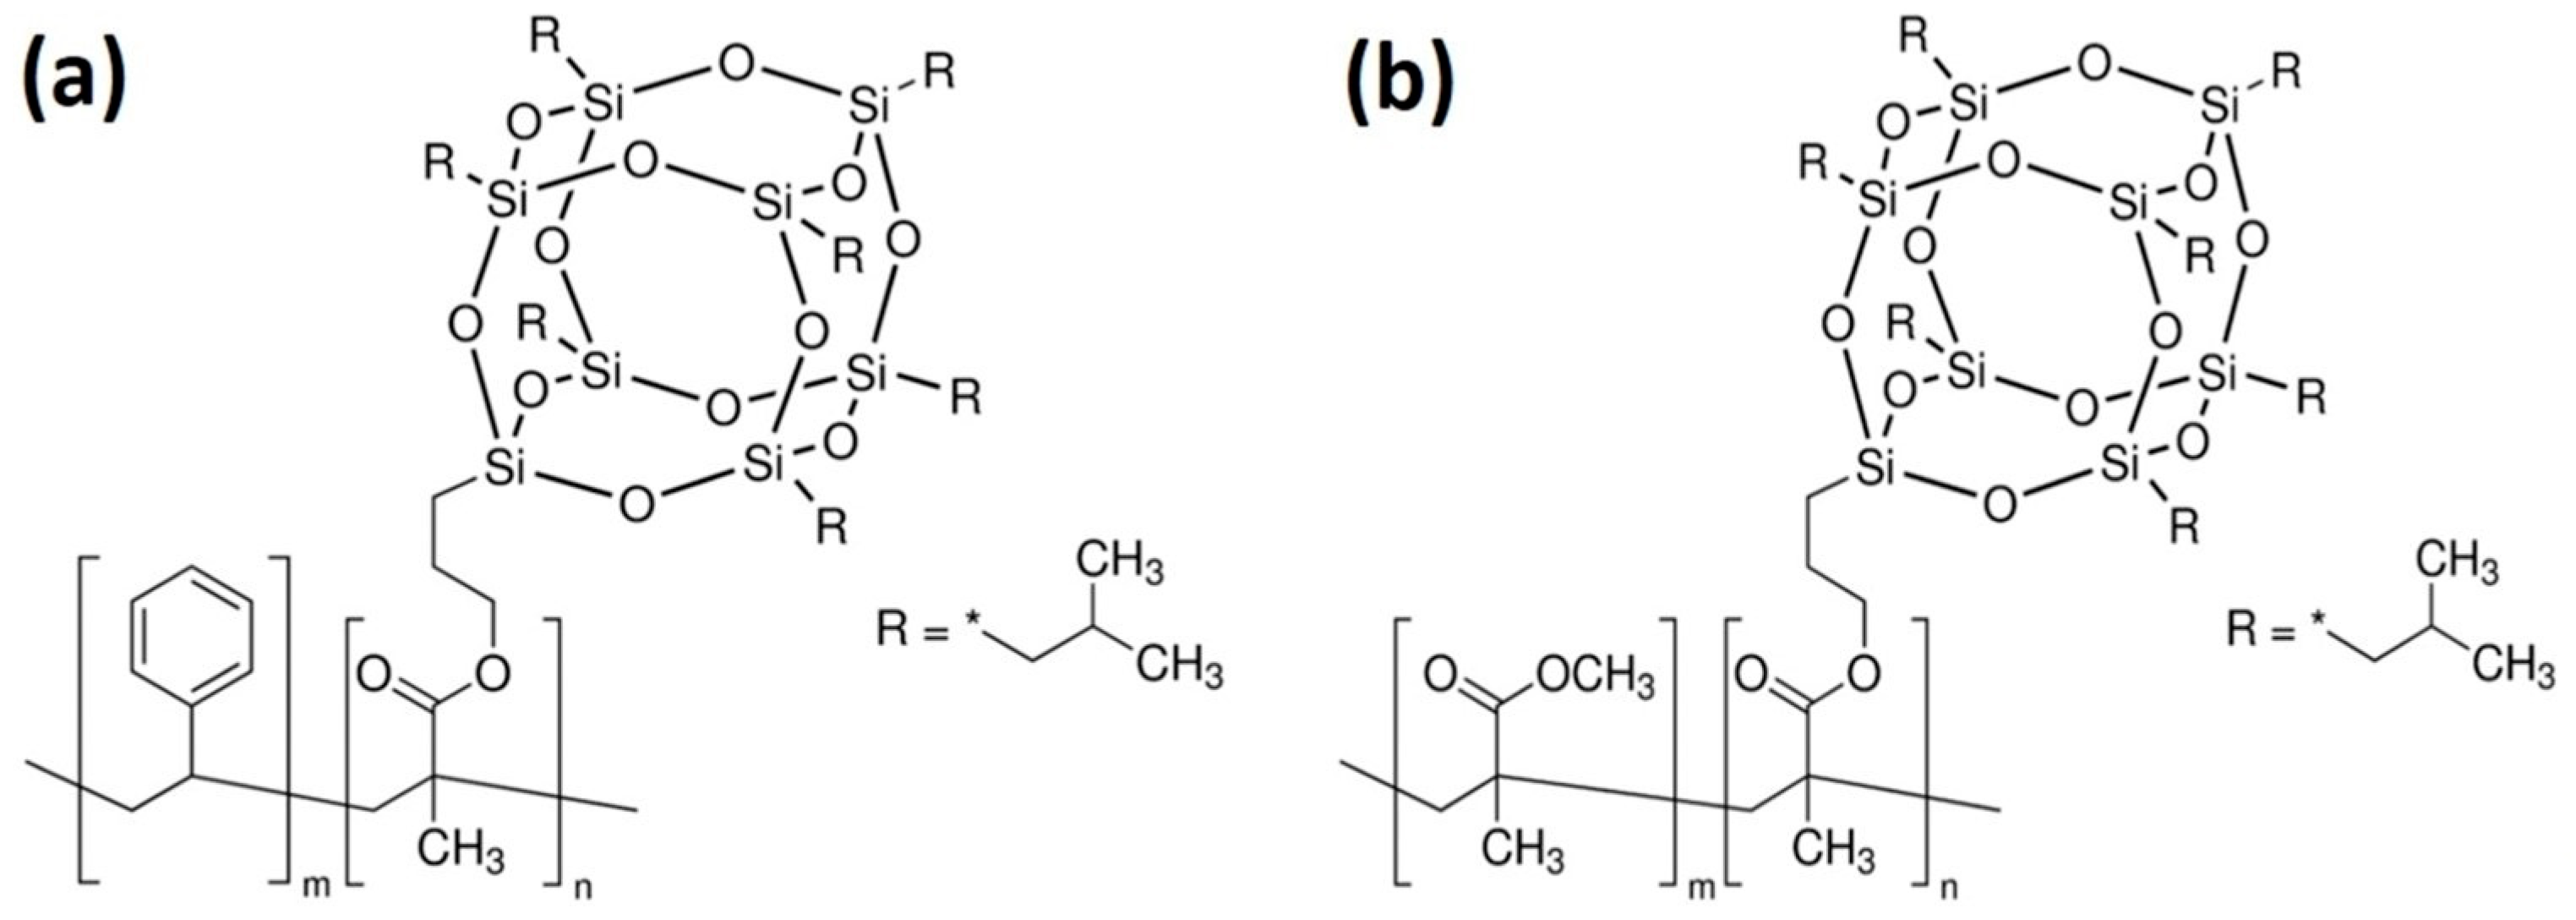
As observed in these figures, whatever the polymer matrix, the introduction of POSS in their backbone is tremendously increasing the response of both types of vQRS to most analytes. Another striking feature of POSS-modified transducers is their very large response to toluene, acetone, and cyclohexane, and their almost absence of response to water. More precisely, in Figure 4a, the presence of POSS in PS-based sensors has enhanced their sensitivity by 213 times for toluene, by 268 times for acetone, by 4 times for ethanol, and by 187 times for cyclohexane. Similarly, in Figure 4b, the presence of POSS in PMMA chains increases the sensitivity of sensors to cyclohexane by 10 times, to ethanol by 45 times, to toluene by 244 times, and to acetone and butanone by 4 times. Only the sensitivity to butanone did not seem to be affected by POSS, and water vapour was almost not detected by any sensor, which is a very good result, as many sensors are poisoned by water molecules that tend to saturate the adsorption sites before other analyte molecules. The alkyl side chains fixed on POSS and on the main backbone are quite hydrophobic in nature and must be good at repelling water molecules from the sensor surface. However, although the very high responses of POSS-based vQRS is good news, it is interesting to try to understand why. Some elements of the answer can be given in relation to the peculiar structure of the POSS cage, its distribution over the polymer chain, and its interactions with other molecules (Figure 5).
The chemical formulae of the POSS copolymers exhibit a cage structure of POSS about 0.5 nm in size and random distribution in the copolymer chain.
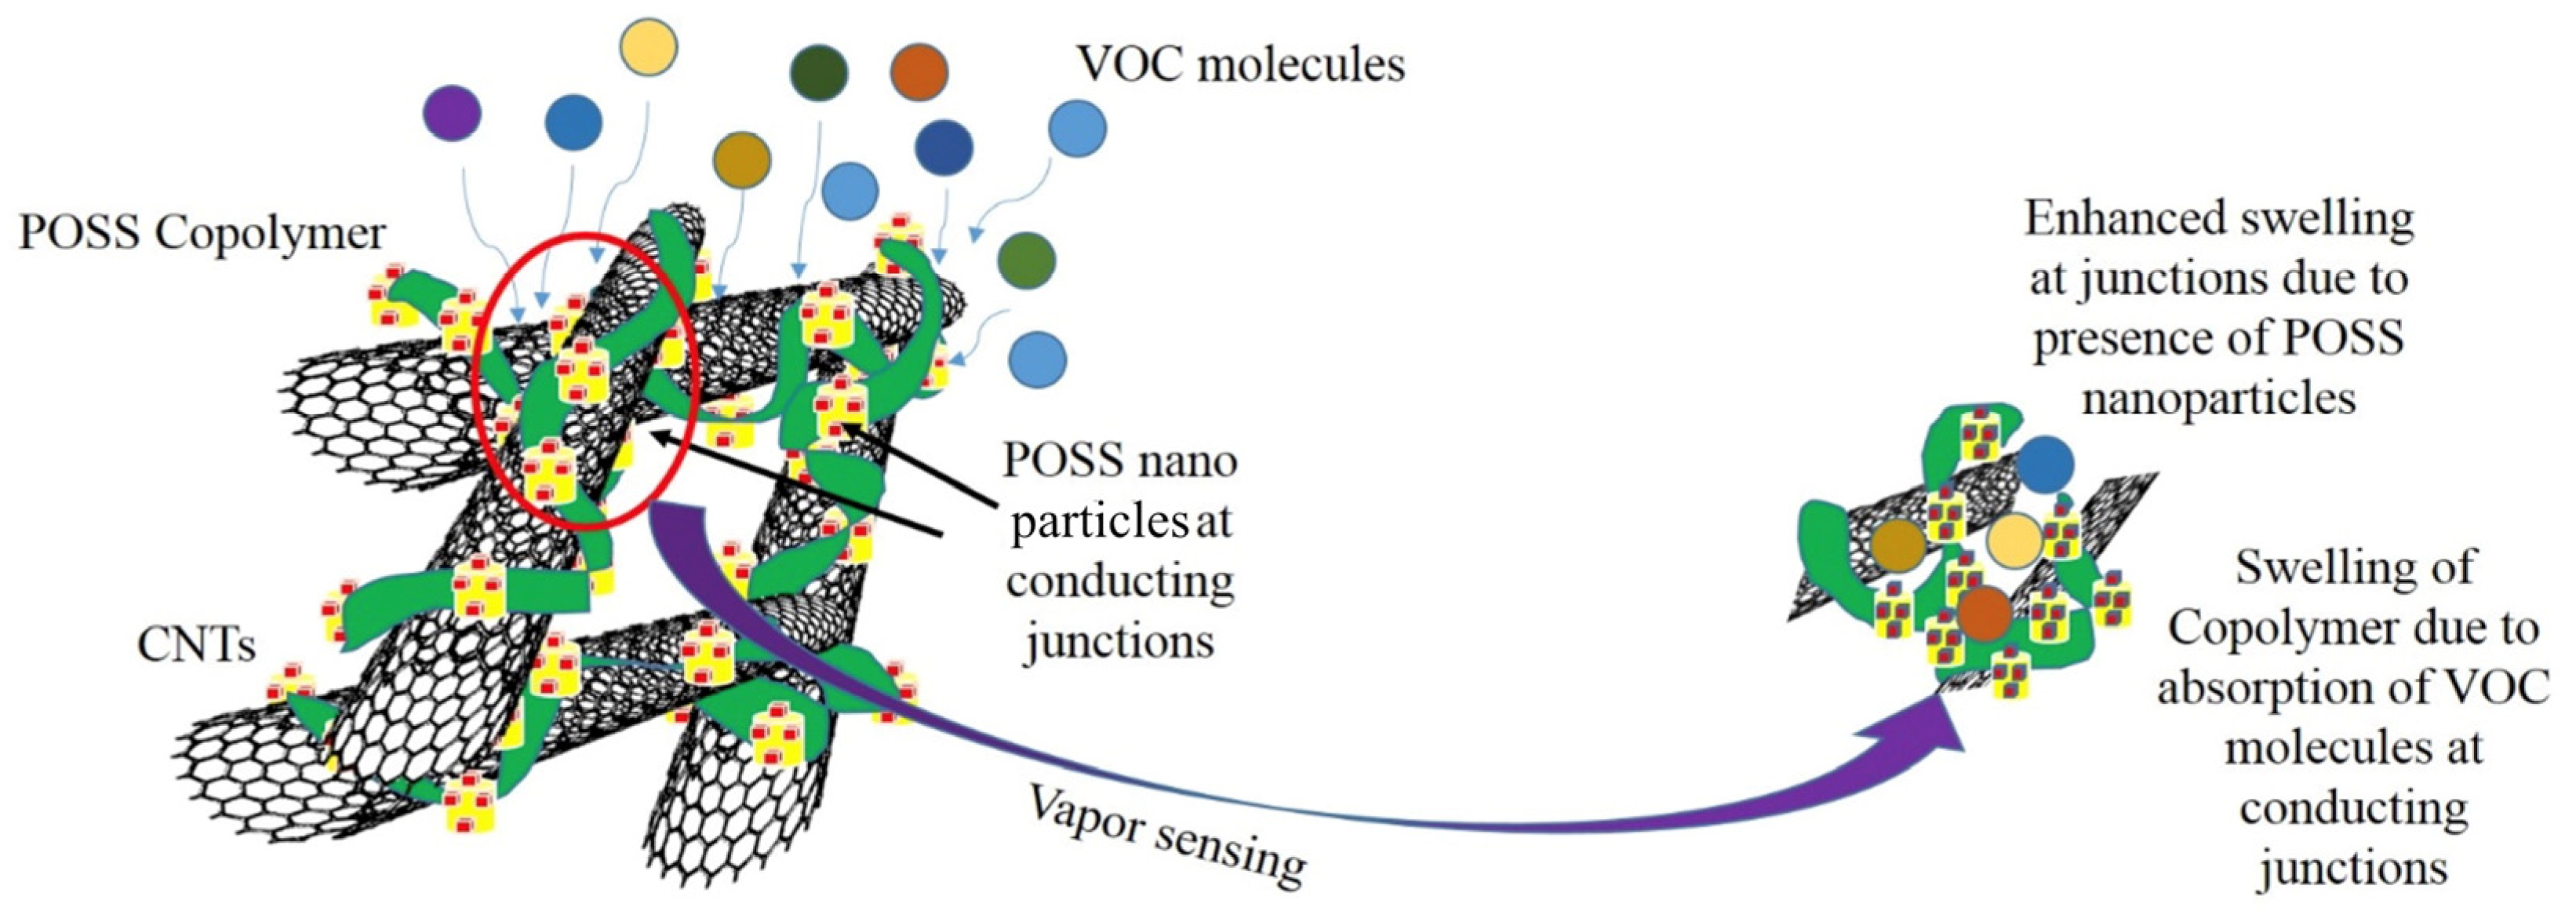
During the fabrication of the transducers by sLbL, the CPC microdroplets are welded to form a random network of CNTs functionalized by POSS copolymers that can coat the junctions between nanotubes. In this area, the alkyl side chains and the hollow structure of POSS contribute to the creation of free volumes favouring both the diffusion of hydrophobic analytes and the disconnection of CNT junctions.
The free volumes present in the copolymer phase result also in a higher molecular mobility than in pure polymer matrices. All these factors can contribute to an increase in the swelling of the coating at conducting nano-junctions, thus amplifying the chemo-resistive response for a given concentration of VOC. The mechanism proposed is described in Figure 6.
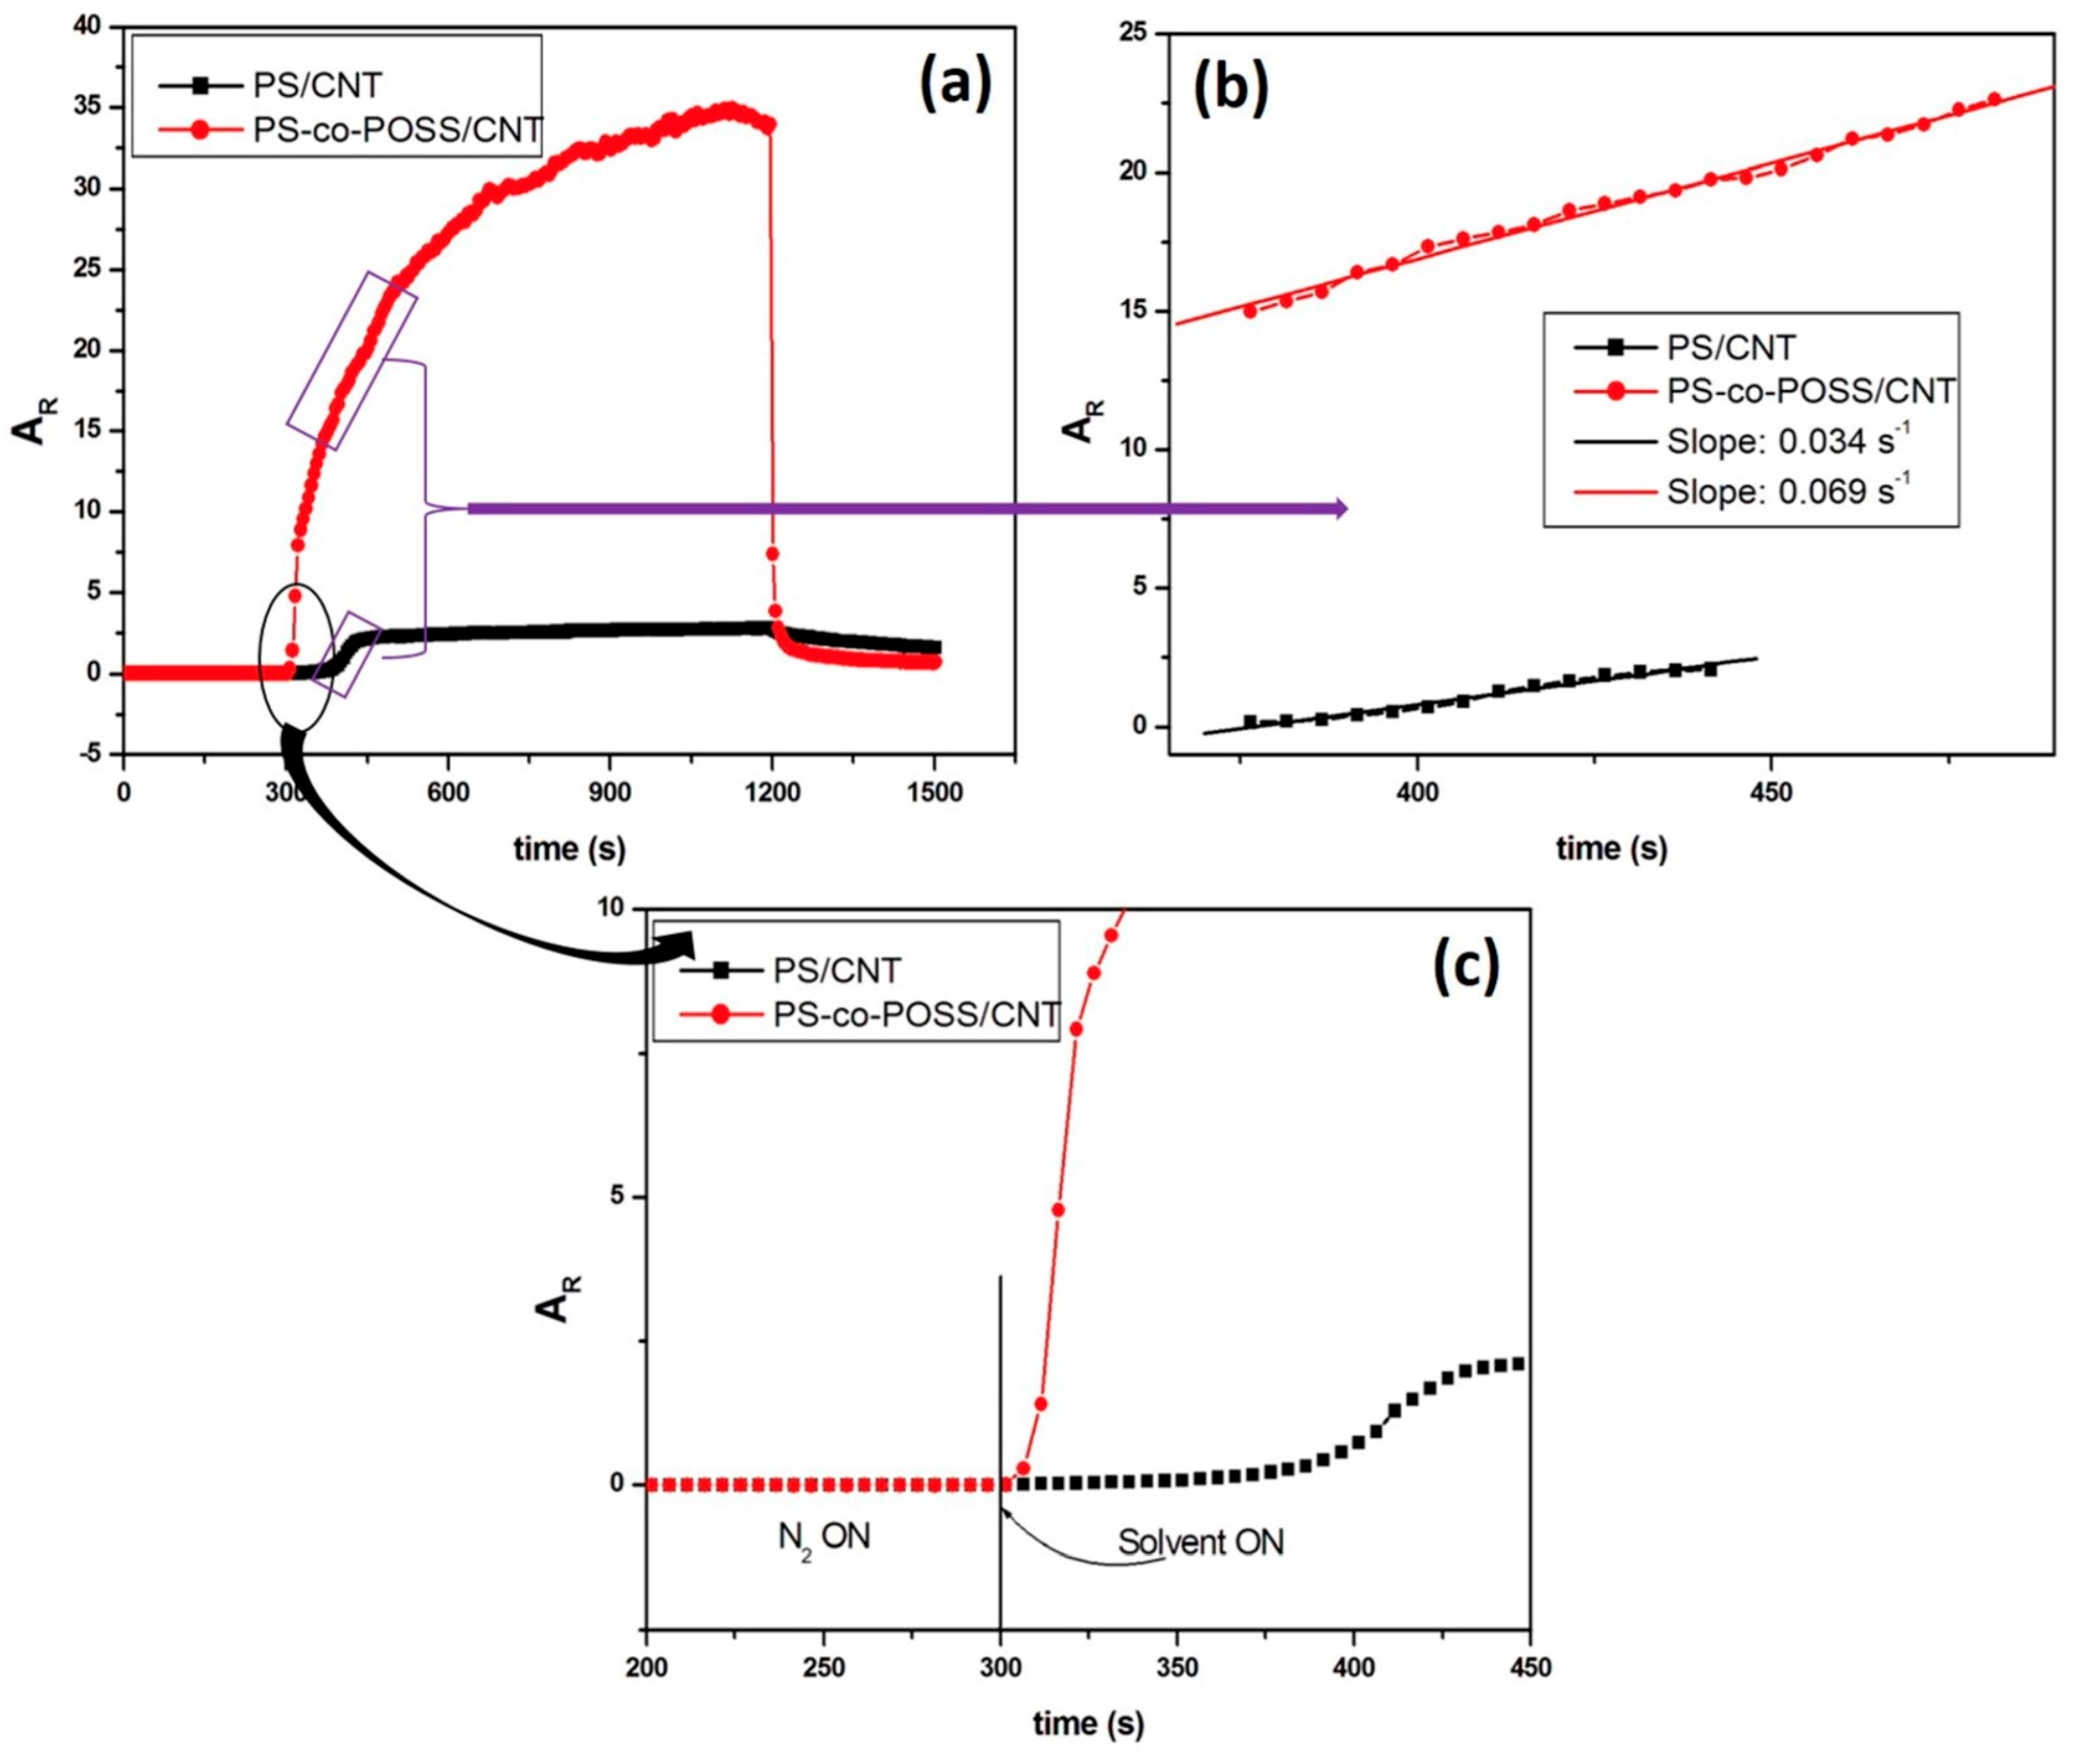
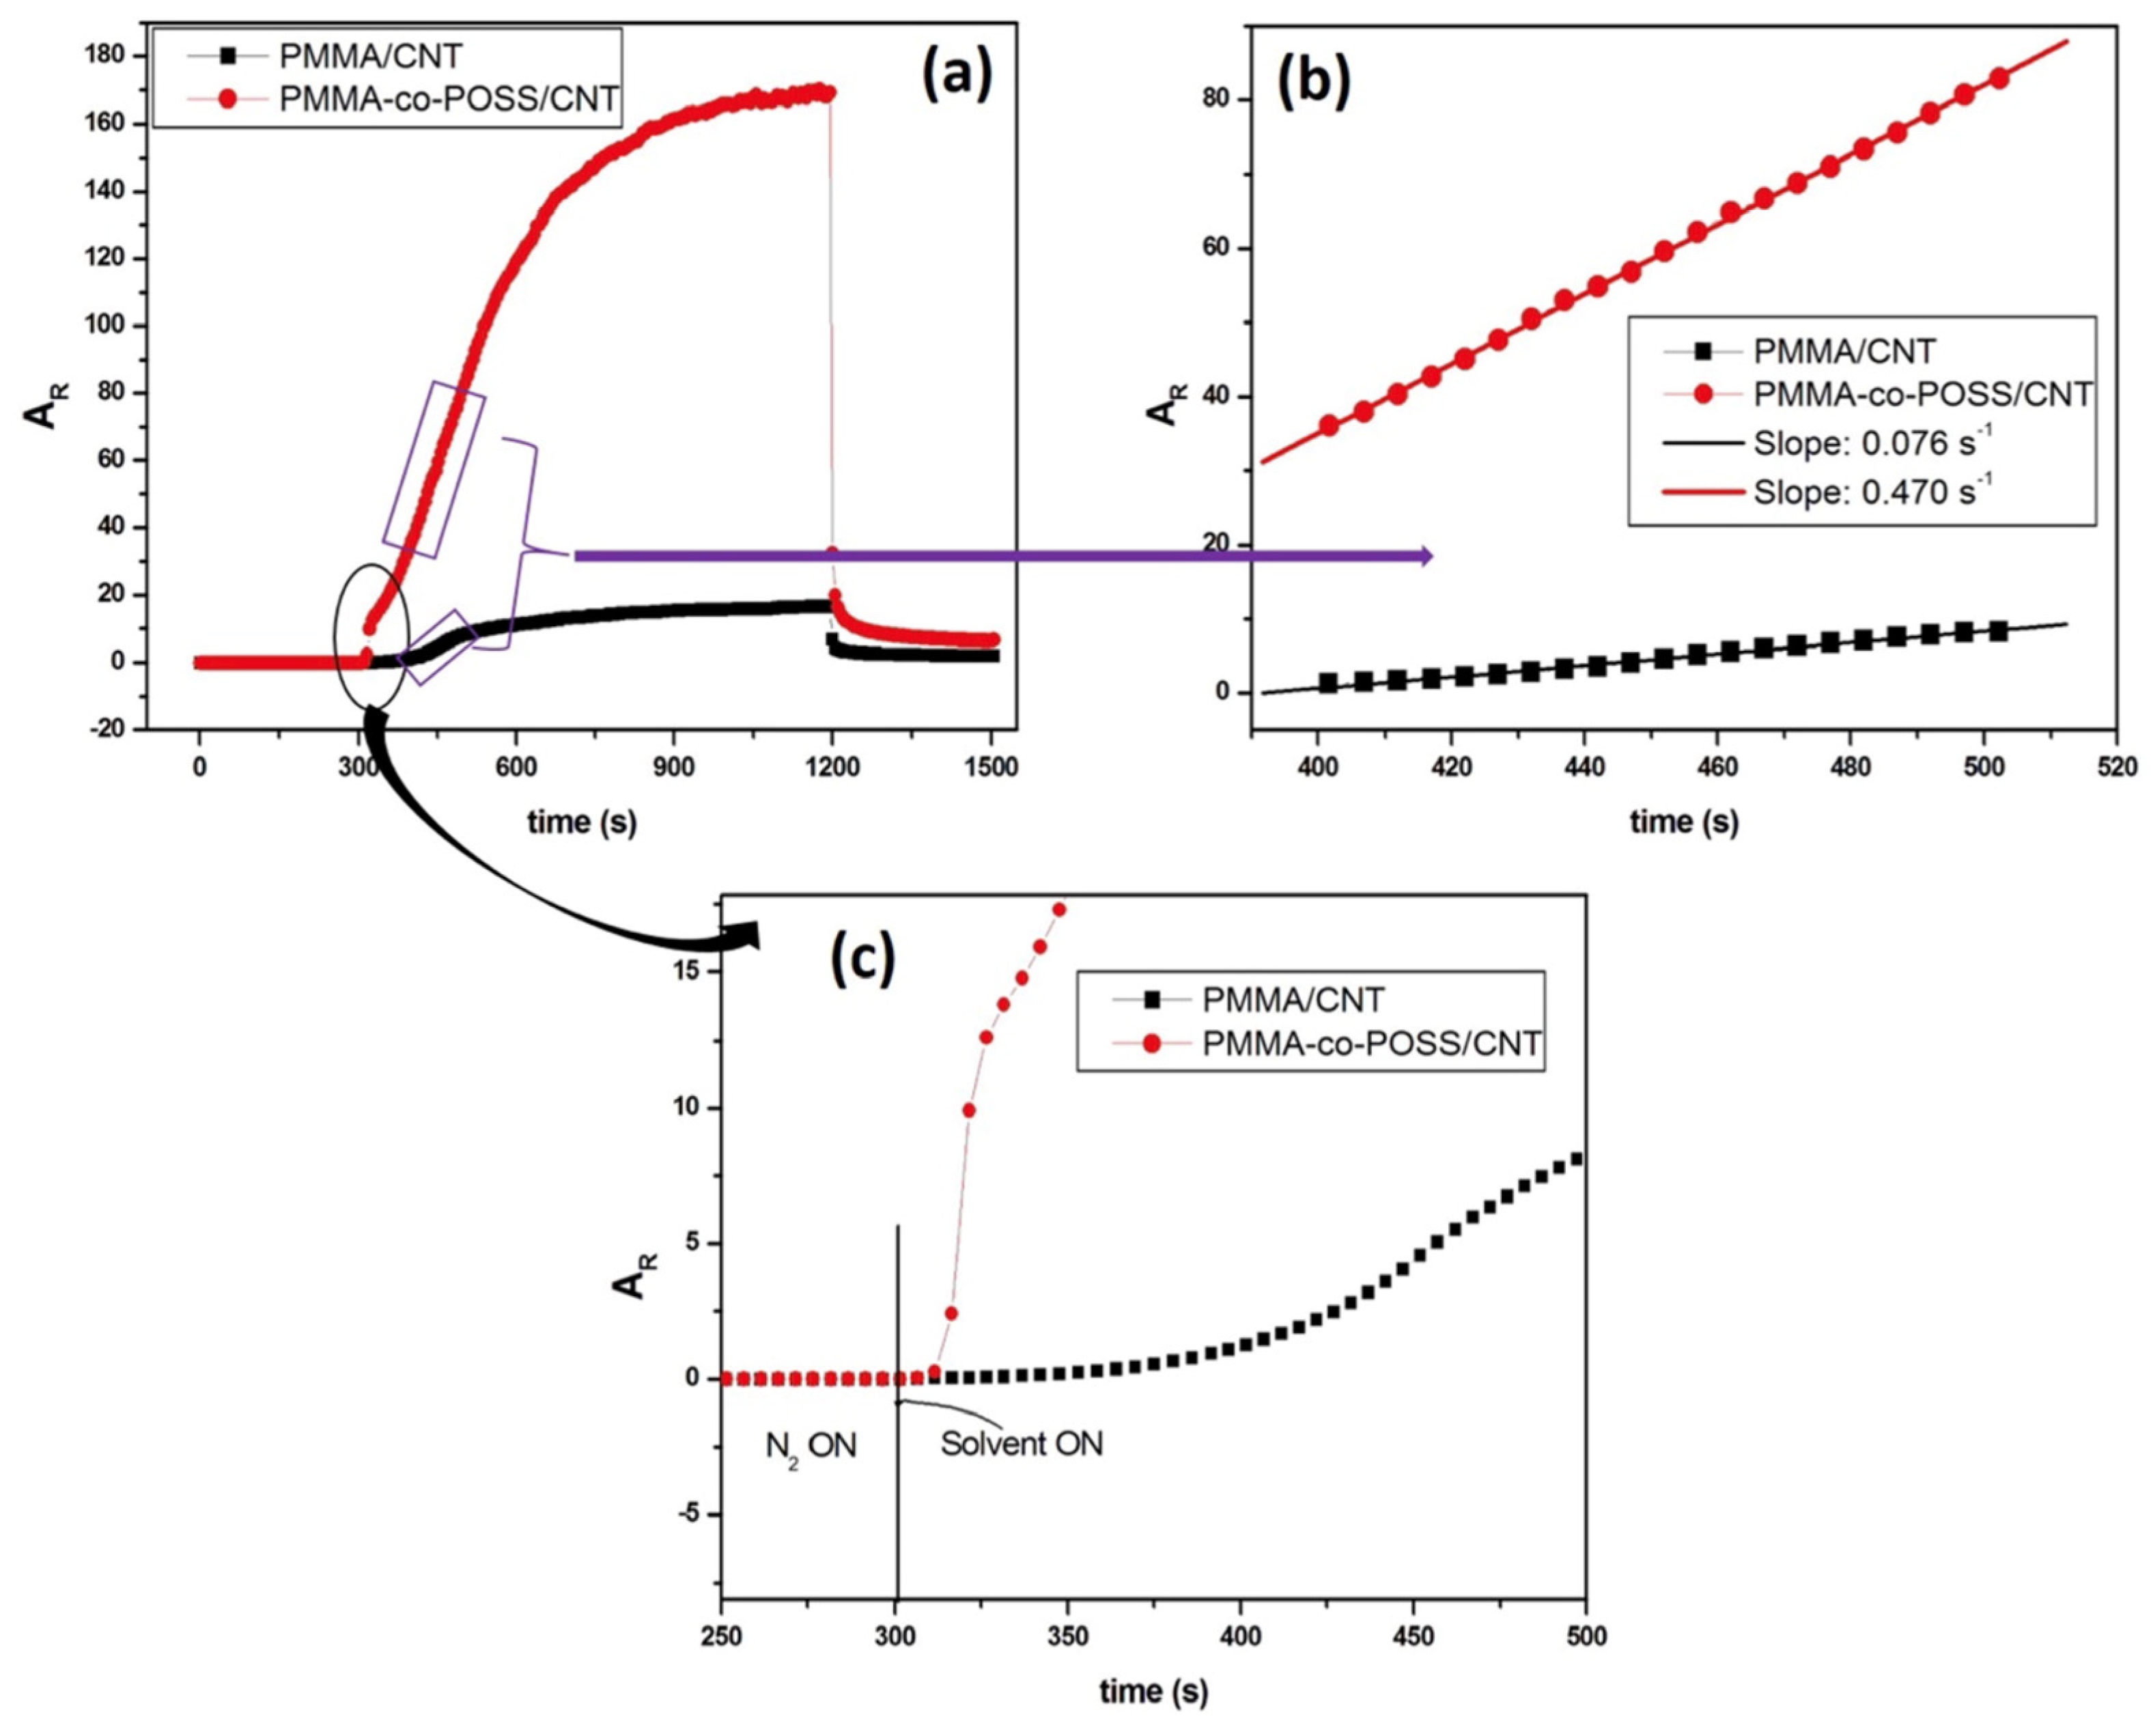
This mechanism was further confirmed with long cycles during dynamic vapour-sensing (DVS) tests. In these experiments, the time of exposure of the vQRS to the analyte was increased from 5 to 15 min to completely saturate the conducting junctions of transducers and determine the time to reach an equilibrium (evidenced by a stable plateau in the chemo-resistive response), the rate of diffusion of solvent molecules (determined by the slope of curves), and the effects of the POSS nano-spacer on the mechanism of sensing. The acetone vapour was selected to evaluate the long-time absorption of PS-CNT and PS-co-POSS/CNT sensors, and for the same purpose, cyclohexane was selected for PMMA-CNT PMMA-co-POSS/CNT sensors. The comparison of the results obtained for PS-co-POSS/CNT and PS-CNT sensors is shown in Figure 7. The observation of the transient response curve in Figure 7a shows that it takes almost 15 min for the PS-co-POSS/CNT to become saturated while the PS-CNT-based sensor only needs 2 min. Zooming in on the beginning of these curves in Figure 7c highlights that PS-co-POSS/CNT has an almost instantaneous response to acetone, whereas a time lag of 1 min is evidenced for PS-CNT. This clearly suggests that POSS nanoparticles increase the kinetics of diffusion in the matrix and favour the adsorption of analytes onto the junctions. This acceleration of the diffusion shows that the analyte molecules find their way more easily through the film thickness in the presence of POSS and swell more effectively for conducting junctions. Such a sudden increase in the signal of the PS-co-POSS/CNT sensor suggests that locally at the conducting junctions, the solvent molecules must be present in sufficient amounts to make clusters that are very active to disconnect the CNT conducting network [73,74]. This clustering phenomenon must be facilitated by the increase in free volume generated by the introduction of POSS into the copolymer chain. The variations in the diffusion coefficient of solvent molecules in the CPC transducers depend quite a bit on their amount of free volume and are directly reflected by the changes in AR. Therefore, the diffusion coefficient of acetone can be correlated with the slope of the sensors’ initial response. Thus, the determination of the rates of change of AR with time from the curves in Figure 7b yields ΔAR/Δt = 0.034 s−1 for PS-CNT and ΔAR/Δt = 0.069 s−1 for PS-co-POSS/CNT. These results show that the diffusion coefficient of the solvent is two times faster in the presence of POSS molecules, which was also noticed during the desorption assisted by nitrogen that was almost immediate.
A similar behaviour was observed when comparing the chemo-resistive responses of PMMA-CNT and PMMA-co-POSS/CNT sensors exposed to a cyclohexane vapour in Figure 8. The response of the PMMA-co-POSS/CNT sensor was much quicker than that of the sensor based on the homopolymer. The PMMA-co-POSS/CNT sensor exhibits a base line change immediately after the introduction of cyclohexane, whereas it took 1.5 min for the PMMA-CNT sensors to respond, as shown in Figure 8c. However, only 4 min was necessary for this sensor to reach the saturation of its response, while PMMA-co-POSS/CNT required 14 min to reach a plateau due to its larger response amplitude (Figure 8a). Comparing the rates of change of AR with time in the beginning of the response to cyclohexane in Figure 8b yielded ΔAR/Δt = 0.470 s−1 for PMMA-co-POSS/CNT, which is six times larger than the value of ΔAR/Δt = 0.076 s−1 obtained for PMMA-CNT. This result confirms the amplifying effect of POSS nano-spacers on the sensitivity of the vQRS to VOC without changing their selectivity. Further, the detection capacity to different lung and skin cancer biomarkers of these POSS copolymer-based vQRS have been investigated.

3.3. Vapour Sensing of Some Lung Cancer VOC Biomarkers with POSS-Based vQRS

The chemo-resistive properties of PS-co-POSS/CNT and PMMA-co-POSS/CNT optimized sensors have been exposed to eighteen different lung and skin cancer biomarkers, plus two air pollutants coming out from paints and varnishes (carbon tetrachloride CCl4 and formalin, a solution of 33% formaldehyde HCHO in water) and water, to examine their potential use for health applications such as the anticipated diagnosis of fatal diseases and air quality control. The responses AR to the selected set of VOC and water, of both sensors are collected in Figure 9. One striking feature is the very high AR obtained for hexene, cyclohexane, and acetone. The response of PMMA-co-POSS/CNT is 177% larger for cyclohexane and 151% higher for hexane than that of PS-co-POSS/CNT. The reason for this lies in the very volatile nature of these compounds that can diffuse in large amounts, due to POSS, to swell a polymer matrix for which they have a strong affinity [66]. As already mentioned, this swelling of the polymer coating the nano-junctions induces an exponential variation in the macroscopic resistance of the transducer. It can be noticed that the response of PMMA-co-POSS/CNT to acetone is nearly five times larger than to alcohols and butanone, which is not surprising as it is a very polar solvent with a strong ability to swell most polymers.
Figure 9 shows that PS-co-POSS is more sensitive to aromatic compounds like benzene derivatives than PMMA-co-POSS, giving a response 12 times larger for xylene, 15 times larger for methylbenzene, and 7 times larger for ethyl benzene. The chemo-resistive response of PS-co-POSS is also 7 times larger for formaldehyde despite the 67% of water to which it is almost not sensitive. Moreover, the PMMA-co-POSS/CNT sensor is also sensitive to alcohols like methanol, ethanol, and propanol, although to a lesser extent.

3.4. Sensitivity of vQRS in the ppm Range of Concentration and Determination of the Limit of Detection

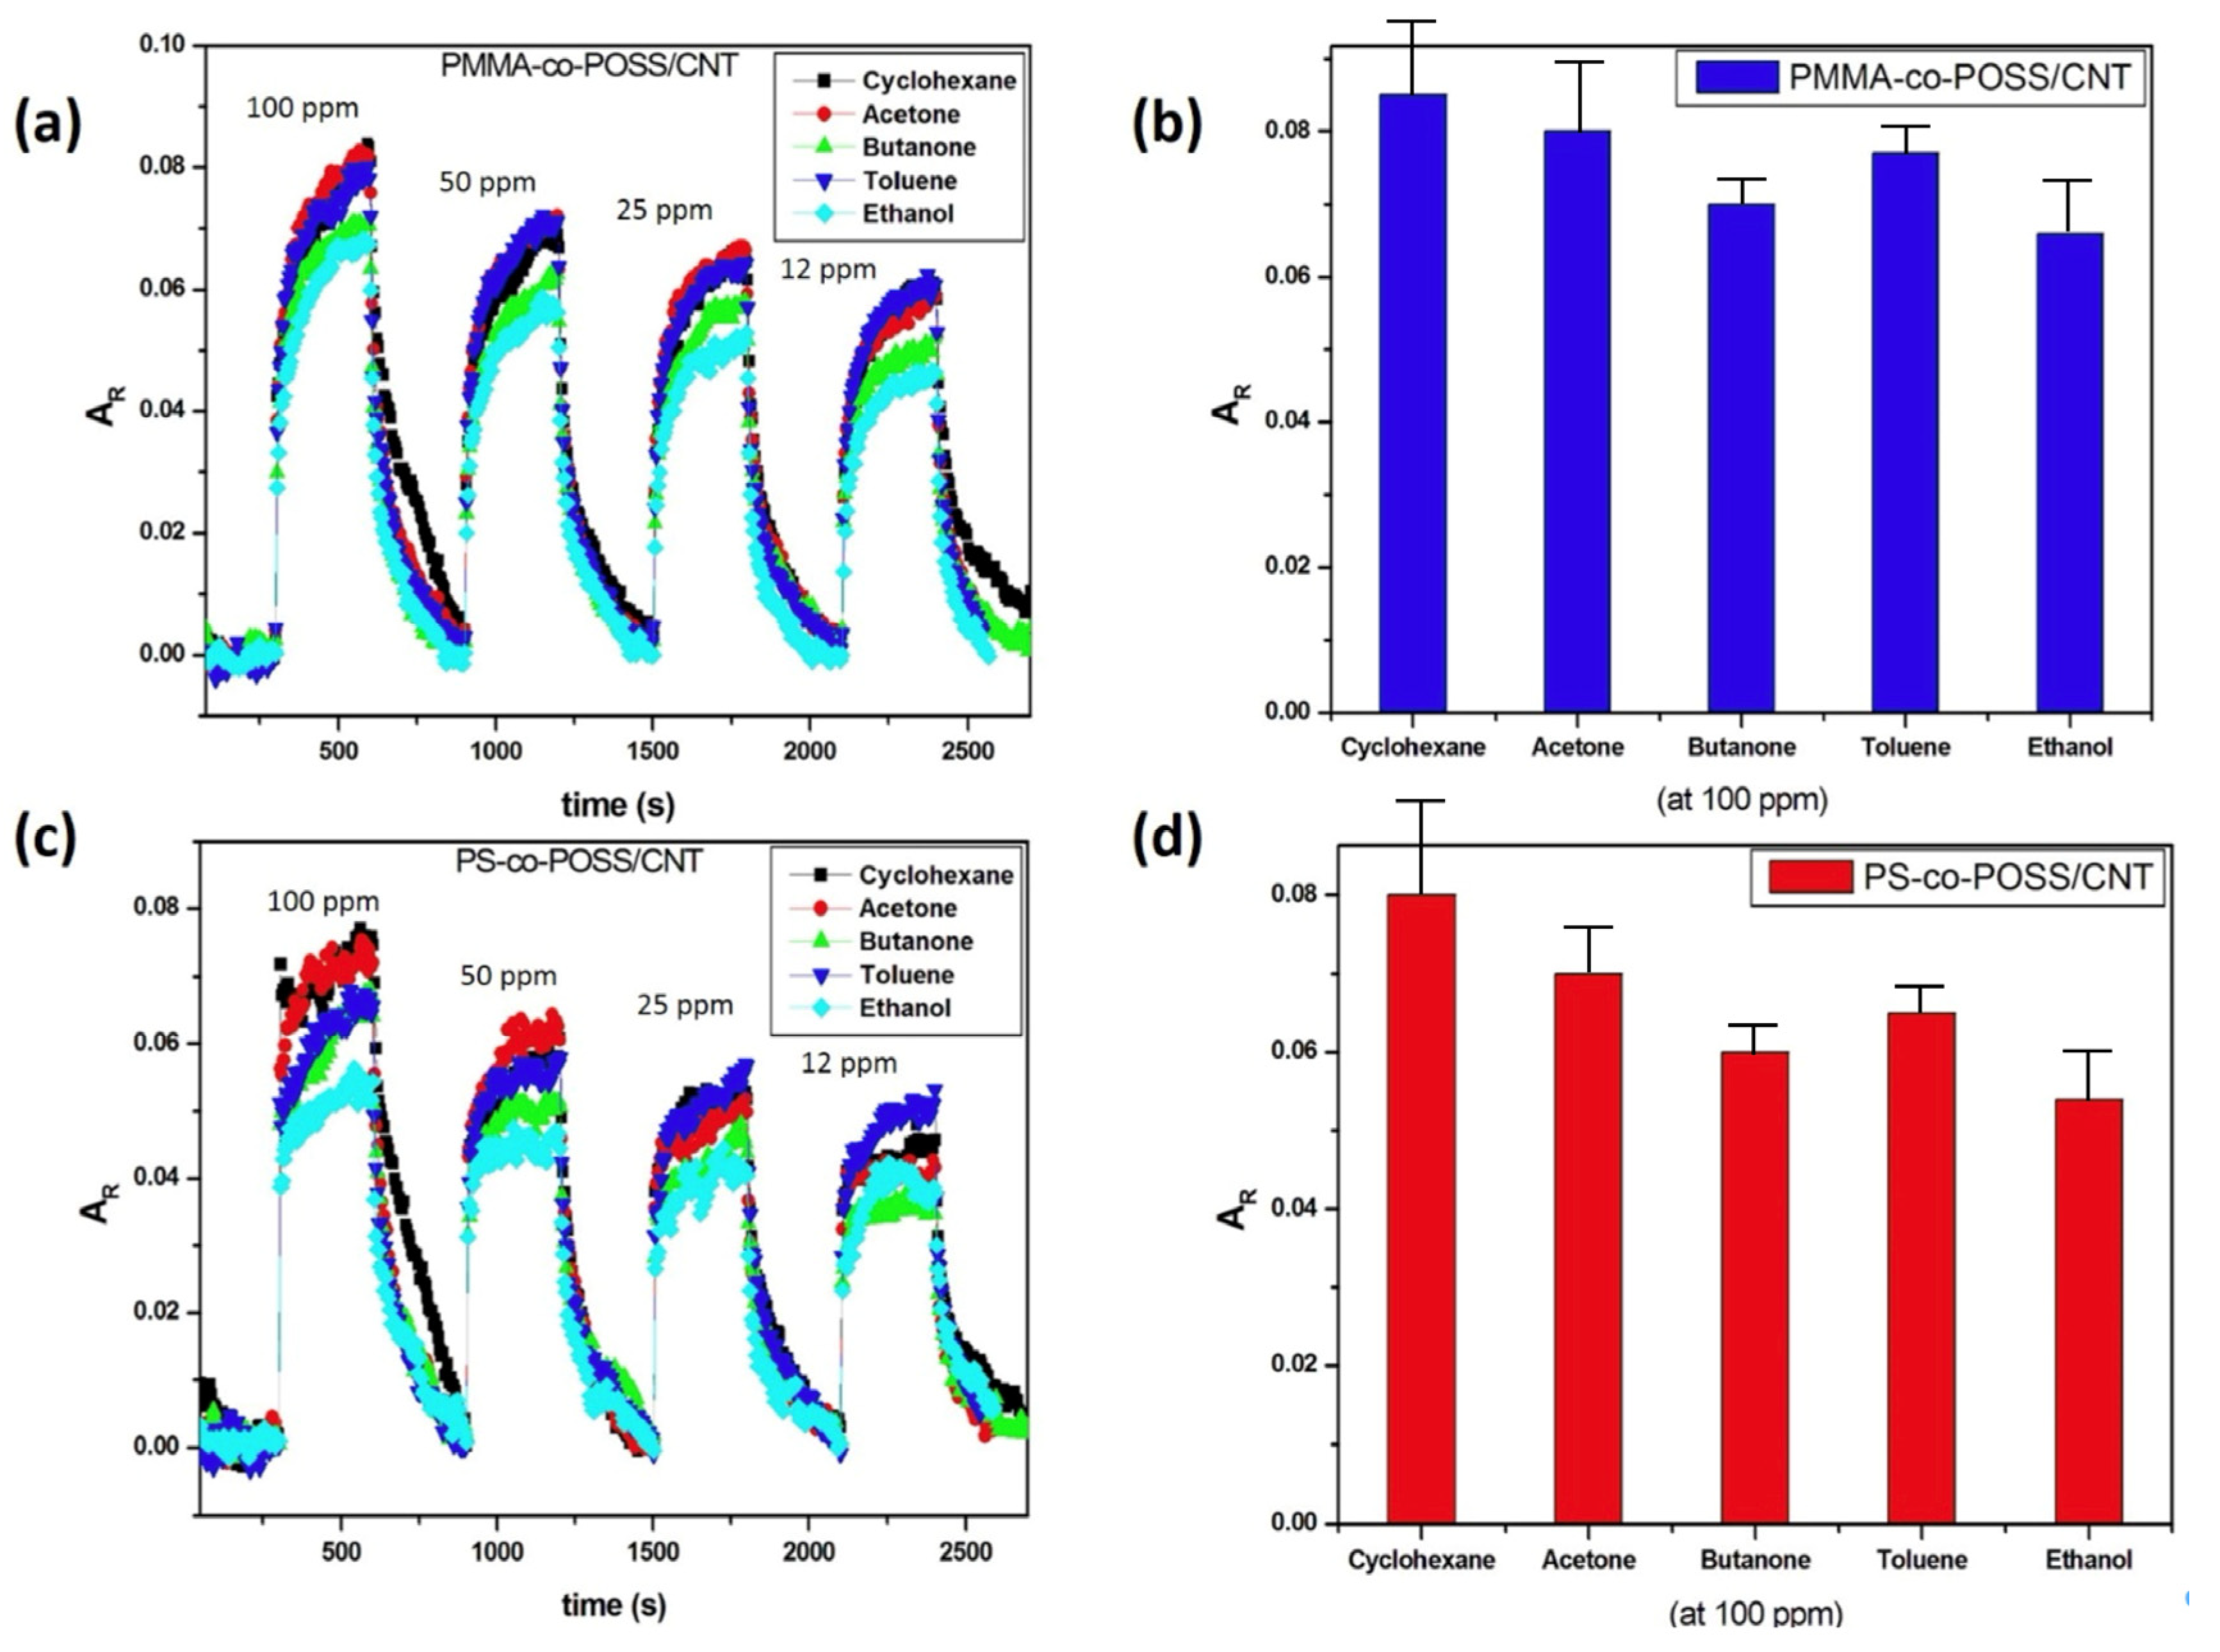
The vapour-sensing experiments with POSS copolymer-based vQRS exposed to VOC at saturation were performed to identify their selectivity depending on the physicochemical interactions between the VOC molecules and the components of the CPC, i.e., the nanofillers and the macromolecules. Nevertheless, the concentration of VOC at saturation generally corresponds to thousands of ppm, whereas the concentrations of interest for applications is commonly some ppm or hundred ppb. Therefore, it is necessary to evaluate the detection capability of sensors at trace levels of molecules and to check their limits of detection by exposing them to controlled ppm amounts of VOC in dry N2 (carrier gas). For this, the sensing performances of both sensors was evaluated at four different ppm concentration for five VOC that already had a good sensitivity in saturated conditions. The maximum chemo-resistive responses AR of PMMA-co-POSS/CNT and PS-co-POSS/CNT exposed to 100 ppm of the five selected VOC are presented in Figure 10b and Figure 10d, respectively. Then, the concentration of VOC was decreased down to 12 ppm in steps, as seen in Figure 10a and Figure 10c, respectively. Both sensors were able to detect VOC at this low ppm concentration, but the signals did not reach a plateau as there was not enough VOC molecules to completely swell the polymer and fully disconnect the nano-junctions. Cyclohexane showed the highest response in both sensors, followed by acetone. This is consistent with the results obtained in saturated VOC conditions. The maximum values of AR were found to decrease according to the ppm amount of VOC, thus confirming the quantitativity of signals and the ability of sensors to detect tiny variations in analytes’ concentration. The performance of sensors to detect VOC can be evaluated by their signal-to-noise ratio (SNR), defined by Equation (2):
S N R = A R ( M A X ) σ b a s e l i n e
where AR(MAX) defines the difference between the maximum resistance of a sensor, obtained after exposure to a solvent and the baseline resistance of a sensor. σbaseline represents the standard deviation in the baseline resistance of a sensor before analyte delivery.
The SNR of a sensor for a VOC needs to be superior to 3 to allow for the proper use of its responses, which was the case here, as the SNR values of the PMMA-co-POSS/CNT and PS-co-POSS/CNT sensors exposed to 12 ppm of ethanol vapours were 51 and 31, respectively.
As the SNR calculation was performed with the ethanol vapour that gives the lowest responses for both sensors, it is expected that the SNR for other VOC will be larger or equivalent. Therefore, these tests confirm the effectiveness of POSS copolymer-based sensors to detect the VOC at ppm concentrations with very good SNR, suggesting that their limit of detection (LOD) can reach the subppm level.

3.5. Origin of Sensors’ Selectivity

As already evidenced in previous works, the diffusion of VOC in CPC transducers is mostly governed by van der Waals interactions between VOC molecules and macromolecules from the matrix (the interactions with CNT are of lesser intensity and can generally be neglected). These interactions can be correlated to the sensing responses to VOC, i.e., AR. It is also interesting to normalized AR with respect to VOC concentration (particularly when working in saturated conditions, as the saturating pressure depends on the nature of the vapour at a defined temperature) to correlate and compare data with other VOC. The normalized chemo-resistive response (A R NOR) is defined by Equation (3) [75].
A R   N O R = A R [ V O C ] S A T T , P 10 5
The interactions of VOC or solvent molecules with polymers are well expressed by the Flory–Huggins intermolecular interaction parameter (χ12), when stronger interactions (ionic or covalent) are absent. χ12 is defined by Equation (4):
χ 12 = V m R T ( δ t p o l 2 δ t v o c 2 )
where Vm is the molar volume of the VOC; T the temperature in Kelvin; R the universal gas constant; and δt pol and δt voc, respectively, the polymer and the VOC total solubility parameters.
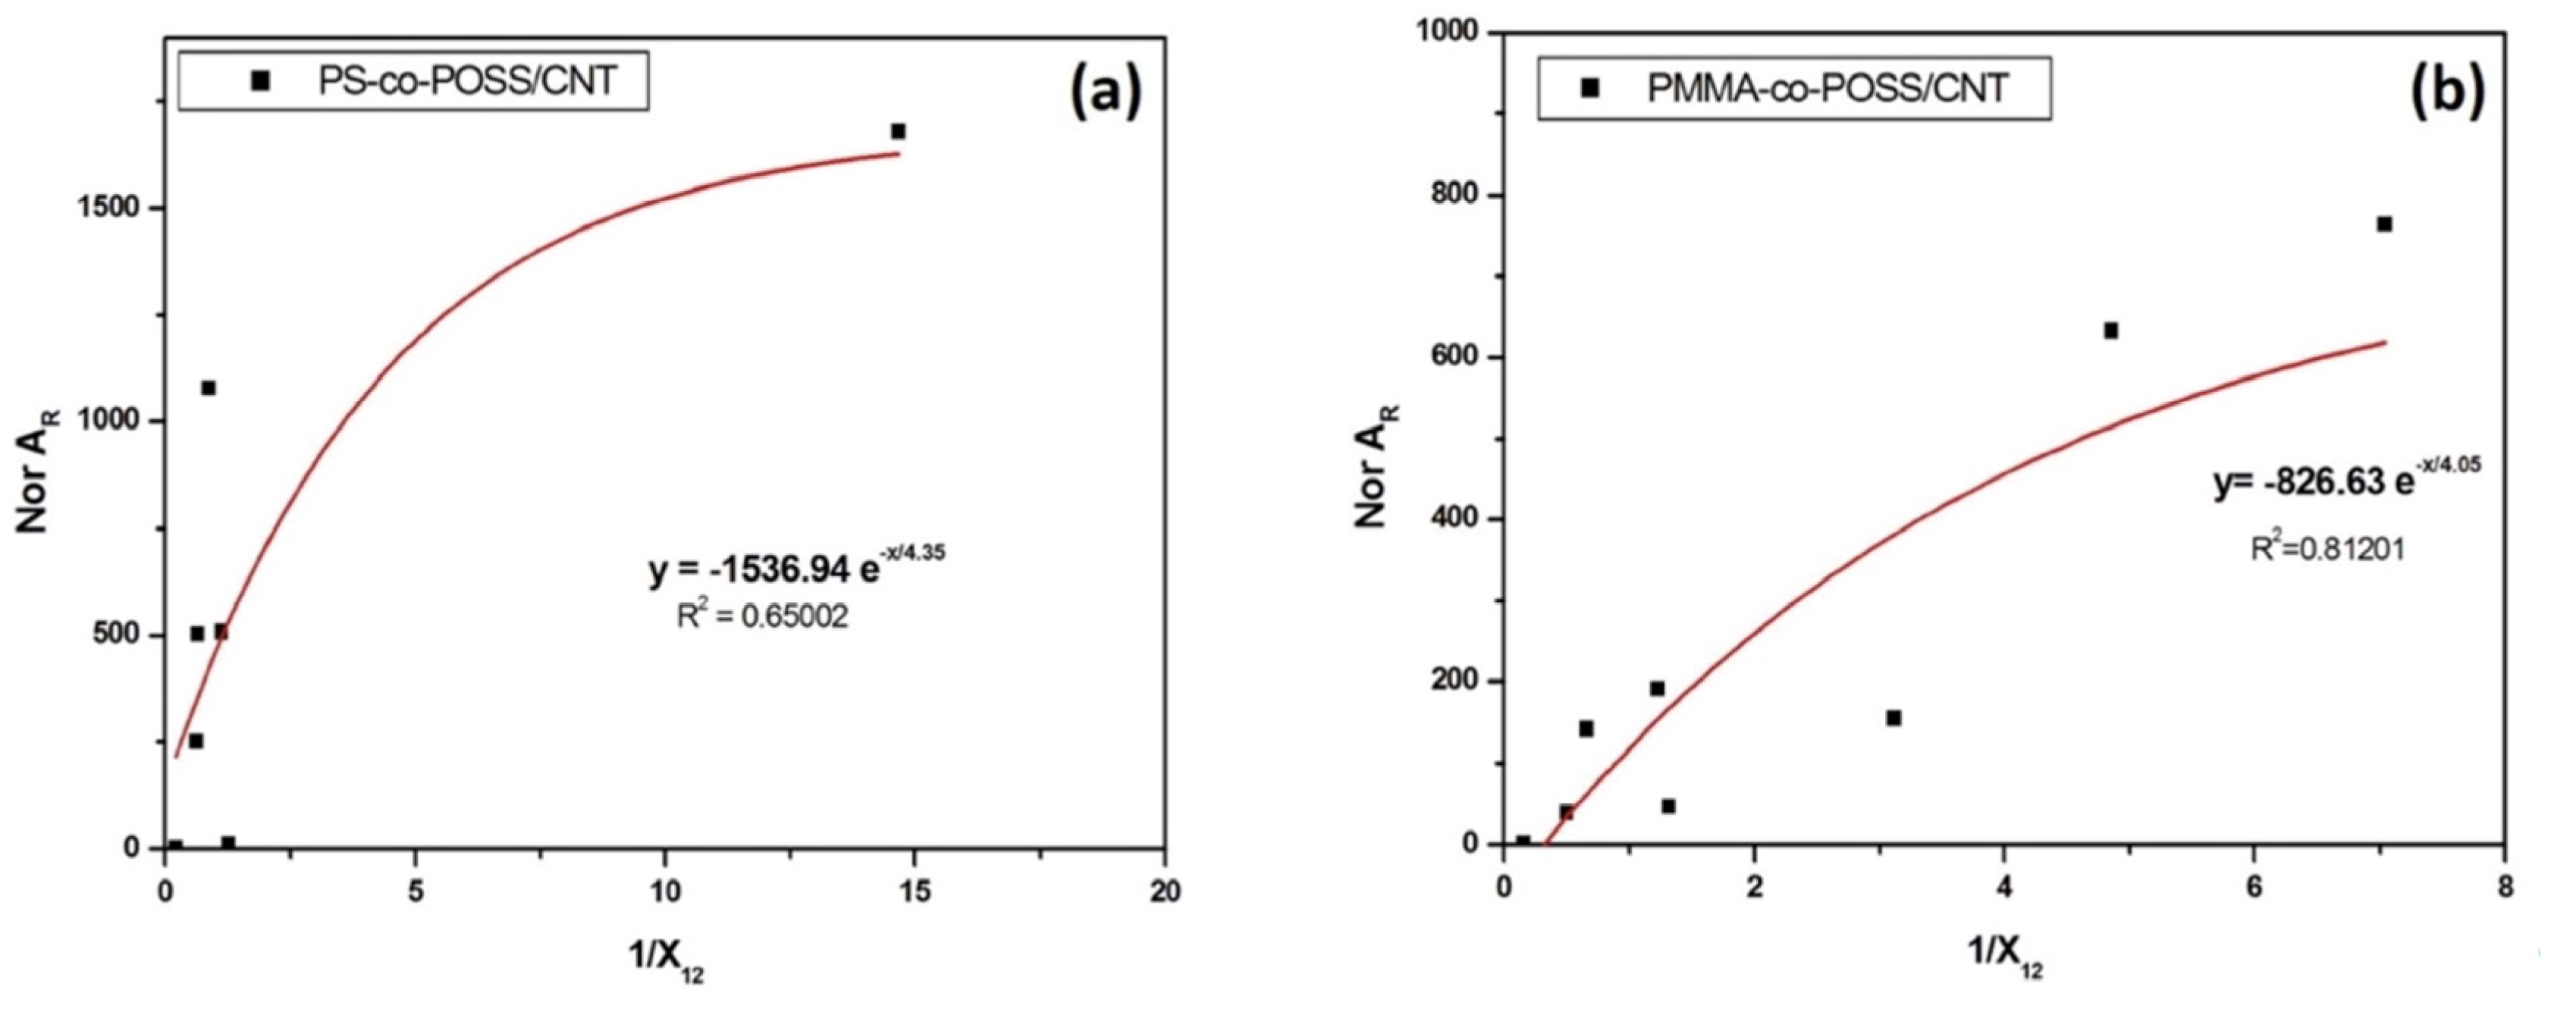
A good affinity between a polymer and a VOC involves them having nearly the same δt values. As the χ12 parameters strongly depend on the solubility parameters of the polymer and the VOC, χ12 must be at a minimum for a couple with high physicochemical interactions. Consequently, a large chemo-resistive response is expected from strong interactions between the sensors’ polymer matrix and VOC molecules, resulting from larger swelling of the nano-junctions. An exponential relationship is found between AR NOR and χ12 for a given VOC–polymer couple, according to Equation (5) [76].
A R   N O R = a e b χ 12 = a e χ 12 b
The χ12 parameters between PS-co-POSS and PMMA-co-POSS, and the different VOC studied have been calculated using the solubility parameters of PS, PMMA, and POSS and are listed in Table 1.
The model worked well with methanol, ethanol, propanol, hexene, cyclohexane, benzaldehyde, ethyl benzene, and toluene, whereas other VOC were assumed to give AR not primarily based on van der Waals interactions, but more likely on their size, which was also found to influence diffusion through the polymer matrix. The curves shown in Figure 11a,b have been plotted using Equation (5) for PS-co-POSS and PMMA-co-POSS, respectively.
The PMMA matrix gives a low value of χ12 for aromatic compounds and so do PS for alcohols and benzaldehyde, which explains the selectivity of the corresponding sensors well. A better fit of data was obtained for PMMA than PS, which suggests that the origin of its selectivity is most likely based on van der Waals interactions.

3.6. Analysis of vQRS Responses by PCA Mapping

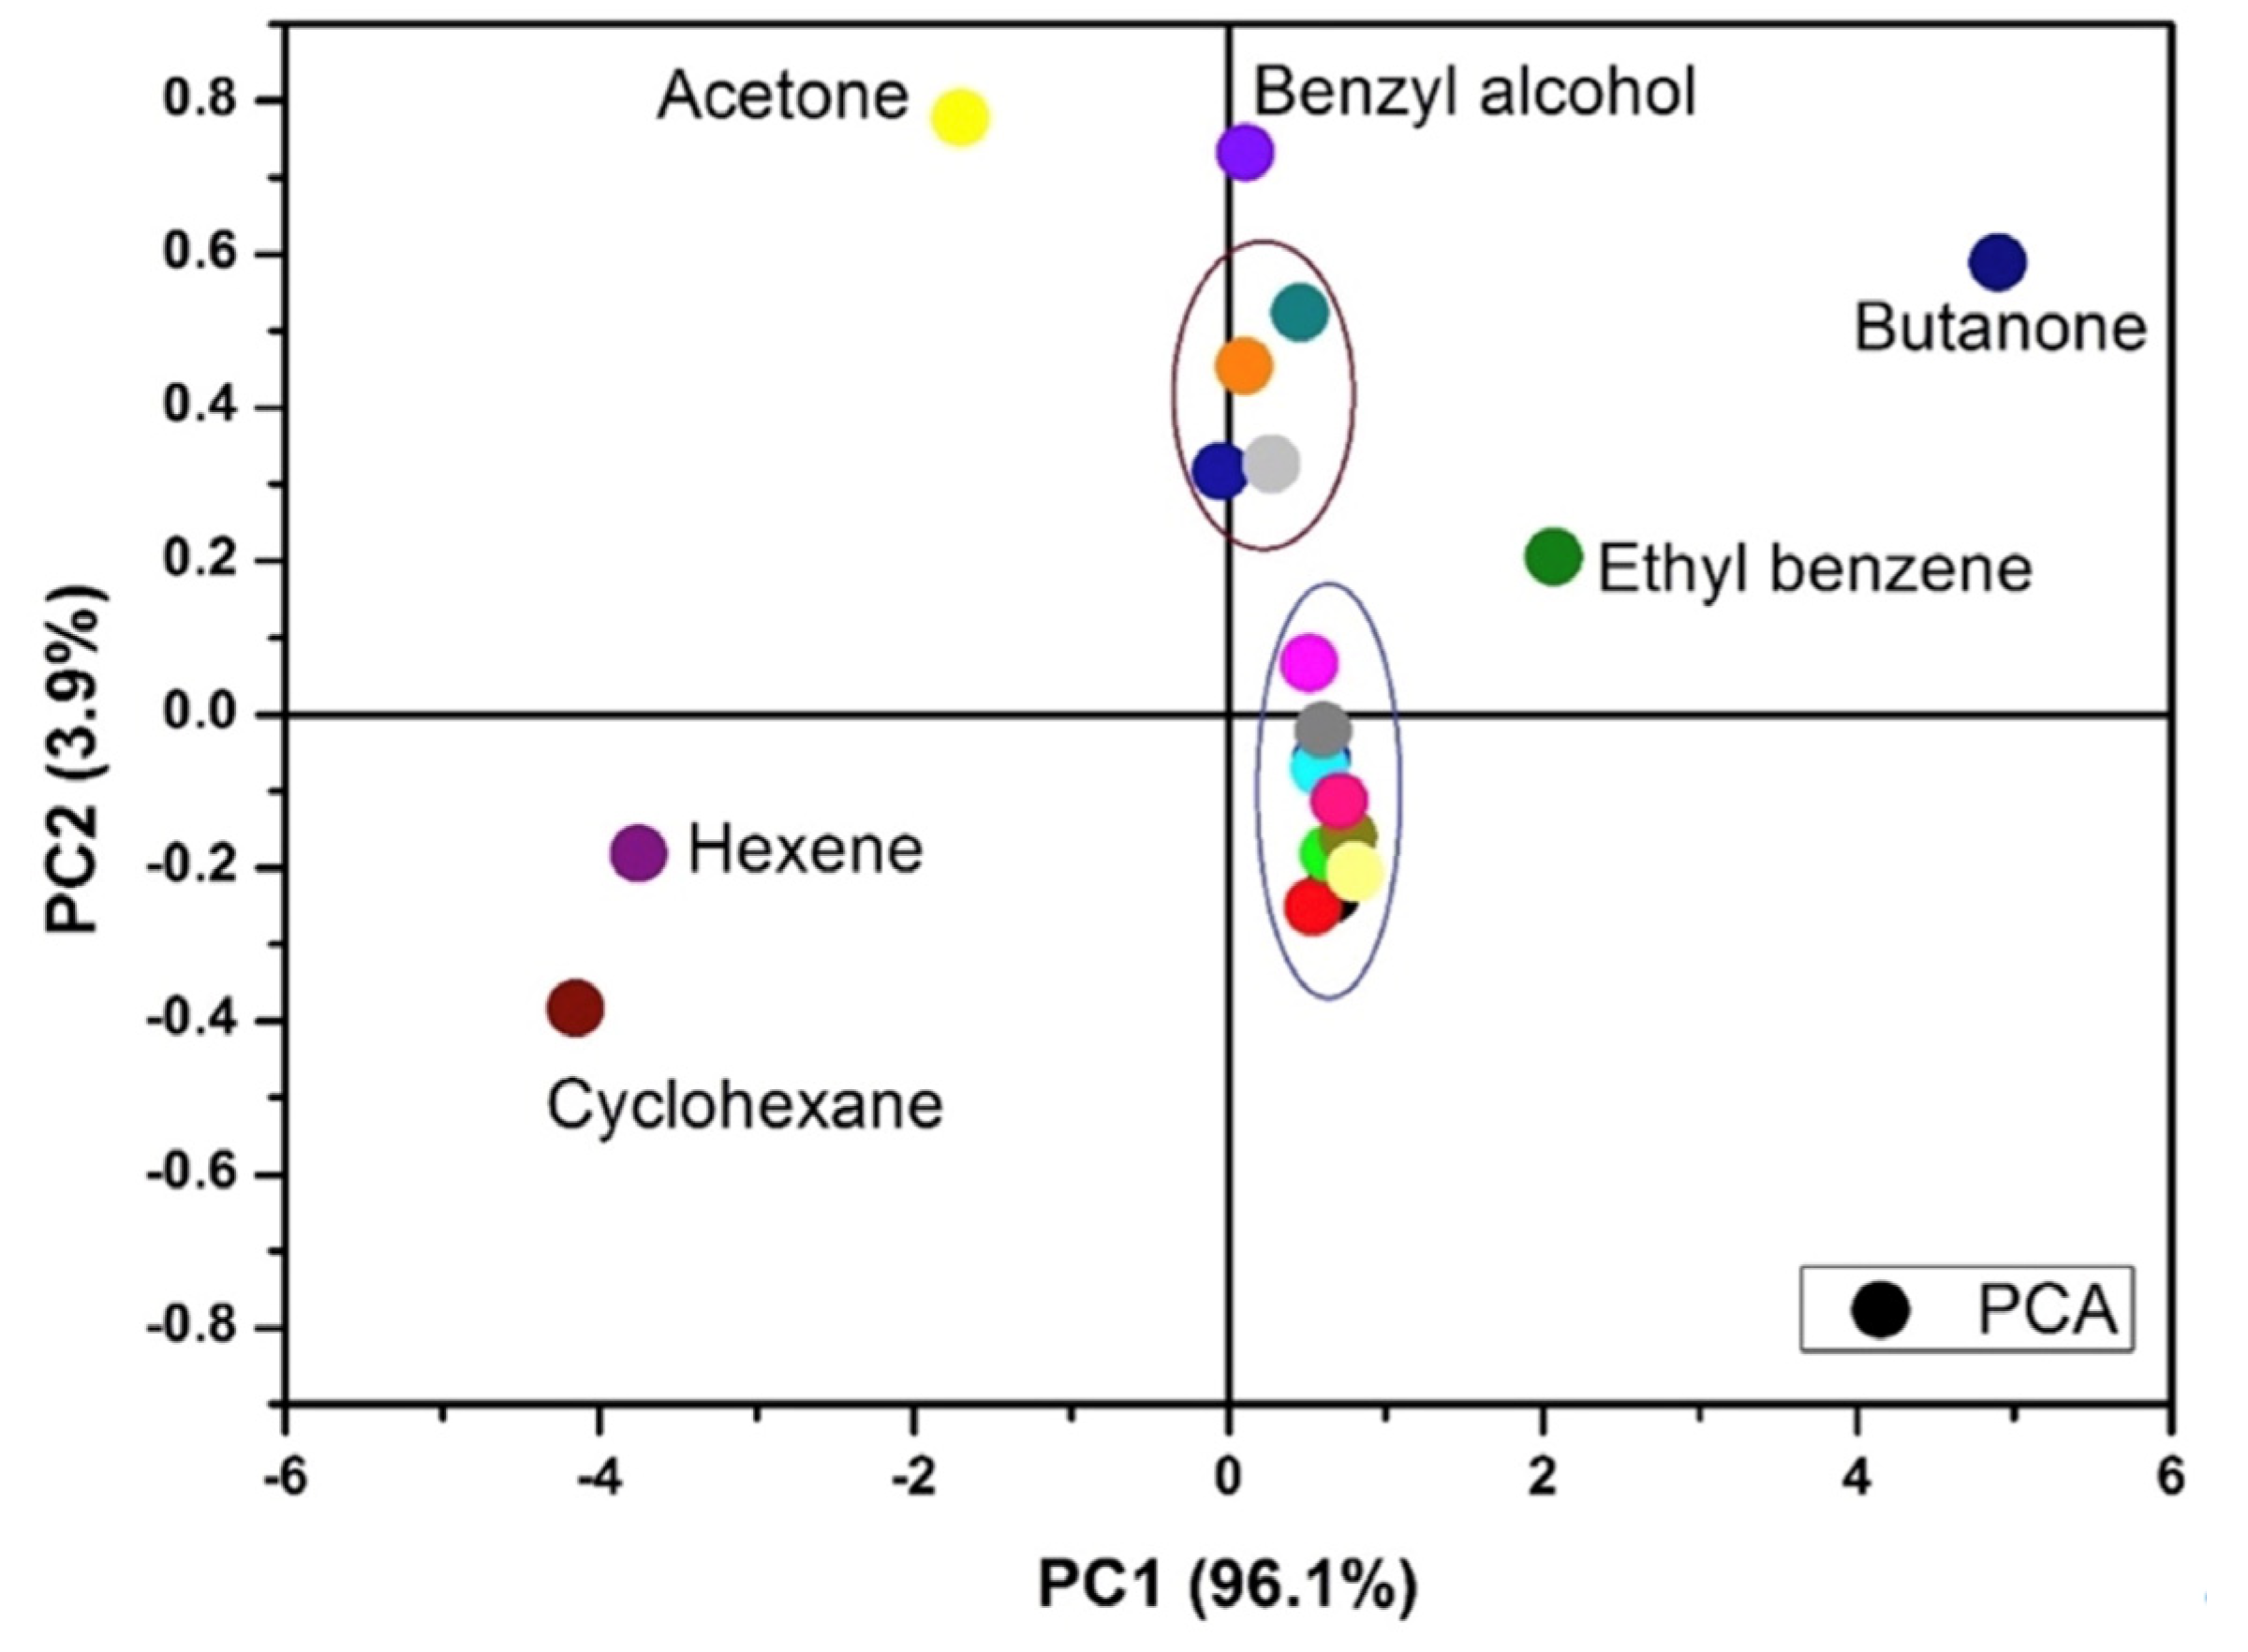
A principal component analysis (PCA) was used as a statistical method to analyse the vapour sensing data of the two sensors exposed to all vapours, with a minimum loss in the information. This treatment is helpful to simplify data analysis since it highlights the discrimination ability of sensors towards all the twenty-one volatiles studied. PCA was performed with the TANAGRA 2017 free software [77]. The average AR(MAX) of both sensors exposed to all VOC including water were composed into a (3 × 22) matrix. The result of the PCA treatment is plotted in Figure 12. The two principal components chosen corresponding to the two axes (PC1 and PC2) were found to represent data with 100 % of the total variance. It was observed from this map that with only two sensors, it was possible to discriminate six of the twenty-one VOC very well. Of course, to improve the separation of VOC, it is necessary to add to the array used for the PCA one or two more vQRS with complementary selectivities.
However, three families of VOC were effectively detected by the two sensors: ketones (acetone and butanone), hydrocarbons (cyclohexane and hexene), and aromatics (benzyl alcohol and ethyl benzene). These compounds are also potential lung cancer biomarkers. The remaining VOC form clusters of points very close to each other and are not easy to separate because of the lack of a sensor sensitive to these molecules in the e-nose.

4. Conclusions

POSS nanoparticle copolymers (PS-co-POSS and PMMA-co-POSS) and CNT were self-assembled by additive manufacturing with a home-made sLbL device to fabricate quantum resistive vapour sensors (vQRS). The random conducting network of CNT was functionalized by either copolymer or pure polymer matrices to investigate the effect of POSS on the sensing performances. The presence of POSS nano-spacers close to the carbon nano-junctions created a “giant” magnification of chemo-resistive responses, greatly enhancing the sensitivity of the vapour sensors without affecting their selectivity. More precisely POSS speeds up the diffusion of analytes to the nano-junctions, as evidenced by the increase in the responses’ slope and the decrease in response time. Both PC- and PMMA-based sensors were found to be poorly sensitive to water molecules, favouring their use for the detection of VOC biomarkers in humid samples such as breath. Further, the two selected sensors were exposed to twenty-one VOC including lung and skin cancer biomarkers, and were found to be mostly sensitive to six of them (acetone, cyclohexane, hexene, benzyl alcohol, and ethyl benzene) but still able to reach good discrimination using a PCA treatment. The sensors have also demonstrated their ability to work at concentrations as low as twelve ppm with very high SNR, suggesting their possible subppm LOD.
Therefore, POSS-based sensors are expected to have high potential in e-noses used for the anticipated diagnosis of diseases by breath analysis and air quality monitoring. Nevertheless, reaching actual applications will still require long-term testing of the chemo-resistive behaviour of vQRS sensors when submitted to cocktails of volatile molecules comprising a large fraction of water.

Author Contributions

Conceptualization, J.-F.F. and M.C.; methodology, A.S. and M.C.; validation, J.-F.F., V.C. and M.C.; formal analysis, A.S.; investigation, A.S. and J.-F.F.; resources, J.-F.F., V.C. and M.C.; data curation, A.S. and M.C.; writing—original draft preparation, A.S.; writing—review and editing, J.-F.F., V.C. and M.C.; supervision, J.-F.F., V.C. and M.C.; project administration, J.-F.F.; funding acquisition, J.-F.F. and V.C. All authors have read and agreed to the published version of the manuscript.

Funding

This research received no external funding.

Institutional Review Board Statement

Not applicable.

Informed Consent Statement

Not applicable.

Data Availability Statement

Data are contained within the article.

Acknowledgments

We are grateful to Hervé BELLEGOU and Isabelle PILLIN for their contribution to this work, and the University of South Brittany (UBS) of Lorient and the Indian Institute of Technology (IIT) Delhi for the funding.

Conflicts of Interest

The authors declare no conflicts of interest.

References

  1. Nasiri, N.; Clarke, C. Nanostructured Chemiresistive Gas Sensors for Medical Applications. Sensors 2019, 19, 462. [Google Scholar] [CrossRef] [PubMed]
  2. Sachan, A.; Castro, M.; Feller, J.F. Volatolomics for Anticipated Diagnosis of Cancers with Chemoresistive Vapour Sensors: A Review. Chemosensors 2025, 13, 15. [Google Scholar] [CrossRef]
  3. Kaloumenou, M.; Skotadis, E.; Lagopati, N.; Efstathopoulos, E.; Tsoukalas, D. Breath Analysis: A Promising Tool for Disease Diagnosis—The Role of Sensors. Sensors 2022, 22, 1238. [Google Scholar] [CrossRef] [PubMed]
  4. Tai, H.; Wang, S.; Duan, Z.; Jiang, Y. Evolution of Breath Analysis Based on Humidity and Gas Sensors: Potential and Challenges. Sens. Actuators B Chem. 2020, 318, 128104. [Google Scholar] [CrossRef]
  5. Broza, Y.Y.; Zuri, L.; Haick, H. Combined Volatolomics for Monitoring of Human Body Chemistry. Sci. Rep. 2014, 4, 4611. [Google Scholar] [CrossRef]
  6. Li, W.; Jia, Z.; Xie, D.; Chen, K.; Cui, J.; Liu, H. Recognizing Lung Cancer Using a Homemade E-Nose: A Comprehensive Study. Comput. Biol. Med. 2020, 120, 103706. [Google Scholar] [CrossRef]
  7. Lee, T.; Yu, J.; Lee, S.W.; Oh, S.H.; Kang, D.; Son, H.; Hwang, H.J.; You, J.H.; Lee, G. Machine Learning-Integrated Biomimetic Electronic Noses: Future Perspectives. Microchem. J. 2025, 213, 113638. [Google Scholar] [CrossRef]
  8. Glöckler, J.; Mitrovics, J.; Beeken, S.; Leja, M.; Welearegay, T.; Österlund, L.; Haick, H.; Shani, G.; Di Natale, C.; Murillo, R.; et al. Infrared Spectroscopic Electronic Noses: An Innovative Approach for Exhaled Breath Sensing. ACS Sens. 2025, 10, 427–438. [Google Scholar] [CrossRef]
  9. Dawson, J.; Green, K.; Lazarowicz, H.; Cornford, P.; Probert, C. Analysis of Urinary Volatile Organic Compounds for Prostate Cancer Diagnosis: A Systematic Review. BJUI Compass 2024, 5, 936–947. [Google Scholar] [CrossRef]
  10. Bernabei, M.; Pennazza, G.; Santonico, M.; Corsi, C.; Roscioni, C.; Paolesse, R.; Di Natale, C.; D’Amico, A. A Preliminary Study on the Possibility to Diagnose Urinary Tract Cancers by an Electronic Nose. Sens. Actuators B Chem. 2008, 131, 1–4. [Google Scholar] [CrossRef]
  11. Velumani, M.; Prasanth, A.; Narasimman, S.; Chandrasekhar, A.; Sampson, A.; Meher, S.R.; Rajalingam, S.; Rufus, E.; Alex, Z.C. Nanomaterial-Based Sensors for Exhaled Breath Analysis: A Review. Coatings 2022, 12, 1989. [Google Scholar] [CrossRef]
  12. Peng, G.; Hakim, M.; Broza, Y.Y.; Billan, S.; Abdah-Bortnyak, R.; Kuten, A.; Tisch, U.; Haick, H. Detection of Lung, Breast, Colorectal, and Prostate Cancers from Exhaled Breath Using a Single Array of Nanosensors. Br. J. Cancer 2010, 103, 542–551. [Google Scholar] [CrossRef] [PubMed]
  13. D’Amico, A.; Bono, R.; Pennazza, G.; Santonico, M.; Mantini, G.; Bernabei, M.; Zarlenga, M.; Roscioni, C.; Martinelli, E.; Paolesse, R.; et al. Identification of Melanoma with a Gas Sensor Array. Ski. Res. Technol. 2008, 14, 226–236. [Google Scholar] [CrossRef] [PubMed]
  14. Kwak, J.; Gallagher, M.; Ozdener, M.H.; Wysocki, C.J.; Goldsmith, B.R.; Isamah, A.; Faranda, A.; Fakharzadeh, S.S.; Herlyn, M.; Johnson, A.T.C.; et al. Volatile Biomarkers from Human Melanoma Cells. J. Chromatogr. B Anal. Technol. Biomed. Life Sci. 2013, 931, 90–96. [Google Scholar] [CrossRef]
  15. Shurmer, H.V.; Gardner, J.W.; Corcoran, P. Intelligent Vapour Discrimination Using a Composite 12-Element Sensor Array. Sens. Actuators B Chem. 1990, 1, 256–260. [Google Scholar] [CrossRef]
  16. Freund, M.S.; Lewis, N.S. A Chemically Diverse Conducting Polymer-Based “Electronic Nose”. Proc. Natl. Acad. Sci. USA 1995, 92, 2652–2656. [Google Scholar] [CrossRef]
  17. Persaud, K.; Dodd, G. Analysis of Discrimination Mechanisms in the Mammalian Olfactory System Using a Model Nose. Nature 1982, 299, 352–355. [Google Scholar] [CrossRef]
  18. D’Amico, A.; Di Natale, C.; Macagnano, A.; Davide, F.; Mantini, A.; Tarizzo, E.; Paolesse, R.; Boschi, T. Technologies and Tools for Mimicking Olfaction: Status of the Rome “Tor Vergata” Electronic Nose. Biosens. Bioelectron. 1998, 13, 711–721. [Google Scholar] [CrossRef]
  19. Singh, A.; Ahmed, E.; Rather, M.D.; Sundararajan, A.; Sharma, A.; Choudhary, F.S.; Sundramoorthy, A.K.; Dixit, S.; Vatin, N.I.; Arya, S. Marketing Strategies in Nanomaterials for Sensor Applications: Bridging Lab to Market. Glob. Chall. 2025, 9, 2400294. [Google Scholar] [CrossRef]
  20. Tomić, M.; Šetka, M.; Vojkůvka, L.; Vallejos, S. VOC Sensing by Metal Oxides, Conductive Polymers, and Carbon-Based Materials. Nanomaterials 2021, 11, 552. [Google Scholar] [CrossRef]
  21. Amann, A.; Corradi, M.; Mazzone, P.; Mutti, A. Lung Cancer Biomarkers in Exhaled Breath. Expert Rev. Mol. Diagn. 2011, 11, 207–217. [Google Scholar] [CrossRef] [PubMed]
  22. Hakim, M.; Broza, Y.Y.; Barash, O.; Peled, N.; Phillips, M.; Amann, A.; Haick, H. Volatile Organic Compounds of Lung Cancer and Possible Biochemical Pathways. Chem. Rev. 2012, 112, 5949–5966. [Google Scholar] [CrossRef] [PubMed]
  23. Yang, K.; Sun, Q.; Xue, F.; Lin, D. Adsorption of Volatile Organic Compounds by Metal–Organic Frameworks MIL-101: Influence of Molecular Size and Shape. J. Hazard. Mater. 2011, 195, 124–131. [Google Scholar] [CrossRef] [PubMed]
  24. Bernstein, J.A.; Alexis, N.; Bacchus, H.; Bernstein, I.L.; Fritz, P.; Horner, E.; Li, N.; Mason, S.; Nel, A.; Oullette, J.; et al. The Health Effects of Nonindustrial Indoor Air Pollution. J. Allergy Clin. Immunol. 2008, 121, 585–591. [Google Scholar] [CrossRef]
  25. Hopkins, A.R.; Lewis, N.S. Detection and Classification Characteristics of Arrays of Carbon Black/Organic Polymer Composite Chemiresistive Vapor Detectors for the Nerve Agent Simulants Dimethylmethylphosphonate and Diisopropylmethylphosponate. Anal. Chem. 2001, 73, 884–892. [Google Scholar] [CrossRef]
  26. Chan, H.P.; Lewis, C.; Thomas, P.S. Exhaled Breath Analysis: Novel Approach for Early Detection of Lung Cancer. Lung Cancer 2009, 63, 164–168. [Google Scholar] [CrossRef]
  27. Tisch, U.; Haick, H. Nanomaterials for Cross-Reactive Sensor Arrays. MRS Bull. 2011, 35, 797–803. [Google Scholar] [CrossRef]
  28. Peng, G.; Tisch, U.; Haick, H. Detection of Nonpolar Molecules by Means of Carrier Scattering in Random Networks of Carbon Nanotubes: Toward Diagnosis of Diseases via Breath Samples. Nano Lett. 2009, 9, 1362–1368. [Google Scholar] [CrossRef]
  29. Wilson, A. Advances in Electronic-Nose Technologies for the Detection of Volatile Biomarker Metabolites in the Human Breath. Metabolites 2015, 5, 140–163. [Google Scholar] [CrossRef]
  30. Cho, S.Y.; Yoo, H.W.; Kim, J.Y.; Jung, W.B.; Jin, M.L.; Kim, J.S.; Jeon, H.J.; Jung, H.T. High-Resolution p-Type Metal Oxide Semiconductor Nanowire Array as an Ultrasensitive Sensor for Volatile Organic Compounds. Nano Lett. 2016, 16, 4508–4515. [Google Scholar] [CrossRef]
  31. Zhang, D.; Jiang, C.; Li, P.; Sun, Y. Layer-by-Layer Self-Assembly of Co3O4 Nanorod-Decorated MoS2 Nanosheet-Based Nanocomposite toward High-Performance Ammonia Detection. ACS Appl. Mater. Interfaces 2017, 9, 6462–6471. [Google Scholar] [CrossRef] [PubMed]
  32. Du, D.; Wang, J.; Wang, B.; Zhu, L.; Hong, X. Ripeness Prediction of Post Harvest Kiwifruit Using a MOS E-Nose Combined with Chemometrics. Sensors 2019, 19, 419. [Google Scholar] [CrossRef] [PubMed]
  33. Bochenkov, V.E.; Sergeev, G.B. Sensitivity, Selectivity, and Stability of Gas-Sensitive Metal-Oxide Nanostructures. In Metal Oxide Nanostructures & Their Applications; Umar, A., Hahn, Y.B., Eds.; American Scientific Publishers: Valencia, CA, USA, 2010; Volume 3, pp. 31–52. ISBN 1588831760. [Google Scholar]
  34. Zhang, L.; Tian, J.; Wang, Y.; Wang, T.; Wei, M.; Li, F.; Li, D.; Yang, Y.; Yu, H.; Dong, X. Polyoxometalates Electron Acceptor-Intercalated In2O3@SnO2 Nanofibers for Chemiresistive Ethanol Gas Sensors. Sens. Actuators B Chem. 2024, 410, 135728. [Google Scholar] [CrossRef]
  35. Li, Y.; Wang, Z.; Zhao, T.; Li, H.; Jiang, J.; Ye, J. Electronic Nose for the Detection and Discrimination of Volatile Organic Compounds: Application, Challenges, and Perspectives. TrAC Trends Anal. Chem. 2024, 180, 117958. [Google Scholar] [CrossRef]
  36. Li, J.; Qiao, J.; Liu, C.; Zhou, Z.; Kong, C.; Chang, Z.; Weng, X.; Zhang, S. Study on the Geographic Traceability and Growth Age of Panax Ginseng C. A. Meyer Base on an Electronic Nose and Fourier Infrared Spectroscopy. Chemosensors 2025, 13, 176. [Google Scholar] [CrossRef]
  37. Fine, G.F.; Cavanagh, L.M.; Afonja, A.; Binions, R. Metal Oxide Semi-Conductor Gas Sensors in Environmental Monitoring. Sensors 2010, 10, 5469–5502. [Google Scholar] [CrossRef]
  38. Tung, T.T.; Castro, M.; Feller, J.F.; Kim, T.Y.; Suh, K.S. Hybrid Film of Chemically Modified Graphene and Vapor-Phase-Polymerized PEDOT for Electronic Nose Applications. Org. Electron. 2013, 14, 2789–2794. [Google Scholar] [CrossRef]
  39. Zhang, L.; Xing, S.; Yin, H.; Weisbecker, H.; Tran, H.T.; Guo, Z.; Han, T.; Wang, Y.; Liu, Y.; Wu, Y.; et al. Skin-Inspired, Sensory Robots for Electronic Implants. Nat. Commun. 2024, 15, 4777. [Google Scholar] [CrossRef]
  40. Chen, S.; Xu, S.; Fan, X.; Xiao, X.; Duan, Z.; Zhao, X.; Chen, G.; Zhou, Y.; Chen, J. Advances in 2D Materials for Wearable Biomonitoring. Mater. Sci. Eng. R Rep. 2025, 164, 100971. [Google Scholar] [CrossRef]
  41. Wang, S.; Yang, T.; Zhang, D.; Hua, Q.; Zhao, Y. Unveiling Gating Behavior in Piezoionic Effect: Toward Neuromimetic Tactile Sensing. Adv. Mater. 2024, 36, 2405391. [Google Scholar] [CrossRef]
  42. Rajesh; Ahuja, T.; Kumar, D. Recent Progress in the Development of Nano-Structured Conducting Polymers/Nanocomposites for Sensor Applications. Sens. Actuators B Chem. 2009, 136, 275–286. [Google Scholar] [CrossRef]
  43. Castro, M.; Kumar, B.; Feller, J.F.; Haddi, Z.; Amari, A.; Bouchikhi, B. Novel E-Nose for the Discrimination of Volatile Organic Biomarkers with an Array of Carbon Nanotubes (CNT) Conductive Polymer Nanocomposites (CPC) Sensors. Sens. Actuators B Chem. 2011, 159, 213–219. [Google Scholar] [CrossRef]
  44. Michael, E.K.; Robert, H.G.; Lewis, N.S. Properties of Vapor Detector Arrays Formed through Plasticization of Carbon Black−Organic Polymer Composites. Anal. Chem. 2002, 76, 1307–1315. [Google Scholar] [CrossRef]
  45. Mondal, I.; Zoabi, A.; Haick, H. Biodegradable, Humidity-insensitive Mask-Integrated E-nose for Sustainable and Non-invasive Continuous Breath Analysis. Adv. Funct. Mater. 2025, 2425193. [Google Scholar] [CrossRef]
  46. Chatterjee, S.; Castro, M.; Feller, J.F. An E-Nose Made of Carbon Nanotube Based Quantum Resistive Sensors for the Detection of Eighteen Polar/Nonpolar VOC Biomarkers of Lung Cancer. J. Mater. Chem. B 2013, 1, 4563. [Google Scholar] [CrossRef]
  47. Kumar, B.; Castro, M.; Feller, J.F. Tailoring the Chemo-Resistive Response of Self-Assembled Polysaccharide-CNT Sensors by Chain Conformation at Tunnel Junctions. Carbon 2012, 50, 3627–3634. [Google Scholar] [CrossRef]
  48. Zhang, W.; Müller, A.H.E. Architecture, Self-Assembly and Properties of Well-Defined Hybrid Polymers Based on Polyhedral Oligomeric Silsequioxane (POSS). Prog. Polym. Sci. 2013, 38, 1121–1162. [Google Scholar] [CrossRef]
  49. Pielichowski, K.; Njuguna, J.; Janowski, B.; Pielichowski, J. Polyhedral Oligomeric Silsesquioxanes (POSS)-Containing Nanohybrid Polymers. In Supramolecular Polymers Polymeric Betains Oligomers; Springer: Berlin/Heidelberg, Germany, 2006; pp. 225–296. ISBN 978-3-540-31924-5. [Google Scholar]
  50. Gnanasekaran, D.; Madhavpan, K.; Reddy, R.S.R. Developments of Polyhedral Oligomeric Silsesquioxanes (POSS), POSS Nanocomposites and Their Applications: A Review. J. Sci. Ind. Res. 2009, 68, 437–464. [Google Scholar]
  51. Franchini, E.; Galy, J.; Gérard, J.F.; Tabuani, D.; Medici, A. Influence of POSS Structure on the Fire Retardant Properties of Epoxy Hybrid Networks. Polym. Degrad. Stab. 2009, 94, 1728–1736. [Google Scholar] [CrossRef]
  52. Raftopoulos, K.N.; Pielichowski, K. Segmental Dynamics in Hybrid Polymer/POSS Nanomaterials. Prog. Polym. Sci. 2016, 52, 136–187. [Google Scholar] [CrossRef]
  53. Tanaka, K.; Adachi, S.; Chujo, Y. Structure–Property Relationship of Octa-Substituted POSS in Thermal and Mechanical Reinforcements of Conventional Polymers. J. Polym. Sci. A Polym. Chem. 2009, 47, 5690–5697. [Google Scholar] [CrossRef]
  54. Li, S.; Simon, G.P.; Matisons, J.G. Morphology of Blends Containing High Concentrations of POSS Nanoparticles in Different Polymer Matrices. Polym. Eng. Sci. 2010, 50, 991–999. [Google Scholar] [CrossRef]
  55. Fina, A.; Monticelli, O.; Camino, G. POSS-Based Hybrids by Melt/Reactive Blending. J. Mater. Chem. 2010, 20, 9297–9305. [Google Scholar] [CrossRef]
  56. Thakur, V.K.; Ding, G.; Ma, J.; Lee, P.S.; Lu, X. Hybrid Materials and Polymer Electrolytes for Electrochromic Device Applications. Adv. Mater. 2012, 24, 4071–4096. [Google Scholar] [CrossRef]
  57. Maitra, P.; Wunder, S.L. POSS Based Electrolytes for Rechargeable Lithium Batteries. Electrochem. Solid-State Lett. 2004, 7, A88. [Google Scholar] [CrossRef]
  58. Nguyen, T.-P. Polymer-Based Nanocomposites for Organic Optoelectronic Devices. A Review. Surf. Coat. Technol. 2011, 206, 742–752. [Google Scholar] [CrossRef]
  59. Ghanbari, H.; Cousins, B.G.; Seifalian, A.M. A Nanocage for Nanomedicine: Polyhedral Oligomeric Silsesquioxane (POSS). Macromol. Rapid Commun. 2011, 32, 1032–1046. [Google Scholar] [CrossRef]
  60. Wu, J.; Mather, P.T. POSS Polymers: Physical Properties and Biomaterials Applications. Polym. Rev. 2009, 49, 25–63. [Google Scholar] [CrossRef]
  61. Nag, S.; Sachan, A.; Castro, M.; Choudhary, V.; Feller, J.F. Spray Layer-by-Layer Assembly of POSS Functionalized CNT Quantum Chemo-Resistive Sensors with Tuneable Selectivity and Ppm Resolution to VOC Biomarkers. Sens. Actuators B Chem. 2016, 222, 362–373. [Google Scholar] [CrossRef]
  62. Shooshtari, M.; Salehi, A.; Vollebregt, S. Effect of Humidity on Gas Sensing Performance of Carbon Nanotube Gas Sensors Operated at Room Temperature. IEEE Sens. J. 2021, 21, 5763–5770. [Google Scholar] [CrossRef]
  63. Sachan, A.; Castro, M.; Choudhary, V.; Feller, J.F. Influence of Water Molecules on the Detection of Volatile Organic Compounds (VOC) Cancer Biomarkers by Nanocomposite Quantum Resistive Vapour Sensors VQRS. Chemosensors 2018, 6, 64. [Google Scholar] [CrossRef]
  64. Sachan, A.; Castro, M.; Choudhary, V.; Feller, J.F. VQRS Based on Hybrids of CNT with PMMA-POSS and PS-POSS Copolymers to Reach the Sub-Ppm Detection of Ammonia and Formaldehyde at Room Temperature despite Moisture. Chemosensors 2017, 5, 22. [Google Scholar] [CrossRef]
  65. Kumar, B.; Castro, M.; Feller, J.F. Quantum Resistive Vapour Sensors Made of Polymer Coated Carbon Nanotubes Random Networks for Biomarkers Detection. Chem. Sens. 2013, 3, 1–7. [Google Scholar]
  66. Wu, J.; Haddad, T.S.; Mather, P.T. Vertex Group Effects in Entangled Polystyrene-Polyhedral Oligosilsesquioxane (POSS) Copolymers. Macromolecules 2009, 42, 1142–1152. [Google Scholar] [CrossRef]
  67. Wu, J.; Haddad, T.S.; Kim, G.M.; Mather, P.T. Rheological Behavior of Entangled Polystyren-Polyhedral Oligosilsesquioxane (POSS) Copolymers. Macromolecules 2007, 40, 544–554. [Google Scholar] [CrossRef]
  68. Ma, X.M.; Wang, B.; Zhang, M.X.; Min, F.F.; He, J. Synthesis and Thermal Characterizations of PMMA Nanocomposite Functionalized by Polyhedral Oligomeric Silsesquioxane. Phosphorus Sulfur Silicon Relat. Elem. 2013, 188, 1819–1826. [Google Scholar] [CrossRef]
  69. Kotal, A.; Si, S.; Paira, T.K.; Mandal, T.K. Synthesis of Semitelechelic POSS-Polymethacrylate Hybrids by Thiol-Mediated Controlled Radical Polymerization with Unusual Thermal Behaviors. J. Polym. Sci. A Polym. Chem. 2008, 46, 1111–1123. [Google Scholar] [CrossRef]
  70. Gordon, M.; Taylor, J.S. Ideal Copolymers and the Second-Order Transitions of Synthetic Rubbers. i. Non-Crystalline Copolymers. J. Appl. Chem. 2007, 2, 493–500. [Google Scholar] [CrossRef]
  71. Kumar, B.; Castro, M.; Feller, J.F. Controlled Conductive Junction Gap for Chitosan-Carbon Nanotube Quantum Resistive Vapour Sensors. J. Mater. Chem. 2012, 22, 10656–10664. [Google Scholar] [CrossRef]
  72. Feller, J.F.; Lu, J.; Zhang, K.; Kumar, B.; Castro, M.; Gatt, N.; Choi, H.J. Novel Architecture of Carbon Nanotube Decorated Poly(Methyl Methacrylate) Microbead Vapour Sensors Assembled by Spray Layer by Layer. J. Mater. Chem. 2011, 21, 4142–4149. [Google Scholar] [CrossRef]
  73. Nag, S.; Castro, M.; Choudhary, V.; Feller, J.F. Boosting selectivity and sensitivity to biomarkers of Quantum Resistive vapour Sensors used for volatolomics with nanoarchitectured carbon nanotubes or graphene platelets connected by fullerene junctions. J. Mater. Chem. 2021, 9, 66. [Google Scholar] [CrossRef]
  74. Chatterjee, S.; Castro, M.; Feller, J.F. Tailoring Selectivity of Sprayed Carbon Nanotube Sensors (CNT) towards Volatile Organic Compounds (VOC) with surfactants. Sens. Actuators B Chem. 2015, 220, 840–849. [Google Scholar] [CrossRef]
  75. Feller, J.F.; Grohens, Y. Evolution of Electrical Properties of Some Conductive Polymer Composite Textiles with Organic Solvent Vapours Diffusion. Sens. Actuators B Chem. 2004, 97, 231–242. [Google Scholar] [CrossRef]
  76. Kumar, B.; Feller, J.F.; Castro, M.; Lu, J. Conductive Bio-Polymer Nano-Composites (CPC): Chitosan-Carbon Nanotube Transducers Assembled via Spray Layer-by-Layer for Volatile Organic Compound Sensing. Talanta 2010, 81, 908–915. [Google Scholar] [CrossRef]
  77. Rakotomalala, R. TANAGRA: Free Software for Teaching & Research. In Proceedings of the EGC’2005, Amsterdam, The Netherlands, 14–16 February 2005; Volume 2, pp. 697–702. [Google Scholar]
Figure 1. VOC identification chain with an e-nose [20].
Chemosensors 13 00226 g001
Figure 2. (a) SEM image of PS-CNT sensor surface, (b) SEM image of PS-co-POSS/CNT sensor surface, and (c) SEM image of the cross section of the 4 sprayed layers of PS-CNT.
Chemosensors 13 00226 g002
Figure 3. (a) AFM images of PMMA-co-POSS copolymer film surface and (b) AFM image of CNT dispersed in PMMA-co-POSS copolymer matrix.
Chemosensors 13 00226 g003
Figure 4. Effect of POSS on the chemo-resistive responses of two types of vQRS exposed to six VOC: (a) PS-CNT and PS-co-POSS/CNT, (b) PMMA-CNT and PMMA-co-POSS/CNT.
Chemosensors 13 00226 g004
Figure 5. Copolymer structures in detail: (a) PS-co-POSS and (b) PMMA-co-POSS.
Chemosensors 13 00226 g005
Figure 6. Mechanism of amplification of the chemo-resistive response by the addition of free volume with the location of POSS molecules at the CNT/CNT nano-junctions.
Chemosensors 13 00226 g006
Figure 7. (a) Transient response curve for PS-CNT and PS-co-POSS/CNT for a 15 min cycle in acetone vapour, (b) comparison of the linear part of the transient region to evidence the effect of POSS on solvent diffusion, and (c) magnification of the time lag in sensing response after acetone injection.
Chemosensors 13 00226 g007
Figure 8. (a) Transient response curve for PMMA-CNT and PMMA-co-POSS/CNT for an exposure of 15 min to cyclohexane, (b) effect of POSS on the linear part of the transient response, and (c) comparison of the time lag of the chemo-resistive response after switching on the cyclohexane.
Chemosensors 13 00226 g008
Figure 9. Relative amplitude (AR) of PS-co-POSS/CNT and PMMA-co-POSS/CNT sensors for twenty-one different solvent vapours, including lung and skin cancer biomarkers.
Chemosensors 13 00226 g009
Figure 10. (a) Low ppm vapour-sensing transient curves for 5 VOC for PMMA-co-POSS/CNT, (b) comparison of A R   ( M A X ) of all VOC at 100 ppm for PMMA-co-POSS/CNT, (c) low ppm vapour-sensing transient curves for 5 VOC for PS-co-POSS/CNT, and (d) comparison of A R   ( M A X ) of all VOC at 100 ppm for PS-co-POSS/CNT.
Chemosensors 13 00226 g010
Figure 11. Correlation between χ12 and normalized chemo-resistive response of (a) PS-co-POSS/CNT and (b) PMMA-co-POSS/CNT sensors.
Chemosensors 13 00226 g011
Figure 12. PCA map for all the VOC using the chemo-resistive responses of both sensors.
Chemosensors 13 00226 g012
Table 1. Flory–Huggins interaction parameter (χ12) for all VOC and polymer couples.
VOCVm (cm3·mol−1)δt Sol (J1/2·cm−3/2)χ12 (PS)χ12 (PMMA)
Methanol40.729.60.78391.9867
Ethanol58.526.60.36071.5103
Propanol74.8423.80.03710.8163
Isopropanol76.423.570.02380.7613
Benzene89.718.50.63520.0003
Toluene106.318.160.88000.0083
Xylene122.818.20.99870.0079
Water18.147.94.64066.2685
Acetone7419.70.26680.0361
Formaldehyde36.824.60.05410.5344
Benzyl alcohol103.623.80.05141.1301
Pentane115.214.43.19380.8197
Cyclohexane108.716.81.52130.1420
Butanone89.5719.30.41520.0177
Ethyl hexanol156.620.10.42370.1421
Cyclohexanone10419.60.40050.0419
Ethyl benzene123.117.91.13940.0243
Benzaldehyde101.521.40.06810.3210
Carbon tetrachloride97.118.10.82520.0097
Hexene96.916.3051.59360.2058
Disclaimer/Publisher’s Note: The statements, opinions and data contained in all publications are solely those of the individual author(s) and contributor(s) and not of MDPI and/or the editor(s). MDPI and/or the editor(s) disclaim responsibility for any injury to people or property resulting from any ideas, methods, instructions or products referred to in the content.