Article

Disposable Electrochemical Serotonin Biosensor Based on the Nanocomposite of Carbon Nanotubes

1
Department of Chemistry, College of Science & Technology, Dankook University, 119 Dandae-ro, Dongnam-gu, Cheonan-si 31116, Chungnam, Republic of Korea
2
Bio-Convergence Materials Research Institute, Graduate School of Management of Technology, Hoseo University, Asan 31499, Chungnam, Republic of Korea
3
Fine Dust & Net Zero Research Institute, Hoseo University, Asan 31499, Chungnam, Republic of Korea
4
Department of Cosmedical Materials, College of Bio-Convergence, Dankook University, 119 Dandae-ro, Dongnam-gu, Cheonan-si 31116, Chungnam, Republic of Korea
*
Author to whom correspondence should be addressed.
These authors contributed equally to this work.
Chemosensors 2025, 13(5), 185; https://doi.org/10.3390/chemosensors13050185
Submission received: 27 March 2025 / Revised: 9 May 2025 / Accepted: 9 May 2025 / Published: 16 May 2025

Abstract

:
A PAAc-PVI(4:1)@MWCNT hybrid was synthesized for the selective electrochemical detection of serotonin. Multi-walled carbon nanotubes (MWCNT) enhanced electrode conductivity, while the hydrophilic polymer Poly(Acrylic Acid-co-Vinyl imidazole) (PAAc-PVI) facilitated serotonin recognition. At pH 7.4, the carboxyl (-COO) groups in PAAc-PVI interacted with the amine (-NH3+) groups of serotonin, enabling oxidation and electron transfer for signal detection. Additionally, π-π interactions between vinylimidazole and MWCNT improved dispersion and stability. The hybrid materials enhanced electron transfer efficiency, increasing sensitivity and reliability. Structural and electrochemical properties were characterized using FT-IR, HR-TEM, TGA, Raman spectroscopy, impedance analysis, and differential pulse voltammetry (DPV). Serotonin detection using the fabricated electrode demonstrated high selectivity (LOD 0.077 μM and LOQ 0.26 μM), reproducibility (%RSD 1X PBS condition (4.63%) and human serum condition (4.81%)), and quantitative capability (dynamic range 1.2 μM to 10.07 μM) without interference (potential shift from +0.40 V to −0.15 V) from blood-based substances, confirming its potential for electrochemical biosensing applications.

1. Introduction

Atopic dermatitis (AD) is a chronic, incurable inflammatory skin disease that causes itching, skin redness, lichenification, and skin infection [1]. Itching is an unpleasant symptom that suddenly makes you want to scratch your skin. This phenomenon causes skin inflammation, which is highly recurrent and chronic [2]. Additionally, it causes mental stress, poor concentration, and depression, which are bigger problems than the pain of the disease itself [3]. Atopic dermatitis is an immune hypersensitivity reaction caused by abnormalities in the immune system and has been reported to cause an allergic inflammatory reaction due to excessively produced IgE antibodies due to an imbalance between T helper 1 cells (Th1s) and T helper 2 cells (Th2s) [4]. An increase in IgE stimulates the high-affinity IgE receptor (Fc ε RI) and activates mast cells. When mast cells are degranulated by antigen, histamine, serotonin, prostaglandins, and leukotrienes are secreted, and the expression of serotonin in particular increases [4].
Unfortunately, current treatment methods to alleviate atopic dermatitis rely on improving the environment, using moisturizers that protect the skin, and drug treatments such as topical steroids, antibiotics, and antihistamines. However, long-term use of the drug for therapeutic purposes is difficult due to side effects or resistance to drug prescriptions. Therefore, it is important to prevent and monitor atopic dermatitis on a daily basis [5]. Although chronic pruritus in atopic dermatitis is quantitatively correlated with the concentration of 5-HT, the exact mechanism remains unclear, and the causal relationship between atopy and serotonin has not been fully elucidated. However, recent studies have demonstrated that HTR7 expression is influenced by serotonin levels, and the mechanism of pruritus involves the activation of adenylate cyclase via G proteins (Gαs and Gβγ), leading to the opening of the TRPA1 ion channel [6]. Early monitoring of serotonin levels is very important for reducing atopic disease treatment costs and improving quality of life because it can detect atopic disease before it occurs. Furthermore, serotonin is a neurotransmitter involved in various diseases, including Parkinson’s disease (PD), serotonin syndrome, and attention-deficit hyperactivity disorder (ADHD). Its physiological importance extends beyond the prevention of atopy, playing a key role in the management of multiple neurological and systemic conditions [7]. Among the serotonin monitoring methods, electrochemical biosensors have been studied extensively as they have the advantages of being miniaturized, accurate, selective, and easy to use [8,9,10,11]. The electrochemical detection of serotonin is known to generate an oxidation current at 0.35 V using a working electrode(carbon), a counter electrode(platinum), and a reference electrode(silver/silver chloride (Ag/AgCl)) [12]. However, while the concentration of serotonin in healthy individuals ranges from 0.284 to 1.135 μM, the calibration range that can be quantified using the carbon electrode is between 40 and 750 μM [13,14]. Additionally, electrochemical interferents such as dopamine, ascorbic acid, and uric acid are detected at similar potentials, with ascorbic acid and uric acid typically present at higher concentrations compared to serotonin, leading to significant issues with precision. (Physiological ascorbic acid concentration: 40–80 μM; physiological uric acid concentration: females 89–357 μM/males 149–416 μM) [15,16]. To address these issues, various approaches have been attempted, with a commonly used method involving the modification of the working electrode surface [17]. The working electrode is modified using materials such as multi-walled carbon nanotubes (MWCNT) and metal nanoparticles. Reports indicate that employing these methods improves both the selectivity and detection limits for serotonin [14,18]. We have modified the electrode by combining multi-walled carbon nanotubes (MWCNT) with a conductive polymer, poly(acrylic acid-co-vinyl imidazole) (PAAc-PVI), rather than using a single modification approach. MWCNTs have been widely used in electrodes of biosensors due to their excellent electrical conductivity, high surface area, and excellent corrosion resistance [19]. However, it has the disadvantage that it is not biocompatible due to its hydrophobic nature and cannot be used with enzymes. Many researchers have studied chemical/physical surface modification to make hydrophilic carbon nanotube complexes [20,21,22,23]. Generally, various methods are employed to improve the dispersibility and solubility of MWCNTs, including modification through polymers, nucleophilic addition reactions, oxidation reactions, and radical and electrophilic addition reactions [24]. Among these methods, the modification of MWCNTs using polymers, which we selected, involves forming a complex between aromatic polymers and MWCNTs through π-π stacking, based on techniques used in existing polyaniline-MWCNT composites. By utilizing poly(acrylic acid-co-vinylimidazole) (PAAc-PVI), we activated the -COOH functional groups on the MWCNT surface, endowing it with anionic characteristics in aqueous solutions and significantly enhancing its solubility. This hydrophilic MWCNT, facilitated by intermolecular interactions, can maintain its electrical properties [25,26]. Subsequently, PAAc-PVI@MWCNT was dispensed onto screen-printed carbon electrodes (SPCEs) and adsorbed onto the electrode surface through π-π stacking. This design is based on a principle opposite to that of our previously studied poly(acrylamide-co-vinyl imidazole) (PAA-PVI). In our earlier work, the copolymer synthesized with acrylamide was intended to repel dopamine electrostatically under physiological pH conditions, as both dopamine and the copolymer carried positive charges. This repulsion was expected to prevent dopamine from approaching the electrode surface and thus provide protection against electrochemical interferents. However, while a reduction in dopamine signal was observed, the signal for serotonin was also significantly decreased, ultimately failing to improve the signal-to-noise ratio. This phenomenon can be attributed to the small pKa difference between dopamine and serotonin, which are 9.44 and 9.97, respectively. As a result, both molecules carry positive charges at physiological pH and were unable to penetrate the PAA-PVI film [27,28].
To overcome this limitation, we synthesized a copolymer using acrylic acid instead of acrylamide. The newly developed PAAc-PVI copolymer possesses a negative charge under physiological pH conditions, thereby enabling electrostatic attraction with positively charged analytes such as dopamine and serotonin. In this configuration, when the analytes are adsorbed onto the electrode surface, the full width at half maximum (FWHM) of the redox signal is improved, allowing for the simultaneous detection and electrochemical separation of serotonin and dopamine signals. Moreover, the PAAc-PVI copolymer effectively blocks common electrochemical interferents in biological samples, such as uric acid and ascorbic acid, through electrostatic repulsion. In addition, the electrochemical fouling phenomenon, which hinders the detection of serotonin due to by-products formed during its oxidation, can be mitigated. This is because the oxidation by-products and the serotonin signal are separated via a selective interaction between serotonin and the conductive polymer on the electrode surface. Recent studies have revealed that this mechanism involves protonation of the conductive polymer by protons generated during the reversible oxidation of serotonin. In this study, the aromatic nitrogen in the imidazole group of PAAc-PVI is also expected to participate in the same protonation mechanism [29,30]. Following this, differential pulse voltammetry (DPV) measurements of serotonin and physiological interferents (uric acid, dopamine, and ascorbic acid) were conducted using 1X PBS as the electrolyte.

2. Materials and Methods

2.1. Chemicals and Reagents

Multi-walled carbon nanotubes (Model MR99; purity > 99 wt%, diameter 5–15 nm, length approximately 20 μm) were obtained from Carbon Nano-material Technology Co. (Pohang, Republic of Korea). Acrylic acid, 1-vinylimidazole, azobisisobutyronitrile, dimethylformamide, dopamine hydrochloride, serotonin, uric acid, ascorbic acid, and human serum normal were purchased from Sigma-Aldrich Co. (Milwaukee, WI, USA). Phosphate-buffered saline (1X PBS, pH 7.4; containing 4.3 mM NaH2PO4, 15.1 mM Na2HPO4, and 140 mM NaCl), along with all other solutions, was prepared using Milli-Q-grade deionized water (Millipore, Tokyo, Japan).

2.2. Preparation of PAAc-PVI@MWCNTs

2.2.1. PAAc-PVI(4:1) Polymer Synthesis

The hydrophilic PAAc-PVI(4:1) polymer was synthesized by minor modification of the reported method [31]. Acrylic acid (11.1 mL, 155 mmol) and 1-vinylimidazole (3.5 mL, 39 mmol) were dissolved in DI water (75 mL) in a 100 mL round-bottom flask with vigorous stirring at room temperature. This solution was heated to 70 °C, and a prepared solution of azobisisobutyronitrile (0.32 g, 1.95 mmol) dissolved in 1 mL of dimethylformamide was added dropwise for 24 h under the nitrogen gas purging. It was added for 3 h at a time, reacted for 5 h, and repeated a total three times.

2.2.2. PAAc-PVI@MWCNT Composite Preparation

The PAAc-PVI@MWCNT composite was synthesized by minor modification of the reported method [32]. A total of 0.034 g of PAAc-PVI was fully dissolved in 40 mL of deionized water. Subsequently, 40 mg of MWCNTs were introduced into the solution, followed by ultrasonication at 40 kHz and 50 °C for 1 h. PAAc-PVI@MWCNT composite was successfully prepared and showed high homogeneity. Finally, the PAAc-PVI@MWCNT composite was washed three times via vacuum filtration using deionized (DI) water to remove physically adsorbed PAAc-PVI polymer. A Whatman® nylon filter disc with a pore size of 0.45 μm was used for the filtration. After obtaining the solid polymer-MWCNT, it was stored in a refrigerator at 4 °C and used by dispersing it in DI water when manufacturing electrodes. Ultrasonication facilitated the formation of a highly homogeneous and transparent dispersion. The resulting PAAc-PVI@MWCNT suspension was analyzed for its physicochemical, morphological, and electrochemical characteristics using FT-IR, TGA, Raman spectroscopy, zeta potential measurements, HR-TEM, and elemental analysis (CH).

2.3. Fabrication of PAAc-PVI@MWCNTs/SPCEs

The screen-printed carbon electrodes (SPCEs) were prepared by a screen-printing machine (BS-860AP, Bando, Pusan, Korea) using carbon black ink (423SS, Acheson, Bigfork, MT, USA). The diameter of the electrode was 4.0 mm. And SPCEs was used after being fully dried for 24 h at room temperature. The 20 μL of PAAc-PVI@MWCNTs dispersed solution (5 mg/mL) was loaded onto the SPCEs and dried for 24 h in a 37 °C desiccator. The fabricated electrodes were stored at 4 °C under refrigerated conditions and were utilized for experiments within two months of preparation.

2.4. Equipments for Characterizization

The physicochemical, morphological, and electrochemical characteristics of the PAAc-PVI@MWCNT dispersion were examined using a range of analytical techniques, including FT-IR (Agilent Cary 630, Santa Clara, CA, USA), TGA (Horiba ARAMIS and Rigaku TG 8120, Kyoto, Japan), Raman spectroscopy (Horiba Xplora Plus, Kyoto, Japan), zeta potential analysis (Horiba SZ-100, Kyoto, Japan), high-resolution transmission electron microscopy (HR-TEM; JEOL JEM-2100, Akishima, Japan), and electrochemical analysis using a CHI 660B system (CH Instruments, Austin, TX, USA).
HR-TEM analysis was performed at an accelerating voltage of 200 kV, and FFT was applied to images obtained at 250 K and 300 K. Raman spectra were measured using a 514 nm laser (10% power, ULF mode) with a 600 g/mm grating (500 nm center), 20 s exposure, 3 accumulations, 50× LWD objective, and 200 µm aperture in the visible range. Zeta potential was measured at 24.8 °C with an electrode voltage of 3.8 V, dispersion medium viscosity of 0.899 mPa·s, and conductivity of 0.074 mS/cm. The DPV measurement conditions were a positive scan from −0.2 V to +0.6 V, a scan speed of 4 mV/s, an amplitude of 50 mV, a pulse interval of 50 ms, and a pulse period of 200 ms.

2.5. Biosensing Application

The working electrode consisted of a PAAc-PVI@MWCNT-modified screen-printed carbon electrode (SPCE) with a 4.0 mm diameter. A micro Ag/AgCl electrode (3.0 M KCl; Cypress, Lawrence, KS, USA) and a platinum wire (0.5 mm diameter; Aldrich, St. Louis, MO, USA) served as the reference and counter electrodes, respectively. For comparison, the electrodes (PAAc-PVI/SPCEs and MWCNT/SPCEs) were fabricated by loading 20 μL of 5 mg/mL in DI onto the electrode. All the manufactured electrodes were used within 2 months. Electrochemical impedance spectroscopy (EIS) was performed on the modified electrodes in a solution of 0.5 M KCl (pH 7.4) containing 2.0 mM K3[Fe(CN)6]/K4[Fe(CN)6], with an applied potential of 0.266 V versus Ag/AgCl. The measurements were conducted using a 5 mV amplitude over a frequency range of 1 Hz to 100 kHz. Serotonin detection using the PAAc-PVI@MWCNT-modified electrode was carried out under ambient air by differential pulse voltammetry (DPV). The DPV measurement conditions were a positive scan from −0.2 V to +0.6 V, a scan speed of 4 mV/s, an amplitude of 50 mV, a pulse interval of 50 ms, and a pulse period of 200 ms. DPV experiments were performed to investigate the response to different serotonin concentrations (0, 0.103, 0.2, 0.38, 0.8, 1.2, 2.25, 3.24, 4.18, 5.08, 6.43, 7.7, 8.9, and 10.07 μM).

3. Results

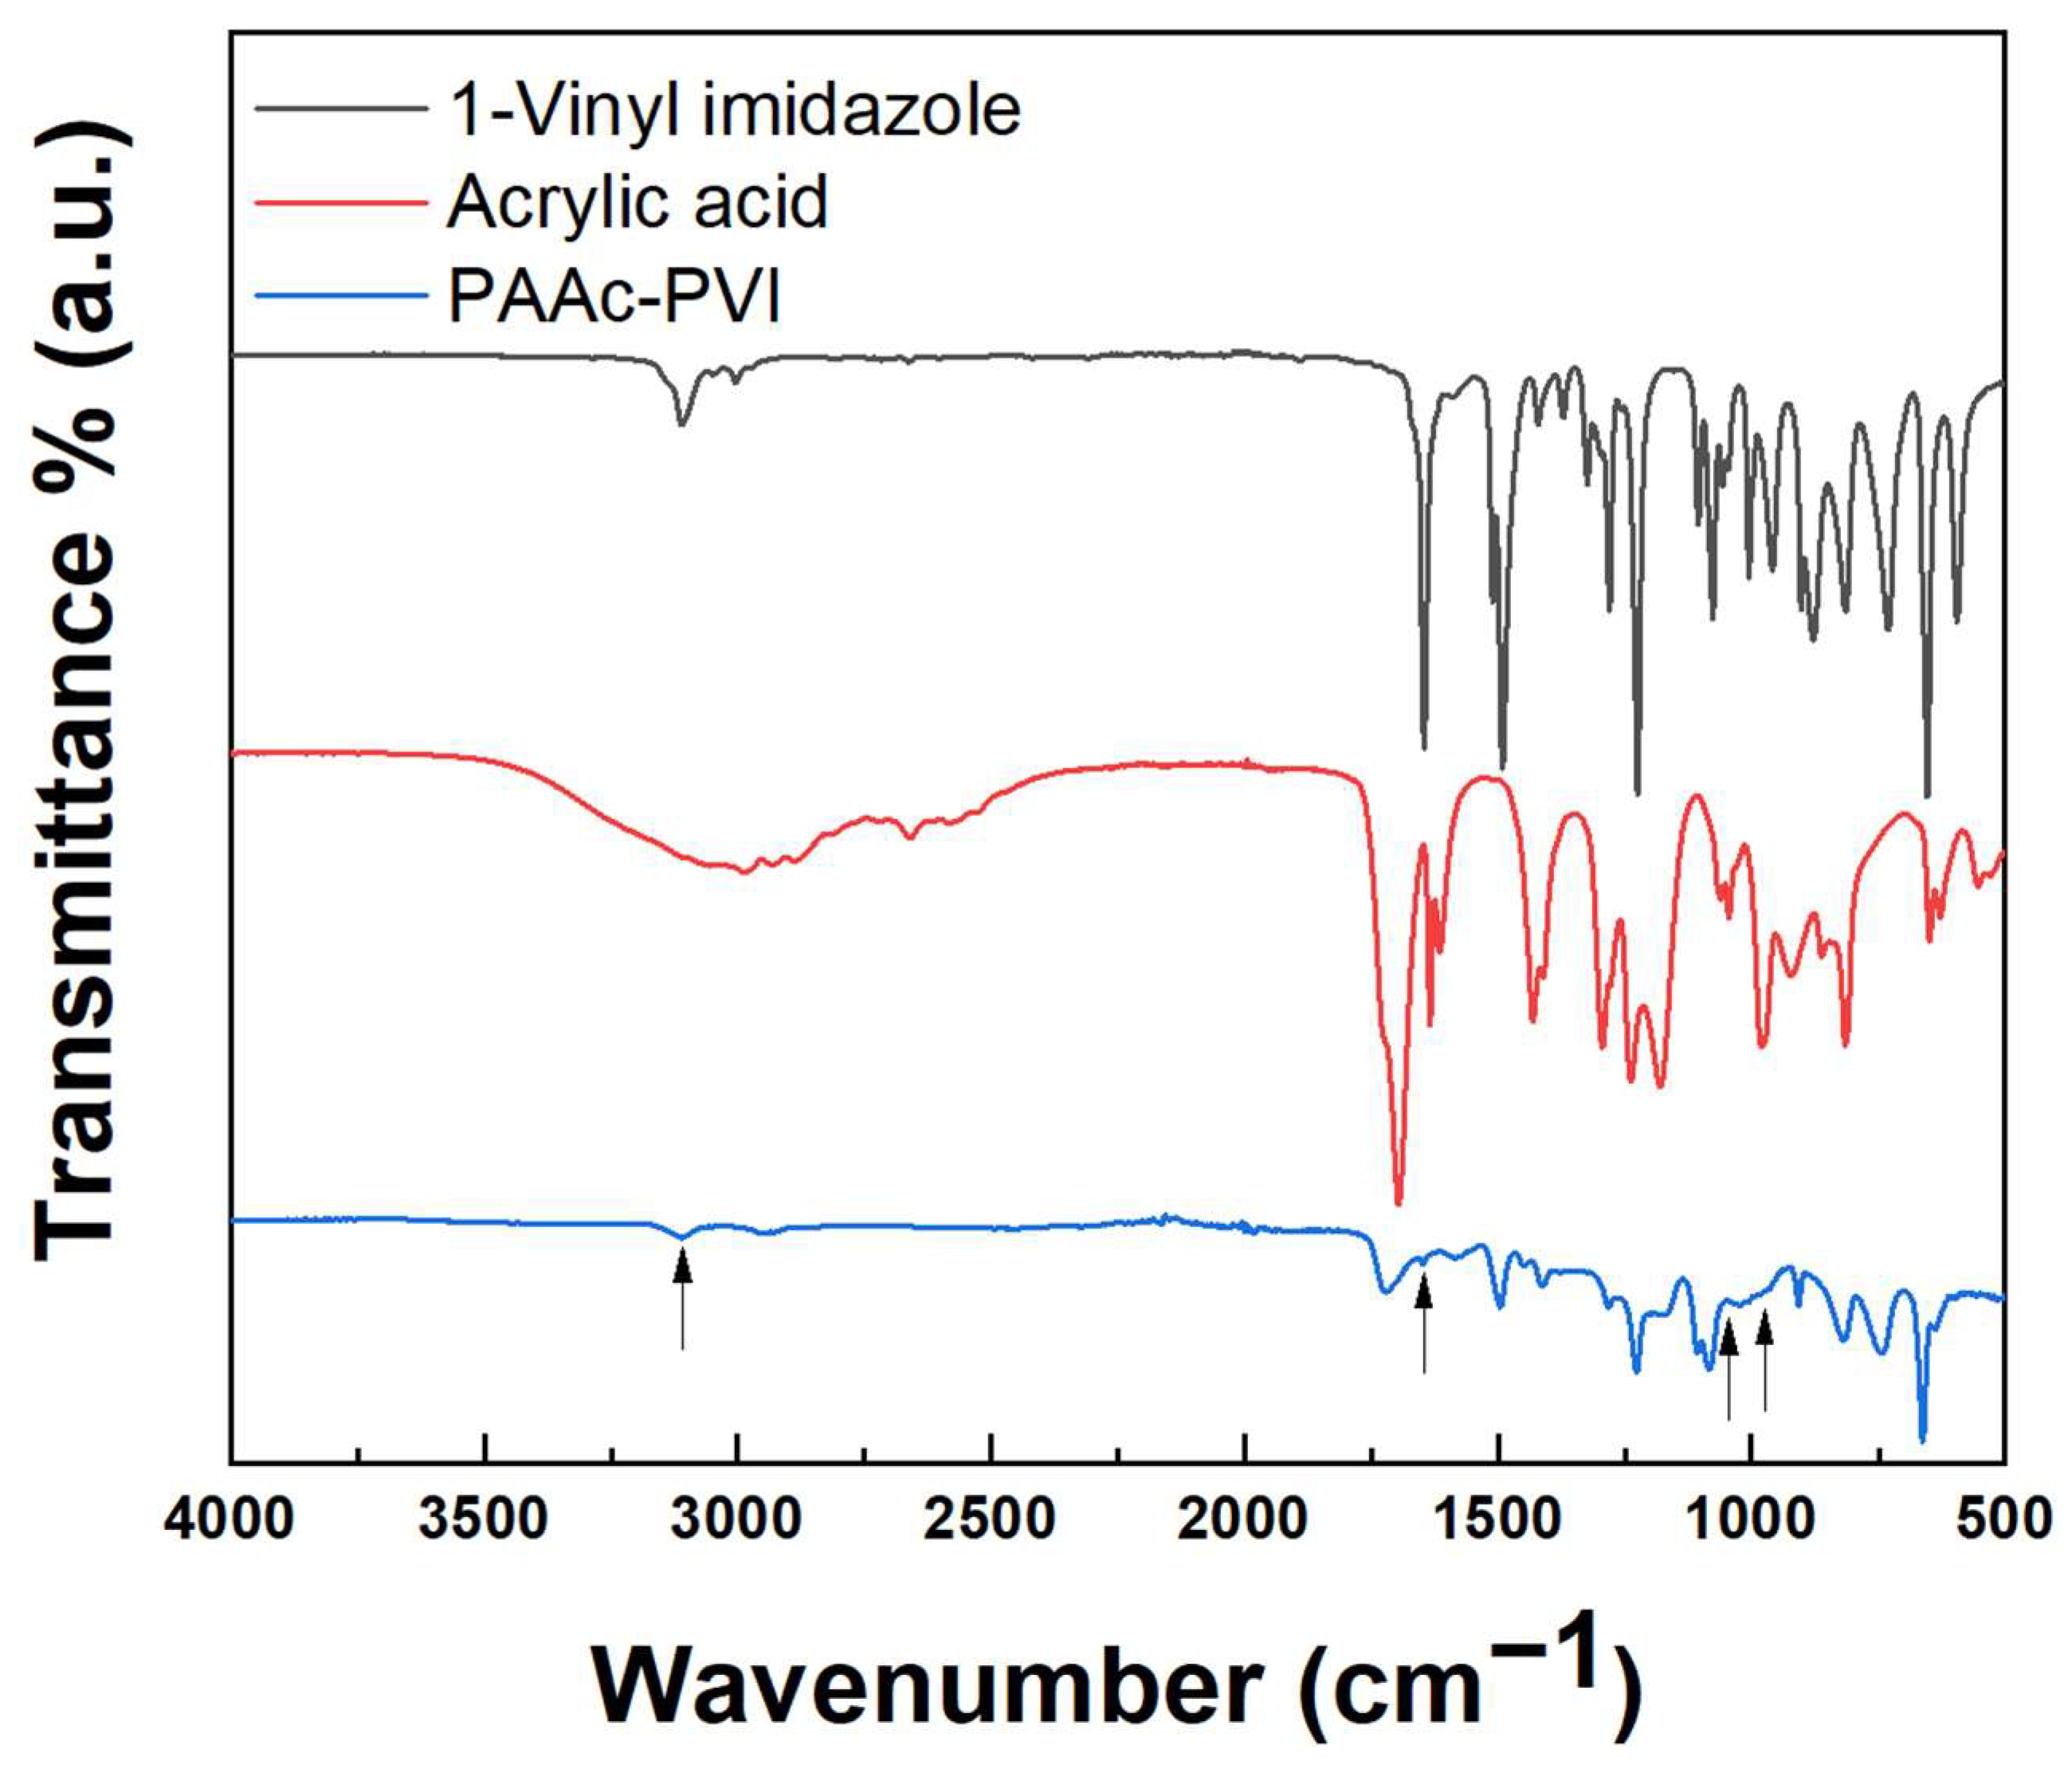
3.1. Chemical Properties of PAAc-PVI

The structure of the copolymerized acrylic acid and 1-vinylimidazole was assessed by FT-IR. Figure 1 shows the FT-IR spectrum measured by ATR (attenuated total reflection) mode ranging from 500 to 4000 cm−1. The FT-IR spectrum of PAAc-PVI (blue) shows the disappearance of specific peaks due to the vinyl and carboxylic acid groups in 1-vinylimidazole (black) and acrylic acid (red), such as the disappearing C=C stretch at 1645 cm−1, weak = CH2 antisymmetric stretch at 3110 cm−1, medium = CH2 rocking band at 1045 cm−1, and strong = CH2 wag at 975 cm−1. These results evidenced successful copolymerization to PAAc-PVI [33].

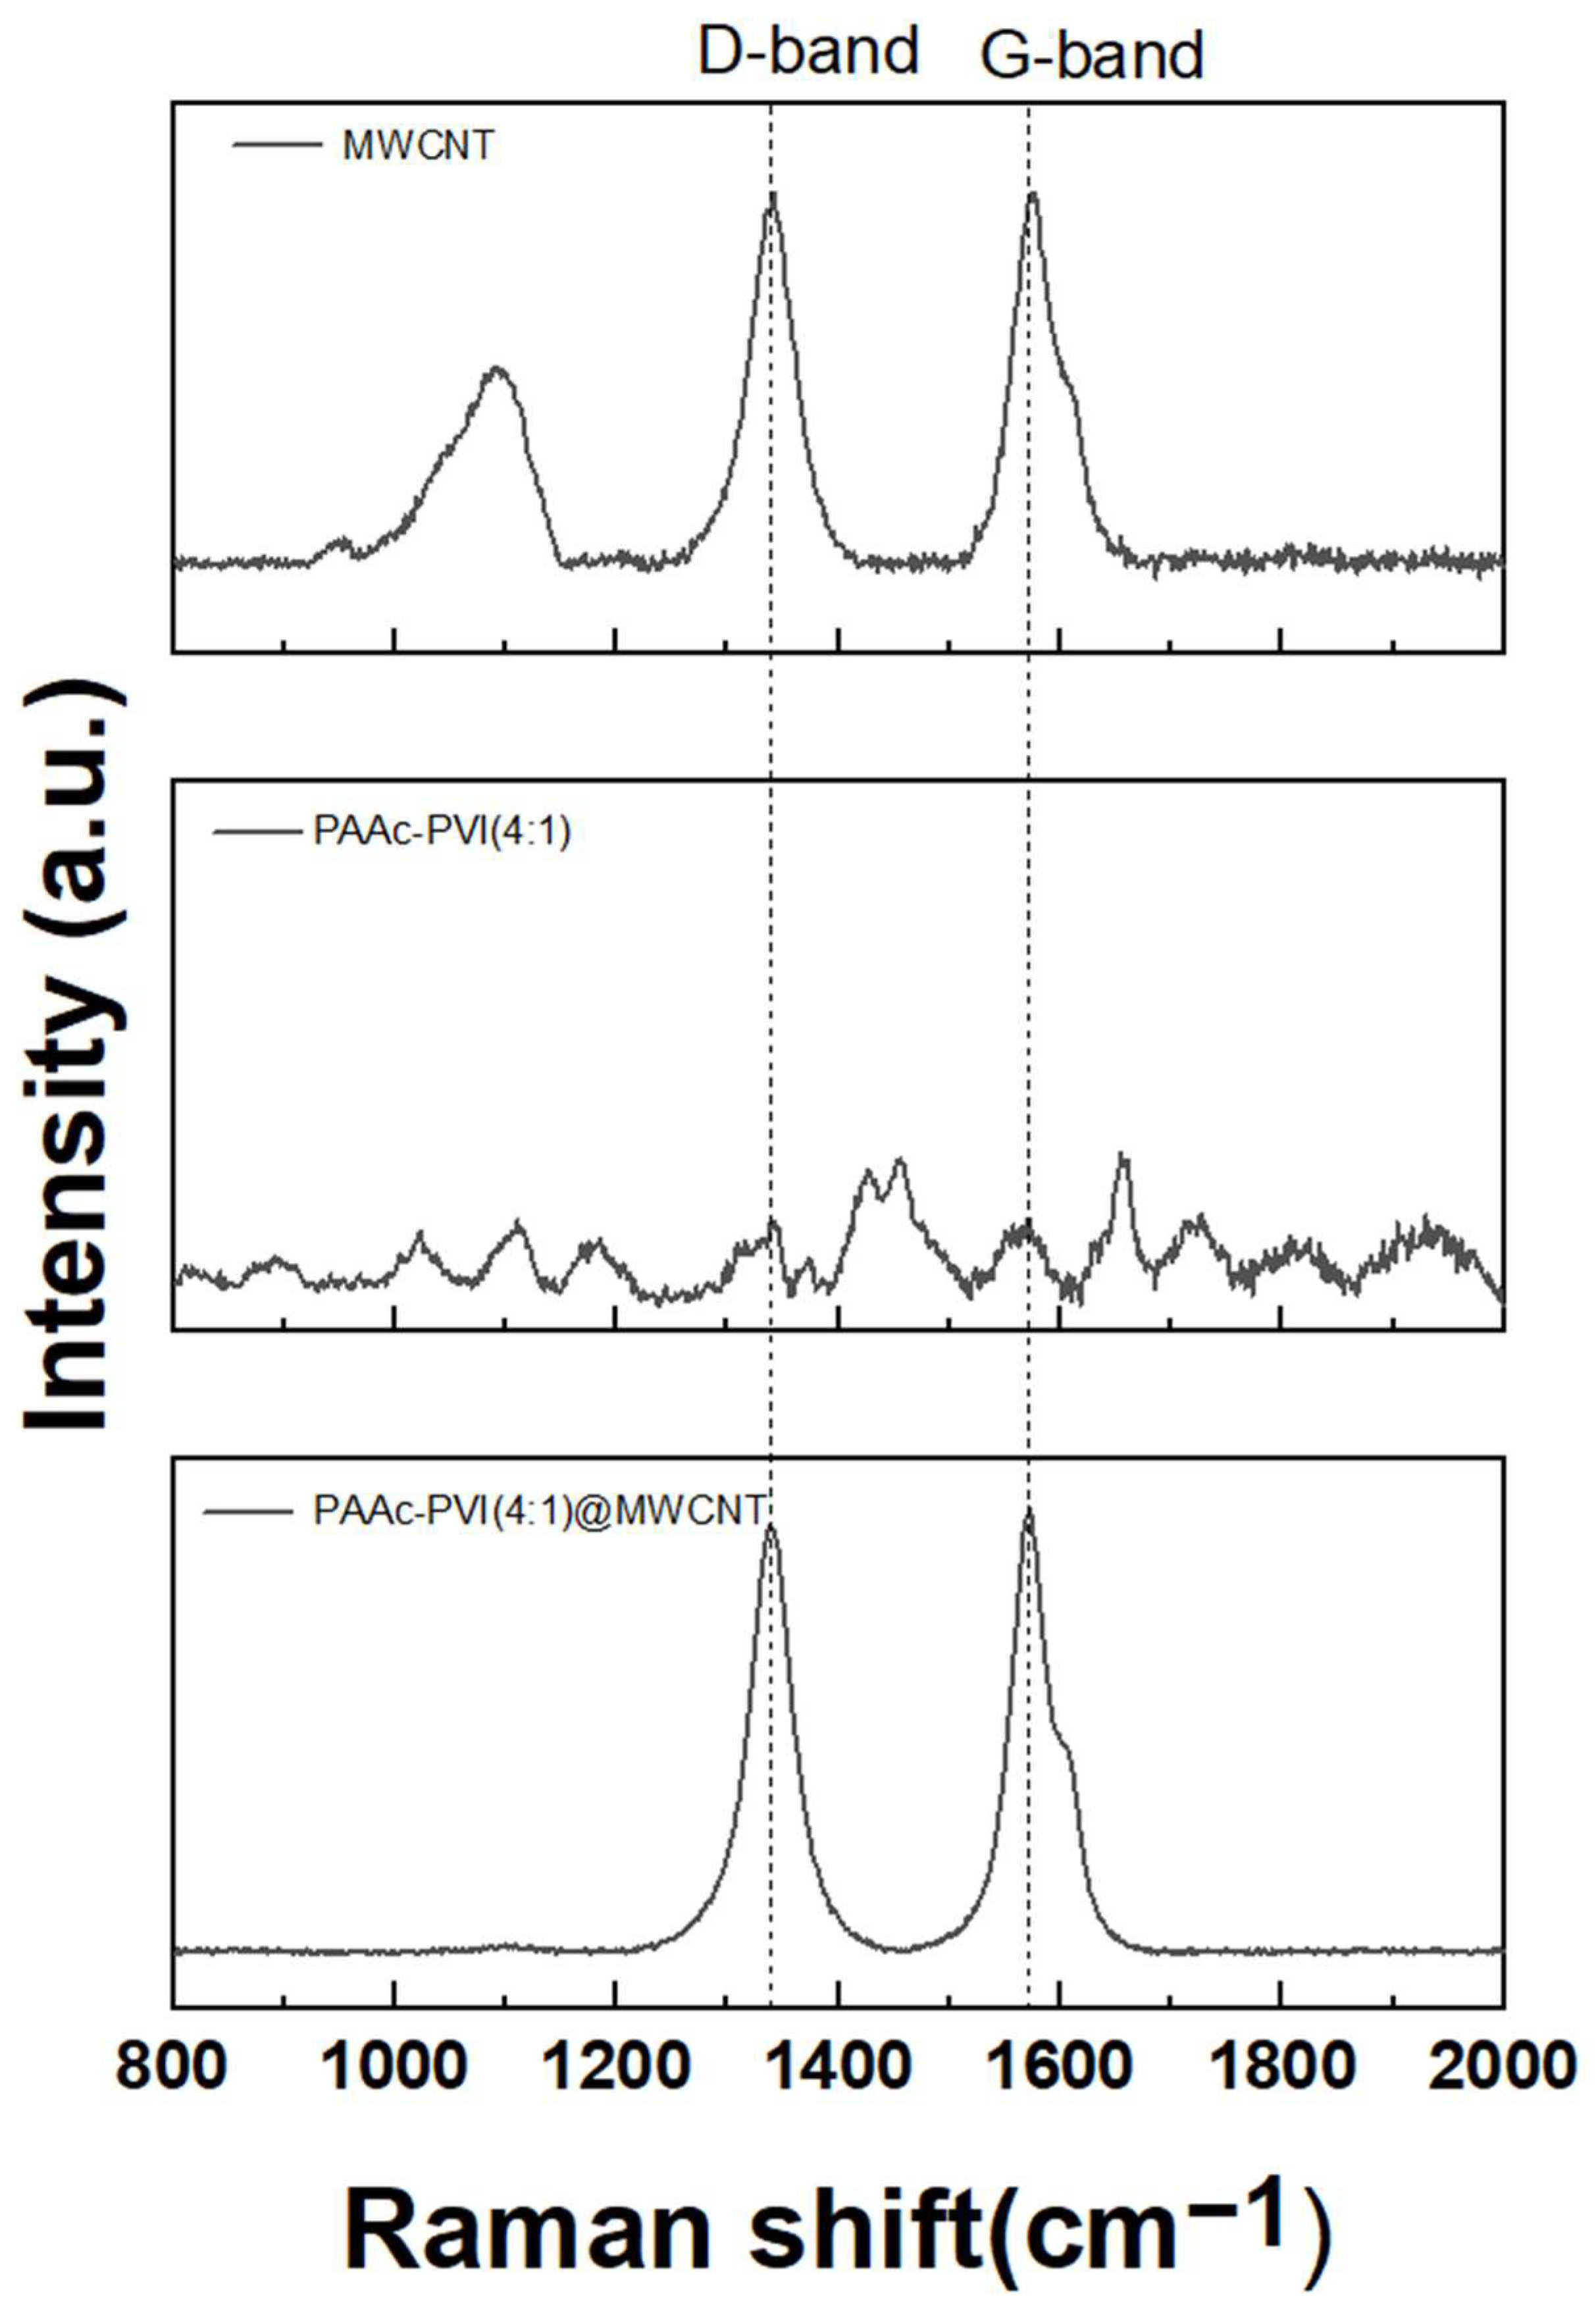
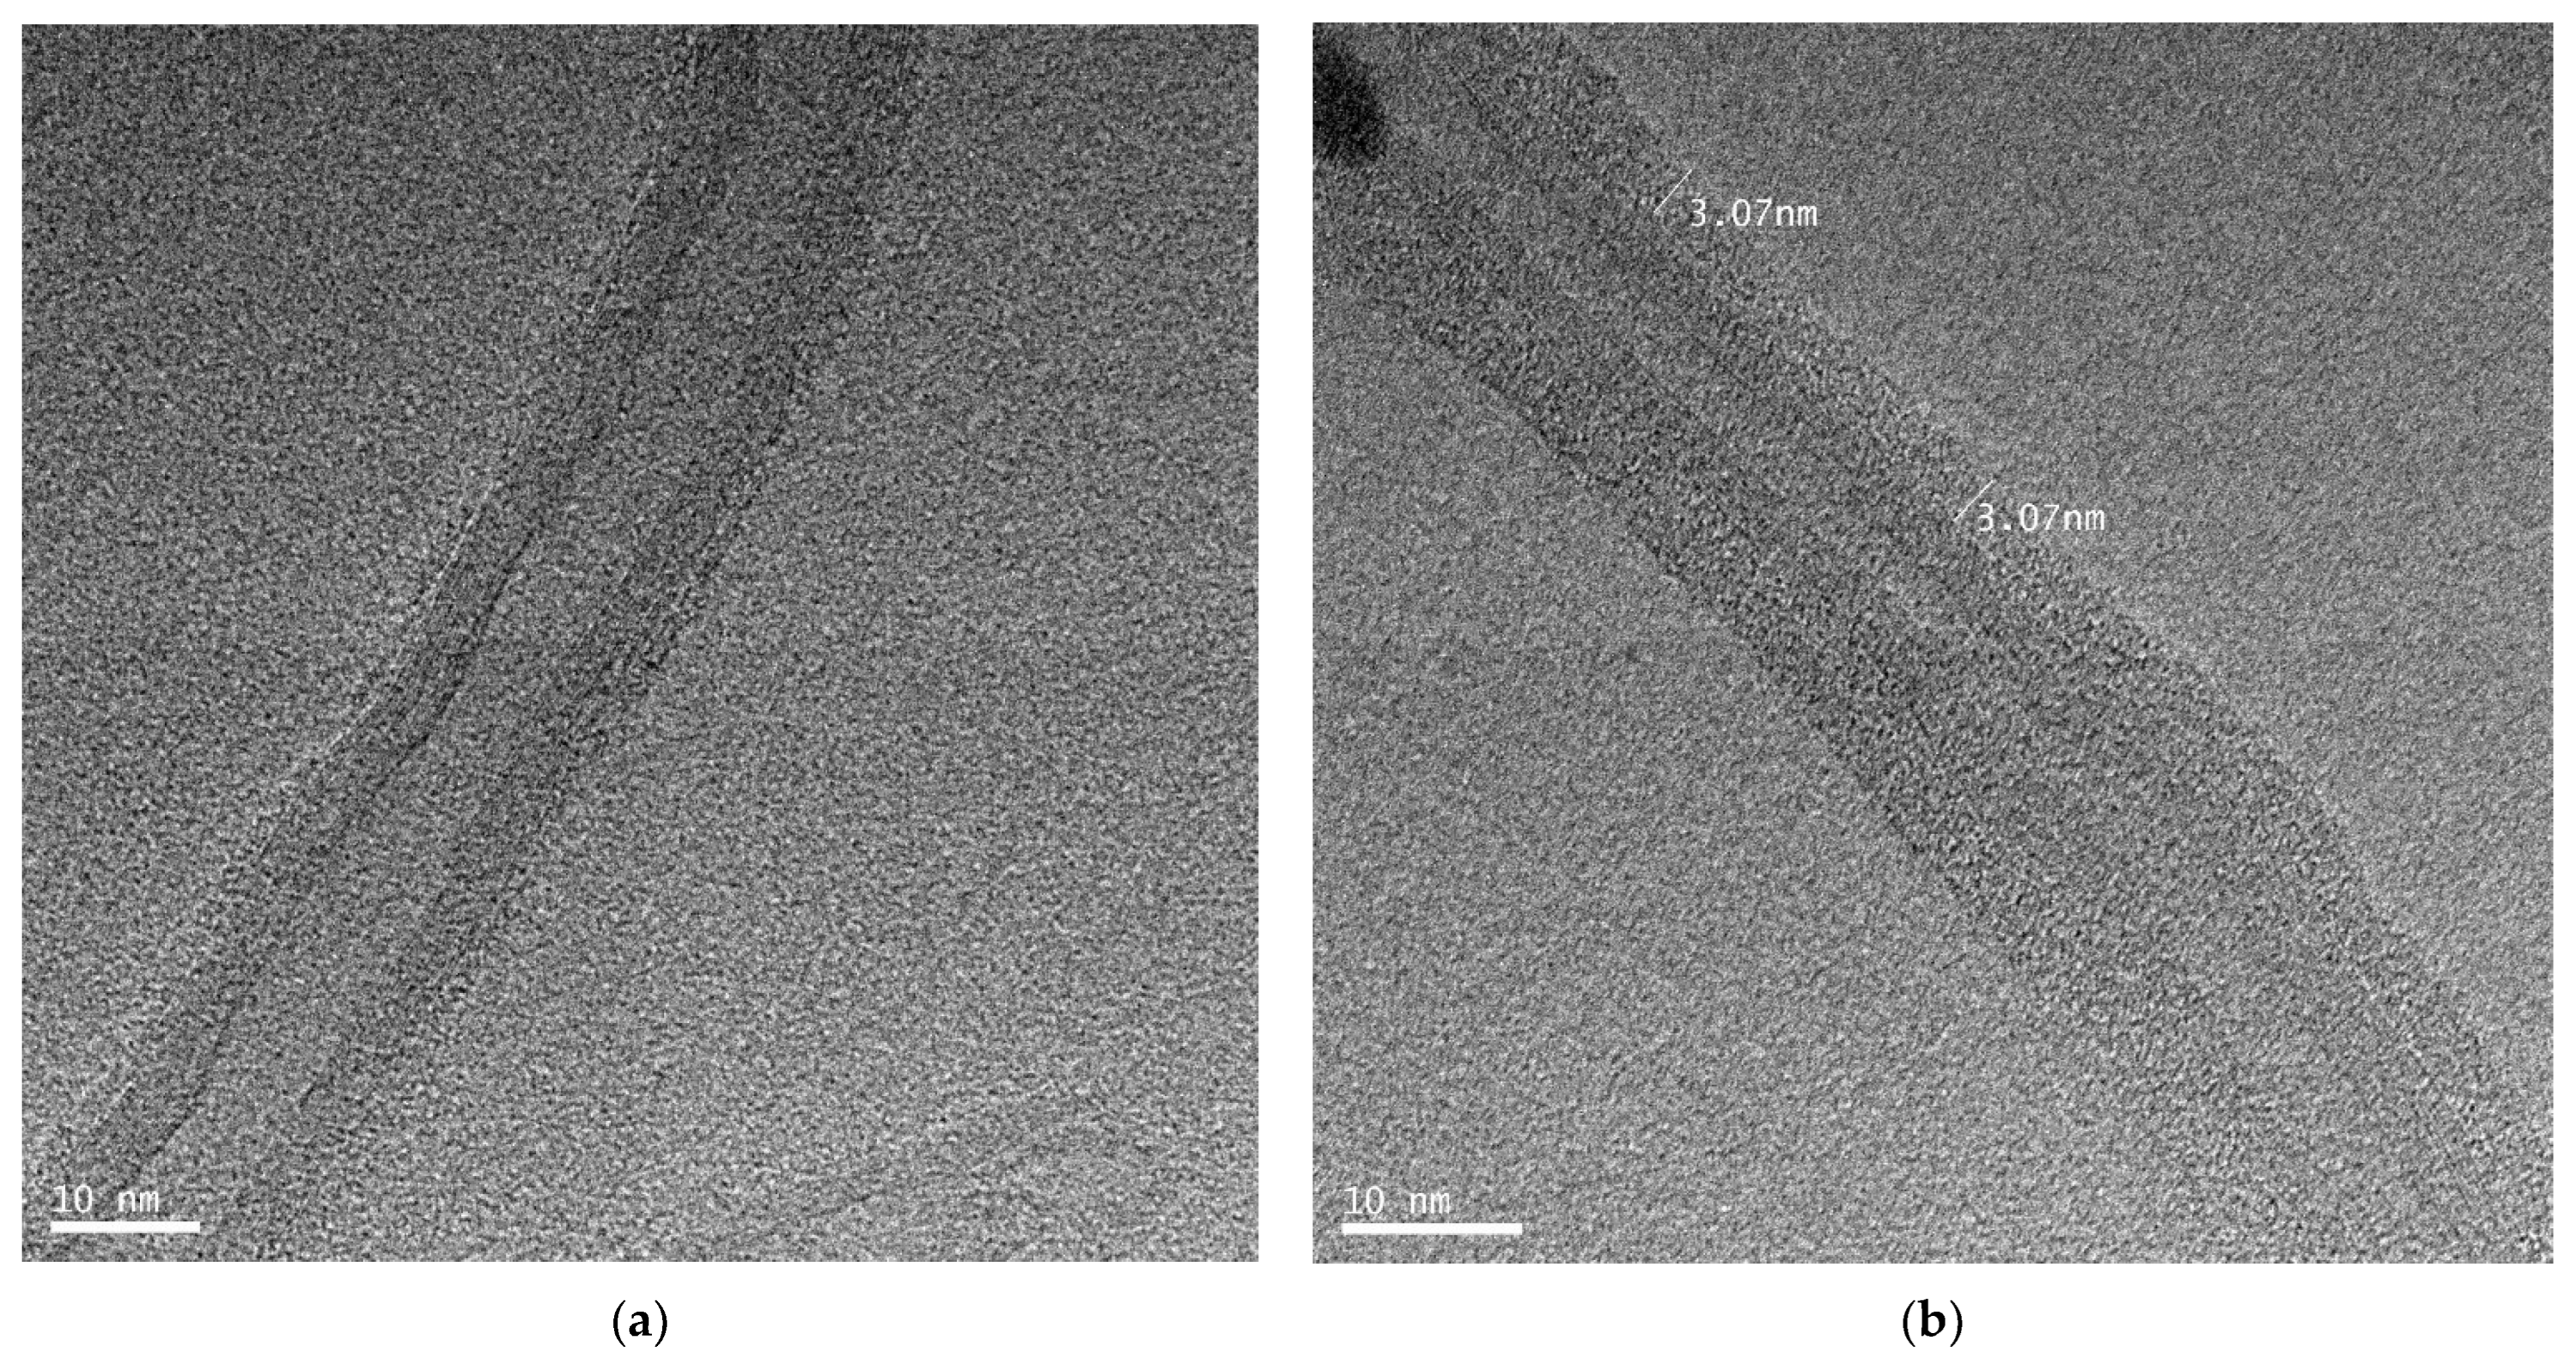
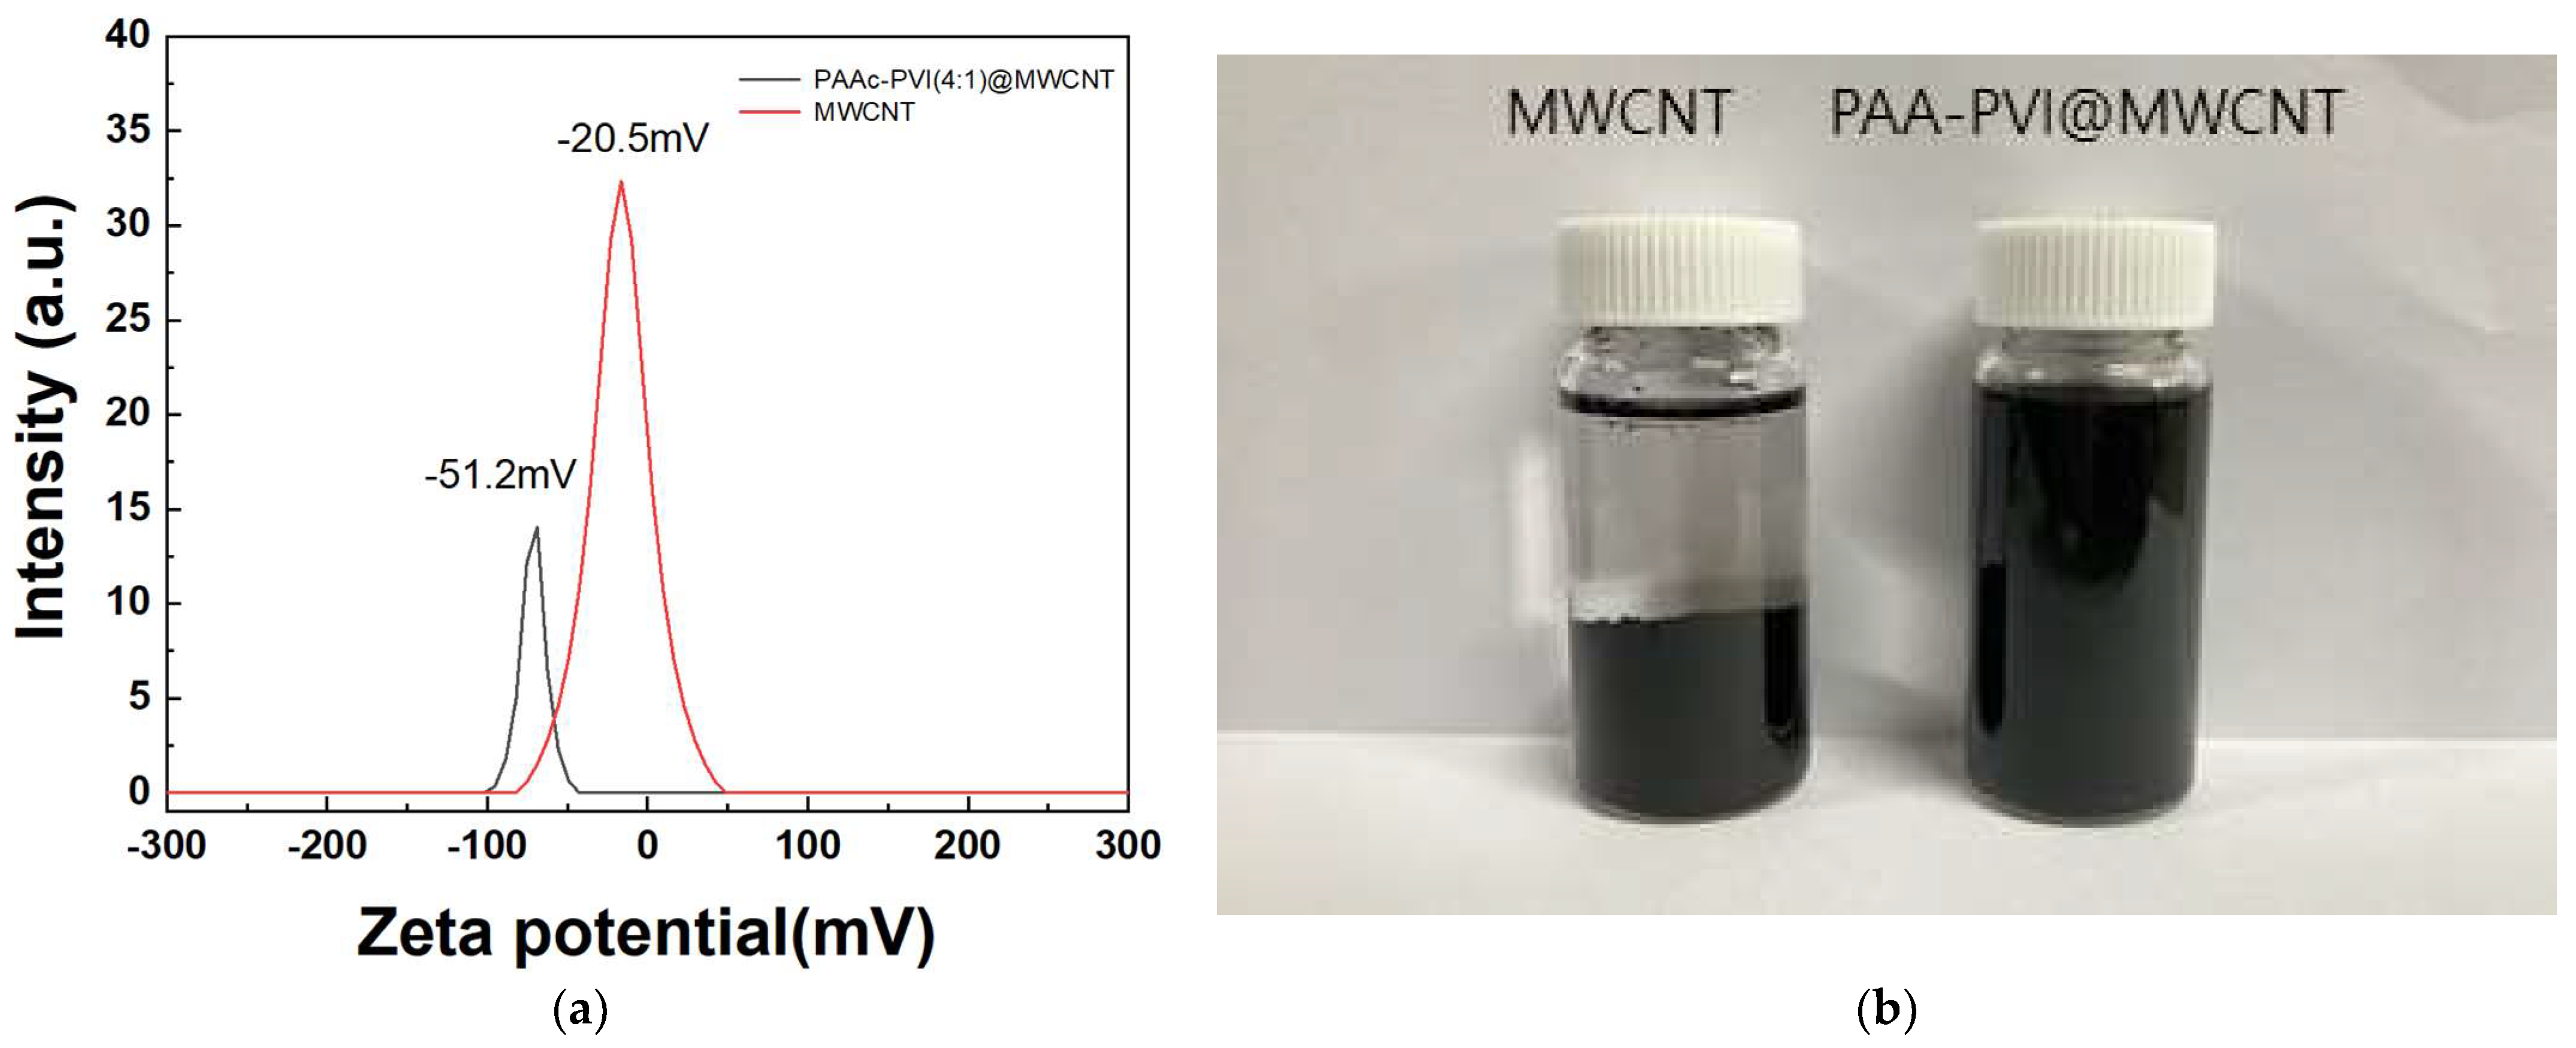
3.2. Physicochemical and Morphological Characterization of PAAc-PVI@MWCNTs

Raman spectroscopy of typical MWCNTs reveals characteristic D and G bands near 1350 cm1 and 1583 cm1, respectively [34,35]. In our study, the D and G bands of the synthesized MWCNTs were observed at 1350.68 cm1 and 1583.13 cm1, as shown in Figure 2. And the synthesized PAAc-PVI polymer (dash) shows no particular peak. The D band represents structural defects in MWCNTs associated with sp3 hybridized orbitals, while the G band corresponds to the scattering effect of the graphitic structure with sp2 hybridized orbitals in MWCNTs. In the case of PAAc-PVI@MWCNT developed in this study, non-covalent modification via π-π stacking preserves the electrical properties of MWCNTs. If PAAc-PVI were to modify MWCNTs through covalent bonding, the defects in MWCNTs would increase, leading to an enhanced ID signal and, consequently, an increased ID/IG ratio [36,37]. The ID/IG values of MWCNT and PAAc-PVI@MWCNT were measured as 0.998 and 0.965, respectively. The gap of their D/G band ratio showed no difference between MWCNT and PAAc-PVI@MWCNT. The detailed results were indicated in Table 1. These results suggest that the PAAc-PVI polymer coated well onto the surface of MWCNTs under the sonication treatment. Also, the ultrasonication method represented an excellent tool without structural deformation of MWCNT.
To confirm the adsorption of PAAc-PVI(4:1) polymer on MWCNT, PAAc-PVI(4:1)@MWCNT dispersed on a carbon 300 mesh Cu grid was dried and then measured by HR-TEM. As shown in Figure 3, high-resolution transmission electron microscopy (HR-TEM) revealed that the MWCNT surface was uniformly coated with a PAAc-PVI polymer layer, exhibiting an average thickness of 3.07 nm.
As presented in Figure 4, the TGA curves of PAAc-PVI@MWCNTs (black line), PAAc-PVI (green dots), and MWCNTs (red dashed line) show distinct thermal degradation patterns. The MWCNTs exhibited significant weight loss between 550 and 800 °C, while the standalone PAAc-PVI polymer decomposed primarily in the 200–450 °C range. In contrast, the polymer incorporated within the PAAc-PVI@MWCNTs composite showed a slower degradation, occurring between 500 and 700 °C. These results suggest that PAAc-PVI was successfully integrated with the MWCNT structure.
Zeta potential analysis provides a quantitative indication of colloidal stability in dispersions. Prior research has demonstrated that poly(ethyleneimine), containing terminal amine groups, exhibits a positive zeta potential, whereas sodium dodecyl sulfate (SDS), bearing terminal carboxylic acid groups, shows a negative value. Moreover, increasing the concentration of SDS, which introduces more negatively charged functional groups, results in a more negative zeta potential [38,39,40]. The average zeta potential of the MWCNT and the prepared PAAc-PVI@MWCNT are −20.5 ± 0.53 and −51.2 ± 1.03 mV in Figure 5a, respectively. And its more negative value may be attributed to the negative acrylic acid functional groups of the PAAc-PVI compared with MWCNT. As shown in Figure 5b, the photograph illustrates the stable dispersion of the PAAc-PVI/MWCNT composite in deionized water following centrifugation at 13,000 rpm for 1 h. The prepared PAAc-PVI@MWCNT showed excellent distribution in DI water.

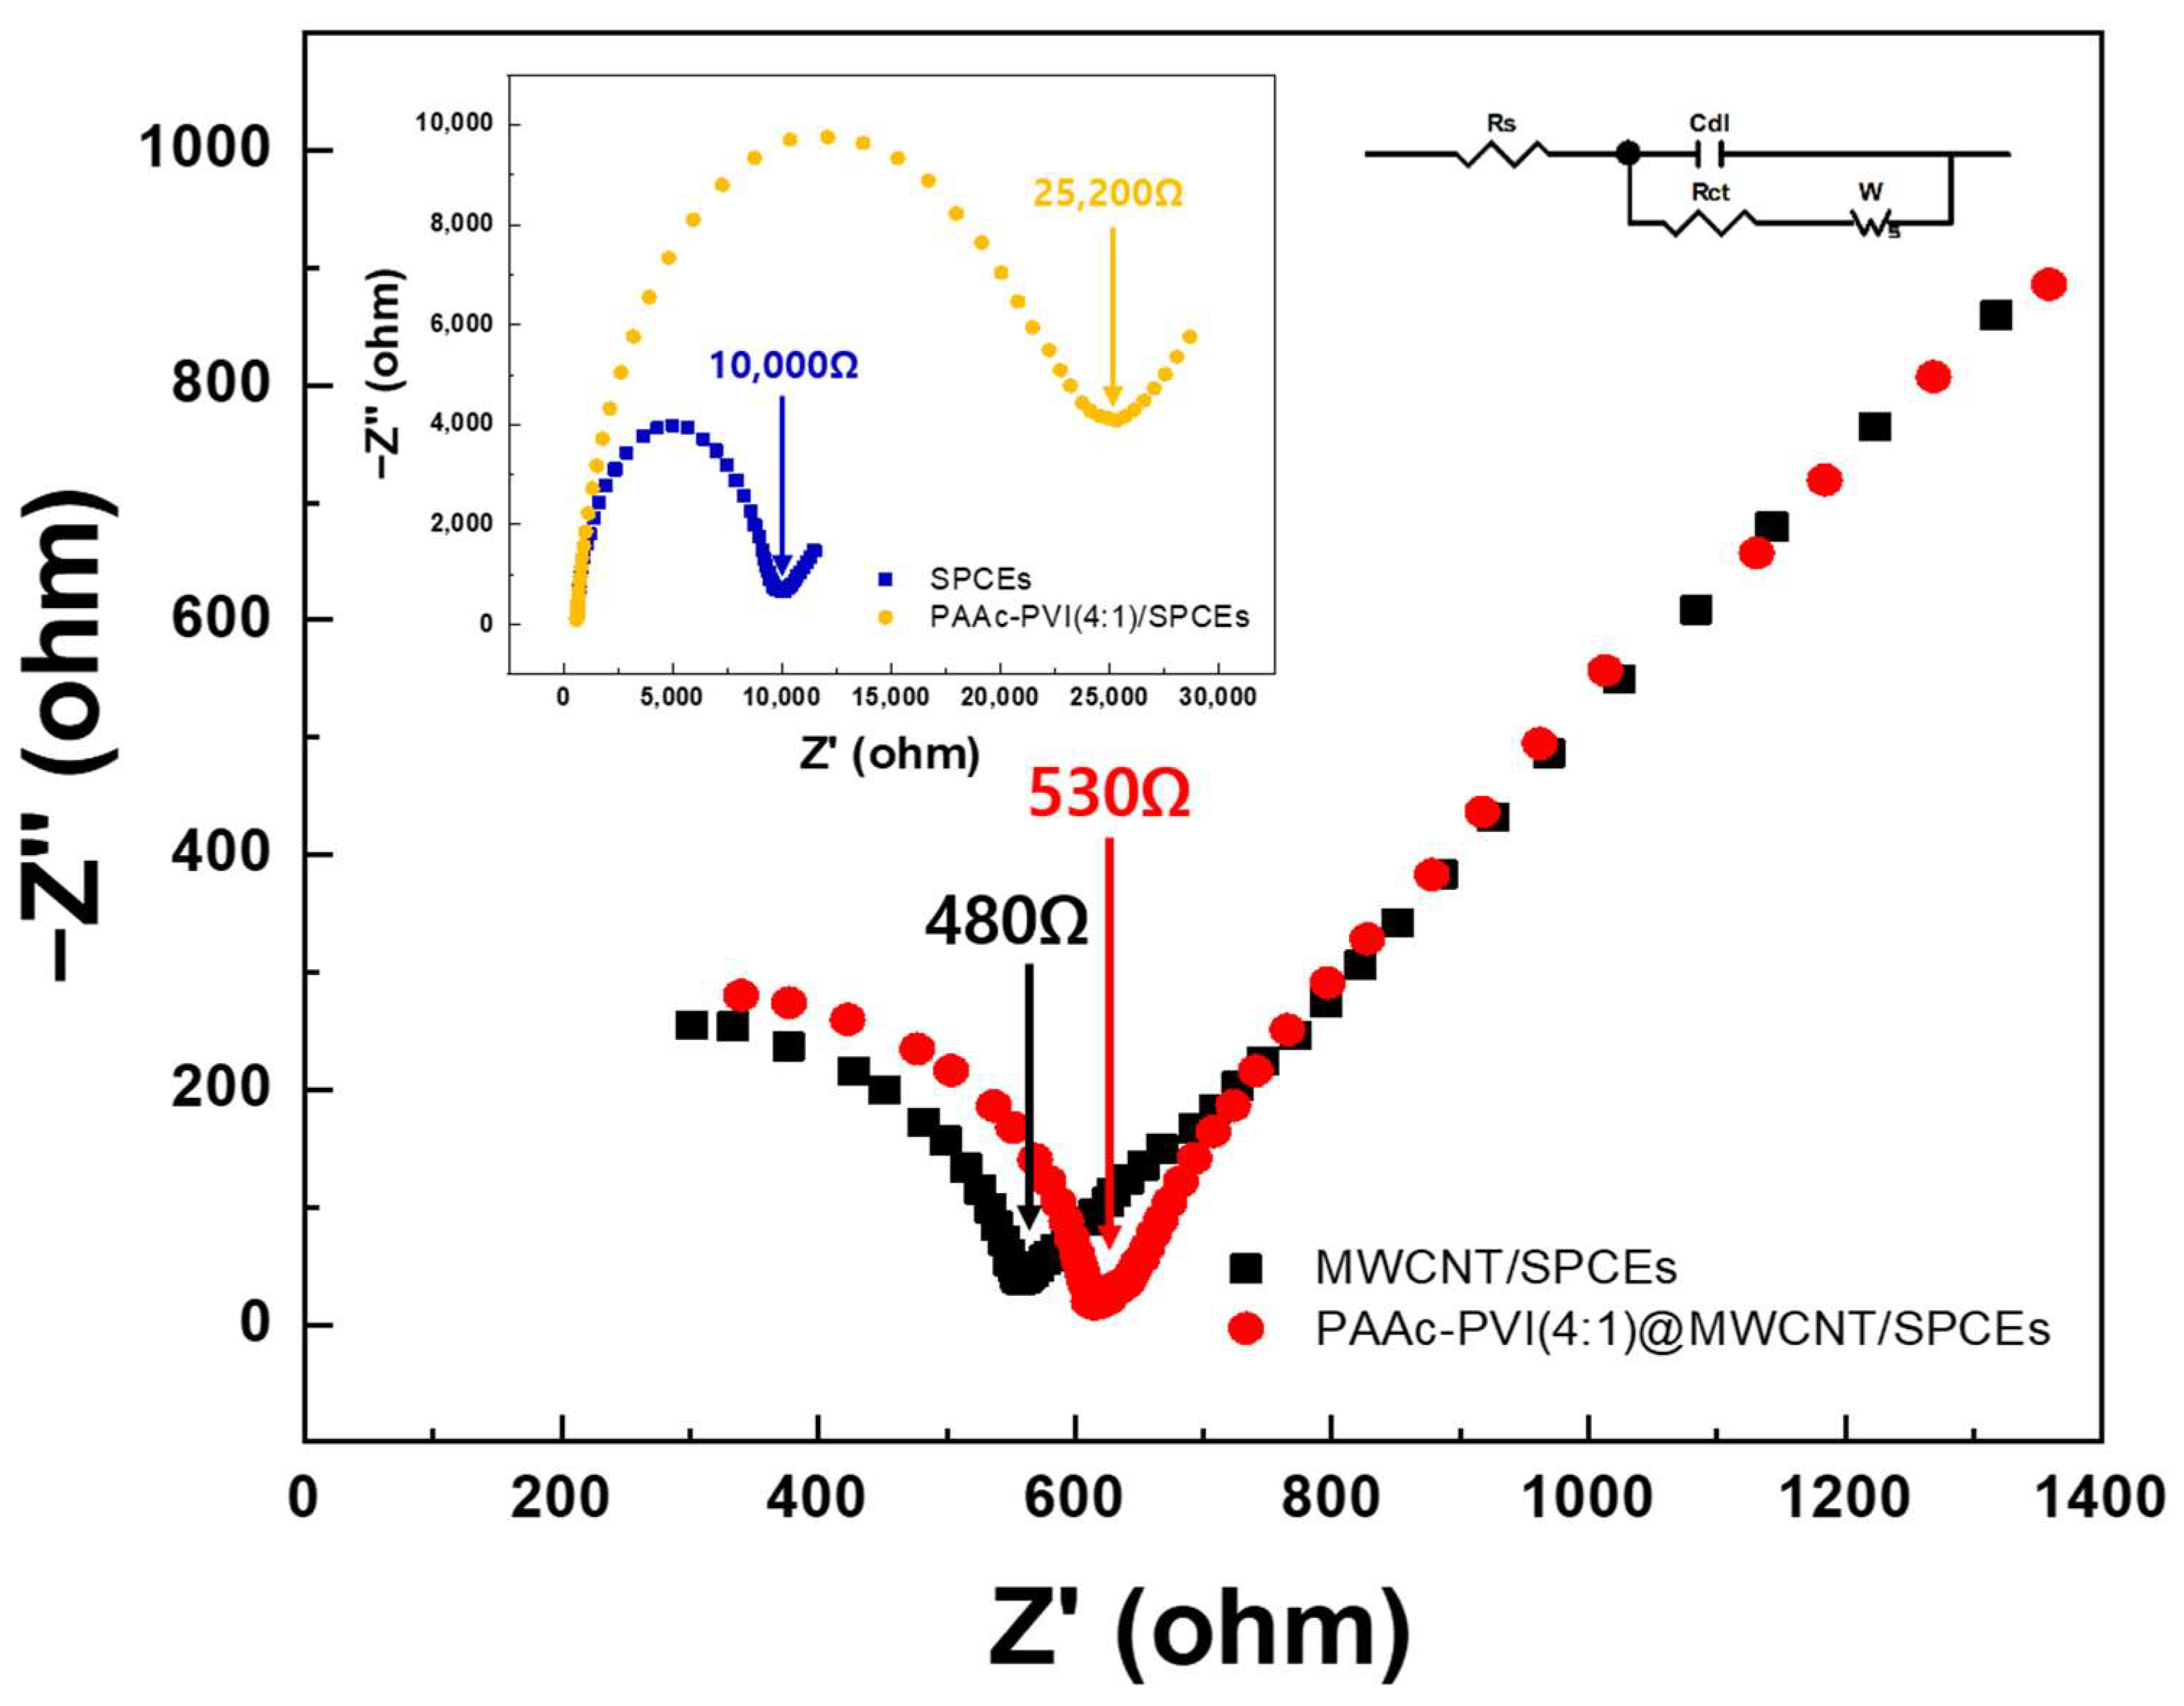
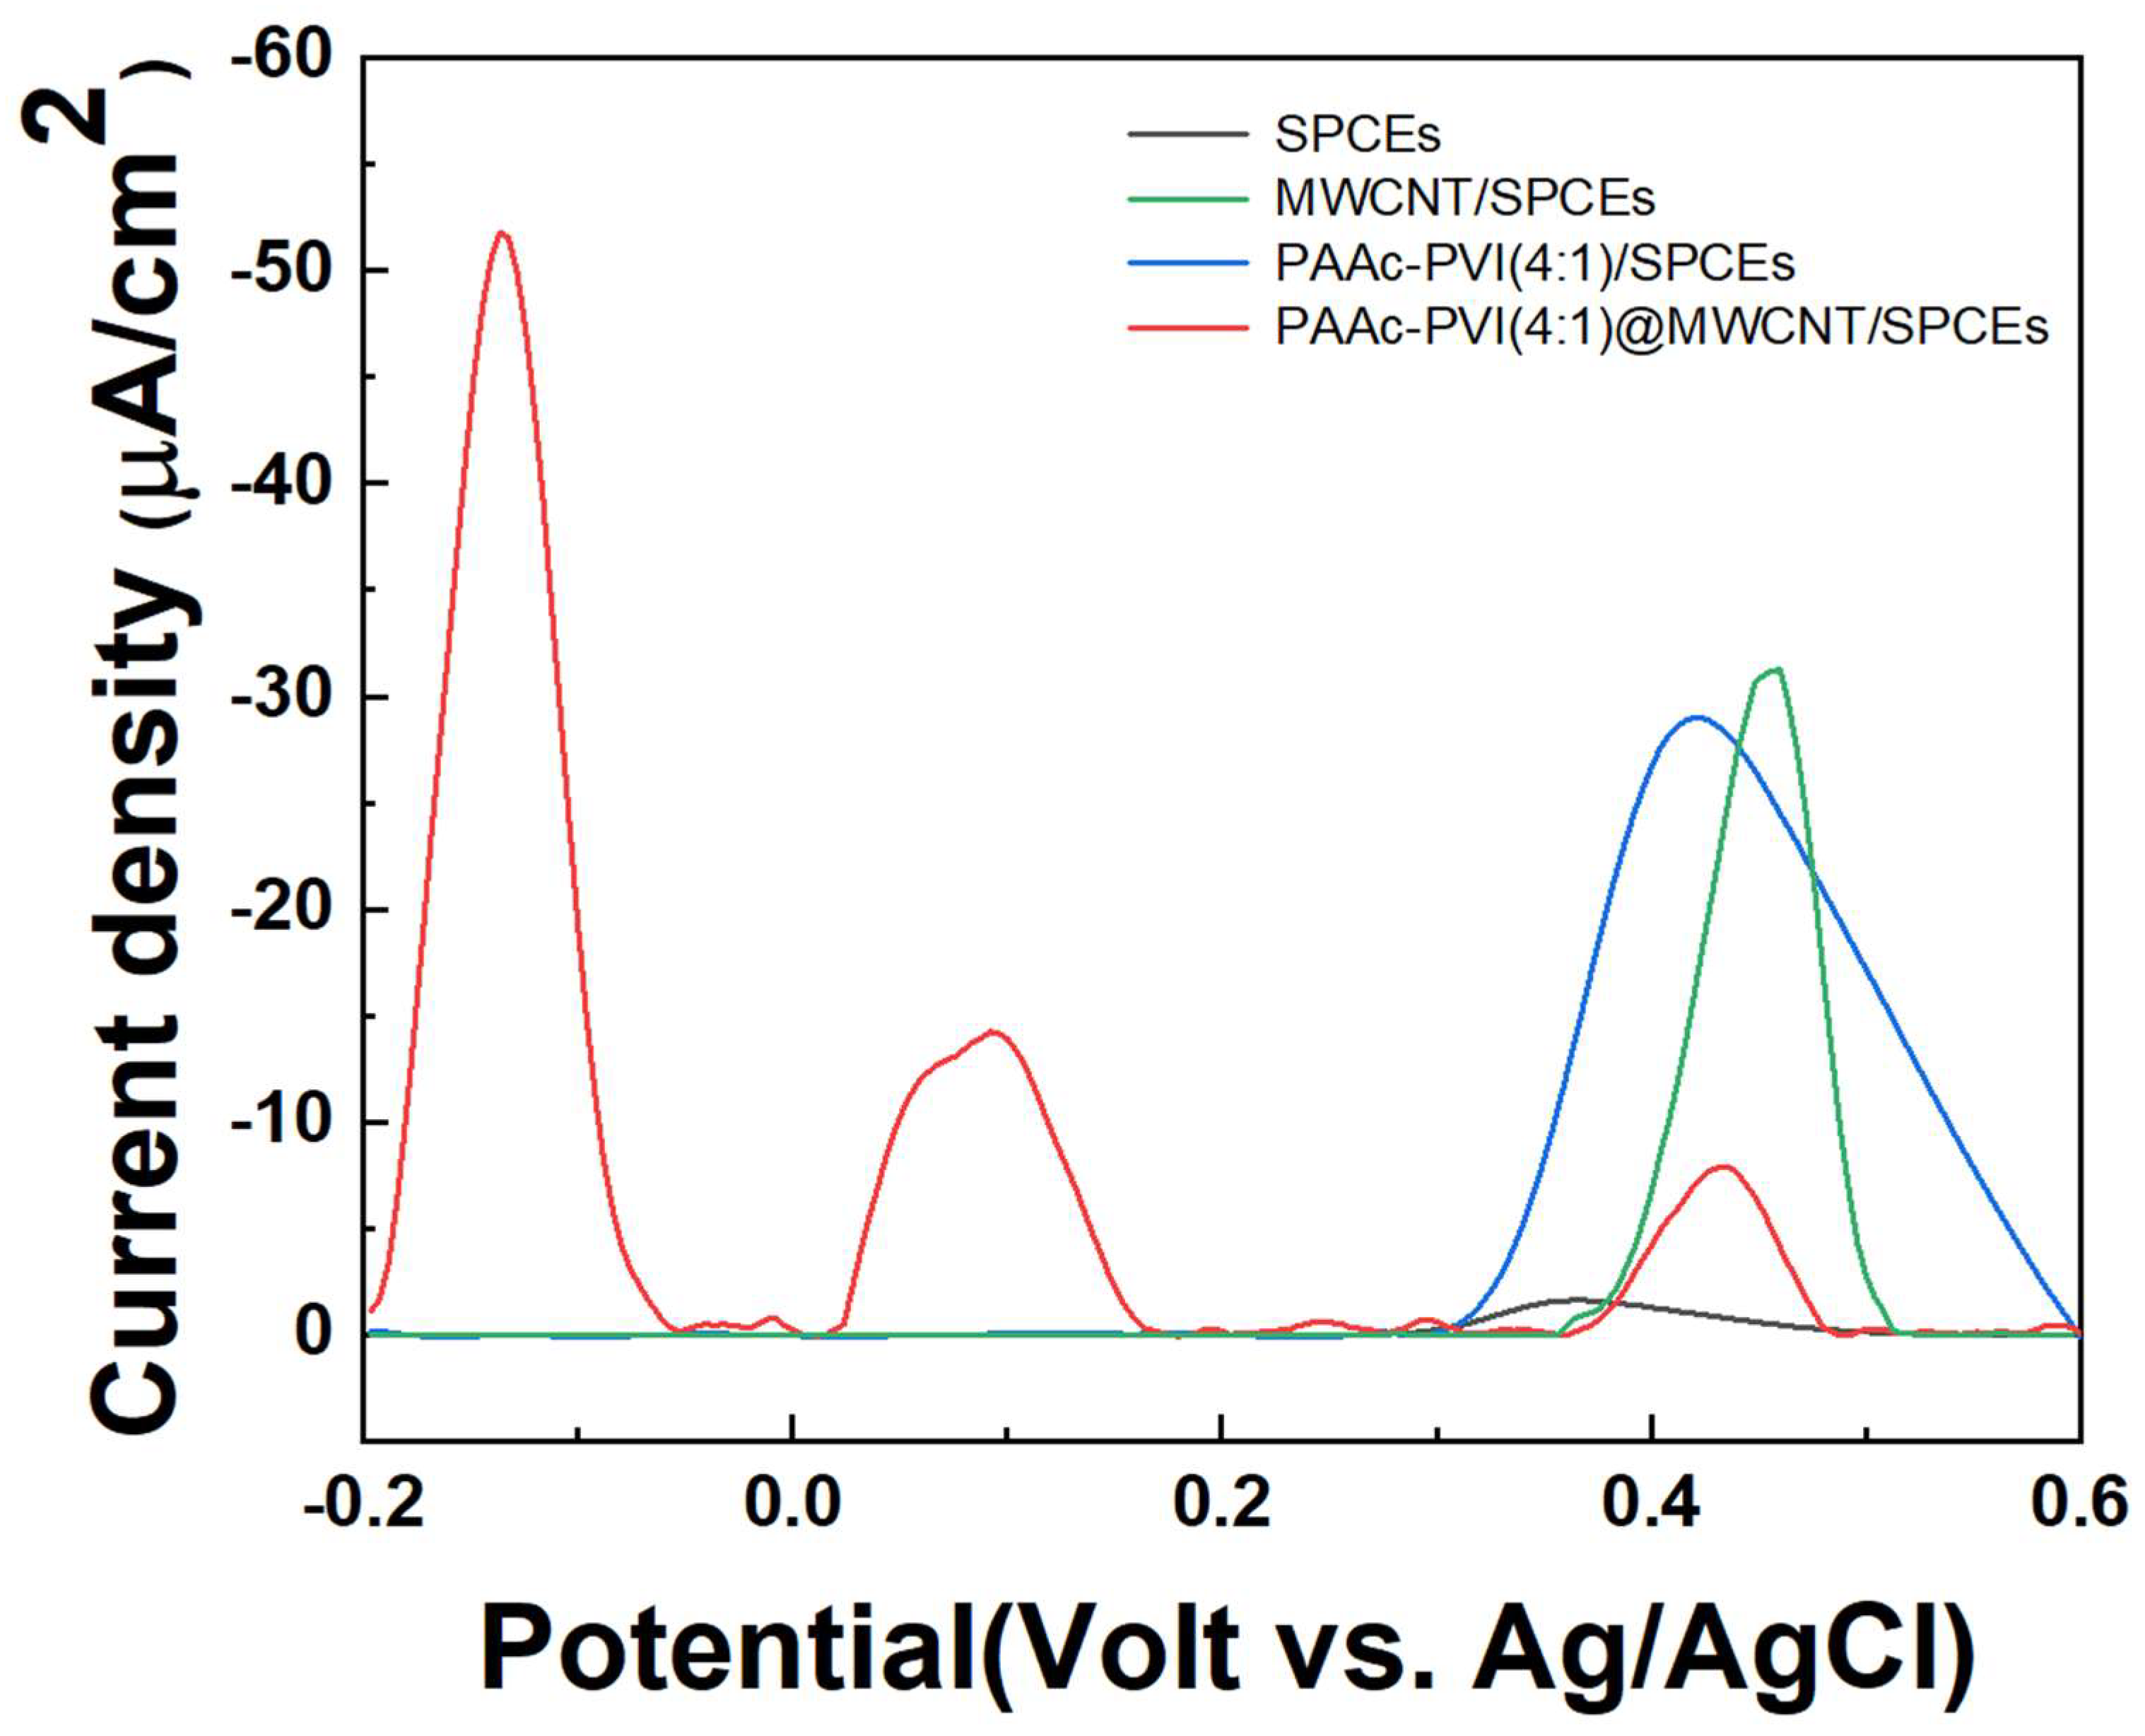
3.3. Electrochemical Characterization of PAAc-PVI@MWCNTs/SPCEs

The interface properties of the PAAc-PVI@MWCNT modified SPCEs were studied by EIS (Figure 6). In the Nyquist plot obtained from EIS measurements, the high-frequency semicircle represents the electron transfer resistance, while the low-frequency linear region reflects diffusion-controlled behavior. The diameter of the semicircle is directly related to the charge transfer resistance (Rct) [41]. The Rct of PAAc-PVI/SPCEs (yellow) dramatically increases over that of bare SPCEs (blue), from 10,000 to 25,200 Ω, and the Rct of MWCNTs/SPCEs (black) slowly declines from that of PAAc-PVI@MWCNTs/SPCEs (red) (from 530 to 480 Ω). Accordingly, whereas the PAAc-PVI polymer film increased the charge transfer resistance (Rct) on the SPCE surface, the PAAc-PVI@MWCNT composite facilitated electron transfer at the electrode interface.

3.4. Serotonin Sensing

3.4.1. Electrochemical Characterization Changing Electrode Conditions

In Figure 7, pulse difference voltammetry (DPV) was carried out ranging from −0.2 to 0.6 V (vs. Ag/AgCl) at 1X PBS. DPV was measured on SPCEs, MWCNT/SPCEs, PAAc-PVI(4:1)/SPCEs, and PAAc-PVI(4:1)@MWCNT/SPCEs, where 40 μL of 10 μM serotonin was dissolved in 1X PBS (pH 7.4). In the SPCEs, the serotonin signal appeared as a single signal at 0.4 V, which is presumed to be because the electrons are released at once. In MWCNT/SPCEs, the serotonin signal was amplified at 0.4 V. DPV increased due to the combination of the negative carboxylic acid in PAAc-PVI/SPCEs and the amino group of serotonins. Also, the peak was located at 0.4 V (vs. Ag/AgCl). However, in the PAAc-PVI(4:1)@MWCNT/SPCEs, multiple peaks at −0.15 V, 0.1 V, and 0.4 V were confirmed due to the combination of high conductivity MWCNT and hydrophilic polymer. This phenomenon is consistent with the findings of a recently reported study [30], where each peak is believed to correspond to specific interactions: the PAAc-PVI(4:1)@MWCNT interaction at −0.15 V, a signal originating from the buffer solution at +0.10 V, and the inherent response of the SPCE at +0.40 V.

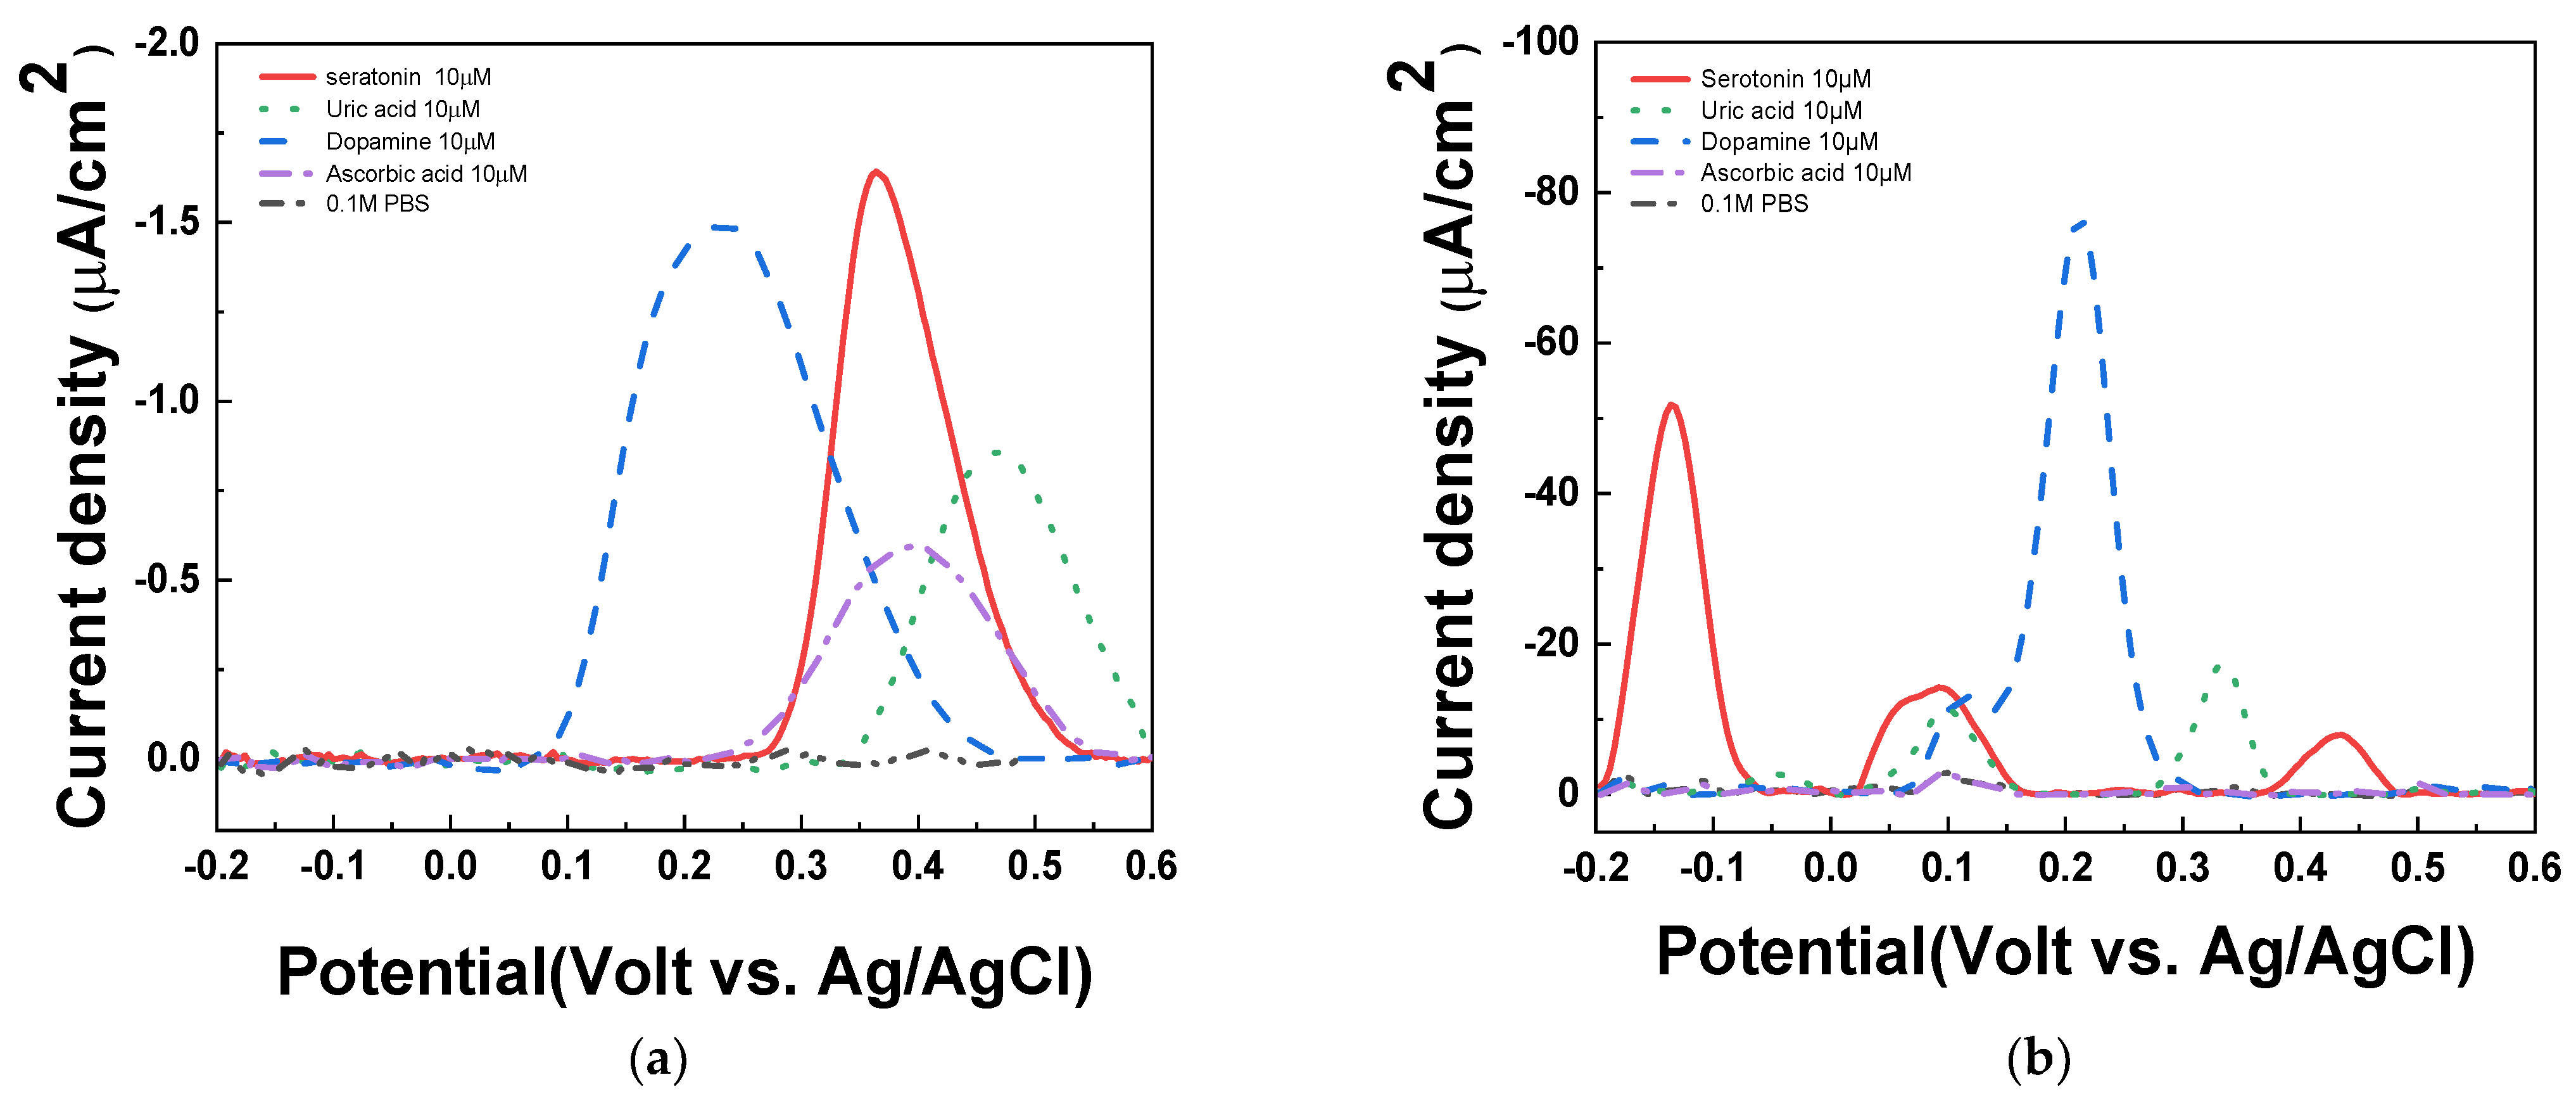
3.4.2. Interfering Test

To investigate the influence of interferences, 1X PBS (pH 7.4), 10 μM of uric acid, dopamine, ascorbic acid, and serotonin were measured by DPV in PAAc-PVI@MWCNT/SPCEs and SPCEs. As shown in Figure 8a, the serotonin peak was overlapped with ascorbic acid in SPCEs at 0.4 V (vs. Ag/AgCl). On the other hand, in Figure 8b, the serotonin peaks were separated with all interferences at −0.15 V (vs. Ag/AgCl). Therefore, we confirmed that the PAAc-PVI@MWCNT/SPCEs enables selective quantification of serotonin without being affected by interfering substances such as uric acid, dopamine, and ascorbic acid.

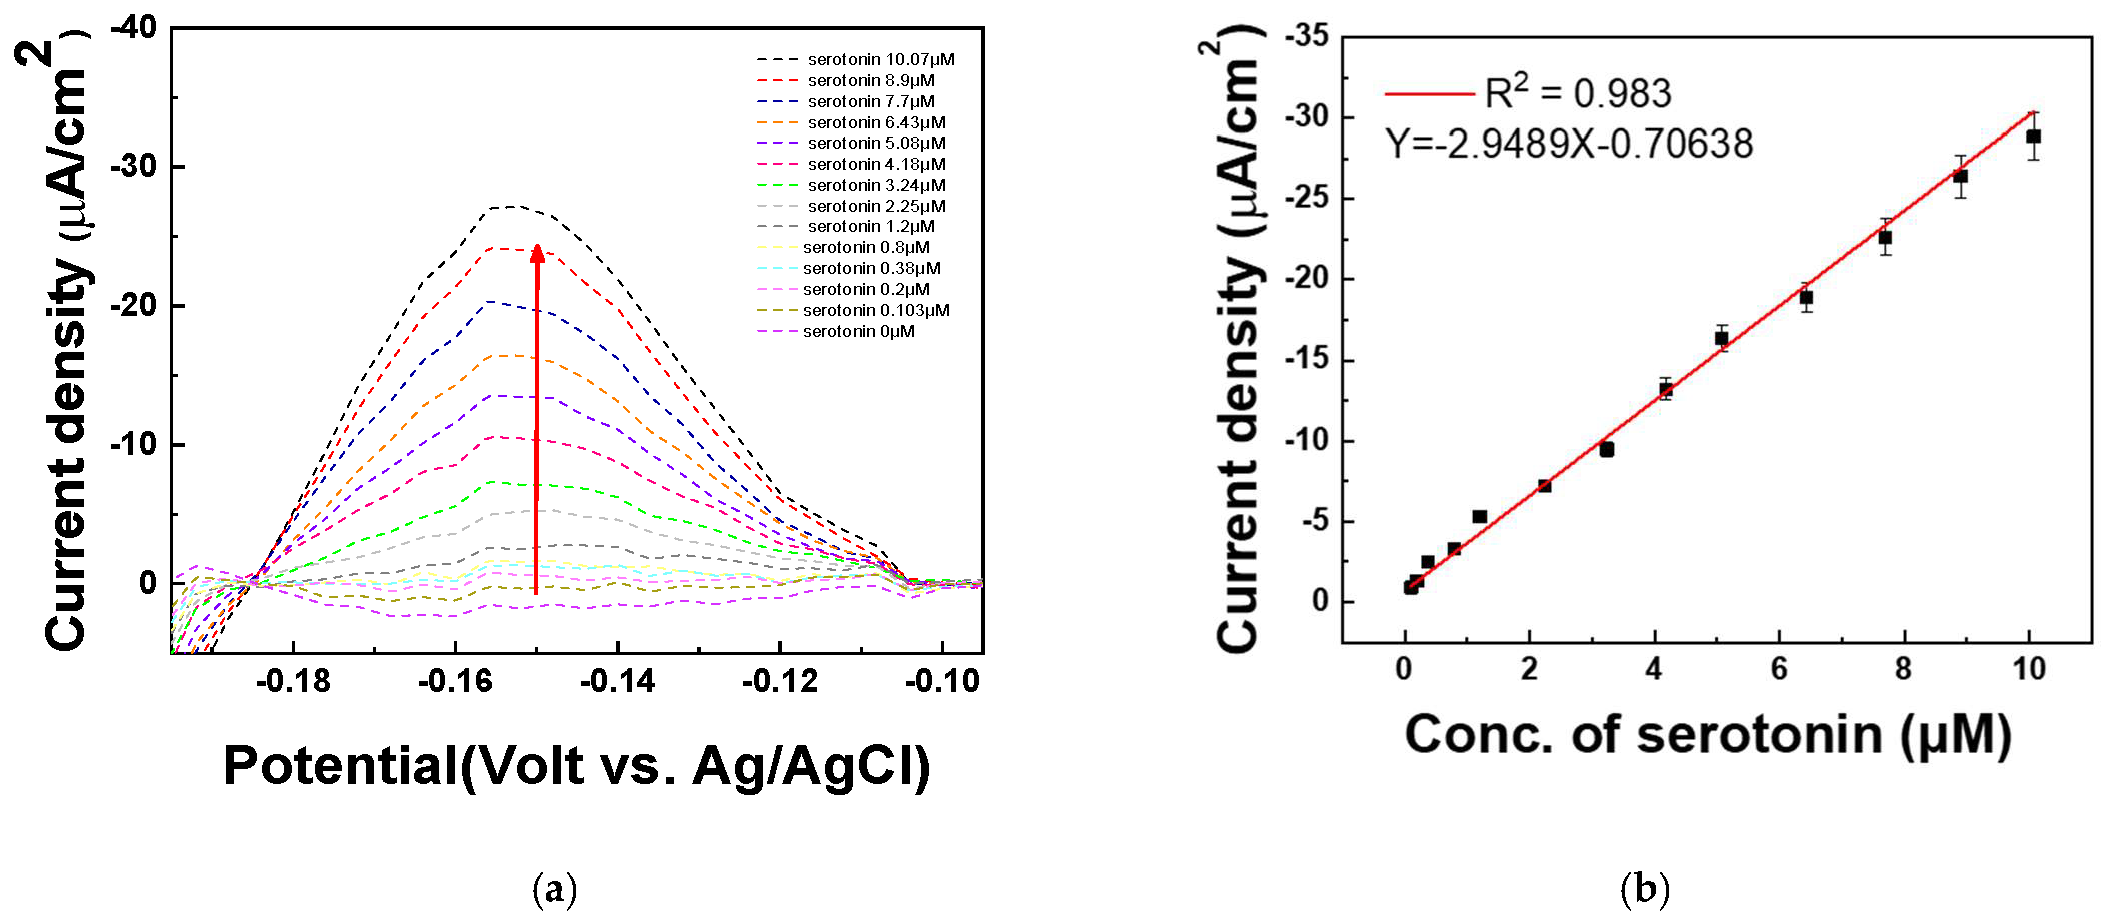
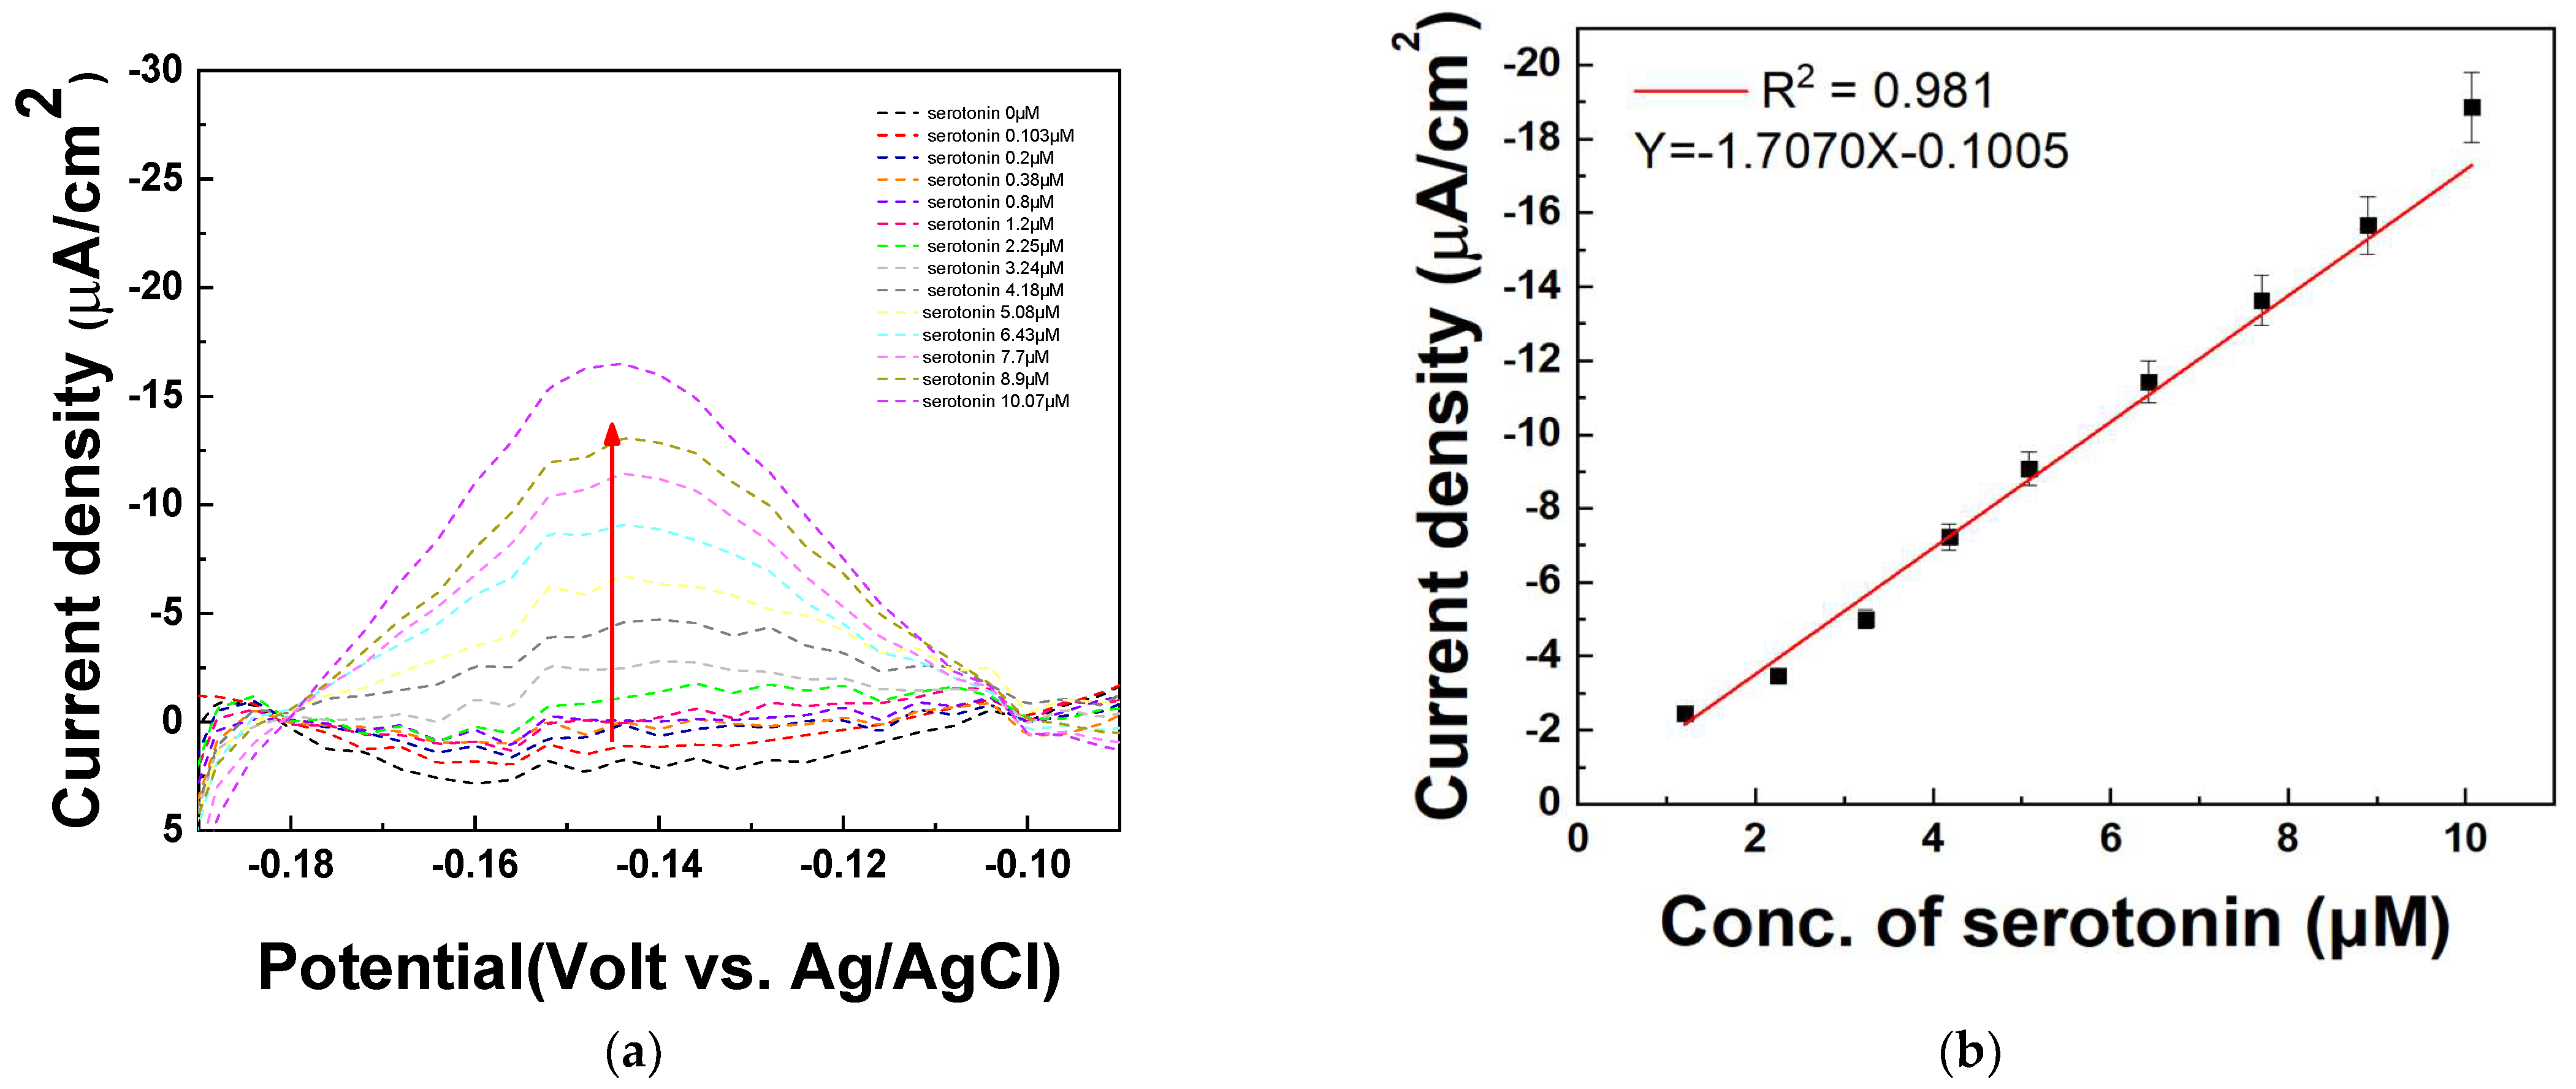
3.4.3. Serotonin Quantification

The DPV technique was used to quantify various concentrations of serotonin. To evaluate the quantitative response of the fabricated electrode to serotonin, differential pulse voltammetry (DPV) measurements were performed in 1X PBS (pH 7.4). The solution was first spiked with 20 μM serotonin, followed by the addition of various serotonin concentrations (0, 0.103, 0.2, 0.38, 0.8, 1.2, 2.25, 3.24, 4.18, 5.08, 6.43, 7.7, 8.9, and 10.07 μM). The DPV analysis was conducted to assess the electrode’s sensitivity and linearity in detecting serotonin under these conditions. Figure 9a shows that the current signal increased sequentially as the serotonin concentration increased at −0.15 V. The DPV peaks increase with successive increases in the serotonin concentrations (0~10.07 μM). As shown in Figure 9b, the amount of serotonin is determined by monitoring the increase in DPV current at −0.15 V (vs. Ag/AgCl) on the PAAc-PVI@MWCNTs/SPCEs. A strong linear relationship was observed for serotonin concentrations ranging from 0 to 10.07 μM, with a correlation coefficient (R2) of 0.983. The limit of detection (LOD) was determined to be 0.015 μM, and the relative standard deviation (RSD) was 3.88% based on four independently prepared electrodes (N = 4), as summarized in Table 2. Therefore, the PAAc-PVI@MWCNTs/SPCEs can be used for the determination of serotonin.

3.5. Serotonin Sensing in Serum Sample

The DPV technique was used to quantify various concentrations of serotonin in serum samples. To verify the quantitative response of the fabricated electrode to serotonin, differential pulse voltammetry (DPV) measurements were performed in human serum (Sigma-Aldrich, USA). The serum was first spiked with 20 μM serotonin, followed by the introduction of various serotonin concentrations (0, 0.103, 0.2, 0.38, 0.8, 1.2, 2.25, 3.24, 4.18, 5.08, 6.43, 7.7, 8.9, and 10.07 μM). The DPV analysis was conducted to evaluate the electrode’s sensitivity and linearity in detecting serotonin under these conditions. Figure 10a shows that the current signal increased sequentially as the serotonin concentration increased at −0.15 V. It is assumed that the decreased current is due to the existence of various matrices in the serum sample. Similar to the result in Figure 9, the DPV peaks increase with successive increases in the serotonin concentrations (1.2, 2.25, 3.24, 4.18, 5.08, 6.43, 7.7, 8.9, 10.07 μM) in Figure 10a. As shown in Figure 10b, the amount of serotonin is determined by monitoring the increase in DPV current at −0.15 V (vs. Ag/AgCl) on the PAAc-PVI@MWCNTs/SPCEs. A linear detection range for serotonin was obtained from 1.2 to 10.07 μM, with a correlation coefficient (R2) of 0.981. The limit of detection (LOD) was calculated to be 0.0769 μM, and the relative standard deviation (RSD) was 3.88% based on four distinct electrodes (N = 4), as summarized in Table 3. These findings suggest that the PAAc-PVI@MWCNT composite is a promising candidate for use as a functional material in biosensor applications.

4. Discussion and Conclusions

In this article, we evidenced an excellent peak separation of serotonin onto the SPCEs using PAAc-PVI@MWCNT materials. The hydrophilic nanocomposite materials showed great conductivity because of no structural leaking. The electrochemical technique method of DPV determined serotonin level even if existing physiological interference species such as ascorbic acid, uric acid, and dopamine. Interestingly, the PAAc-PVI@MWCNT/SPCEs-based LOD (0.076877 μM) value offers promising results for the peak classification of serotonin, especially when compared with other electrochemical materials. Additionally, in the analysis using human serum as the solvent, the signal response of serotonin showed high linearity with an R2 value of 0.981 in the concentration range from 1.2 μM to 10.07 μM. This suggests the potential for quantitatively measuring serotonin concentrations in actual blood samples without interference by the hybrid matrix components present in blood. This method does not require specialized skills compared to traditional HPLC measurements. Unlike conventional electrochemical methods that involve surface modification of glassy carbon electrodes with nanoparticles or polymers, it was developed by utilizing MWCNTs and random copolymers on disposable screen-printed carbon electrodes.
The serotonin detection technology developed in this study offers a low-cost and user-friendly approach that enables easy measurement of serotonin levels. Future work will follow for more detailed control to separate other physiological species such as ascorbic acid, uric acid, and dopamine. The high-conductivity electrode fabricated with the MWCNT–polymer composite developed in this study is not only applicable to serotonin detection but also holds potential for broader applications such as glucose sensing, immunoassays, and point-of-care diagnostic systems. Furthermore, this platform may be extended to emerging biofuel cell electrode research, offering a versatile foundation for future bioelectrochemical applications.

Author Contributions

Conceptualization, Y.-B.C.; methodology, R.-H.K., T.-W.S. and W.-Y.J.; software, R.-H.K., T.-W.S. and W.-Y.J.; validation, R.-H.K., T.-W.S. and W.-Y.J.; formal analysis, R.-H.K., T.-W.S. and W.-Y.J.; investigation, R.-H.K., T.-W.S. and W.-Y.J.; resources, R.-H.K., T.-W.S. and W.-Y.J.; data curation, R.-H.K., T.-W.S. and W.-Y.J.; writing—original draft preparation, Y.-B.C.; writing—review and editing, Y.-B.C.; visualization, R.-H.K., T.-W.S. and W.-Y.J.; supervision, Y.-B.C.; project administration, R.-H.K., T.-W.S. and W.-Y.J.; funding acquisition, Y.-B.C. All authors have read and agreed to the published version of the manuscript.

Funding

The present research was supported by the research fund of Dankook University in 2024.

Institutional Review Board Statement

We have consulted with the Institutional Review Board (IRB) at Dankook University concerning whether our study requires ethical approval. However, the IRB informed us that there is no established procedure for determining whether this specific type of research content falls under IRB review.

Informed Consent Statement

Not applicable.

Data Availability Statement

All data generated or analyzed during this study are included in this published article.

Acknowledgments

The present research was supported by the research fund of Dankook University in 2024.

Conflicts of Interest

The authors declare no conflicts of interest.

References

  1. Thomsen, S.F. Atopic Dermatitis: Natural History, Diagnosis, and Treatment. ISRN Allergy 2014, 2014, 354250. [Google Scholar] [CrossRef] [PubMed]
  2. Han, L.; Dong, X. Itch Mechanisms and Circuits. Annu. Rev. Biophys. 2014, 43, 331–355. [Google Scholar] [CrossRef] [PubMed]
  3. Schonmann, Y.; Mansfield, K.E.; Hayes, J.F.; Abuabara, K.; Roberts, A.; Smeeth, L.; Langan, S.M. Atopic Eczema in Adulthood and Risk of Depression and Anxiety: A Population-Based Cohort Study. J. Allergy Clin. Immunol. Pract. 2020, 8, 248–257.e16. [Google Scholar] [CrossRef]
  4. Wang, J.; Zhou, Y.; Zhang, H.; Hu, L.; Liu, J.; Wang, L.; Wang, T.; Zhang, H.; Cong, L.; Wang, Q. Pathogenesis of Allergic Diseases and Implications for Therapeutic Interventions. Signal Transduct. Target. Ther. 2023, 8, 138. [Google Scholar] [CrossRef]
  5. Lee, J.H.; Son, S.W.; Cho, S.H. A Comprehensive Review of the Treatment of Atopic Eczema. Allergy Asthma Immunol. Res. 2016, 8, 181. [Google Scholar] [CrossRef] [PubMed]
  6. Morita, T.; McClain, S.P.; Batia, L.M.; Pellegrino, M.; Wilson, S.R.; Kienzler, M.A.; Lyman, K.; Olsen, A.S.B.; Wong, J.F.; Stucky, C.L.; et al. HTR7 Mediates Serotonergic Acute and Chronic Itch. Neuron 2015, 87, 124–138. [Google Scholar] [CrossRef]
  7. Dorszewska, J.; Florczak-Wyspianska, J.; Kowalska, M.; Stanski, M.; Kowalewska, A.; Kozubski, W.; Dorszewska, J.; Florczak-Wyspianska, J.; Kowalska, M.; Stanski, M.; et al. Serotonin in Neurological Diseases. In Serotonin—A Chemical Messenger Between All Types of Living Cells; IntechOpen: London, UK, 2017; ISBN 978-953-51-3362-9. [Google Scholar]
  8. Chavan, S.G.; Rathod, P.R.; Koyappayil, A.; Hwang, S.; Lee, M.-H. Recent Advances of Electrochemical and Optical Point-of-Care Biosensors for Detecting Neurotransmitter Serotonin Biomarkers. Biosens. Bioelectron. 2025, 267, 116743. [Google Scholar] [CrossRef]
  9. Khoshnevisan, K.; Honarvarfard, E.; Torabi, F.; Maleki, H.; Baharifar, H.; Faridbod, F.; Larijani, B.; Khorramizadeh, M.R. Electrochemical Detection of Serotonin: A New Approach. Clin. Chim. Acta 2020, 501, 112–119. [Google Scholar] [CrossRef]
  10. Chapin, A.A.; Rajasekaran, P.R.; Quan, D.N.; Hu, L.; Herberholz, J.; Bentley, W.E.; Ghodssi, R. Electrochemical Measurement of Serotonin by Au-CNT Electrodes Fabricated on Microporous Cell Culture Membranes. Microsyst. Nanoeng 2020, 6, 90. [Google Scholar] [CrossRef]
  11. Kundys-Siedlecka, M.; Bączyńska, E.; Jönsson-Niedziółka, M. Electrochemical Detection of Dopamine and Serotonin in the Presence of Interferences in a Rotating Droplet System. Anal. Chem. 2019, 91, 10908–10913. [Google Scholar] [CrossRef]
  12. Robinson, D.L.; Hermans, A.; Seipel, A.T.; Wightman, R.M. Monitoring Rapid Chemical Communication in the Brain. Chem. Rev. 2008, 108, 2554–2584. [Google Scholar] [CrossRef] [PubMed]
  13. Boix, J.; Cauli, O. Alteration of Serotonin System by Polychlorinated Biphenyls Exposure. Neurochem. Int. 2012, 60, 809–816. [Google Scholar] [CrossRef] [PubMed]
  14. Zhou, J.; Sheng, M.; Jiang, X.; Wu, G.; Gao, F. Simultaneous Determination of Dopamine, Serotonin and Ascorbic Acid at a Glassy Carbon Electrode Modified with Carbon-Spheres. Sensors 2013, 13, 14029–14040. [Google Scholar] [CrossRef] [PubMed]
  15. Malik, M.; Narwal, V.; Pundir, C.S. Ascorbic Acid Biosensing Methods: A Review. Process Biochem. 2022, 118, 11–23. [Google Scholar] [CrossRef]
  16. Jain, B.P.; Goswami, S.K.; Pandey, S. Chapter 9—Clinical Biochemistry. In Protocols in Biochemistry and Clinical Biochemistry; Jain, B.P., Goswami, S.K., Pandey, S., Eds.; Academic Press: Cambridge, MA, USA, 2021; pp. 101–118. ISBN 978-0-12-822007-8. [Google Scholar]
  17. Sharma, S.; Singh, N.; Tomar, V.; Chandra, R. A Review on Electrochemical Detection of Serotonin Based on Surface Modified Electrodes. Biosens. Bioelectron. 2018, 107, 76–93. [Google Scholar] [CrossRef]
  18. Goyal, R.N.; Gupta, V.K.; Oyama, M.; Bachheti, N. Gold Nanoparticles Modified Indium Tin Oxide Electrode for the Simultaneous Determination of Dopamine and Serotonin: Application in Pharmaceutical Formulations and Biological Fluids. Talanta 2007, 72, 976–983. [Google Scholar] [CrossRef]
  19. Babaei, A.; Babazadeh, M. A Selective Simultaneous Determination of Levodopa and Serotonin Using a Glassy Carbon Electrode Modified with Multiwalled Carbon Nanotube/Chitosan Composite. Electroanalysis 2011, 23, 1726–1735. [Google Scholar] [CrossRef]
  20. Goff, A.L.; Moggia, F.; Debou, N.; Jegou, P.; Artero, V.; Fontecave, M.; Jousselme, B.; Palacin, S. Facile and Tunable Functionalization of Carbon Nanotube Electrodes with Ferrocene by Covalent Coupling and π-Stacking Interactions and Their Relevance to Glucose Bio-Sensing. J. Electroanal. Chem. 2010, 641, 57–63. [Google Scholar] [CrossRef]
  21. Liu, Y.; Wang, X.; Wang, W.; Li, B.; Wu, P.; Ren, M.; Cheng, Z.; Chen, T.; Liu, X. One-Step Preparation of Oxygen/Fluorine Dual Functional MWCNTs with Good Water Dispersibility by the Initiation of Fluorine Gas. ACS Appl. Mater. Interfaces 2016, 8, 7991–7999. [Google Scholar] [CrossRef]
  22. Suri, A.; Chakraborty, A.K.; Coleman, K.S. A Facile, Solvent-Free, Noncovalent, and Nondisruptive Route To Functionalize Single-Wall Carbon Nanotubes Using Tertiary Phosphines. Chem. Mater. 2008, 20, 1705–1709. [Google Scholar] [CrossRef]
  23. Peng, H.; Alemany, L.B.; Margrave, J.L.; Khabashesku, V.N. Sidewall Carboxylic Acid Functionalization of Single-Walled Carbon Nanotubes. J. Am. Chem. Soc. 2003, 125, 15174–15182. [Google Scholar] [CrossRef] [PubMed]
  24. Khan, A.; Alamry, K.A. Surface Modified Carbon Nanotubes: An Introduction. In Surface Modified Carbon Nanotubes Volume 1: Fundamentals, Synthesis and Recent Trends; ACS Symposium Series; American Chemical Society: Washington, DC, USA, 2022; Volume 1424, pp. 1–25. ISBN 978-0-8412-9749-4. [Google Scholar]
  25. Gautam, V.; Singh, K.P.; Yadav, V.L. Polyaniline/Multiwall Carbon Nanotubes/Starch Nanocomposite Material and Hemoglobin Modified Carbon Paste Electrode for Hydrogen Peroxide and Glucose Biosensing. Int. J. Biol. Macromol. 2018, 111, 1124–1132. [Google Scholar] [CrossRef] [PubMed]
  26. Avilés, F.; Cauich-Rodríguez, J.V.; Toro-Estay, P.; Yazdani-Pedram, M.; Aguilar-Bolados, H. Improving Carbon Nanotube/Polymer Interactions in Nanocomposites. In Carbon Nanotube-Reinforced Polymers; Elsevier: Amsterdam, The Netherlands, 2018; pp. 83–115. ISBN 978-0-323-48221-9. [Google Scholar]
  27. Millán-Pacheco, C.; Serratos, I.N.; del Rosario Sánchez González, S.; Galano, A. Newly Designed Melatonin Analogues with Potential Neuroprotective Effects. Theor. Chem. Acc. 2022, 141, 49. [Google Scholar] [CrossRef]
  28. Pratuangdejkul, J.; Nosoongnoen, W.; Guérin, G.-A.; Loric, S.; Conti, M.; Launay, J.-M.; Manivet, P. Conformational Dependence of Serotonin Theoretical pKa Prediction. Chem. Phys. Lett. 2006, 420, 538–544. [Google Scholar] [CrossRef]
  29. Laviron, E. General Expression of the Linear Potential Sweep Voltammogram in the Case of Diffusionless Electrochemical Systems. J. Electroanal. Chem. Interfacial Electrochem. 1979, 101, 19–28. [Google Scholar] [CrossRef]
  30. Coyle, V.E.; Brothers, M.C.; McDonald, S.; Kim, S.S. Superlative and Selective Sensing of Serotonin in Undiluted Human Serum Using Novel Polystyrene Sulfonate Conductive Polymer. ACS Omega 2024, 9, 16800–16809. [Google Scholar] [CrossRef]
  31. Jeon, W.-Y.; Choi, Y.-B.; Kim, H.-H. Ultrasonic Synthesis and Characterization of Poly(Acrylamide)-Co-Poly(Vinylimidazole)@MWCNTs Composite for Use as an Electrochemical Material. Ultrason. Sonochem. 2018, 43, 73–79. [Google Scholar] [CrossRef]
  32. Ding, H.; Zhang, X.N.; Zheng, S.Y.; Song, Y.; Wu, Z.L.; Zheng, Q. Hydrogen Bond Reinforced Poly(1-Vinylimidazole-Co-Acrylic Acid) Hydrogels with High Toughness, Fast Self-Recovery, and Dual pH-Responsiveness. Polymer 2017, 131, 95–103. [Google Scholar] [CrossRef]
  33. Drolet, D.P.; Manuta, D.M.; Lees, A.J.; Katnani, A.D.; Coyle, G.J. FT-IR and XPS Study of Copper(II) Complexes of Imidazole and Benzimidazole. Inorganica Chim. Acta 1988, 146, 173–180. [Google Scholar] [CrossRef]
  34. Szybowicz, M.; Nowicka, A.B.; Dychalska, A. Characterization of Carbon Nanomaterials by Raman Spectroscopy. In Characterization of Nanomaterials; Elsevier: Amsterdam, The Netherlands, 2018; pp. 1–36. ISBN 978-0-08-101973-3. [Google Scholar]
  35. Tian, Y.; Liu, Z.; Li, X.; Zhang, L.; Li, R.; Jiang, R.; Dong, F. The Cavitation Erosion of Ultrasonic Sonotrode during Large-Scale Metallic Casting: Experiment and Simulation. Ultrason. Sonochem. 2018, 43, 29–37. [Google Scholar] [CrossRef]
  36. Bounos, G.; Andrikopoulos, K.S.; Karachalios, T.K.; Voyiatzis, G.A. Evaluation of Multi-Walled Carbon Nanotube Concentrations in Polymer Nanocomposites by Raman Spectroscopy. Carbon 2014, 76, 301–309. [Google Scholar] [CrossRef]
  37. Hamouma, O.; Oukil, D.; Omastová, M.; Chehimi, M.M. Flexible Paper@carbon Nanotube@polypyrrole Composites: The Combined Pivotal Roles of Diazonium Chemistry and Sonochemical Polymerization. Colloids Surf. Physicochem. Eng. Asp. 2018, 538, 350–360. [Google Scholar] [CrossRef]
  38. White, B.; Banerjee, S.; O’Brien, S.; Turro, N.J.; Herman, I.P. Zeta-Potential Measurements of Surfactant-Wrapped Individual Single-Walled Carbon Nanotubes. J. Phys. Chem. C 2007, 111, 13684–13690. [Google Scholar] [CrossRef]
  39. Foillard, S.; Zuber, G.; Doris, E. Polyethylenimine–Carbon Nanotube Nanohybrids for siRNA-Mediated Gene Silencing at Cellular Level. Nanoscale 2011, 3, 1461. [Google Scholar] [CrossRef]
  40. Hethnawi, A.; Nassar, N.N.; Vitale, G. Preparation and Characterization of Polyethylenimine-Functionalized Pyroxene Nanoparticles and Its Application in Wastewater Treatment. Colloids Surf. Physicochem. Eng. Asp. 2017, 525, 20–30. [Google Scholar] [CrossRef]
  41. Wang, S.; Zhang, J.; Gharbi, O.; Vivier, V.; Gao, M.; Orazem, M.E. Electrochemical Impedance Spectroscopy. Nat. Rev. Methods Primer 2021, 1, 41. [Google Scholar] [CrossRef]
Figure 1. FT-IR spectra of 1-vinylimidazole (black), acrylic acid (red), and PAAc-PVI (blue).
Chemosensors 13 00185 g001
Figure 2. Raman spectra of MWCNT, PAAc-PVI(4:1), and PAAc-PVI(4:1)@MWCNT.
Chemosensors 13 00185 g002
Figure 3. HR-TEM images of (a) MWCNT, (b) PAAc-PVI(4:1)@MWCNT.
Chemosensors 13 00185 g003
Figure 4. TGA results of MWCNT (red dash), PAAc-PVI(4:1) (green dot), and PAAc-PVI(4:1)@MWCNT (black line).
Chemosensors 13 00185 g004
Figure 5. Dispersion analysis via (a) zeta potential measurements and (b) visual comparison of dispersibility between bare MWCNTs and modified MWCNTs after centrifugation.
Chemosensors 13 00185 g005
Figure 6. EIS spectra in the frequency range of 1 to 104 Hz in 0.5 M KCl (pH = 7.4) containing 2.0 mM K3[Fe(CN)6]/K4[Fe(CN)6].
Chemosensors 13 00185 g006
Figure 7. DPV graphs of 10μM Serotonin at 1X PBS (pH 7.4) in SPCEs, MWCNT/SPCEs, PAAc-PVI(4:1)/SPCEs, and PAAc-PVI(4:1)@MWCNT/SPCEs.
Chemosensors 13 00185 g007
Figure 8. DPV of interfering agents in (a) SPCEs and (b) PAAc-PVI@MWCNT/SPCEs for 10 μM ascorbic acid, uric acid, dopamine, serotonin at 1X PBS (pH 7.4).
Chemosensors 13 00185 g008
Figure 9. (a) DPV of measuring serotonin at concentrations of 0, 0.103, 0.2, 0.38, 0.8, 1.2, 2.25, 3.24, 4.18, 5.08, 6.43, 7.7, 8.9, and 10.07 μM in PBS buffer (pH 7.4) (b) Calibration curve of serotonin concentration from 0.103 to 10.07 μM at −0.15 V.
Chemosensors 13 00185 g009
Figure 10. (a) DPV of measuring serotonin at concentrations of 0, 0.103, 0.2, 0.38, 0.8, 1.2, 2.25, 3.24, 4.18, 5.08, 6.43, 7.7, 8.9, and 10.07 μM in serum sample (b) Calibration curve of serotonin concentration from 1.2 to 10.07 μM at −0.15 V.
Chemosensors 13 00185 g010
Table 1. Ratio of the G Band and D Band with MWCNT and PAAc-PVI@MWCNT.
Intensity of
D Band
(1350 cm−1)
Intensity of
G Band
(1583 cm−1)
Ratio (ID/IG)
MWCNT23,264.923,301.470.998
PAAc-PVI@MWCNT25,288.627,052.20.965
Table 2. RSD% of different concentration of serotonin at 1X PBS (pH 7.4).
RSD% (n = 4)
0 μM1.20%3.24 μM4.12%
0.103 μM0.23%4.18 μM3.79%
0.2 μM3.59%5.08 μM3.95%
0.38 μM1.79%6.43 μM3.43%
0.8 μM4.63%7.7 μM1.42%
1.2 μM2.91%8.9 μM1.39%
2.25 μM3.83%10.07 μM2.88%
LODLOQ
0.015 μM0.05 ± 0.025 μM
Table 3. RSD% of different concentration of serotonin at human serum.
RSD% (n = 4)
0 μM2.71%3.24 μM3.87%
0.103 μM4.46%4.18 μM4.29%
0.2 μM3.70%5.08 μM4.81%
0.38 μM4.01%6.43 μM4.17%
0.8 μM4.63%7.7 μM3.82%
1.2 μM2.97%8.9 μM4.17%
2.25 μM1.73%10.07 μM3.08%
LODLOQ
0.077 μM0.26 ± 0.059 μM
Disclaimer/Publisher’s Note: The statements, opinions and data contained in all publications are solely those of the individual author(s) and contributor(s) and not of MDPI and/or the editor(s). MDPI and/or the editor(s) disclaim responsibility for any injury to people or property resulting from any ideas, methods, instructions or products referred to in the content.

