Article

A Minimal Electronic Nose Based on Graphene Functionalized with Metalated Pyrazinoporphyrazines and Phthalocyanines for Ammonia, Benzene, and Hydrogen Sulfide Discrimination

1
Surface Science and Spectroscopy Lab at I-Lamp, Department of Mathematics and Physics, Università Cattolica del Sacro Cuore, Via della Garzetta 48, 25133 Brescia, Italy
2
Institute of Photonics and Nanotechnologies-Consiglio Nazionale delle Ricerche (IFN-CNR), LNESS Laboratory, Via Anzani 42, 22100 Como, Italy
3
Dipartimento di Scienza dei Materiali, Università degli Studi di Milano—Bicocca, Via R. Cozzi 55, 20125 Milano, Italy
4
Dipartimento di Scienza e Alta Tecnologia, Università degli Studi dell’Insubria, Via Valleggio 9, 22100 Como, Italy
*
Author to whom correspondence should be addressed.
Chemosensors 2025, 13(5), 165; https://doi.org/10.3390/chemosensors13050165
Submission received: 31 March 2025 / Revised: 24 April 2025 / Accepted: 2 May 2025 / Published: 5 May 2025
(This article belongs to the Special Issue Advanced Chemical Sensors for Gas Detection)

Abstract

:
The development of electronic noses is, nowadays, essential for several applications, including breath analysis and industrial security. Ammonia, benzene, and hydrogen sulfide are particularly important due to their environmental and health impacts. Here, graphene-based sensors, functionalized with unconventional in-house synthesized zinc and copper octyl-pyrazinoporphyrazines and commercially available zinc phthalocyanine, have been prepared. Enhanced solubility given by the octyl chains allowed us to exploit drop-casting as a straightforward functionalization technique. The sensors demonstrated excellent performance for detecting ammonia, benzene, and hydrogen sulfide as a single sensor, with a competitive detection limit and a high sensitivity compared to the state of the art. In particular, functionalization enabled the detection of hydrogen sulfide, for which no response is observed with bare graphene, and lowered the detection limit for all the gases compared to bare graphene. Additionally, the prepared sensors have been assembled into an e-nose that shows promising potentiality to be used for both industrial and medical applications thanks to its excellent discrimination capability of single gases and mixtures.

1. Introduction

The development of advanced gas sensing technologies has become essential for many applications, including healthcare and medicine [1,2,3], environmental monitoring [3,4], food and beverage quality tracking [5,6], and security in industries [7,8]. As a consequence, researchers have been driven by market demands to develop sensors and arrays that should be highly sensitive, cost-effective, reliable, and stable, for the detection and discrimination of several volatile organic compounds (VOCs) and toxic gases.
Among these VOCs, ammonia (NH3), benzene (C6H6), and hydrogen sulfide (H2S) could represent critical targets due to their significant environmental and health impacts. These three gases need to be monitored mainly in different industrial contexts: from petroleum refining, coal gasification, and syngas production to biomass pyrolysis and natural gas processing [9,10,11].
C6H6 is known to be a carcinogen and to cause headaches, dizziness, and confusion [12,13]; inhalation of H2S can cause nausea, pulmonary edema, and seizures [14,15], while NH3 can provoke damage to the respiratory system, from irritation of respiratory tracks to asphyxiation, and to the neural system, from dizziness and confusion up to loss of consciousness [16,17].
The occupational exposure limit for an 8 h average is set at 1 ppm for benzene, 10 ppm for hydrogen sulfide, and 25 ppm for ammonia in the USA [18], while in Europe the recommended limits are even lower: 0.2 ppm, 5 ppm, and 20 ppm, respectively [19], and individual European Union member states may implement more stringent national limits based on their regulation.
NH3, C6H6, and H2S monitoring is also important in breath analysis, with them being biomarkers of liver and kidney failure as well as chronic obstructive pulmonary disease [20,21], lung cancer [22], and asthma [23]. The concentration of these gases in the exhaled breath is usually in the sub-ppm or ppm range [20,24]. It is, therefore, clear how for ensuring workers’ safety as well as for breath analysis application the developed sensors should be able to detect very low analytes concentration, and, additionally, the effective detection of these gases should be achieved even in complex mixtures. In this context, the use of an electronic nose (e-nose), i.e., an array that comprises several sensors, presents a significant advantage over the use of a single sensor. Indeed, exploiting an array of sensors with different sensitivities and selectivities, coupled with advanced pattern recognition algorithms, can allow the discrimination of single analytes as well as effectively analyze complex gas mixtures. This capability is crucial for addressing the challenges posed by the simultaneous presence of ammonia, benzene, and hydrogen sulfide in workplace environments or diagnostic applications.
Currently, the most exploited materials to develop e-noses are metal oxide semiconductors (MOx) [25], but, besides the advantages, such as fast response and recovery times, portability, and low detection limit, they still present some drawbacks like poor selectivity, performance drift, and high operating temperature.
On the contrary, graphene presents high sensitivity to the surface adsorption of gas molecules, and thanks to its outstanding electrical properties, including high in-plane conductivity, low electrical intrinsic noise, and excellent stability at room temperature [26], it can be considered a valid alternative to MOx for the development of sensors and e-noses. Indeed, more recently, graphene has started to be exploited for the development of e-noses in chemiresistive [27,28] or field effect transistor [29,30] configurations.
The functionalization of graphene with specific chemical compounds can further tailor its sensitivity and selectivity, enabling the precise detection of diverse analytes [31,32]. Graphene could be functionalized in several ways, including both covalent and non-covalent methods [33], and different materials could be selected for the functionalization: from single atoms (mostly boron or nitrogen) [34] to nanoparticles [35] or organic molecules [36].
Here, commercially available zinc phthalocyanine (ZnPc) and zinc and copper dibenzoazepinopyrazinoporphyrazines (ZnPR and CuPR) functionalized at azepine nitrogen with octyl chains to increase solubility (Figure 1) are exploited for the functionalization of graphene via drop-casting. These types of molecules are extensive planar π-conjugated systems, and thus it is expected that a face-on stacking with graphene is mainly driven by non-covalent π-π interactions, which should favor a charge transfer during gas exposures [37,38].
Very few works explore the sensing mechanism of graphene-based systems coupled with phthalocyanine beyond the mere sensor response observation. These studies mainly focus on graphene derivatives, such as reduced graphene oxide (rGO) or graphene oxide (GO) [39,40,41]. For instance, Guo et al. [39] report the sensing mechanism for ammonia interaction with p-type rGO-CoPc sample. The sensing mechanism of this hybrid system has been considered by starting from the initial situation of phthalocyanine in air, which interacts with oxygen, creating a M-Pc+-O2 complex. Ammonia can then interact with the adsorbed oxygen of the system, releasing electrons that in turn can move from the CoPc compounds to the rGO layer, since the electron transfer energy barrier between CoPc and rGO is low. Finally, the holes in the p-type rGO are recombined with the electrons from ammonia, leading to a decrease in conductivity. Although displaying remarkable sensing performances, rGO and GO present drawbacks in terms of sample reproducibility and recovery after exposures, and in this perspective, Gr represents a more reliable layer. Nevertheless, the functionalization of pristine graphene layers with Pc has not been largely investigated.
In particular, the e-nose here presented is composed of four graphene-based sensors: one graphene monolayer (Gr_bare), a graphene layer functionalized with zinc phthalocyanine (Gr_ZnPc), and two Gr layers functionalized with zinc and copper pyrazinoporphyrazines (Gr_ZnPR and Gr_CuPR). The synthesized octyl-pyrazinoporphyrazines display a higher solubility compared to commercially available phthalocyanine, allowing for a simple and cost-effective functionalization via drop-casting.
The sensors are tested towards NH3, C6H6, and H2S, drawing the calibration curves and investigating sensing parameters such as detection limit, sensitivity, selectivity, response, and recovery time. Following this first phase, the developed e-nose is tested to probe the capability of simultaneously discriminating NH3, C6H6, and H2S and their mixtures with high precision. It is worth mentioning that despite their relevance for environmental, safety, and medical applications, these gases are not commonly tested together, therefore, this work represents a first. By leveraging material engineering and functionalization strategies, we aim, on one hand, to enhance the sensitivity, selectivity, and stability of the sensors in a chemiresistor configuration, and on the other, to enhance the discrimination capability of the array towards the tested gases and their mixtures. Finally, the chemiresistive configuration of the e-nose developed allows for a rapid and simple prototype [2,42,43,44], avoiding complex electronics typical of other configurations.
This work represents a significant step forward in gas-sensing technology, offering a promising approach for real-world applications.

2. Materials and Methods

2.1. Synthesis of ZnPR and CuPR

The procedures for the synthesis of ZnPR and CuPR are reported in the Supplementary Materials.

2.2. Sample Preparation

A total of 4 graphene monolayers on 10 × 10 mm2 Si3N4/Si substrates (Graphenea, Gipuzkoa, Spain) were used to prepare the array. One of the samples was used as received (Gr_bare) and three samples were functionalized. Two layers were functionalized via drop-casting exploiting the synthesized ZnPR and CuPR, while a layer with ZnPc (Sigma Aldrich, Merck, Milano, Italy). An additional solution was prepared with CuPc, but the molecules were not properly dissolving; therefore, we did not proceed with the drop-casting on graphene. In detail, the porphyrazines and phthalocyanine powders were dissolved in EtOH at a concentration of 0.1 mM and sonicated for 30 min, before 15 droplets of the solution were drop-casted on the graphene layer. After each drop, the samples were left drying in the air; upon solvent evaporation, a new drop was added. The choice of the solvent and concentration was made on the basis of ref. [45] for the ZnPc; consequently, ZnPR and CuPR were dissolved in the same condition.
The array was then composed of Gr_bare, Gr_ZnPc, Gr_ZnPR, and Gr_CuPR.

2.3. Characterization

To characterize the samples, Raman spectroscopy (Ranishaw, Pianezza, Italy) and atomic force microscopy (AFM) (Park, Hamburg, Germany) were exploited.
Raman spectroscopy was performed with a Ranishaw micro Raman, equipped with a 633 nm laser source. A 100× objective, 1800 line/mm grating, and 5 mW laser power were used to perform the measurements.
AFM images were acquired with a Park NX 10 system in tapping mode in air–solid interface with a tip working at 300 kHz. The Gwyddion software (version: 2.54) was used to process the images.

2.4. Gas Sensing Measurements

Electrical contacts were made on the 4 samples, drawing two 8 mm × 1 mm strips of silver paint at the opposite side of each layer. Then, the prepared layers were mounted on a homemade designed platform, able to collect simultaneously the signal in a chemiresistor configuration from all the samples. This platform ensured that the sensors worked in the same environmental condition and allowed for a proper comparison of the results. Two commercial sensors were mounted on the platform: a relative humidity (RH) sensor (humidity sensor HIH-4000 series—Honeywell Sensing; Charlotte, NC, USA) and a temperature sensor (Thermistor NTC PCB 5K—Murata; Kyoto, Japan). Figure 2a shows a schematic representation of the sensor array.
Gas exposure was performed at room temperature, with humidity values ranging from 10% to 60%, in a sealed chamber with a volume of 0.5 L, by introducing a mixture of synthetic air with a selected concentration of the gas molecule under investigation. Cylinders of ammonia, benzene, hydrogen sulfide, and synthetic air were used to feed the chamber through mass-flow controllers (MFCs). All the cylinders were certified by S.I.A.D. Spa (Bergamo, Italy), and loaded with 47 ppm, 1 ppm, and 10 ppm for ammonia, benzene, and hydrogen sulfide, respectively. An additional cylinder loaded with synthetic air alone was used to dilute the overall concentration of the analytes in the chamber, as well as to purge the chamber before and after each exposure. Gas from all the cylinders was premixed before entering the chamber.
All the sensors on the platform worked in a chemiresistor configuration and the electronic circuit that drives each sensor was composed of the sensor, a load resistance in series with the sensors, and an applied voltage of 5 V. The signal, i.e., the resistance value, was collected across the two silver electrodes (Figure 2b). The sensor response towards the gases is defined as ΔR/R0, where ΔR = R − R0, and R0 is the baseline resistance, collected before the gas exposure.
Calibration curves were drawn plotting the sensor responses vs. concentrations for all the tested analytes. Response and recovery times were evaluated considering the time required to reach 80% of response or recovery, respectively.

2.5. Statistical Analysis

The sensor responses collected from the array were used to perform a multivariate statistical analysis, i.e., principal component analysis (PCA), implemented into the R software (1.2.5001 version). PCA is an unsupervised statistical technique aimed to reduce the dimensionality of a problem while maximizing its variance.
The aim is achieved by redistributing the total response across a series of orthogonal principal components (PCs), where PC1 captures the highest variance, PC2 captures the second highest, and so forth. The output of this analysis is a 2D or 3D graph, where a clear discrimination of the analytes is observed.
In this work, the sensor responses used to perform PCA were pre-treated only with the column mean-centering. A set of 51 exposures to the 3 analytes and their mixtures was considered for the analysis.

3. Results and Discussion

In the past, some of us reported the synthesis of this novel centrosymmetric porphyrazine system (Figure 1), arising from the formal substitution of four benzo subunits in a Pc by a 9H-dibenzo[b,f]pyrazino[2,3-d]azepine moiety, wherein the peripheral azepine nitrogen atoms were functionalized with hexadecanoyl chains to successfully address the scarce solubility in organic solvents typical of these systems [46]. However, the presence of the carbonyl in such chains that come out of the plane of the molecule could very likely interfere with the π-π interaction with graphene. Consequently, we opted for the N-functionalization with a linear octyl chain following the same synthetic pathway. Despite being the alkylation step challenging, we successfully prepared enough quantity of ZnPR and CuPR for this study (see Supplementary Materials for details).
Ethanolic solutions of ZnPc, ZnPR, and CuPR were easily prepared and used to functionalize the graphene monolayers supported on silicon nitride via the drop-casting method. To have a direct comparison of the new ZnPR and CuPR with commercially available metallo-phtalocyanines, we aimed to prepare an ethanolic solution of CuPc; however, the EtOH solubility of CuPc was very bad as expected [45], as well as in the other solvents, making it impossible to use with our drop-casting method. Conversely, CuPR, despite being more extensive than CuPc, was easily dissolved in EtOH thanks to the peripheral octyl chains.
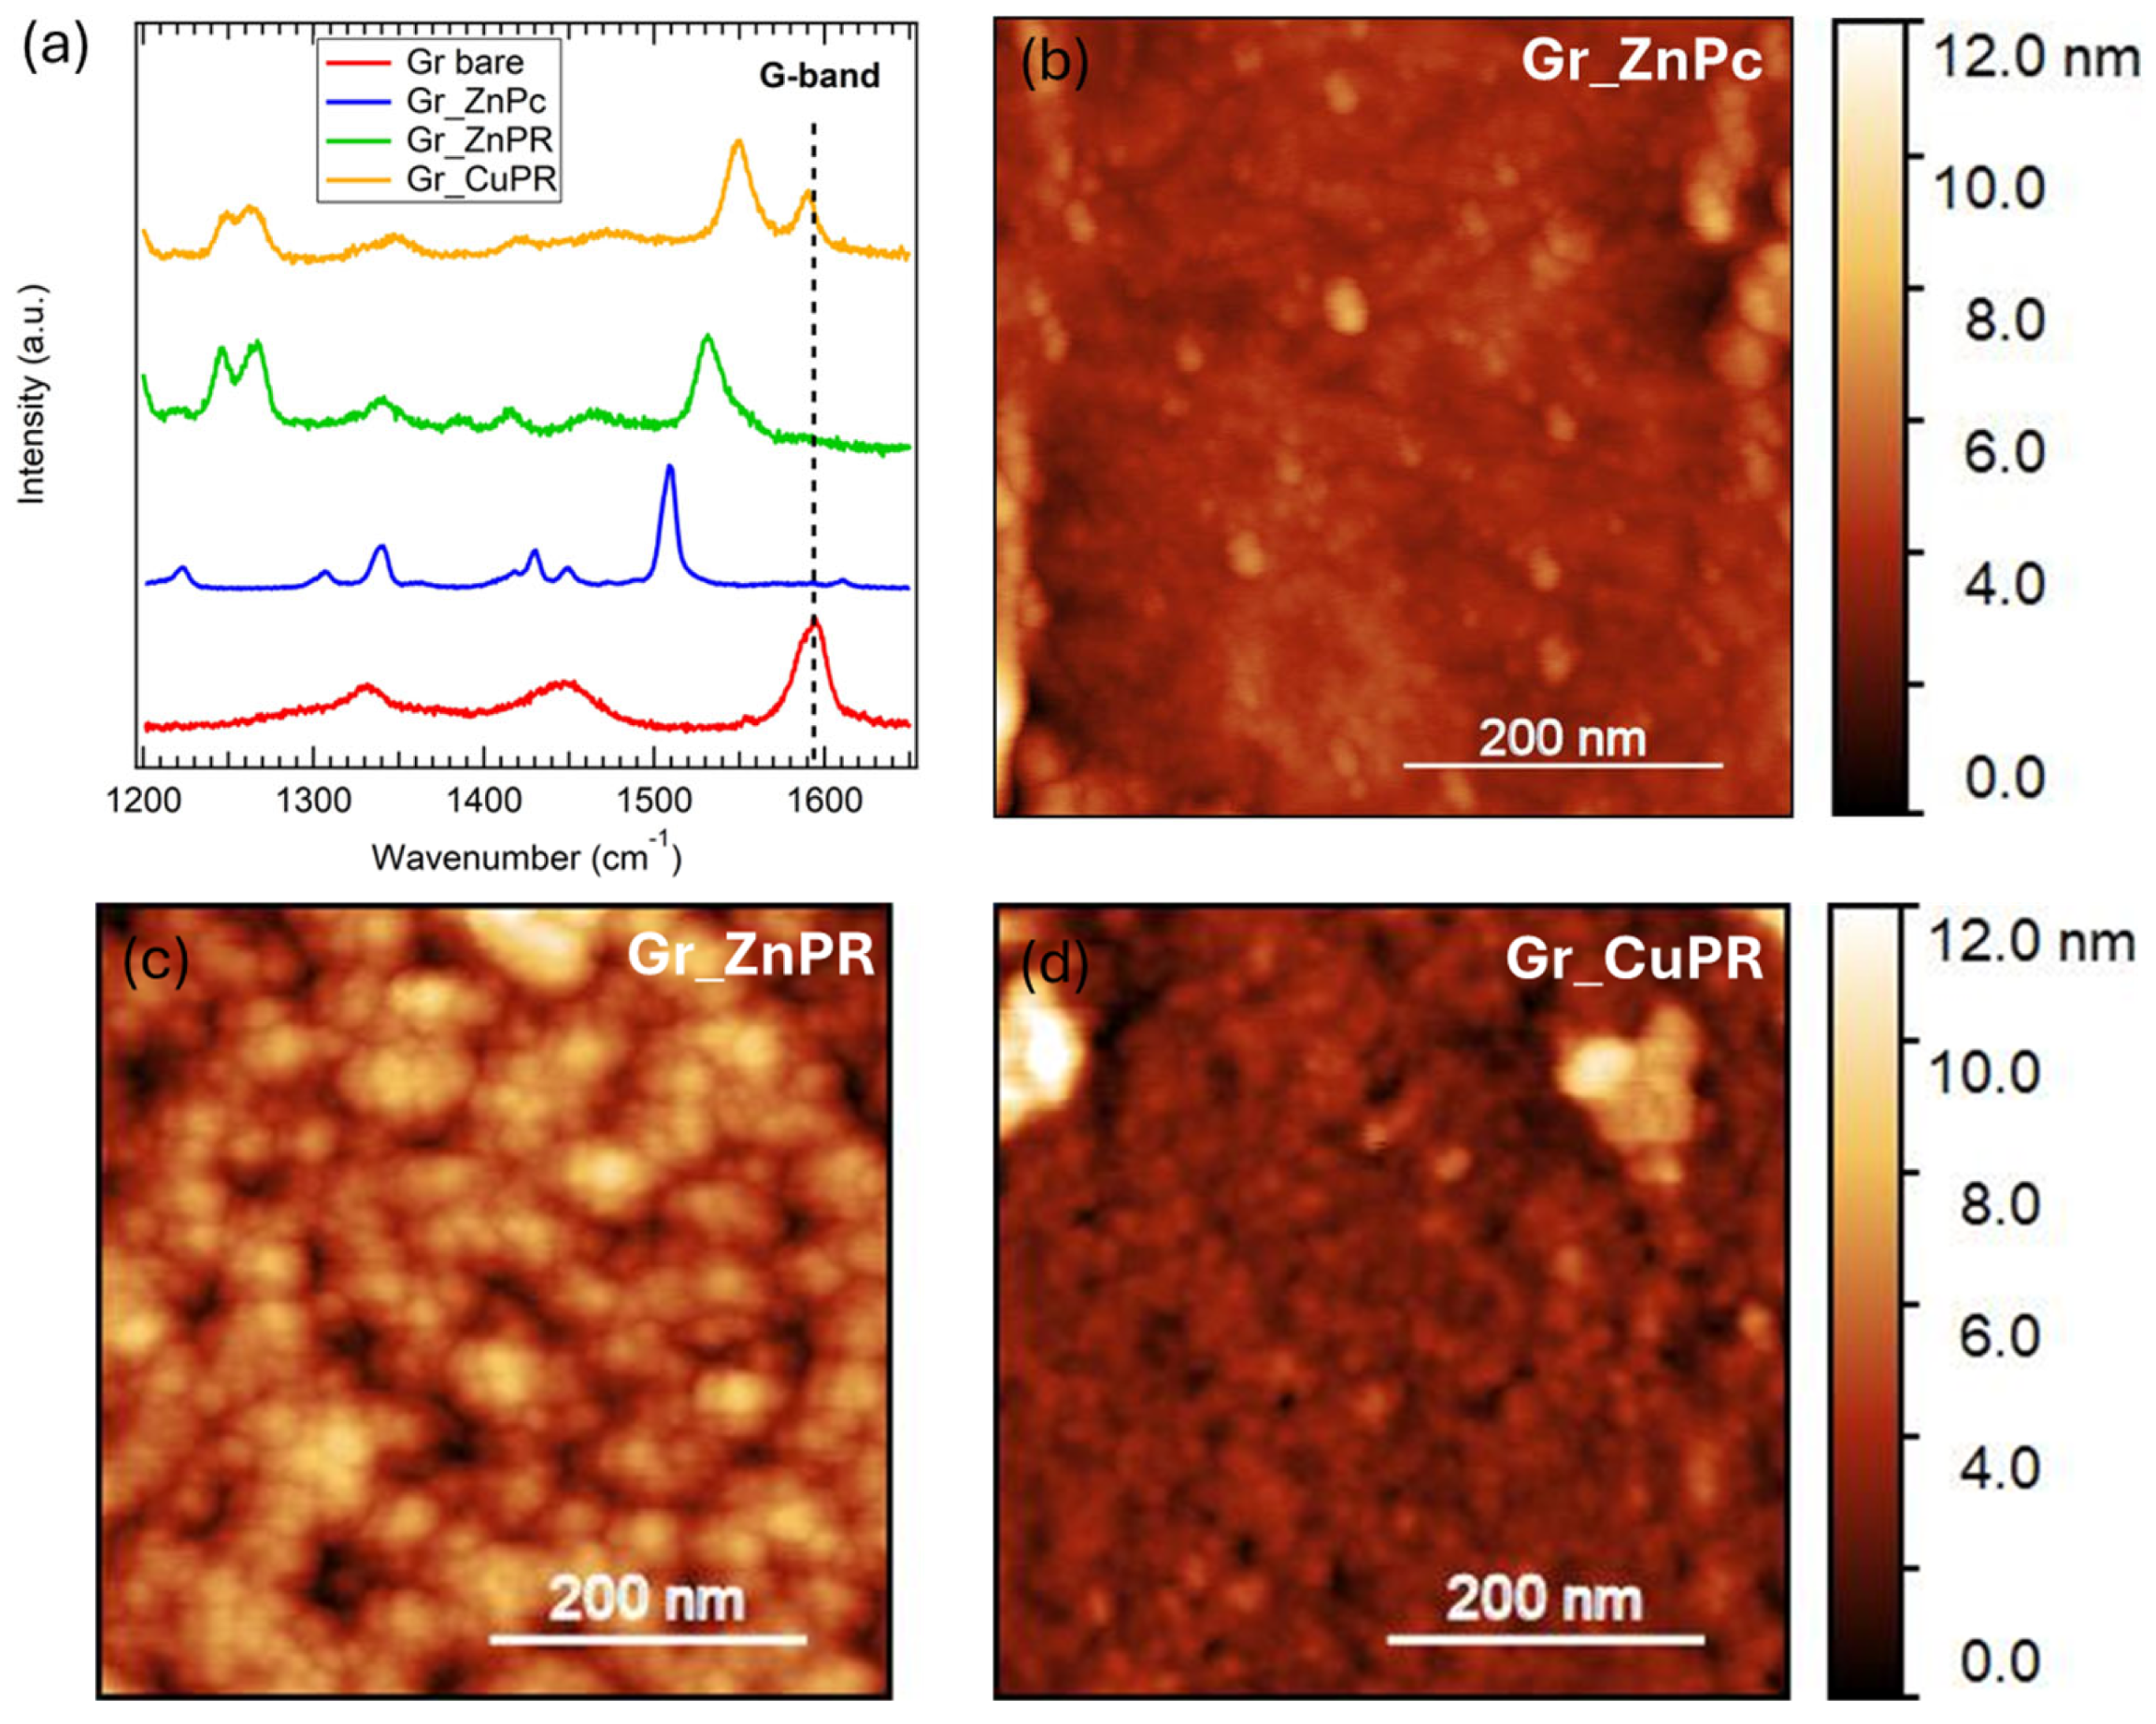
Characteristic Raman spectra collected on the samples are reported in Figure 3a. All the spectra were collected in a 1200–1700 cm−1 range since the Gr_ZnPc and Gr_ZnPR samples showed a strong luminescence at higher wavenumber [47], which made it difficult to recognize peaks related to graphene or to the organic molecules.
The bare sample (red curve) shows the G-band signal around 1585 cm−1, ascribed to the in-plain stretching of sp2 carbon-carbon atoms [48]. A band around 1335 cm−1 is also present; to properly assign it, we need to consider two contributions at this wavenumber: the silicon nitride substrate band [27] and the graphene D-band. The D-band is related to the presence of defects, and, in a low defective graphene monolayer, it is expected to have very low intensity. Therefore, we hypothesize that the silicon nitride broad band dominates the area around 1335 cm−1 in the Gr_bare spectrum.
Considering the spectra collected on the functionalized samples, the graphene G-band is strongly present in the Gr_CuPR sample (yellow curve), while it is slightly detected in the ZnPc and ZnPR layers. This is an indication that although the coating procedure was the same, the resulting CuPR layer is thinner than the ZnPR and ZnPc layers.
Finally, the Raman peaks related to the ZnPc can be found at 1223 cm−1, 1305 cm−1, 1340 cm−1, 1430 cm−1, and 1450 cm−1 [47], whereas the peaks related to PRs are located at 1245 cm−1, 1265 cm−1, 1341 cm−1, and 1413 cm−1 [49,50] and the characteristic peak related to the metal center in the porphyrazines at 1550 cm−1 for CuPR [51,52] and at 1530 cm−1 for ZnPR [53].
Morphology was investigated through AFM, and the representative images of 500 nm × 500 nm size of the functionalized surfaces are reported in Figure 3b–d. A quite uniform distribution of the Pc and PR molecules was detected in all three cases.
After the characterization, exposures to ammonia, benzene, and hydrogen sulfide were performed.
As a consequence of functionalization, the baseline resistance of the pristine graphene layer lowered (Table S1), indicating that an effective charge transfer occurs between the Gr layer and the ZnPc, ZnPR, and CuPR layers.
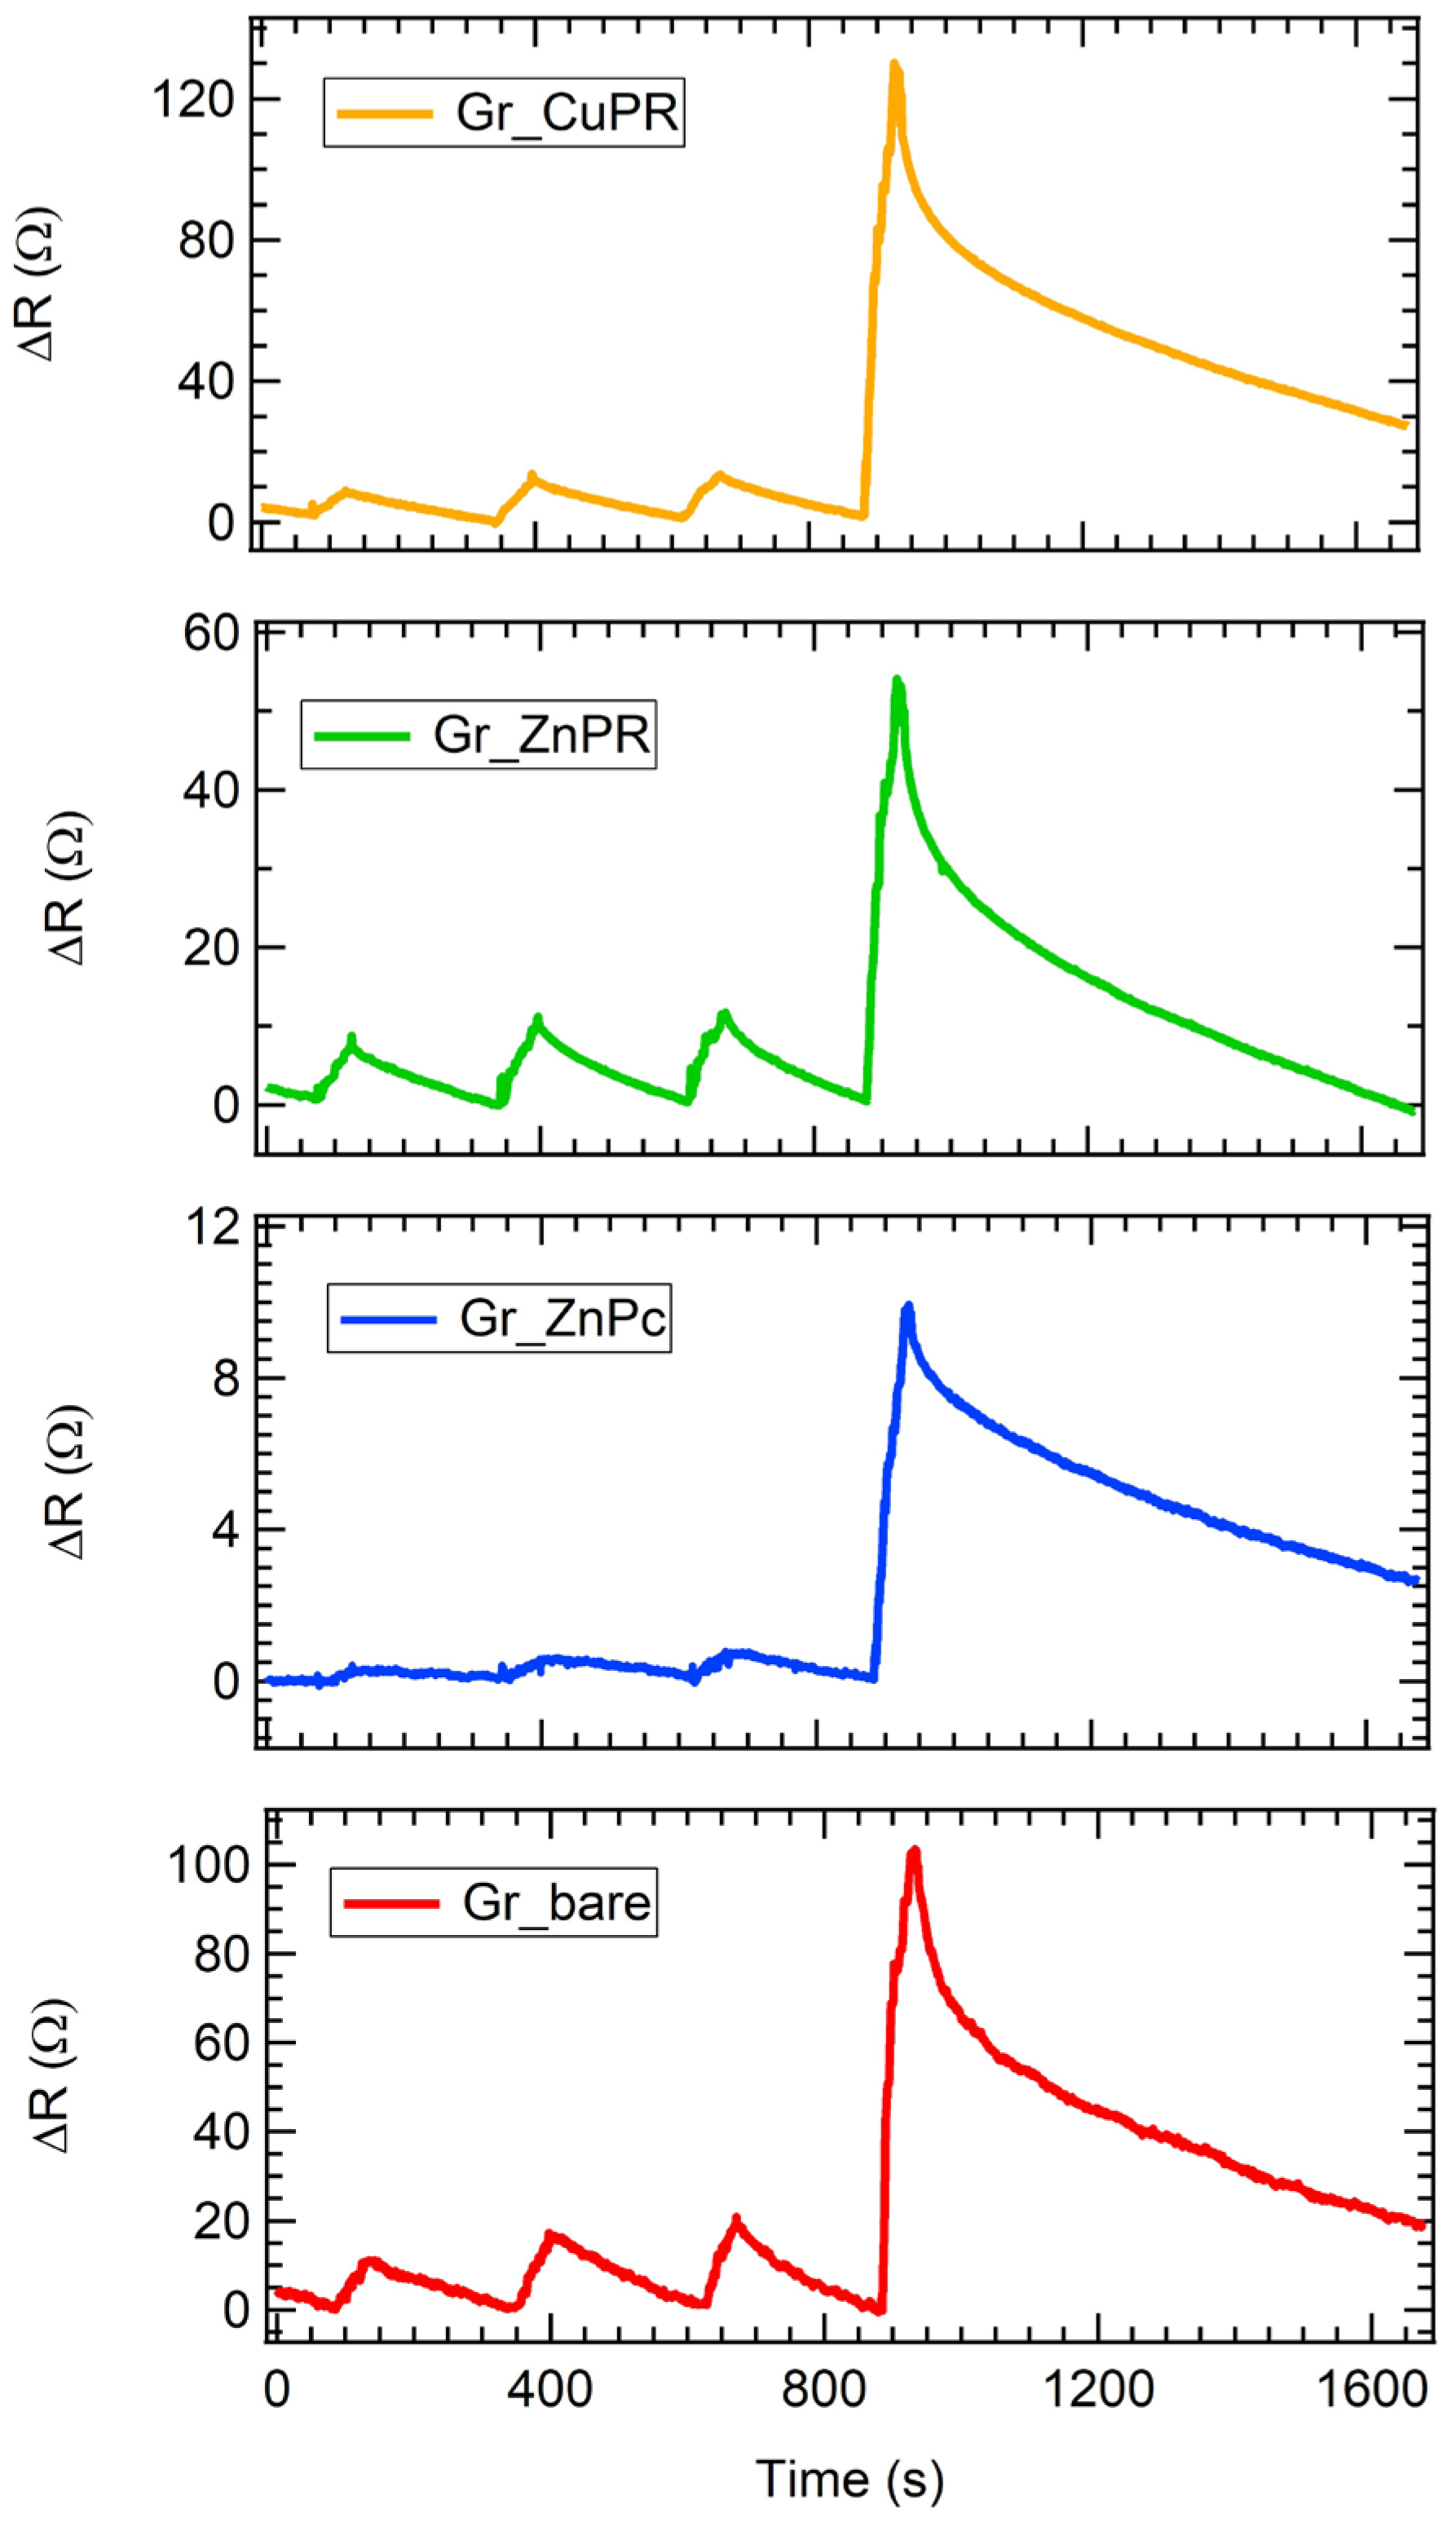
As an example of dynamical responses, exposures to four different ammonia concentrations are presented in Figure 4. Firstly, all the sensors increased their resistance, denoting a p-type response, in agreement with what is expected from graphene layers. A quick response of about 30 s is observed, as well as a recovery time between about 90 s in the case of low analyte concentrations and 700 s for high ones. For the highest concentration tested, the fastest recovery is achieved for Gr_ZnPc, which shows a 100% recovery in a time where the other sensors recover 80%. These results are in line with, or even better than those reported in the literature [44,54,55,56,57].
Similar dynamic curves were obtained for exposures to benzene and hydrogen sulfide and were used to draw the calibration curves (i.e., response vs. concentration) for all the sensors (Figure 5). Response and recovery time were found in line with the ones obtained for ammonia exposures, ranging from 30 s for response up to about 700 s for the recovery in the case of the highest tested concentrations. All the sensors responded to the three analytes, except for Gr_bare exposed to hydrogen sulfide, for which a response was not detected. All the curves can be fitted with a Freundlich isotherm, as usually occurs for nanostructured carbon-based sensors [36,58].
Considering ammonia, the best-performing sensors were Gr_bare and Gr_CuPR, while in the case of benzene and hydrogen sulfide, Gr_ZnPc was clearly outperforming the others.
As regards the sensing mechanisms, ammonia has been investigated more in the literature compared to hydrogen sulfide and benzene; therefore, it is easier to rationalize the behavior of the developed sensors towards this gas.
As already mentioned, all the sensors increased the resistance upon ammonia exposure, indicating an overall p-type nature. In the case of Gr_bare, this is consistent with an electron injection from ammonia that reduces the density of holes, which are the majority carrier in graphene [59].
A recent work by Perilli et al. [60] investigated the sensing mechanism of a NiPc-graphene sensor towards ammonia, theoretically suggesting that the Ni orbital plays a key role in mediating the charge transfer between ammonia molecules and the Gr layer through a hybridization mechanism involving the frontier molecular orbitals of the analyte. CuPR, ZnPc, and ZnPR are, therefore, supposed to act as mediators in the charge transfer between ammonia and graphene [38].
Poliakov et al. [61] reported on the functionalization of reduced graphene oxide (rGO) with ZnPc and observed a lower response towards ammonia for the rGO-ZnPc sensor compared to the pristine rGO, ascribing it to a reduction in the defect sites due to functionalization, which act as active sites for the chemisorption of ammonia through hydrogen bonding. Moreover, they concluded that the higher the ZnPc coverage, the lower the response. This is in agreement with the lower ammonia response for Gr_ZnPc compared to Gr_bare that we observed, and also with a better response of Gr_CuPR compared to Gr_ZnPc and Gr_ZnPR. Indeed, as suggested by the Raman measurements, the CuPR layer was thinner than the ZnPc and ZnPR, resulting in a lower coverage.
Regarding hydrogen sulfide and benzene, little evidence can be found in the literature for the sensing mechanism of the former, while no works disclose the interaction of the latter with graphene. Zhang et al. [62] theoretically demonstrated that no charge transfer occurs from H2S to pristine graphene layers; thus, functionalization is required. This is in agreement with the observed no response in the case of Gr_bare. We suggest that the porphyrazine layers act as charge transfer mediators and probably also as gas molecule concentrators; however, theoretical calculation will be required to properly hypothesize the sensing mechanism, going beyond the scope of the present work.
Detection limit, i.e., the lowest concentration that the sensors can detect, and sensitivity, defined as a percentage of sensor response normalized over the tested analytes concentrations, were evaluated and compared to the literature (Table 1). The benchmarking was performed considering only chemiresistive sensors based on graphene. In the case of ammonia, the works of the last 10 years have been considered, while for benzene and hydrogen sulfide, which are far less investigated, all the published works have been considered. It is worth mentioning that in the case of H2S, quite a few theoretical works on graphene-based H2S sensors can be found [52,53,54,55,56,57,58,59,60,61,62,63,64,65], but only a couple of works report experimental results.
In detail, the detection limit was evaluated through the formula 3[gas]/((R − R0)/σ) [36,79], where σ is the fluctuation of the electrical signal. The results for the functionalized Gr layers are among the best so far reported for all the analytes. Also, the sensitivity is among the best achieved so far, especially in the case of benzene. It is worth noting that not many works investigated the detection of benzene and hydrogen sulfide, and additionally, in the case of benzene, the present work clearly pushed down the detection range of the analyte, getting closer to a real application. The repeatability of the response towards the same analyte concentration is demonstrated, as shown in Supplementary Materials Figure S1.
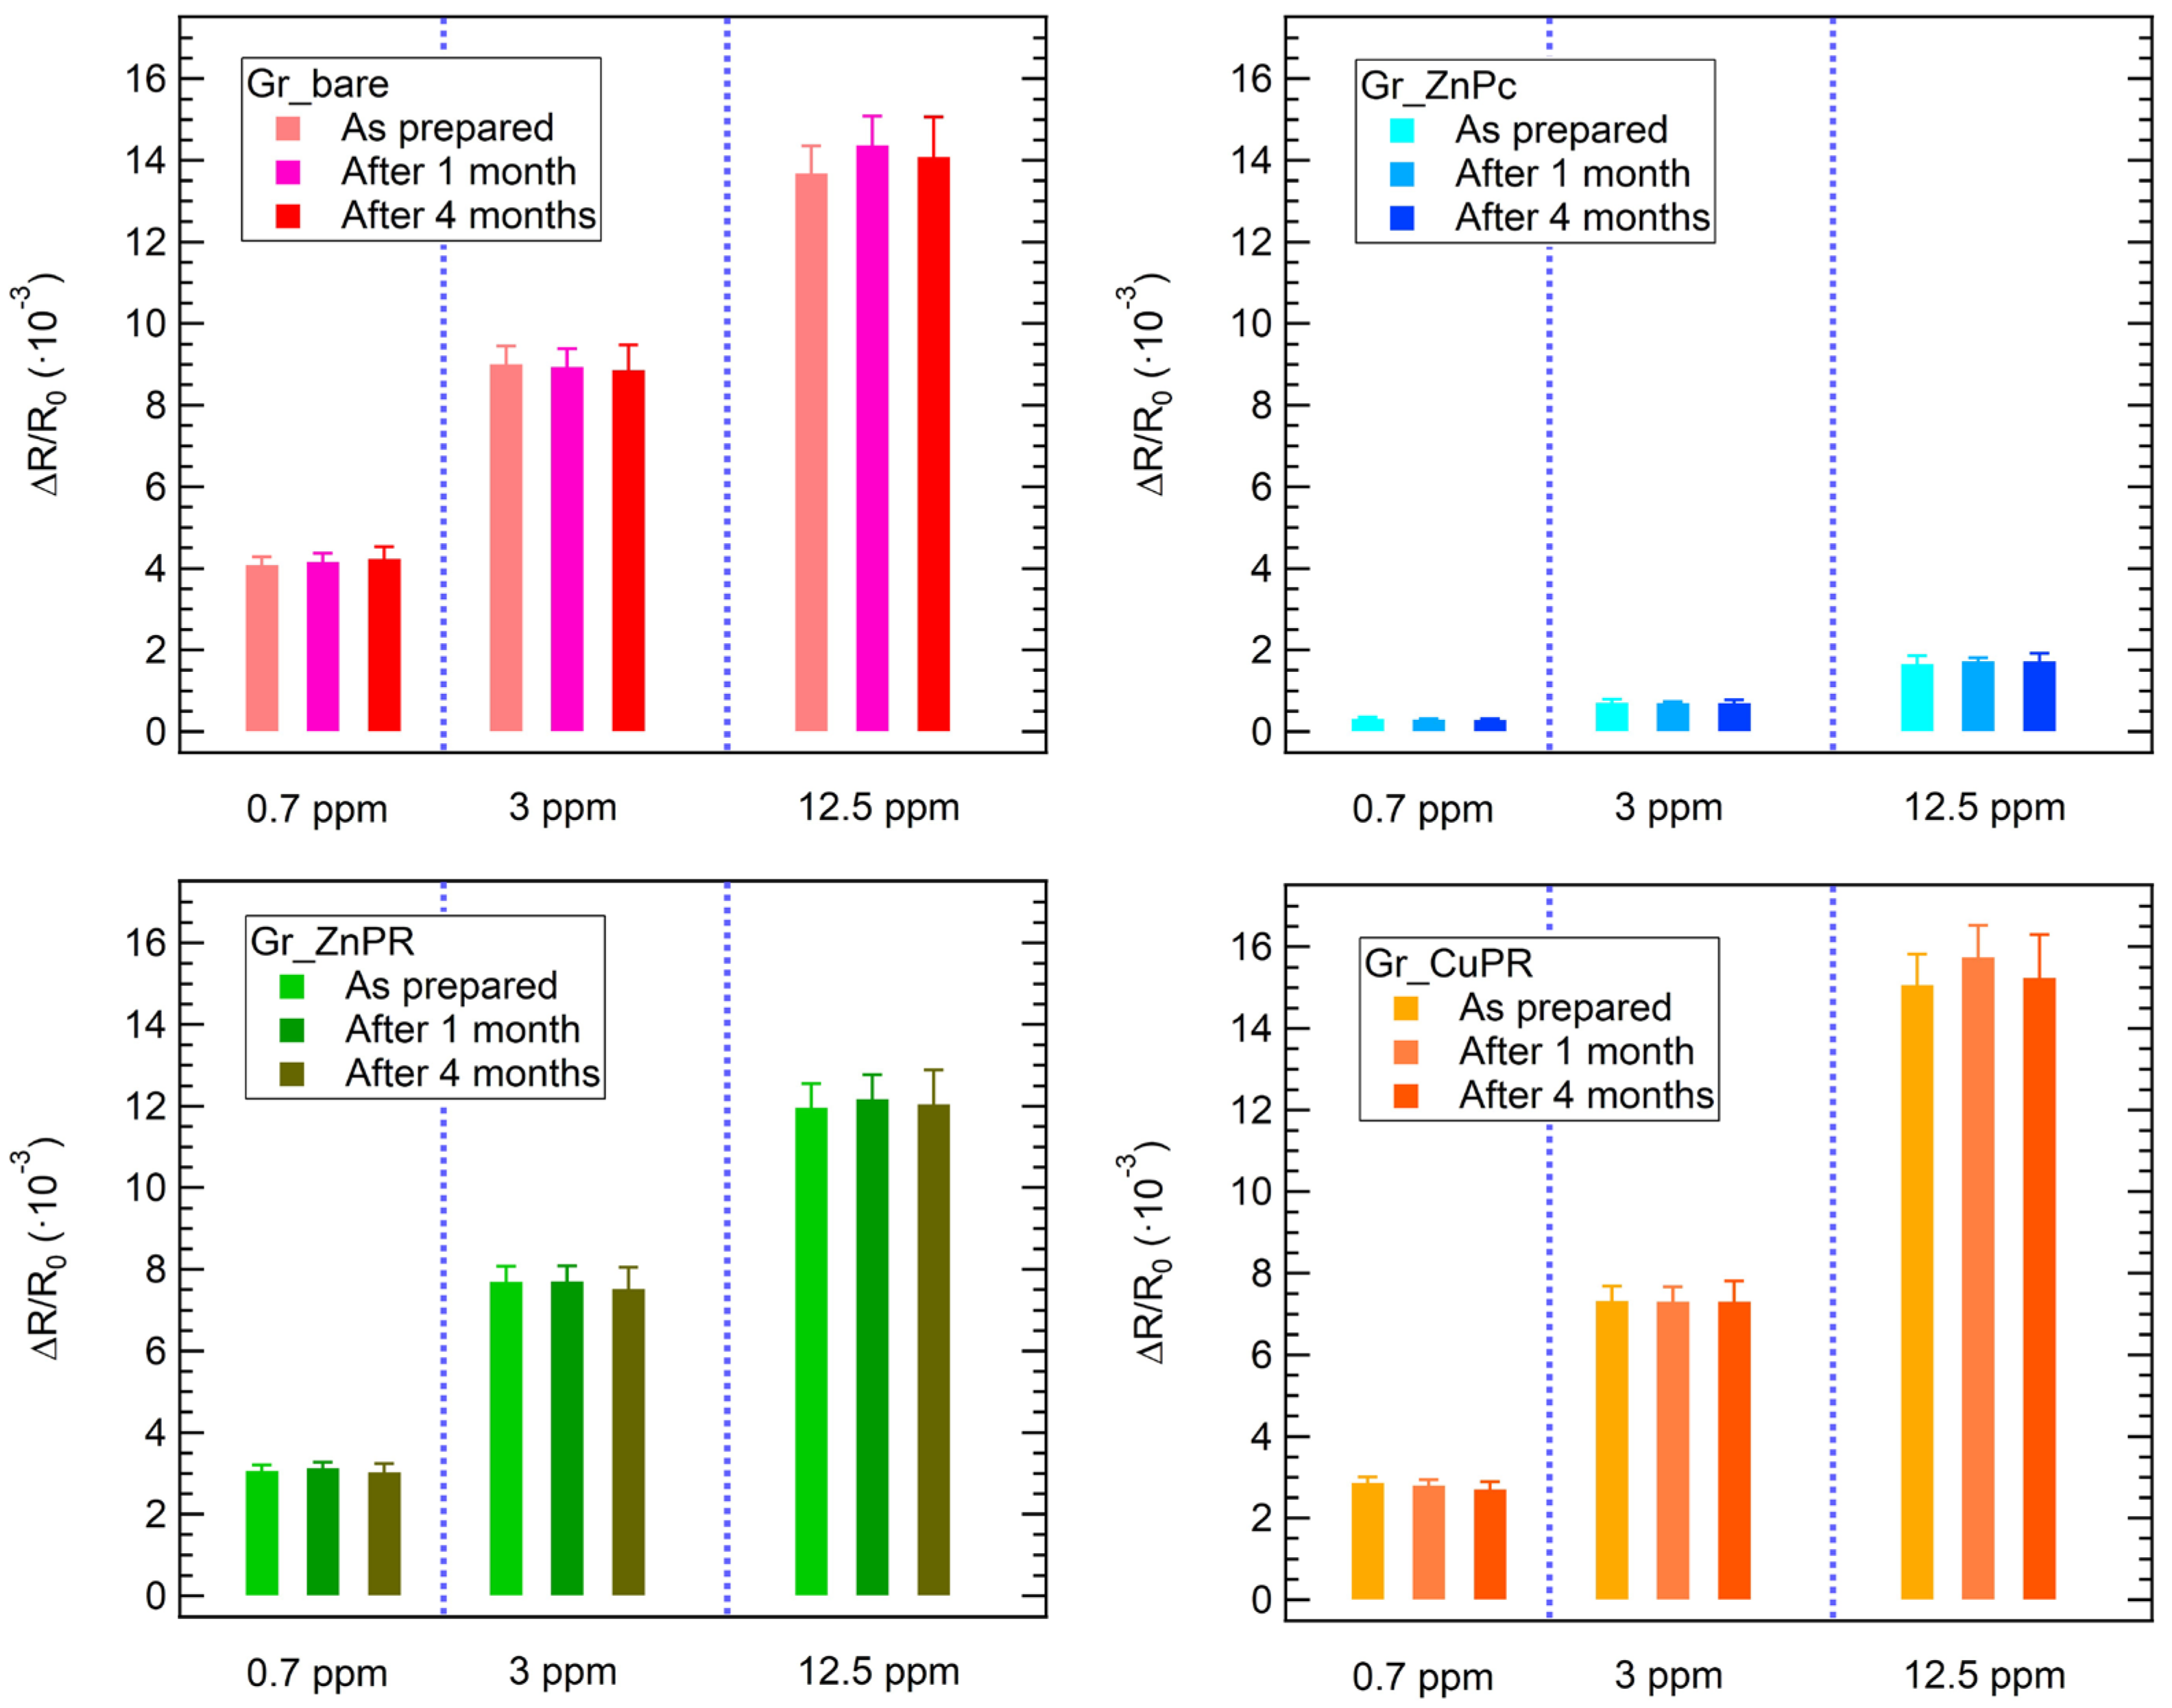
Finally, the stability and reproducibility of the sensor response have been proven for ammonia exposures. The results, reported in Figure 6, demonstrate that the response towards different ammonia concentrations is stable for up to 4 months from the sensor preparation.
When exposed to the same concentration of analytes (270 ppb), significant response variations are observed: in general, the highest responses were detected in the case of benzene exposure for all the sensors. Considering Figure 5 and Figure 7, while for ammonia all the sensors respond with a positive resistance variation, it is interesting to observe that for H2S a negative response was obtained for Gr_CuPR, while for benzene Gr_bare and Gr_CuPR showed a negative response. The developed sensors are clearly not selective and the variation in sensing responses to different analytes presents a significant starting point for data analysis and classification using machine learning algorithms. Indeed, an easy approach to overcome selectivity issues for gas sensors is to consider an electronic nose and proceed with statistical analysis to achieve discrimination among the tested analytes. In this regard, to build a matrix to feed the PCA algorithm, sensor responses towards ammonia, benzene, and hydrogen sulfide, as reported in the calibration curves, were used. Additionally, exposures to mixtures were performed: ammonia + hydrogen sulfide, ammonia + benzene, and benzene + hydrogen sulfide.
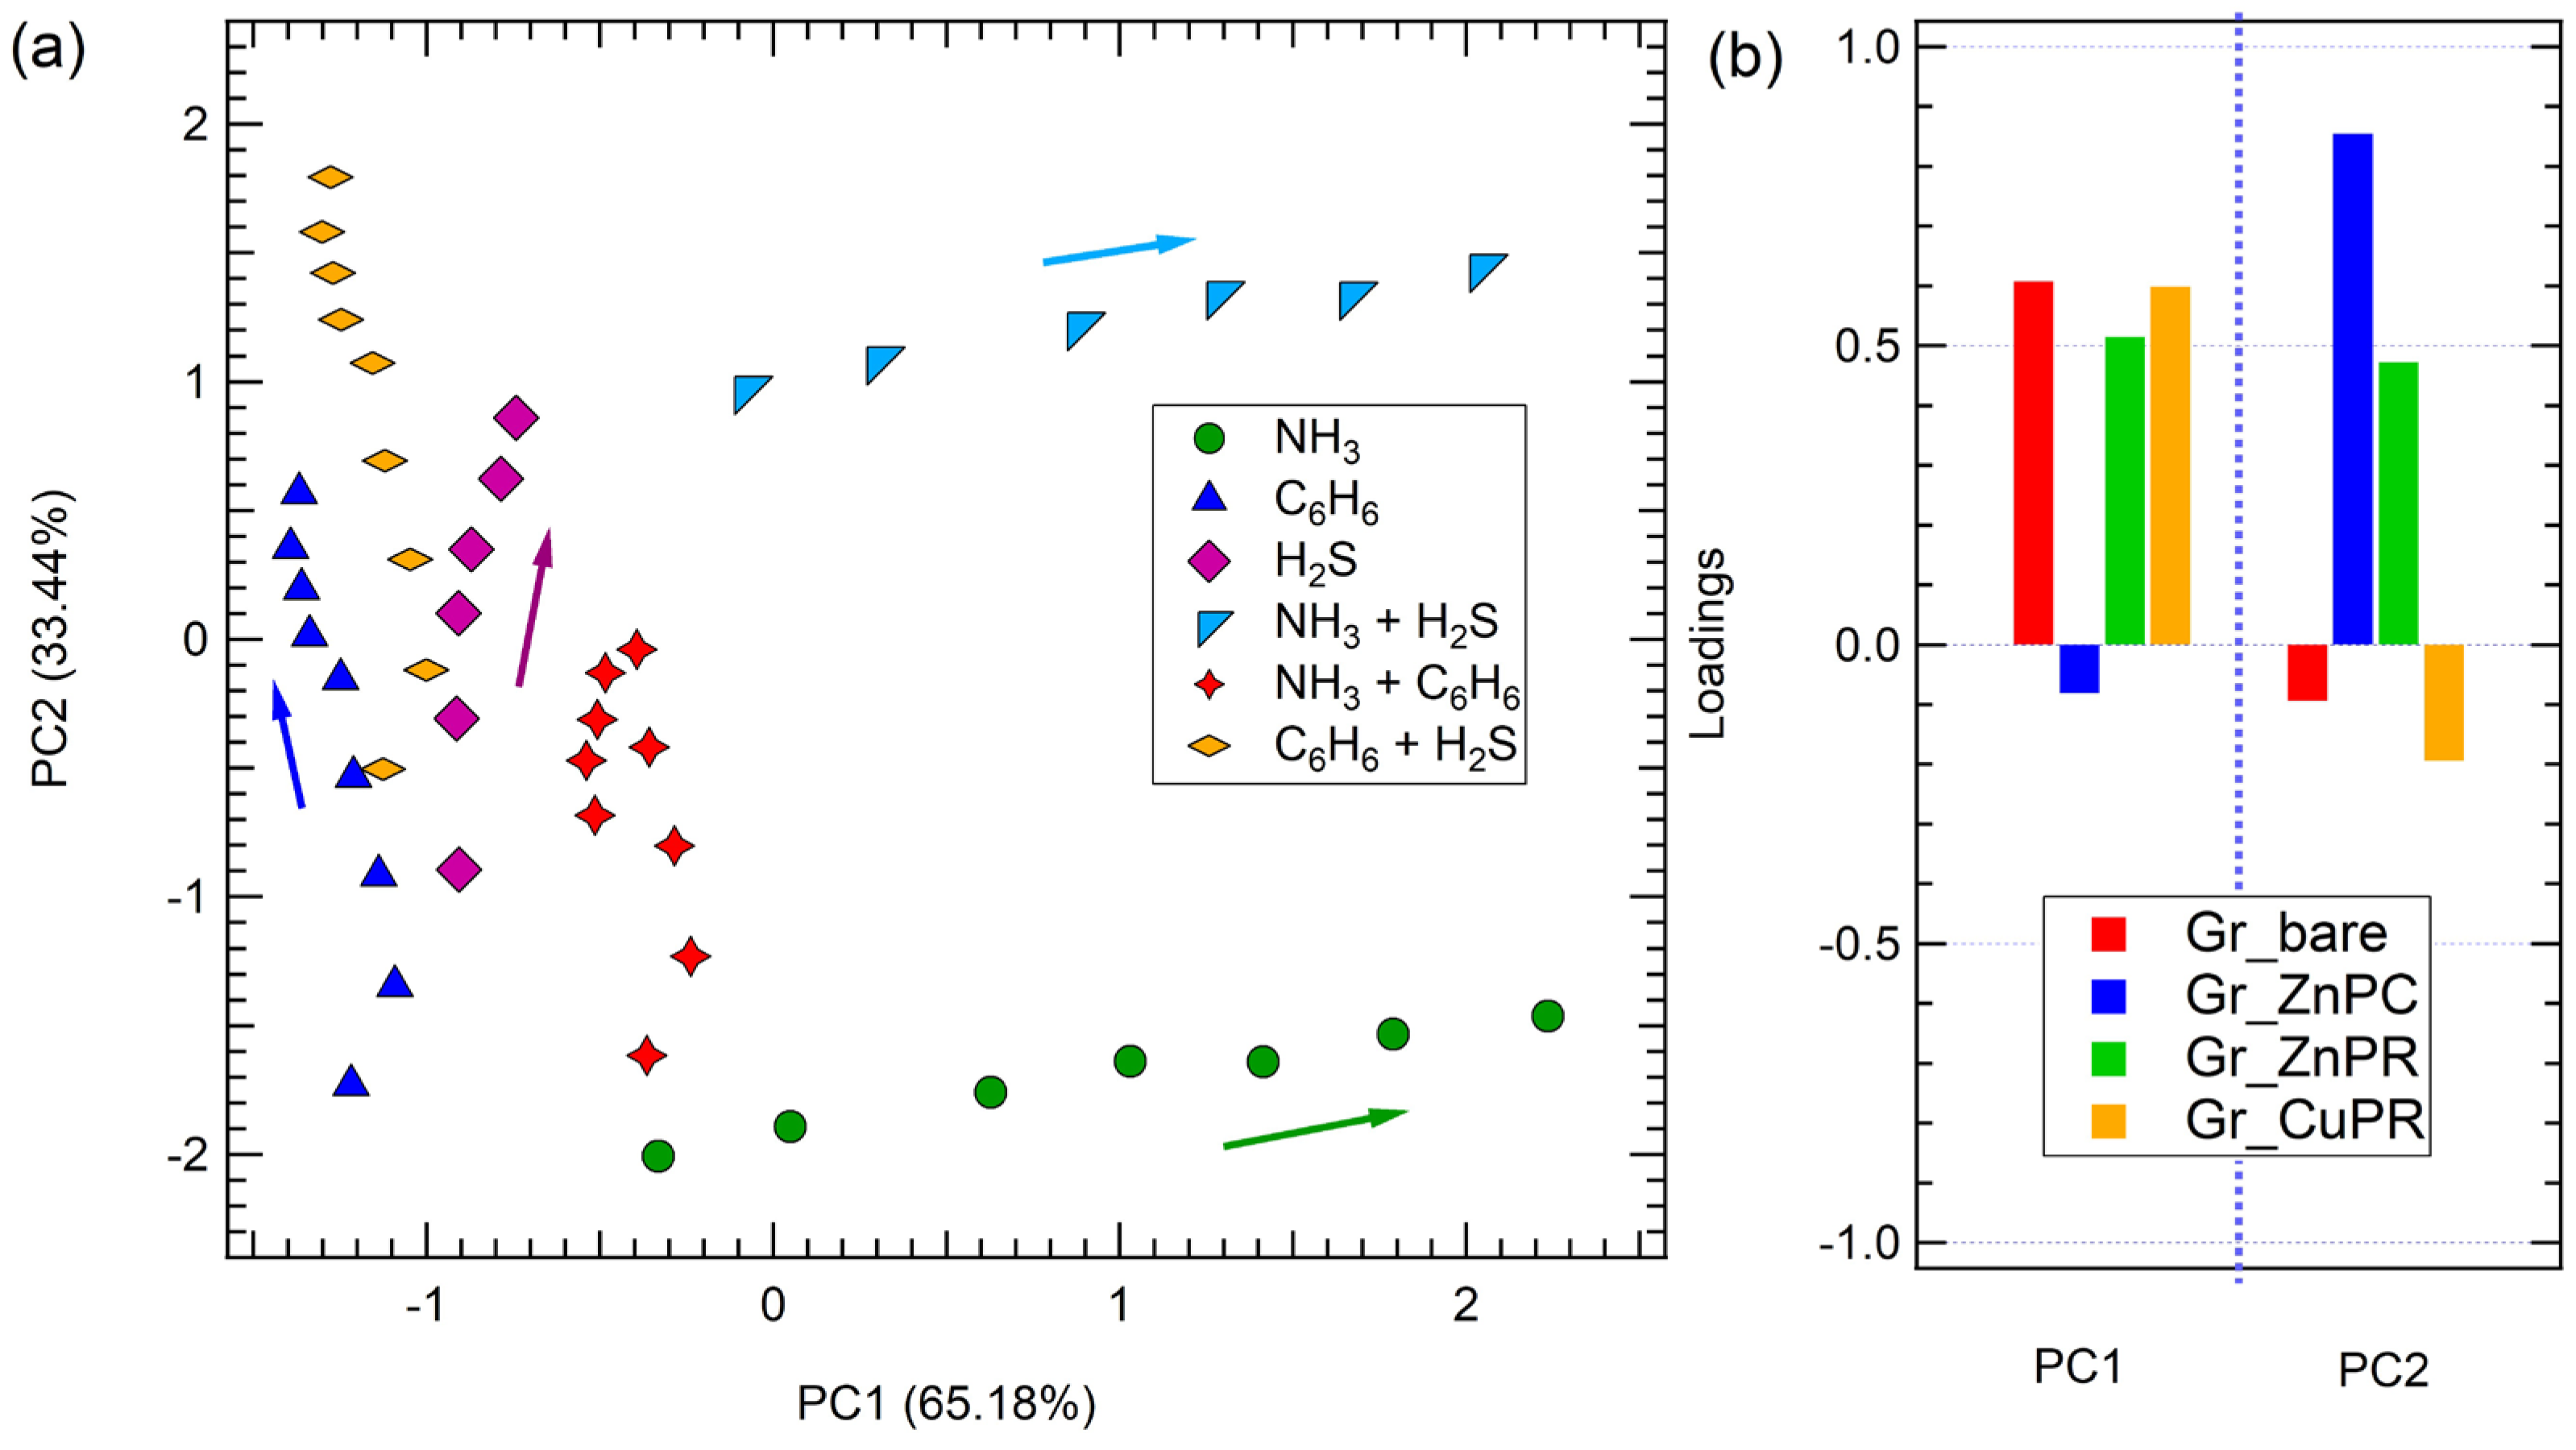
The results are reported in Figure 8. The space defined by PC1 and PC2 allows for clear discrimination of all the tested analytes, for both single gases (NH3, C6H6, and H2S) and their binary mixtures, as there is no overlap among the clusters corresponding to different gases. Additionally, similar to what has been already reported for arrays based on carbon nanomaterials [20], a concentration gradient is evident within each cluster: the arrows in Figure 8 indicate the trend of an increase in concentration for each cluster of a single gas.
This clustering indicates that the developed e-nose produces distinct and reproducible response profiles for each gas or mixture, demonstrating strong selectivity. For example, NH3 (green circles) and NH3 + C6H6 (red stars) occupy well-separated regions in the PCA space, confirming the sensor array’s ability to differentiate between individual gases and mixtures.
Additionally, the spatial separation between C6H6 (blue triangles), H2S (purple diamonds), and their mixture (e.g., C6H6 + H2S, yellow diamonds) suggests that the sensor responses contain rich, analyte-specific features that can be effectively captured through PCA. Importantly, the positions of the binary gas mixtures tend to lie between the clusters of the corresponding individual gases, reflecting the composite nature of their chemical signatures. This intermediate clustering behavior indicates that the sensor array not only discriminates between single analytes but also captures additive or synergistic effects present in gas mixtures. This aspect is particularly relevant in view of a possible application, where the accurate identification of complex or coexisting gases is essential, including in environmental monitoring, industrial leak detection, or medical diagnostics (e.g., breath analysis), where gases rarely need to be monitored individually. The ability to resolve mixed analytes enhances the practical utility of the developed array, supporting robust classification in dynamic and chemically rich environments.
Notably, while the developed sensors are not particularly selective, their combined response in the PCA enables the array to fully discriminate the contribution of each single gas and also mixtures. The overall variance explaining the data in the PCA space is 98.62%.
Finally, PCA loading plots offer valuable insights into the significance of individual sensors in contributing to the overall discrimination capability of the array (Figure 8b).
Specifically, discrimination along the PC1, meaning discrimination between on the one hand ammonia and benzene; hydrogen sulfide and benzene and their combination, and on the other ammonia + hydrogen sulfide and benzene, hydrogen sulfide and benzene and their combination, and ammonia + benzene, is achieved quite equally thanks to all sensors except Gr_ZnPc, while Gr_ZnPc was mainly responsible for discrimination along PC2, meaning discrimination between ammonia and ammonia + hydrogen sulfide.
This suggests that different functionalizations respond preferentially to different gases, enabling the dimensionality reduction to preserve chemically relevant variance.
As anticipated, achieving effective discrimination does not require all the sensors to exhibit high responses to every gas. Instead, variability in responses across the sensing layers is a critical factor.
These findings highlight the potential of the proposed sensor system for practical applications such as gas classification, electronic nose systems, and complex environment monitoring. The clear separation of analytes in PCA space supports robust pattern recognition, making the e-nose suitable for deployment in applications requiring rapid and reliable gas discrimination.

4. Conclusions

In this work, we presented the development and test of an electronic nose based on 4 sensors: bare graphene, and three graphene layers functionalized via drop-casting with unconventional metallated N-octyldibenzoazepinopyrazinoporphyrazines and commercial zinc phthalocyanine.
After characterization through Raman spectroscopy and atomic force microscopy (AFM), the developed sensors have been exposed to ammonia (NH3), benzene (C6H6), and hydrogen sulfide (H2S) in a chemiresistor configuration. Calibration curves have been drawn and a detection limit evaluated. The developed sensors show competitive sensing parameters compared to the literature: low limit of detection, high sensitivity, stability up to 4 months after the sample preparation, and a tested concentration range compatible with breath analysis and industrial applications. Finally, the discrimination capability of the e-nose has been assessed for single analytes and for mixtures of the investigated gases. It is worthing to mention that the selected three gases are not commonly tested together, despite their relevance, and therefore, this work represents a first in the literature. By leveraging the unique interaction mechanisms between the functionalized graphene surfaces and the analyte molecules, highlighting the synthesis and characterization of the sensing materials, their integration into the e-nose platform, and the performance evaluation in detecting and discriminating NH3, C6H6, H2S, and their mixtures, this e-nose represents a promising approach for real-time, selective, and sensitive gas detection in several applications.

Supplementary Materials

The following supporting information can be downloaded at https://www.mdpi.com/article/10.3390/chemosensors13050165/s1. Procedures for the synthesis of ZnPR and CuPR; Scheme S1: synthesis of ZnPR and CuPR. Figure S1: repeatability of ammonia exposure; Table S1: baseline resistances.

Author Contributions

Conceptualization, S.F. and L.S. (Luigi Sangaletti); methodology, S.F. and L.V.; software, S.F.; validation, S.F., L.V., A.P. and L.S. (Luca Scapinello); formal analysis, S.F.; investigation, S.F., L.V. and A.P.; resources, L.S. (Luigi Sangaletti); data curation, S.F.; writing—original draft preparation, S.F.; writing—review and editing, S.F., L.V. and L.S. (Luigi Sangaletti); visualization, S.F.; supervision, L.S. (Luigi Sangaletti); funding acquisition, L.S. (Luigi Sangaletti), S.F. All authors have read and agreed to the published version of the manuscript.

Funding

S.F. acknowledges Fondazione Cariplo for financial support, within the grant BREATH-SENSE 2023-1506—‘Giovani Ricercatori 2023’ call.

Institutional Review Board Statement

Not applicable.

Informed Consent Statement

Not applicable.

Data Availability Statement

Data are available from the authors.

Acknowledgments

L.V. gratefully acknowledges Giovanni Palmisano for the fruitful discussion. S.F. and L.S. (Luigi Sangaletti) acknowledge Antonio Papagni for the preliminary discussion on the system functionalization.

Conflicts of Interest

The authors declare no conflicts of interest.

References

  1. Bag, A.; Lee, N.E. Recent advancements in development of wearable gas sensors. Adv. Mater. Technol. 2021, 6, 2000883. [Google Scholar] [CrossRef]
  2. Freddi, S.; Sangaletti, L. Trends in the Development of Electronic Noses Based on Carbon Nanotubes Chemiresistors for Breathomics. Nanomaterials 2022, 12, 2992. [Google Scholar] [CrossRef] [PubMed]
  3. Chen, X.; Leishman, M.; Bagnall, D.; Nasiri, N. Nanostructured gas sensors: From air quality and environmental monitoring to healthcare and medical applications. Nanomaterials 2021, 11, 1927. [Google Scholar] [CrossRef] [PubMed]
  4. Seesaard, T.; Kamjornkittikoon, K.; Wongchoosuk, C. A comprehensive review on advancements in sensors for air pollution applications. Sci. Total Environ. 2024, 951, 175696. [Google Scholar] [CrossRef]
  5. Weston, M.; Geng, S.; Chandrawati, R. Food sensors: Challenges and opportunities. Adv. Mater. Technol. 2021, 6, 2001242. [Google Scholar] [CrossRef]
  6. Kumar, A.; Castro, M.; Feller, J.F. Review on sensor array-based analytical technologies for quality control of food and beverages. Sensors 2023, 23, 4017. [Google Scholar] [CrossRef]
  7. Reis, T.; Moura, P.C.; Gonçalves, D.; Ribeiro, P.A.; Vassilenko, V.; Fino, M.H.; Raposo, M. Ammonia Detection by Electronic Noses for a Safer Work Environment. Sensors 2024, 24, 3152. [Google Scholar] [CrossRef]
  8. Tan, L.; Feng, Z.; Zheng, H.; Yao, Z.; Weng, X.; Wang, F.; Chang, Z. Development trend of electronic nose technology in closed cabins gas detection: A review. Appl. Sci. 2022, 12, 9326. [Google Scholar] [CrossRef]
  9. Groysman, A.; Groysman, A. Process units in oil refineries and petrochemical plants. In Corrosion Problems and Solutions in Oil Refining and Petrochemical Industry; Springer: Berlin/Heidelberg, Germany, 2017; pp. 1–7. [Google Scholar]
  10. Torres, W.; Pansare, S.S.; Goodwin Jr, J.G. Hot gas removal of tars, ammonia, and hydrogen sulfide from biomass gasification gas. Catal. Rev. 2007, 49, 407–456. [Google Scholar] [CrossRef]
  11. Marcantonio, V.; Bocci, E.; Ouweltjes, J.P.; Del Zotto, L.; Monarca, D. Evaluation of sorbents for high temperature removal of tars, hydrogen sulphide, hydrogen chloride and ammonia from biomass-derived syngas by using Aspen Plus. Int. J. Hydrogen Energy 2020, 45, 6651–6662. [Google Scholar] [CrossRef]
  12. Cronkite, E.P.; Drew, R.T.; Inoue, T.; Hirabayashi, Y.; Bullis, J.E. Hematotoxicity and carcinogenicity of inhaled benzene. Environ. Health Perspect. 1989, 82, 97–108. [Google Scholar] [CrossRef] [PubMed]
  13. Duarte-Davidson, R.; Courage, C.; Rushton, L.; Levy, L. Benzene in the environment: An assessment of the potential risks to the health of the population. Occup. Environ. Med. 2001, 58, 2–13. [Google Scholar] [CrossRef] [PubMed]
  14. Van Aalst, J.A.; Isakov, R.; Polk, J.D.; Van Antwerp, A.D.; Yang, M.; Fratianne, R.B. Hydrogen sulfide inhalation injury. J. Burn Care Rehabil. 2020, 21, 248–253. [Google Scholar] [CrossRef]
  15. Guidotti, T.L. Hydrogen sulfide intoxication. In Handbook of Clinical Neurology; Elsevier: Amsterdam, The Netherlands, 2015; Volume 131, pp. 111–133. [Google Scholar]
  16. Leduc, D.; Gris, P.; Lheureux, P.; Gevenois, P.A.; De Vuyst, P.; Yernault, J.C. Acute and long term respiratory damage following inhalation of ammonia. Thorax 1992, 47, 755–757. [Google Scholar] [CrossRef]
  17. Vadysinghe, A.N.; Attygalle, U.; Ekanayake, E.M.K.B.; Dharmasena, E.G.I.A. Ammonia exposure: A review of six cases. Am. J. Forensic Med. Pathol. 2021, 42, 373–378. [Google Scholar] [CrossRef]
  18. Regulations (Standards—29 CFR). Available online: https://www.osha.gov/laws-regs/regulations/standardnumber/1910 (accessed on 16 January 2025).
  19. Recommendations of the SCOEL. Available online: https://echa.europa.eu/recommendations-of-the-scoel (accessed on 16 January 2025).
  20. Freddi, S.; Emelianov, A.V.; Bobrinetskiy, I.I.; Drera, G.; Pagliara, S.; Kopylova, D.S.; Chiesa, M.; Santini, G.; Mores, N.; Moscato, U.; et al. Development of a sensing array for human breath analysis based on swcnt layers functionalized with semiconductor organic molecules. Adv. Healthc. Mater. 2020, 9, 2000377. [Google Scholar] [CrossRef]
  21. Popa, C.; Dutu, D.C.; Cernat, R.; Matei, C.; Bratu, A.M.; Banita, S.; Dumitras, D.C. Ethylene and ammonia traces measurements from the patients’ breath with renal failure via LPAS method. Appl. Phys. B 2011, 105, 669. [Google Scholar] [CrossRef]
  22. Chatterjee, S.; Castro, M.; Feller, J.F. An e-nose made of carbon nanotube based quantum resistive sensors for the detection of eighteen polar/nonpolar VOC biomarkers of lung cancer. J. Mater. Chem. B 2013, 1, 4563. [Google Scholar] [CrossRef]
  23. Suzuki, Y.; Saito, J.; Uematsu, M.; Fukuhara, A.; Sato, S.; Togawa, R.; Sato, Y.; Misa, K.; Nikaido, T.; Fukuhara, N.; et al. Clinical application of hydrogen sulfide (H2S) as a marker of asthma management. Eur. Respir. J. 2016, 48, PA3379. [Google Scholar]
  24. Pham, Y.L.; Beauchamp, J. Breath biomarkers in diagnostic applications. Molecules 2021, 26, 5514. [Google Scholar] [CrossRef]
  25. Li, Y.; Wang, Z.; Zhao, T.; Li, H.; Jiang, J.; Ye, J. Electronic nose for the detection and discrimination of volatile organic compounds: Application, challenges, and perspectives. TrAC Trends Anal. Chem. 2024, 180, 117958. [Google Scholar] [CrossRef]
  26. Varghese, S.S.; Lonkar, S.; Singh, K.K.; Swaminathan, S.; Abdala, A. Recent advances in graphene based gas sensors. Sens. Actuators B 2015, 218, 160–183. [Google Scholar] [CrossRef]
  27. Freddi, S.; Marzuoli, C.; Pagliara, S.; Drera, G.; Sangaletti, L. Targeting biomarkers in the gas phase through a chemoresistive electronic nose based on graphene functionalized with metal phthalocyanines. RSC Adv. 2023, 13, 251–263. [Google Scholar] [CrossRef] [PubMed]
  28. Zanotti, M.; Freddi, S.; Sangaletti, L. Physical Virtualization of a GFET for a Versatile, High-Throughput, and Highly Discriminating Detection of Target Gas Molecules at Room Temperature. Adv. Mater. Technol. 2025, 10, 2400985. [Google Scholar] [CrossRef]
  29. Capman, N.S.; Zhen, X.V.; Nelson, J.T.; Chaganti, V.S.K.; Finc, R.C.; Lyden, M.J.; Williams, T.L.; Freking, M.; Sherwood, G.J.; Bühlmann, P.; et al. Machine learning-based rapid detection of volatile organic compounds in a graphene electronic nose. ACS Nano 2022, 16, 19567–19583. [Google Scholar] [CrossRef]
  30. Alzate-Carvajal, N.; Park, J.; Bargaoui, I.; Rautela, R.; Comeau, Z.J.; Scarfe, L.; Menard, J.-M.; Darling, S.B.; Luican-Mayer, A. Arrays of functionalized graphene chemiresistors for selective sensing of volatile organic compounds. ACS Appl. Electron. Mater. 2023, 5, 1514–1520. [Google Scholar] [CrossRef]
  31. Chen, Z.; Wang, J.; Wang, Y. Strategies for the performance enhancement of graphene-based gas sensors: A review. Talanta 2021, 235, 122745. [Google Scholar] [CrossRef]
  32. Recum, P.; Hirsch, T. Graphene-based chemiresistive gas sensors. Nanoscale Adv. 2024, 6, 11–31. [Google Scholar] [CrossRef]
  33. Georgakilas, V.; Otyepka, M.; Bourlinos, A.B.; Chandra, V.; Kim, N.; Kemp, K.C.; Hobza, P.; Zboril, R.; Kim, K.S. Functionalization of Graphene: Covalent and Non-Covalent Approaches, Derivatives and Applications. Chem. Rev. 2012, 112, 6156–6214. [Google Scholar] [CrossRef]
  34. Wang, H.; Maiyalagan, T.; Wang, X. Review on Recent Progress in Nitrogen-Doped Graphene: Synthesis, Characterization, and Its Potential Applications. ACS Catal. 2012, 2, 781–794. [Google Scholar] [CrossRef]
  35. Ghanbari, R.; Safaiee, R.; Sheikhi, M.H.; Golshan, M.M.; Horastani, Z.K. Graphene decorated with silver nanoparticles as a low-temperature methane gas sensor. ACS Appl. Mater. Interfaces 2019, 11, 21795–21806. [Google Scholar] [CrossRef] [PubMed]
  36. Freddi, S.; Rodriguez Gonzalez, M.C.; Casotto, A.; Sangaletti, L.; Feyter, S. Machine learning-aided NO2 discrimination with an array of graphene chemiresistors covalently functionalized by diazonium chemistry. Chem. A Eur. J. 2023, 29, e202302154. [Google Scholar] [CrossRef] [PubMed]
  37. Calmeiro, J.M.; Tomé, J.P.; Lourenço, L.M. Supramolecular graphene–phthalocyanine assemblies for technological breakthroughs. J. Mater. Chem. C 2020, 8, 8344–8361. [Google Scholar] [CrossRef]
  38. Casotto, A.; Drera, G.; Perilli, D.; Freddi, S.; Pagliara, S.; Zanotti, M.; Schio, L.; Verdini, A.; Floreano, L.; Di Valentin, C.; et al. π-Orbital mediated charge transfer channels in a monolayer Gr–NiPc heterointerface unveiled by soft X-ray electron spectroscopies and DFT calculations. Nanoscale 2022, 14, 13166–13177. [Google Scholar] [CrossRef]
  39. Guo, Z.; Wang, B.; Wang, X.; Li, Y.; Gai, S.; Wu, Y.; Cheng, X.-L. A high-sensitive room temperature gas sensor based on cobalt phthalocyanines and reduced graphene oxide nanohybrids for the ppb-levels of ammonia detection. RSC Adv. 2019, 9, 37518. [Google Scholar] [CrossRef]
  40. Wang, B.; Wang, X.; Guo, Z.; Gai, S.; Li, Y.; Wu, Y. A highly sensitive ppb-level H2S gas sensor based on fluorophenoxy-substituted phthalocyanine cobalt/rGO hybrids at room temperature. RSC Adv. 2021, 11, 5993–6001. [Google Scholar] [CrossRef]
  41. Yabaş, E.; Biçer, E.; Altındal, A. Novel reduced graphene oxide/zinc phthalocyanine and reduced graphene oxide/cobalt phthalocyanine hybrids as high sensitivity room temperature volatile organic compound gas sensors. J. Mol. Struct. 2023, 1271, 134076. [Google Scholar] [CrossRef]
  42. Shooshtari, M.; Salehi, A. An electronic nose based on carbon nanotube-titanium dioxide hybrid nanostructures for detection and discrimination of volatile organic compounds. Sens. Acts B Chem. 2022, 357, 131418. [Google Scholar] [CrossRef]
  43. Verma, G.; Gupta, A. Next-Generation Chemiresistive Wearable Breath Sensors for Non-Invasive Healthcare Monitoring: Advances in Composite and Hybrid Materials. Small 2025, 21, 2411495. [Google Scholar] [CrossRef]
  44. Tang, X.; Debliquy, M.; Lahem, D.; Yan, Y.; Raskin, J.P. A review on functionalized graphene sensors for detection of ammonia. Sensors 2021, 21, 1443. [Google Scholar] [CrossRef]
  45. Ghani, F.; Kristen, J.; Riegler, H. Solubility Properties of Unsubstituted Metal Phthalocyanines in Different Types of Solvents. J. Chem. Eng. Data 2012, 57, 439–449. [Google Scholar] [CrossRef]
  46. Parravicini, M.; Vaghi, L.; Cravotto, G.; Masciocchi, N.; Maspero, A.; Palmisano, G.; Penoni, A. A novel porphyrazine ligand tailored to homogeneous metal catalyzed transformations. Arkivoc 2014, 2014, 72–85. [Google Scholar] [CrossRef]
  47. Murray, C.; Dozova, N.; McCaffrey, J.G.; FitzGerald, S.; Shafizadeh, N.; Crepin, C. Infra-red and Raman spectroscopy of free-base and zinc phthalocyanines isolated in matrices. Phys. Chem. Chem. Phys. 2010, 12, 10406–10422. [Google Scholar] [CrossRef]
  48. Ferrari, A.C.; Basko, D.M. Raman spectroscopy as a versatile tool for studying the properties of graphene. Nat. Nanotechnol. 2013, 8, 235–246. [Google Scholar] [CrossRef]
  49. Liu, Z.; Zhang, X.; Zhang, Y.; Jiang, J. The molecular, electronic structures and IR and Raman spectra of metal-free, N, N′-dideuterio, and magnesium tetra-2,3-pyrazino-porphyrazines: Density functional calculations. Vib. Spectrosc. 2017, 43, 447–459. [Google Scholar] [CrossRef]
  50. Zhabanov, Y.A.; Eroshin, A.V.; Ryzhov, I.V.; Kuzmin, I.A.; Finogenov, D.N.; Stuzhin, P.A. Molecular structure, thermodynamic and spectral characteristics of metal-free and nickel complex of tetrakis (1, 2, 5-thiadiazolo) porphyrazine. Molecules 2021, 26, 2945. [Google Scholar] [CrossRef]
  51. Li, D.; Peng, Z.; Deng, L.; Shen, Y.; Zhou, Y. Theoretical studies on molecular structure and vibrational spectra of copper phthalocyanine. Vib. Spectrosc. 2005, 39, 191–199. [Google Scholar] [CrossRef]
  52. Gorski, A.; Gawinkowski, S.; Starukhin, A.; Gladkov, L.; Chizhova, N.; Mamardashvili, N.; Scheblykin, I.; Waluk, J. Resonance Raman and FTIR spectra of Mg-porphyrazines. J. Mol. Struct. 2014, 1058, 197–204. [Google Scholar] [CrossRef]
  53. Angeloni, S.; Bauer, E.M.; Ercolani, C.; Popkova, I.A.; Stuzhin, P.A. Tetrakis (selenodiazole) porphyrazines. 2: Metal complexes with Mn (II), Co (II), Ni (II), and Zn (II). J. Porphyr. Phthalocyanines 2001, 5, 881–888. [Google Scholar] [CrossRef]
  54. Freddi, S.; Perilli, D.; Vaghi, L.; Monti, M.; Papagni, A.; Di Valentin, C.; Sangaletti, L. Pushing down the limit of NH3 detection of graphene-based chemiresistive sensors through functionalization by thermally activated tetrazoles dimerization. ACS Nano 2022, 16, 10456–10469. [Google Scholar] [CrossRef]
  55. Liang, T.; Liu, R.; Lei, C.; Wang, K.; Li, Z.; Li, Y. Preparation and test of NH3 gas sensor based on single-layer graphene film. Micromachines 2020, 11, 965. [Google Scholar] [CrossRef] [PubMed]
  56. Li, Q.; Xu, M.; Jiang, C.; Song, S.; Li, T.; Sun, M.; Chen, W.; Peng, H. Highly sensitive graphene-based ammonia sensor enhanced by electrophoretic deposition of MXene. Carbon 2023, 202, 561–570. [Google Scholar] [CrossRef]
  57. Xiang, C.; Jiang, D.; Zou, Y.; Chu, H.; Qiu, S.; Zhang, H.; Xu, F.; Sun, L.; Zheng, L. Ammonia sensor based on polypyrrole–graphene nanocomposite decorated with titania nanoparticles. Ceram. Int. 2015, 41, 6432–6438. [Google Scholar] [CrossRef]
  58. Singh, S.; Deb, J.; Kumar, S.; Sarkar, U.; Sharma, S. Selective N, N-dimethylformamide vapor sensing using MoSe2/multiwalled carbon nanotube composites at room temperature. ACS Appl. Nano Mater. 2022, 5, 3913–3924. [Google Scholar] [CrossRef]
  59. Schedin, F.; Geim, A.K.; Morozov, S.V.; Hill, E.W.; Blake, P.; Katsnelson, M.I.; Novoselov, K.S. Detection of individual gas molecules adsorbed on graphene. Nat. Mater. 2007, 6, 652–655. [Google Scholar] [CrossRef]
  60. Perilli, D.; Freddi, S.; Zanotti, M.; Drera, G.; Casotto, A.; Pagliara, S.; Schio, L.; Sangaletti, L.; Di Valentin, C. Design of highly responsive chemiresistor-based sensors by interfacing NiPc with graphene. Commun. Mater. 2024, 5, 254. [Google Scholar] [CrossRef]
  61. Polyakov, M.S.; Basova, T.V.; Göksel, M.; Şenocak, A.; Demirbaş, E.; Durmuş, M.; Kadem, B.; Hassan, A. Effect of covalent and non-covalent linking of zinc (II) phthalocyanine functionalised carbon nanomaterials on the sensor response to ammonia. Synth. Met. 2017, 227, 78–86. [Google Scholar] [CrossRef]
  62. Zhang, Y.H.; Han, L.F.; Xiao, Y.H.; Jia, D.Z.; Guo, Z.H.; Li, F. Understanding dopant and defect effect on H2S sensing performances of graphene: A first-principles study. Comput. Mater. Sci. 2013, 69, 222–228. [Google Scholar] [CrossRef]
  63. Reshak, A.H.; Auluck, S. Adsorbing H2S onto a single graphene sheet: A possible gas sensor. J. Appl. Phys. 2014, 116, 103702. [Google Scholar] [CrossRef]
  64. Khodadadi, Z. Evaluation of H2S sensing characteristics of metals–doped graphene and metals-decorated graphene: Insights from DFT study. Phys. E Low-Dimens. Syst. Nanostruct. 2018, 99, 261–268. [Google Scholar] [CrossRef]
  65. Peng, X.; Liu, D.; Zhao, F.; Tang, C. Gas sensing properties of Mg-doped graphene for H2S, SO2, SOF2, and SO2F2 based on DFT. Int. J. Quantum Chem. 2022, 122, e26989. [Google Scholar] [CrossRef]
  66. Tsymbalenko, O.; Lee, S.; Lee, Y.M.; Nam, Y.S.; Kim, B.C.; Kim, J.Y.; Lee, K.B. High-sensitivity NH3 gas sensor using pristine graphene doped with CuO nanoparticles. Microchim. Acta 2023, 190, 134. [Google Scholar] [CrossRef] [PubMed]
  67. Freddi, S. Enhancing the response to ammonia and nitrogen dioxide of bare graphene through NiPc functionalization. Il Nuovo C. 2023, 100, 46. [Google Scholar]
  68. Freddi, S.; Vergari, M.; Pagliara, S.; Sangaletti, L. A Chemiresistor sensor array based on graphene nanostructures: From the detection of ammonia and possible interfering VOCs to chemometric analysis. Sensors 2023, 23, 882. [Google Scholar] [CrossRef]
  69. Li, Q.; Chen, W.; Liu, W.; Sun, M.; Xu, M.; Peng, H.; Wu, H.; Song, S.; Li, T.; Tang, S. Highly sensitive graphene ammonia sensor enhanced by concentrated nitric acid treatment. Appl. Surf. Sci. 2022, 586, 152689. [Google Scholar] [CrossRef]
  70. Jagannathan, M.; Dhinasekaran, D.; Rajendran, A.R.; Subramaniam, B. Selective room temperature ammonia gas sensor using nanostructured ZnO/CuO graphene on paper substrate. Sens. Actuators B Chem. 2022, 350, 130833. [Google Scholar] [CrossRef]
  71. Freddi, S.; Rodriguez Gonzalez, M.C.; Carro, P.; Sangaletti, L.; De Feyter, S. Chemical defect-driven response on graphene-based chemiresistors for sub-ppm ammonia detection. Angew. Chem. Int. Ed. 2022, 61, e202200115. [Google Scholar] [CrossRef]
  72. Srivastava, S.; Jain, S.K.; Gupta, G.; Senguttuvan, T.D.; Gupta, B.K. Boron-doped few-layer graphene nanosheet gas sensor for enhanced ammonia sensing at room temperature. RSC Adv. 2020, 10, 1007–1014. [Google Scholar] [CrossRef]
  73. Wu, D.; Peng, Q.; Wu, S.; Wang, G.; Deng, L.; Tai, H.; Wang, L.; Yang, Y.; Dong, L.; Zhao, Y.; et al. A simple graphene NH3 gas sensor via laser direct writing. Sensors 2018, 18, 4405. [Google Scholar] [CrossRef]
  74. Lv, R.; Chen, G.; Li, Q.; McCreary, A.; Botello-Méndez, A.; Morozov, S.V.; Liang, L.; Declerck, X.; Perea-López, N.; Cullen, D.A.; et al. Ultrasensitive gas detection of large-area boron-doped graphene. Proc. Natl. Acad. Sci. USA 2015, 112, 14527–14532. [Google Scholar] [CrossRef]
  75. Seekaew, Y.; Lokavee, S.; Phokharatkul, D.; Wisitsoraat, A.; Kerdcharoen, T.; Wongchoosuk, C. Low-cost and flexible printed graphene–PEDOT: PSS gas sensor for ammonia detection. Org. Electron. 2014, 15, 2971–2981. [Google Scholar] [CrossRef]
  76. Ovsianytskyi, O.; Nam, Y.S.; Tsymbalenko, O.; Lan, P.T.; Moon, M.W.; Lee, K.B. Highly sensitive chemiresistive H2S gas sensor based on graphene decorated with Ag nanoparticles and charged impurities. Sens. Actuators B Chem. 2018, 257, 278–285. [Google Scholar] [CrossRef]
  77. Zhou, L.; Shen, F.; Tian, X.; Wang, D.; Zhang, T.; Chen, W. Stable Cu2O nanocrystals grown on functionalized graphene sheets and room temperature H2S gas sensing with ultrahigh sensitivity. Nanoscale 2013, 5, 1564–1569. [Google Scholar] [CrossRef] [PubMed]
  78. Al-Hartomy, O.A.; Khasim, S.; Roy, A.; Pasha, A. Highly conductive polyaniline/graphene nano-platelet composite sensor towards detection of toluene and benzene gases. Appl. Phys. A 2019, 125, 12. [Google Scholar] [CrossRef]
  79. Kumar, D.; Chaturvedi, P.; Saho, P.; Jha, P.; Chouksey, A.; Lal, M.; Rawat, J.S.B.S.; Tandon, R.P.; Chaudhury, P.K. Effect of single wall carbon nanotube networks on gas sensor response and detection limit. Sens. Actuators B 2017, 240, 1134–1140. [Google Scholar] [CrossRef]
Figure 1. Molecular structures of the zinc phthalocyanine (left side) and metalated pyrazinoporphyrazines (right side) used in this study.
Chemosensors 13 00165 g001
Figure 2. (a) Schematic representation of the homemade platform comprising the 4 developed graphene-based sensors and the two commercial sensors for RH and T detection. (b) Schematic representation of the chemiresistors readout scheme of each sensor.
Chemosensors 13 00165 g002
Figure 3. (a) Representative Raman spectra of a bare graphene layer on Si/Si3N4 (red) and with ZnPc (blue), ZnPR (green), and CuPR (yellow). AFM images were acquired on (b) Gr_ZnPc, (c) Gr_ZnPR, and (d) Gr_CuPR.
Chemosensors 13 00165 g003
Figure 4. Resistance variation as a function of the time for all the sensors exposed to 2.6 ppm, 2.9 ppm, 3.2 ppm, and 13.6 ppm of ammonia.
Chemosensors 13 00165 g004
Figure 5. Calibration curves for (a) ammonia, (b) hydrogen sulfide, and (c) benzene for all the sensors in the array. Squares data in the ammonia calibration curves comes from exposures performed in air, in a close environment of applications. Error bars are estimated on the basis of 3 exposures to the same gas concentration.
Chemosensors 13 00165 g005
Figure 6. Stability of the sensors’ response towards 3 different ammonia concentrations up to 4 months from the sensors’ preparation.
Chemosensors 13 00165 g006
Figure 7. Sensor response to the same concentration of analytes (270 ppb) for all the sensors.
Chemosensors 13 00165 g007
Figure 8. (a) PCA of the sensor array responses to exposure to hydrogen sulfide, benzene, ammonia, and their mixtures. (b) Loadings for PC1 and PC2. Arrow in panel (a) indicates the concentration trend.
Chemosensors 13 00165 g008
Table 1. Benchmarking for dynamical tested range, sensitivity S range (S = (|ΔR/R0| × 100)/[gas]), and detection limit (dl) of the prepared samples against the values for other graphene-based chemiresistors reported in the literature [27,54,55,56,57,60,66,67,68,69,70,71,72,73,74,75,76,77,78]. Of note, only articles reporting gas concentration and sensor response/sensitivity have been taken into account for this benchmarking. In the case of ammonia, only works of the last 10 years are reported.
Sensor TypeGas: Dynamic Tested Range (ppm)Sensitivity Range
(%ppm−1)
Detection Limit
(ppb)
Reference
Gr_bareNH3: 0.2–147.75–0.11170Present work
Gr_ZnPcNH3: 0.2–140.75–0.01250Present work
Gr_ZnPRNH3: 0.2–141.124–0.0911Present work
Gr_CuPRNH3: 0.2–140.62–0.125Present work
Gr_NiPcNH3: 0.04–4.648.6–0.53.3[60]
Gr_CuO NPsNH3: 1000.8341[66]
MXene deposited GrNH3: 0.5–1004–2.556[56]
NiPc-GrNH3: 5–100.47–0.19-[67]
Gr_CoPtNH3: 2.2–36.00.8–0.240.1[68]
Gr_NiPcNH3: 0.5–13.60.64–0.1150[27]
Nitric
acid treated Gr
NH3: 20–1000.7–0.427[69]
S-ZnO@GrNH3: 5–151.9–1.1-[70]
Gr_NBDNH3: 0.05–8.410.78–0.45-[71]
Gr-TCNNH3: 0.85–22.56.3–1.54.2[54]
B-doped GrNH3: 16–2560.12–0.09-[72]
CVD grapheneNH3: 100–8000.05–0.01-[55]
Laser written GrNH3: 75–4000.04–0.075-[73]
B-doped GrNH3: 1–200.04–0.04259.9[74]
TiO2@PPy–GNNH3: 10–2002.4–1.31000[57]
graphene–PEDOT:PSSNH3: 25–10000.2–0.01910,000[75]
Gr_ZnPcH2S: 0.05–2.56.41–0.8512.6Present work
Gr_ZnPRH2S: 0.05–2.50.86–0.2123.0Present work
Gr_CuPRH2S: 0.05–2.51.57–0.0929.3Present work
Gr and AgNPsH2S: 0.5–508–2.6100[76]
CuO2 NCs on GrH2S: 0.05–0.115–355[77]
Gr_bareC6H6: 0.005–0.322.10–1.225Present work
Gr_ZnPcC6H6: 0.005–0.344.00–6.222.7Present work
Gr_ZnPRC6H6: 0.005–0.317.8–1.972.8Present work
Gr_CuPRC6H6: 0.005–0.31.11–0.932.2Present work
Polyaniline–Gr nanoplateletsC6H6: 1000–22,0000.1–0.8-[78]
Disclaimer/Publisher’s Note: The statements, opinions and data contained in all publications are solely those of the individual author(s) and contributor(s) and not of MDPI and/or the editor(s). MDPI and/or the editor(s) disclaim responsibility for any injury to people or property resulting from any ideas, methods, instructions or products referred to in the content.