Abstract
Traditional detection methods such as atomic absorption spectroscopy offer high sensitivity and accuracy for heavy metal ion detection; however, they are often limited to laboratory environments due to bulky equipment and complex procedures. To meet the demand for rapid on-site detection, this study employs electrochemical analysis and utilizes Micro-Electro-Mechanical Systems (MEMS) technology to fabricate a microelectrode sensor chip for the electrochemical detection of heavy metal ions, Hg(II) and As(III). Nano-gold particles were electrodeposited on the sensing area of the working electrode of this chip using a constant-potential deposition method. Uniform distribution of the nanoparticles was obtained, which enhanced the effective specific surface area and electrochemical activity of the working electrode. Therefore, wide detection concentration ranges for Hg(II) of 5 to 1000 µg/L and for As(III) of 5 to 5000 µg/L were displayed, with detection limits of 1.4 µg/L and 2.4 µg/L, respectively. Moreover, the sensor exhibited satisfactory reproducibility, stability and anti-interference capability. These characteristics enable the developed microelectrode sensor chip to be utilized in the monitoring of a diverse range of pollution sources.
1. Introduction
The heavy metals mainly stem from anthropogenic sources, including the extraction and processing of metal ores, leading to the discharge of substantial waste into the environment [1]. The presence of heavy metals in water has adverse effects on human health and the environment. Excessive exposure to arsenic (III) may lead to diseases, such as skin changes, respiratory issues, cardiovascular problems, gastrointestinal disorders, genotoxicity, mutagenesis, and carcinogenic effects [2]. Toxic effects from mercury (II) may include damage to the liver and reproductive organs, adverse health effects, and other complications [3]. As the quality of our water supply is increasingly threatened by these metals, accurately detecting these heavy metal ions is essential for ensuring water safety and protecting public health. The traditional methods for analyzing heavy metals in water, such as spectroscopy, mass spectrometry and chromatography, offer high accuracy and low detection limits. For instance, Tatiana et al. employed inductively coupled plasma mass spectrometry (ICP-MS) to detect Hg(II) in water, achieving a detection limit of 0.12 μg/L [4]; Xu et al. utilized ultraviolet-visible Raman spectroscopy (UV-Vis Raman spectrometry) for the detection of Hg(II) in water, with a detection limit of 0.45 ng/L [5]; and Gao et al. applied high-performance liquid chromatography (HPLC) to determine Hg(II) in water, obtaining a detection limit of 0.32 μg/L [6]. However, these methods often rely on large experimental equipment and instruments, involve complex operations, require specialized personnel to work in a laboratory environment, and are time-consuming and costly. It is difficult for them to meet the demands for online water environment monitoring [7]. In modern society, it is crucial to employ cost-effective and acceptable methods for the sensitive and selective identification of heavy metal ions in water [8]. Electrochemical detection technologies have recently gained significant attention in the detection of heavy metal ions due to their ability to analyze ions with short analysis times, low power consumption, and high sensitivity [9]. In electrochemical methods, variations in current, potential, electrochemical impedance, capacitance, or electrochemiluminescence resulting from the reactions of heavy metal ions in solution can be employed for both qualitative and quantitative analysis of these ions [10].
Various studies have demonstrated that numerous chemically modified electrodes have been utilized to enhance detection performance for the determination of heavy metal ions [11]. M. Ramalingam et al. developed a three-dimensional porous nanocomposite composed of graphite carbon nitride nanosheets and oxidized multi-walled carbon nanotubes (MWCNTs) to modify screen-printed electrodes (SPE), enabling simultaneous detection of Cd2+, Hg2+, Pb2+, and Zn2+ with enhanced sensitivity and selectivity [12]. R. Kempegowda et al. employed a platinum–graphene nanocomposite modified glassy carbon electrode (GCE) for the detection of toxic arsenic ions [13]. Sandeep Gupta et al. synthesized bismuth nano-hexagons via electrochemical deposition on indium tin oxide (ITO)-coated glass electrodes using a constant-potential mode, achieving sensitive detection of mercury ions [14]. Srikant Sahoo et al. modified a carbon paste electrode with an array of gold nanoparticles (AuNP) for the detection of mercury ions [15]. Hu HB et al. modified a glassy carbon electrode with Fe3O4-reduced graphene oxide (rGO) nanocomposites and employed square wave voltammetry for the electrochemical detection of trace arsenic in water [16]. The degree of pollution in different water bodies varies widely, as does the concentration of heavy metal ions in actual water samples. Consequently, while improving sensitivity to achieve trace detection, attention should also be paid to the detection of high-concentration pollution. Furthermore, sensors should have a wide detection range.
Commercial disk electrodes are frequently used for the electrochemical detection of heavy metals [17], and they often require the use of a platinum wire as a counter electrode, which is unsuitable for miniaturization and integration of the device [18]. Currently, screen printing and MEMS technology are widely used for electrode miniaturization. Screen-printed electrodes do not require complex processes such as photolithography and are commonly employed in electrochemical sensor research. However, compared to screen-printed electrodes, MEMS technology offers advantages such as higher precision, diverse material options, suitability for integration and miniaturization, and enhanced durability. MEMS-based electrodes are more suitable for applications requiring high precision and long-term use in environmental monitoring [19]. This study utilized MEMS technology to fabricate a microelectrode sensor chip, using gold for the working electrode and platinum for the counter electrode. Gold nanoparticles were modified on the working electrode of the microchip to increase the effective surface area and enhance the binding capacity between the electrode surface and heavy metal ions [20], thereby achieving wide-range detection of Hg(II) and As(III).
2. Materials and Methods
2.1. Instruments and Reagents
Acetone, Ethanol, Hydrochloric Acid (HCl), Sulfuric Acid (H2SO4) (Beijing Chemical Factory, Beijing, China), KCl, HAuCl4·4H2O (China National Pharmaceutical Group Chemical Reagent Co., Ltd., Shanghai, China), Standard solutions (1000 µg/mL) of Hg and As (the Institute for Environment Reference Materials Ministry of Environmental Protection, Beijing, China) were employed. All reagents used were of analytical grade.
The Reference 600 electrochemical workstation (Gamry Instruments, Warminster, PA, USA), the S-480 field-emission scanning electron microscope (SEM, Hitachi, Japan), the PHS-3C pH meter (Shanghai Leici Instruments Co., Ltd., Shanghai, China), and the Ag/AgCl reference electrode (Shanghai Chenhua Instrument Co., Ltd., Shanghai, China) were employed. All aqueous solutions used in this work were prepared with highly pure deionized water (Milli-Q system Millipore Company, Darmstadt, Germany) with a resistivity of 18 MΩ·cm.
The stock solutions of Hg and As with a concentration of 10 µg/mL were obtained by diluting 1000 µg/mL standard solutions with deionized water. Test samples with different target ion concentrations were prepared by mixing the stock solutions with an appropriate electrolyte. For the Hg test, 0.1 mol/L HCl was used as the electrolyte. The supporting electrolyte solution for the As test was 1 mol/L HCl. Real water samples were collected from a local lake.
2.2. Fabrication of the Microelectrode Sensor Chip
The structure of the microelectrode sensor chip employs a concentric “circle-ring” distribution. The working electrode is circular with an area of 1 mm2, while the counter electrode is ring-shaped. This configuration features a uniform electric field and potential distribution across the electrode surface. Additionally, the alignment of the electrode surface with the diffusion direction of the solution helps to effectively suppress current noise and improve the response performance of the sensing chip [21].
The chip was fabricated using MEMS processing technology with a silicon wafer as the substrate. The materials for the working electrode and counter electrode were gold and platinum, respectively. SU-8 photoresist was used as the insulating layer to define the effective area of the working electrode and the counter electrode. The principal fabrication process is illustrated in Figure 1a, and the specific fabrication process involves the following steps. Firstly, an 800 nm thick layer of silicon dioxide and a 200 nm thick layer of silicon nitride were deposited on the silicon wafer as insulation layers, by using thermal oxidation and low pressure chemical vapor deposition methods. Next, a photoresist (5214E) was coated on the wafer, and photolithography was used to pattern the counter electrodes. Titanium was then sputtered to a thickness of 20 nm as an adhesion layer, followed by sputtering 300 nm of platinum as the counter-electrode layer. Pattern transfer was completed by lift-off. Following this, a second coating of photoresist (5214E), photolithography, sputtering (20 nm titanium and 300 nm gold), and lift-off were performed to form the working electrode. After that, a third photolithography step was carried out to cover with negative photoresist SU-8 as an insulating layer. Finally, the micro-sensor electrode chip was completed through dicing, wire bonding, and packaging. The fabricated microelectrode sensor chip is shown in Figure 1b.
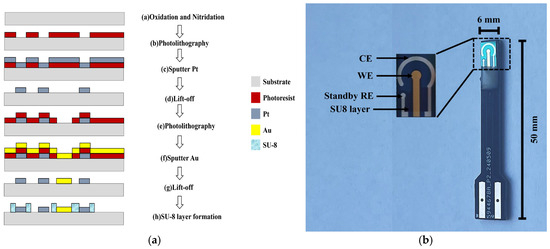
Figure 1.
(a) Schematic of certain fabrication procedure of the microelectrode sensor chip; (b) Photograph of the microelectrode sensor chip.
2.3. Modification of the Microelectrode Sensor Chip
The microelectrode sensor chip was ultrasonically cleaned in acetone, anhydrous ethanol, and deionized water for 5 min each to remove contaminants. Then, the microelectrode chip was immersed in a 2 mM HAuCl4 solution (prepared with 0.5 M H2SO4) and constant-potential deposition was performed at −0.3 V with an Ag/AgCl reference electrode for 300 s to complete the nano-gold modification.
2.4. Test of the Microelectrode Sensor Chip
The test was conducted using a three-electrode system with the on-chip Au circular electrode as the working electrode, the on-chip Pt ring electrode as the counter electrode, and an Ag/AgCl (saturated KCl) electrode as the reference electrode. Differential pulse anodic stripping voltammetry (DP-ASV) was performed on a Gamry electrochemical workstation (Gamry Reference 600). Standard solutions of Hg(II) and As(III) were used for detection. For Hg(II) detection, the electrolyte was 0.1 mol/L hydrochloric acid, while 1 mol/L hydrochloric acid was employed for As(III) analysis. The enrichment voltage and enrichment time for both were −0.3 V and 120 s. The differential pulse voltammetry (DPV) parameters included a pulse period of 0.5 s, a pulse width of 0.05 s, and an amplitude of 2 mV. The initial and final potentials were set at −0.2 V and +0.6 V, respectively, with a clearness voltage of 0.5 V.
3. Results
3.1. Electrode Preparation and Characterization
The micromorphology of the microelectrode modified with gold nanoparticles was analyzed using a scanning electron microscope. The SEM images of the modified microelectrode are shown in Figure 2a,b. From these images, it can be observed that the gold nanoparticles are uniformly distributed on the working electrode of the microelectrode sensor chip. The average diameter of the gold nanoparticles is approximately 80 nm.
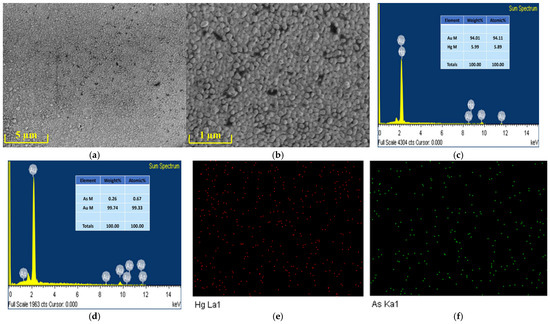
Figure 2.
SEM images of the working electrode modified with gold nanoparticles at (a) ×6000, (b) ×30,000. EDX of the AuNPs-modified microelectrode after the deposition of (c) mercury ions, (d) arsenic ions. EDS elemental mapping images of (e) mercury and (f) arsenic on the AuNPs-modified microelectrode.
Figure 2c–f present the elemental characterization of the gold nanoparticle-modified microelectrode deposited with heavy metal ions using EDX (Energy Dispersive X-ray Spectroscopy, Hitachi, Japan) and EDS (Energy Dispersive Spectroscopy, Hitachi, Japan). The signal of Hg ions can be observed in the EDX spectrum shown in Figure 2c, while the signal of As ions is evident in the EDX spectrum displayed in Figure 2d. As clearly seen in Figure 2e,f, the distribution of Hg and As is uniform. These results demonstrate that Hg and As were successfully modified onto the electrode surface.
The electrochemical characteristics of the gold electrode in H2SO4 solution can be used for the characterization of its effective area. Figure 3 shows the cyclic voltammograms of the bare gold electrode and the gold electrode modified with nano-gold in 0.5 M H2SO4 solution. The oxidation peak between 1.2 and 1.4 V corresponds to the formation of gold oxides, primarily AuO. The reduction peak at about 0.9 V corresponds to the reduction of gold oxides, which is a characteristic peak of gold. When the electrode surface was modified with nano-gold, the oxidation–reduction characteristic peaks increased significantly, indicating the enhancement in the specific surface area and the electrochemical activity of the electrode.
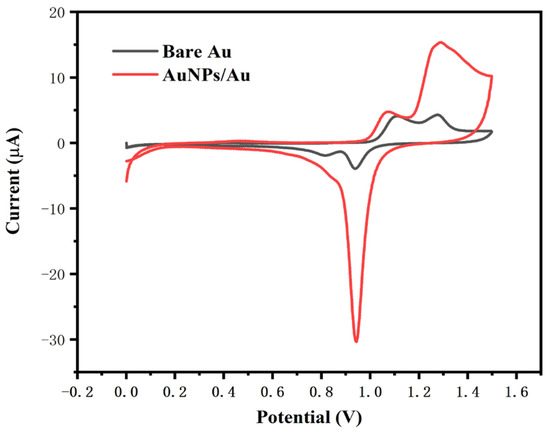
Figure 3.
Cyclic voltammetry curves of the electrode before and after modification with nano-gold in 0.5 M H2SO4.
3.2. Optimization of Detection Parameters for Hg(II) and As(III)
The deposition potential plays a key role in determining the stripping peak current. In this study, the effect of deposition potential on the stripping peak current of Hg2+ (20 µg/L) and As3+(100 µg/L) was examined within the range of −0.6 V to −0.1 V. As shown in Figure 4a,d, the stripping peak current significantly increased when the deposition potential was shifted from −0.1 V to −0.3 V. This could be due to the enhancement of the electronic driving force on the electrode surface as the deposition potential became more negative, which led to a higher accumulation of mercury ions on the working electrode. However, as the deposition potential was further decreased from −0.3 V to −0.6 V, the stripping peak current showed a slower increase and even a slight decrease. This could be attributed to the excessive negative deposition potential, causing hydrogen evolution, which interferes with the deposition of Hg2+ and As3+. Therefore, −0.3 V was selected as the deposition potential for subsequent experiments.
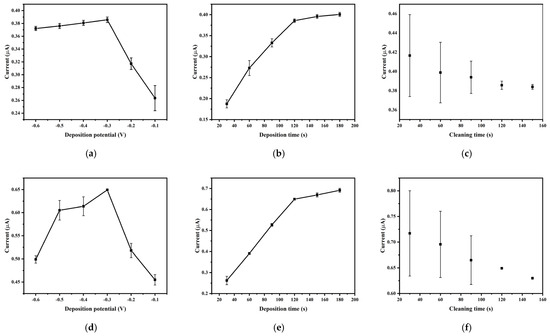
Figure 4.
The optimization of mercury (a) deposition potential, (b) deposition time and (c) cleaning time. The optimization of arsenic (d) deposition potential, (e) deposition time and (f) cleaning time. Reaction conditions: pulse period: 0.5 s; pulse width: 0.05 s; amplitude: 2 mV.
The impact of deposition time (ranging from 30 s to 180 s) on the stripping peak current of Hg2+ (20 µg/L) and As3+ (100 µg/L) is shown in Figure 4b,e. The results indicate that the stripping peak current increased with longer deposition time. However, an extended deposition time would lengthen the detection period and decrease the overall detection efficiency. Additionally, excessively long deposition times may reduce the linear range, affecting the accuracy of measurements [22]. Therefore, a deposition time of 120 s was chosen for the next set of experiments.
The effect of cleaning time on the stripping peak current of Hg2+ (20 μg/L) and As3+ (100 µg/L) was studied within the range of 30 s to 150 s. Figure 4c,f show that with an increase in cleaning time, the stripping peak current gradually decreased, while the standard deviation notably decreased. When cleaning time was too short, not all mercury accumulated on the electrode surface was dissolved, leading to increased current and higher standard deviation with repeated measurements at the same concentration. To improve the accuracy of the experiment, while taking cleaning efficiency and experimental time into consideration, a cleaning time of 120 s was chosen for the experiments.
3.3. Detection of Hg(II) and As(III)
The determination of Hg(II) was performed using the microelectrode sensor chip modified with gold nanoparticles. The differential pulse voltammograms of the chip in 0.1 M HCl solution with varying Hg(II) concentrations (0, 1, 5, 10, 20, 50, 100, 200, 500, 1000 µg/L) are shown in Figure 5a. As the concentration of Hg(II) increased, the oxidation peak current also increased. At low concentrations (Hg(II) < 20 µg/L), the oxidation peak current increased rapidly with Hg(II) concentration, displaying a linear relationship (i(µA) = 0.017c(µg/L) + 0.013, R2 = 0.9927). At high concentrations (Hg(II) > 20 µg/L), the increase in peak current with concentration slowed down, but still showed a linear relationship (i(µA) = 0.0043c(µg/L) + 0.322, R2 = 0.9929). The reduced sensitivity at high concentrations may be attributed to the increased coverage rate of mercury on the electrode surface, which impeded the accumulation of mercury and thus reduced sensitivity. At low levels, in contrast, the electrode surface was not fully coated with mercury, resulting in a rapid increase in peak current [23]. Consequently, a segmented linear response was observed.
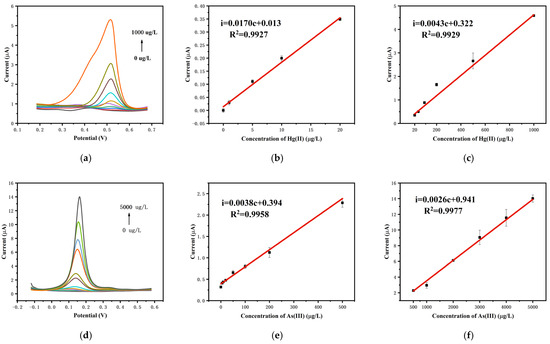
Figure 5.
(a) DPV curves for Hg(II) detection, calibration curves from (b) 0 to 20 µg/L and (c) 20 to 1000 µg/L. (d) DPV curves for As(III) detection, calibration curves from (e) 0 to 500 µg/L and (f) 500 to 5000 µg/L).
The quantitative detection of As(III) was carried out utilizing the gold nanoparticle-modified microelectrode sensor chip. Figure 5d shows the differential pulse voltammograms of the electrode in 0.1 mol/L HCl solution containing As(III) with the concentration range of 0 to 5000 µg/L. As the concentration of As(III) increased from 0 to 5000 µg/L (0, 5, 10, 20, 50, 100, 200, 500, 1000, 2000, 3000, 4000, 5000 µg/L), the oxidation peak current also increased. At low concentrations (As(III) < 500 µg/L), the oxidation peak current rose rapidly with the concentration of As(III), showing a linear relationship (i(µA) = 0.0038c(µg/L) + 0.394, R2 = 0.9958). At high concentrations (As(III) > 500 µg/L), the increase in oxidation peak current with As(III) concentration was slower but still exhibited a linear relationship (i(µA) = 0.0026c(µg/L) + 0.941, R2 = 0.9977). Due to similar reasons as in mercury detection, the oxidation peak current for As(III) also exhibited a segmented linear relationship with concentration.
The detection limit (LOD) of the microelectrode sensor chip was calculated based on the following linear equation:
LOD = 3σ/S
Here, σ is the standard deviation of the response current obtained from seven consecutive measurements of the blank buffer solution. S is the sensitivity, which corresponds to the slope of the linear equation.
The calculated LODs for Hg(II) and As(III) were 1.4 µg/L and 2.4 µg/L, respectively.
Based on the calculated detection limit, the effective linear range of the sensor chip for Hg(II) was calibrated to be from 5 μg/L to 1000 μg/L. For As(III), the linear range is from 5 μg/L to 5000 μg/L.
3.4. Repeatability, Stability and Anti-Interference Capability
The repeatability and long-term stability of the microelectrode sensor chip were evaluated and verified. The repeatability of the microelectrode sensor chip was evaluated using a 100 µg/L Hg(II) solution and 200 µg/L As(III) solution. The results of 20 consecutive tests for Hg(II) and As(III) are shown in Figure 6a,d, respectively. The average response current for Hg(II) was 0.78 μA, with relative standard deviation (RSD) of 0.85%. The average response current for As(III) was 1.11 μA, with RSD of 2.75%.
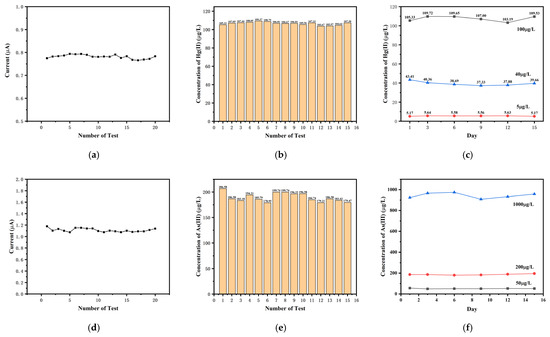
Figure 6.
The response current for 20 consecutive tests in (a) 100 µg/L Hg(II) and (d) 200 µg/L As(III); the detection results of 15 consecutive tests in (b) 100 µg/L Hg(II) and (e) 200 µg/L As(III); the detection results in (c) 5 µg/L, 40 µg/L, and 100 µg/L Hg(II) and (f) 50 µg/L, 200 µg/L, and 1000 µg/L As(III) for the long-term (15 d) stability tests.
As shown in Figure 6b,e, 15 repetitive experiments were performed for determining the concentration of Hg(II) and As(III), respectively. The determined concentration results for Hg(II) ranged from 109.37 µg/L to 109.67 µg/L, with an RSD of 1.56%.The range of determined concentration results for As(III) was 178.95–206.58 µg/L, with an RSD of 4.61%. In the repeated experiments at the same concentration, the response currents and measured concentrations showed little variation, and the deviations were not significant.
In addition, the microelectrode sensor chip demonstrated excellent stability over 15 days. The detection results for 5 µg/L, 40 µg/L, and 100 µg/L Hg(II) are shown in Figure 6c, with RSDs for the stability experiments being 4.15%, 5.55%, and 2.54%, respectively. The detection results for 50 µg/L, 200 µg/L, and 1000 µg/L As(III) are shown in Figure 6f, with RSDs for the stability experiments being 4.88%, 2.81%, and 2.79%, respectively. The results indicated that the microelectrode sensor chip had good reproducibility and stability.
To achieve on-site detection of Hg(II) and As(III), the sensor must possess excellent anti-interference capability and selectivity. Therefore, anti-interference and selectivity experiments were conducted on the developed microelectrode sensor chip. In two separate solutions containing 20 μg/L Hg(II) and 50 μg/L As(III), interfering ions such as Bi2+, Cd2+, Cr6+, Pb2+, Sn2+ and Zn2+ were added at 10-fold concentrations. The developed chip was used to perform triplicate measurements on solutions both without and with the added 10-fold concentrated interfering ions. The anti-interference test results for Hg(II) and As(III) are shown in Figure 7a,b, respectively. For Hg(II) quantification, Bi2+ exhibited the most significant interference among the tested ions with a deviation of 8.97%, while Sn2+ displayed secondary interference at 6.40%. During As(III) analysis, Bi2+ again emerged as the primary interfering species (6.96% deviation), with Sn2+ acting as the secondary interferent (5.33% deviation), while other interfering ions had less impact on the current response, with deviations below 5%. Figure 7c,d present the selectivity test results, showing that the sensor’s response currents to other ions at 10-fold concentrations were less than 1%. These results indicate that the sensor exhibits satisfactory anti-interference capability and selectivity.
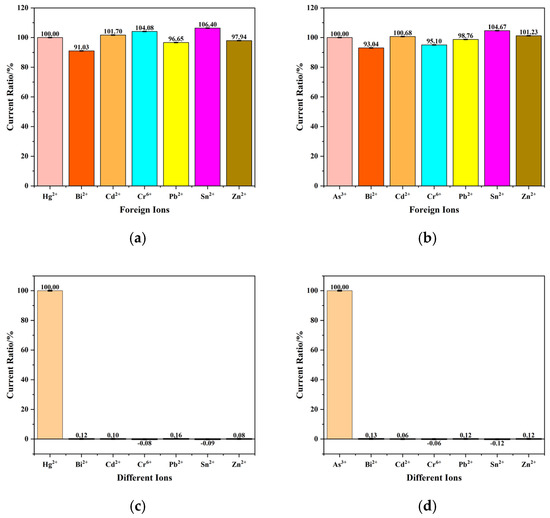
Figure 7.
(a) Interference test results and (c) selectivity test results at a Hg(II) concentration of 20 μg/L in the presence of interfering ions at a concentration of 200 μg/L. (b) Interference test results and (d) selectivity test results at a As(III) concentration of 50 μg/L in the presence of interfering ions at a concentration of 500 μg/L.
The analytical performances of the microelectrode sensor chip developed in this study were compared with other reported studies, including traditional analysis methods and electrochemical sensors, for detecting Hg(II) and As(III). As shown in Table 1, though the detection limit of the developed microelectrode sensor chip is not as low as the traditional analysis methods, it can conduct detection without a complicated preconcentration process and displayed a wide detection range and good stability. This advantageous characteristic can be attributed to the microelectrode chip fabricated using MEMS technology, which ensured the microstructure effect and the stability of the electrode. Moreover, the uniform distribution of the gold nanoparticles on the electrode provided an effective and stable electrochemical reaction surface for heavy metal ions, thereby increasing the quantity that can be reacted with.

Table 1.
Comparison of the analytical performance of the developed microelectrode sensor chip with other reported studies for detecting Hg(II) and As(III).
3.5. Determination in Actual Water Samples
The microelectrode sensor chip was utilized to detect the concentrations of Hg(II) and As(III) in real water samples collected from a local lake. Prior to testing, HCl was added to the real water samples to adjust them to a suitable detection environment. Both the developed chip and atomic fluorescence spectrometry (AFS) were employed to analyze the real water samples, but neither Hg(II) nor As(III) were detected in the samples. To evaluate the detection capability of the system for real water samples, different concentrations of standard Hg(II) and As(III) solutions were spiked into three separate samples to simulate the presence of Hg(II) and As(III) ions in real water and determine their concentrations. The detection results are presented in Table 2, which shows the spiked ion concentrations, the concentrations measured by the chip, and the recoveries. As shown in Table 2, the recoveries for Hg(II) ions ranged from 91% to 95%, while those for As(III) ranged from 89% to 107%. The test results demonstrate that the developed chip has the potential to be applied for the detection of Hg(II) and As(III) in real water samples.
Table 2.
Results of the standard addition experiment for Hg(II) and As(III) determination in real water samples.
4. Conclusions
A microelectrode sensor chip was fabricated using MEMS technology for the electrochemical detection of heavy metal ions Hg(II) and As(III). This sensor chip integrates the working electrode and counter electrode on the same silicon wafer, offering advantages such as miniaturization, ease of mass production, and low cost. The microelectrode modified with gold nanoparticles can quantitatively detect Hg(II) and As(III) with a wide detection range and with detection limits of 1.4 µg/L and 2.4 µg/L, respectively. Moreover, good reproducibility and stability were displayed, which can be attributed to the microelectrode chip fabricated using MEMS technology and the uniform distribution of the gold nanoparticles on the electrode. Moreover, satisfactory anti-interference capability and selectivity were displayed by the sensor. With these characteristics, this microelectrode sensor chip facilitates the detection of water samples with a wide range of heavy metal concentrations across diverse scenarios. Furthermore, systematic investigations will be conducted to evaluate the effects of critical environmental parameters (e.g., pH, temperature) on the sensor’s performance, aiming to enhance its field deployability.
Author Contributions
Conceptualization, Y.L. (Yang Li), C.B. and Z.Z.; methodology, Y.L. (Yang Li), C.B. and Z.Z.; validation, Z.Z. and Y.L. (Yuqi Liu); formal analysis, Z.Z.; investigation, Z.Z.; resources, Z.Z.; data curation, Z.Z. and Y.L. (Yuqi Liu); writing—original draft preparation, Z.Z.; writing—review and editing, Y.L. (Yang Li) and C.B.; visualization, Z.Z.; supervision, Y.L. (Yang Li) and C.B.; project administration, Y.L. (Yang Li) and C.B.; funding acquisition, Y.L. (Yang Li) and C.B. All authors have read and agreed to the published version of the manuscript.
Funding
This work is supported by the National Natural Science Foundation of China (No.U23A20292) and the National Key R&D Program of China (No.2021YFB3201400).
Institutional Review Board Statement
Not applicable.
Informed Consent Statement
Not applicable.
Data Availability Statement
The data that support the findings of this study are available from the corresponding authors upon reasonable request.
Conflicts of Interest
The authors declare no conflicts of interest.
References
- García-Miranda Ferrari, A.; Carrington, P.; Rowley-Neale, S.J.; Banks, C.E. Recent advances in portable heavy metal electrochemical sensing platforms. Environ. Sci. Water Res. Technol. 2020, 6, 2676–2690. [Google Scholar] [CrossRef]
- Jose, J.; Prakash, P.; Jeyaprabha, B.; Abraham, R.; Mathew, R.M.; Zacharia, E.S.; Thomas, V.; Thomas, J. Principle, design, strategies, and future perspectives of heavy metal ion detection using carbon nanomaterial-based electrochemical sensors: A review. J. Iran. Chem. Soc. 2023, 20, 775–791. [Google Scholar] [CrossRef]
- Lin, Y.; Peng, Y.; Di, J. Electrochemical detection of Hg(II) ions based on nanoporous gold nanoparticles modified indium tin oxide electrode. Sens. Actuators B Chem. 2015, 220, 1086–1090. [Google Scholar] [CrossRef]
- Saint’Pierre, T.D.; Rocha, R.C.C.; Duyck, C.B. Determination of Hg in water associate to crude oil production by electrothermal vaporization inductively coupled plasma mass spectrometry. Microchem. J. 2013, 109, 41–45. [Google Scholar] [CrossRef]
- Li, Z.; Wang, Y.; Ni, Y.; Kokot, S. A rapid and label-free dual detection of Hg (II) and cysteine with the use of fluorescence switching of graphene quantum dots. Sens. Actuators B Chem. 2015, 207, 490–497. [Google Scholar] [CrossRef]
- Gao, Z.; Ma, X. Speciation analysis of mercury in water samples using dispersive liquid–liquid microextraction combined with high-performance liquid chromatography. Anal. Chim. Acta 2011, 702, 50–55. [Google Scholar] [CrossRef]
- Alves, E.M.; Rodrigues, R.J.; Dos Santos Correa, C.; Fidemann, T.; Rocha, J.C.; Buzzo, J.L.L.; de Oliva Neto, P.; Nunez, E.G.F. Use of ultraviolet-visible spectrophotometry associated with artificial neural networks as an alternative for determining the water quality index. Environ. Monit. Assess. 2018, 190, 319. [Google Scholar] [CrossRef]
- Palanisamy, S.; Karuppiah, C.; Chen, S.-M.; Periakaruppan, P. Highly sensitive and selective amperometric nitrite sensor based on electrochemically activated graphite modified screen printed carbon electrode. J. Electroanal. Chem. 2014, 727, 34–38. [Google Scholar] [CrossRef]
- Cheng, H.; Yang, J. Preparation of Ti3C2-PANI Composite as Sensor for Electrochemical Determination of Mercury Ions in Water. Int. J. Electrochem. Sci. 2020, 15, 2295–2306. [Google Scholar] [CrossRef]
- Bu, L.; Xie, Q.; Ming, H. Gold nanoparticles decorated three-dimensional porous graphitic carbon nitrides for sensitive anodic stripping voltammetric analysis of trace arsenic(III). J. Alloys Compd. 2020, 823, 153723. [Google Scholar] [CrossRef]
- Hu, H.; Xie, B.; Lu, Y.; Zhu, J. Advances in Electrochemical Detection Electrodes for As(III). Nanomaterials 2022, 12, 781. [Google Scholar] [CrossRef] [PubMed]
- Ramalingam, M.; Ponnusamy, V.K.; Sangilimuthu, S.N. A nanocomposite consisting of porous graphitic carbon nitride nanosheets and oxidized multiwalled carbon nanotubes for simultaneous stripping voltammetric determination of cadmium(II), mercury(II), lead(II) and zinc(II). Mikrochim. Acta 2019, 186, 69. [Google Scholar] [CrossRef] [PubMed]
- Kempegowda, R.; Antony, D.; Malingappa, P. Graphene–platinum nanocomposite as a sensitive and selective voltammetric sensor for trace level arsenic quantification. Int. J. Smart Nano Mater. 2014, 5, 17–32. [Google Scholar] [CrossRef]
- Gupta, S.; Singh, R.; Anoop, M.D.; Kulshrestha, V.; Srivastava, D.N.; Ray, K.; Kothari, S.L.; Awasthi, K.; Kumar, M. Electrochemical sensor for detection of mercury (II) ions in water using nanostructured bismuth hexagons. Appl. Phys. A 2018, 124, 737. [Google Scholar] [CrossRef]
- Sahoo, S.; Satpati, A.K.; Reddy, A.V. Electrochemically deposited gold nanoparticles on a carbon paste electrode surface for the determination of mercury. J. AOAC Int. 2015, 98, 506–511. [Google Scholar] [CrossRef]
- Hu, H.; Lu, W.; Liu, X.; Meng, F.; Zhu, J. A High-Response Electrochemical As(III) Sensor Using Fe3O4–rGO Nanocomposite Materials. Chemosensors 2021, 9, 150. [Google Scholar] [CrossRef]
- Dutta, S.; Strack, G.; Kurup, P. Gold nanostar electrodes for heavy metal detection. Sens. Actuators B Chem. 2019, 281, 383–391. [Google Scholar] [CrossRef]
- Zhao, H.; Li, Y.; Cong, A.; Tong, J.; Bian, C. Ultramicro Interdigitated Array Electrode Chip with Optimized Construction for Detection of Ammonia Nitrogen in Water. Micromachines 2023, 14, 629. [Google Scholar] [CrossRef]
- Tanwar, A.; Gandhi, H.A.; Kushwaha, D.; Bhattacharya, J. A review on microelectrode array fabrication techniques and their applications. Mater. Today Chem. 2022, 26, 101153. [Google Scholar] [CrossRef]
- Bani-Yaseen, A.D.; Kawaguchi, T.; Jankowiak, R. Electrochemically deposited metal nanoparticles for enhancing the performance of microfluidic MEMS in biochemical analysis. Int. J. Nanomanufact. 2009, 4, 99–107. [Google Scholar] [CrossRef]
- Wang, J.; Bian, C.; Tong, J.; Sun, J.; Xia, S. L-Aspartic acid/L-cysteine/gold nanoparticle modified microelectrode for simultaneous detection of copper and lead. Thin Solid Films 2012, 520, 6658–6663. [Google Scholar] [CrossRef]
- Xiao, D.; Zhai, J.; Shen, Z.; Wang, Q.; Wei, S.; Li, Y.; Bian, C. A Novel Thin-Layer Flow Cell Sensor System Based on BDD Electrode for Heavy Metal Ion Detection. Micromachines 2024, 15, 363. [Google Scholar] [CrossRef] [PubMed]
- Gumpu, M.B.; Sethuraman, S.; Krishnan, U.M.; Rayappan, J.B.B. A review on detection of heavy metal ions in water—An electrochemical approach. Sens. Actuators B Chem. 2015, 213, 515–533. [Google Scholar] [CrossRef]
- Zheng, H.; Hong, J.; Luo, X.; Li, S.; Wang, M.; Yang, B.; Wang, M. Combination of sequential cloud point extraction and hydride generation atomic fluorescence spectrometry for preconcentration and determination of inorganic and methyl mercury in water samples. Microchem. J. 2019, 145, 806–812. [Google Scholar] [CrossRef]
- Thongsaw, A.; Sananmuang, R.; Udnan, Y.; Ampiah-Bonney, R.J.; Chaiyasith, W.C. Immobilized activated carbon as sorbent in solid phase extraction with cold vapor atomic absorption spectrometry for the preconcentration and determination of mercury species in water and freshwater fish samples. Anal. Sci. 2019, 35, 1195–1202. [Google Scholar]
- Zhu, Z.; Liu, J.; Zhang, S.; Na, X.; Zhang, X. Evaluation of a hydride generation-atomic fluorescence system for the determination of arsenic using a dielectric barrier discharge atomizer. Anal. Chim. Acta 2008, 607, 136–141. [Google Scholar] [CrossRef]
- Han, M.; Xie, Y.; Wang, R.; Li, Y.; Bian, C.; Xia, S. 4-Mercaptopyridine-Modified Sensor for the Sensitive Electrochemical Detection of Mercury Ions. Micromachines 2023, 14, 739. [Google Scholar] [CrossRef]
- Shakeel, S.; Talpur, F.N.; Sirajuddin; Anwar, N.; Iqbal, M.A.; Ibrahim, A.; Afridi, H.I.; Unar, A.; Khalid, A.; Ahmed, I.A.; et al. Xanthan Gum-Mediated Silver Nanoparticles for Ultrasensitive Electrochemical Detection of Hg2+ Ions from Water. Catalysts 2023, 13, 208. [Google Scholar] [CrossRef]
- Bernalte, E.; Arévalo, S.; Pérez-Taborda, J.; Wenk, J.; Estrela, P.; Avila, A.; Di Lorenzo, M. Rapid and on-site simultaneous electrochemical detection of copper, lead and mercury in the Amazon river. Sens. Actuators B Chem. 2020, 307, 127620. [Google Scholar] [CrossRef]
- Gumpu, M.B.; Veerapandian, M.; Krishnan, U.M.; Rayappan, J.B. Simultaneous electrochemical detection of Cd(II), Pb(II), As(III) and Hg(II) ions using ruthenium(II)-textured graphene oxide nanocomposite. Talanta 2017, 162, 574–582. [Google Scholar] [CrossRef]
- Ismail, S.; Yusof, N.A.; Abdullah, J.; Abd Rahman, S.F. Electrochemical Detection of Arsenite Using a Silica Nanoparticles-Modified Screen-Printed Carbon Electrode. Materials 2020, 13, 3168. [Google Scholar] [CrossRef] [PubMed]
- Chen, C.; Yu, S.; Jiang, S.; Liu, J.; Wang, Z.; Ye, B.C. A novel and sensitive electrochemical sensor based on nanoporous gold for determination of As(III). Mikrochim. Acta 2020, 187, 395. [Google Scholar] [CrossRef] [PubMed]
- Nodehi, M.; Baghayeri, M.; Veisi, H. Preparation of GO/Fe3O4@PMDA/AuNPs nanocomposite for simultaneous determination of As3+ and Cu2+ by stripping voltammetry. Talanta 2021, 230, 122288. [Google Scholar] [CrossRef] [PubMed]
- Khamcharoen, W.; Duchda, P.; Songsrirote, K.; Ratanawimarnwong, N.; Limchoowong, N.; Jittangprasert, P.; Mantim, T.; Siangproh, W. An application of miniaturized electrochemical sensing for determination of arsenic in herbal medicines. Anal. Methods 2022, 14, 3087–3093. [Google Scholar] [CrossRef]
Disclaimer/Publisher’s Note: The statements, opinions and data contained in all publications are solely those of the individual author(s) and contributor(s) and not of MDPI and/or the editor(s). MDPI and/or the editor(s) disclaim responsibility for any injury to people or property resulting from any ideas, methods, instructions or products referred to in the content. |
© 2025 by the authors. Licensee MDPI, Basel, Switzerland. This article is an open access article distributed under the terms and conditions of the Creative Commons Attribution (CC BY) license (https://creativecommons.org/licenses/by/4.0/).