3.1. AFM Analysis
Along with the initial analysis presented in [
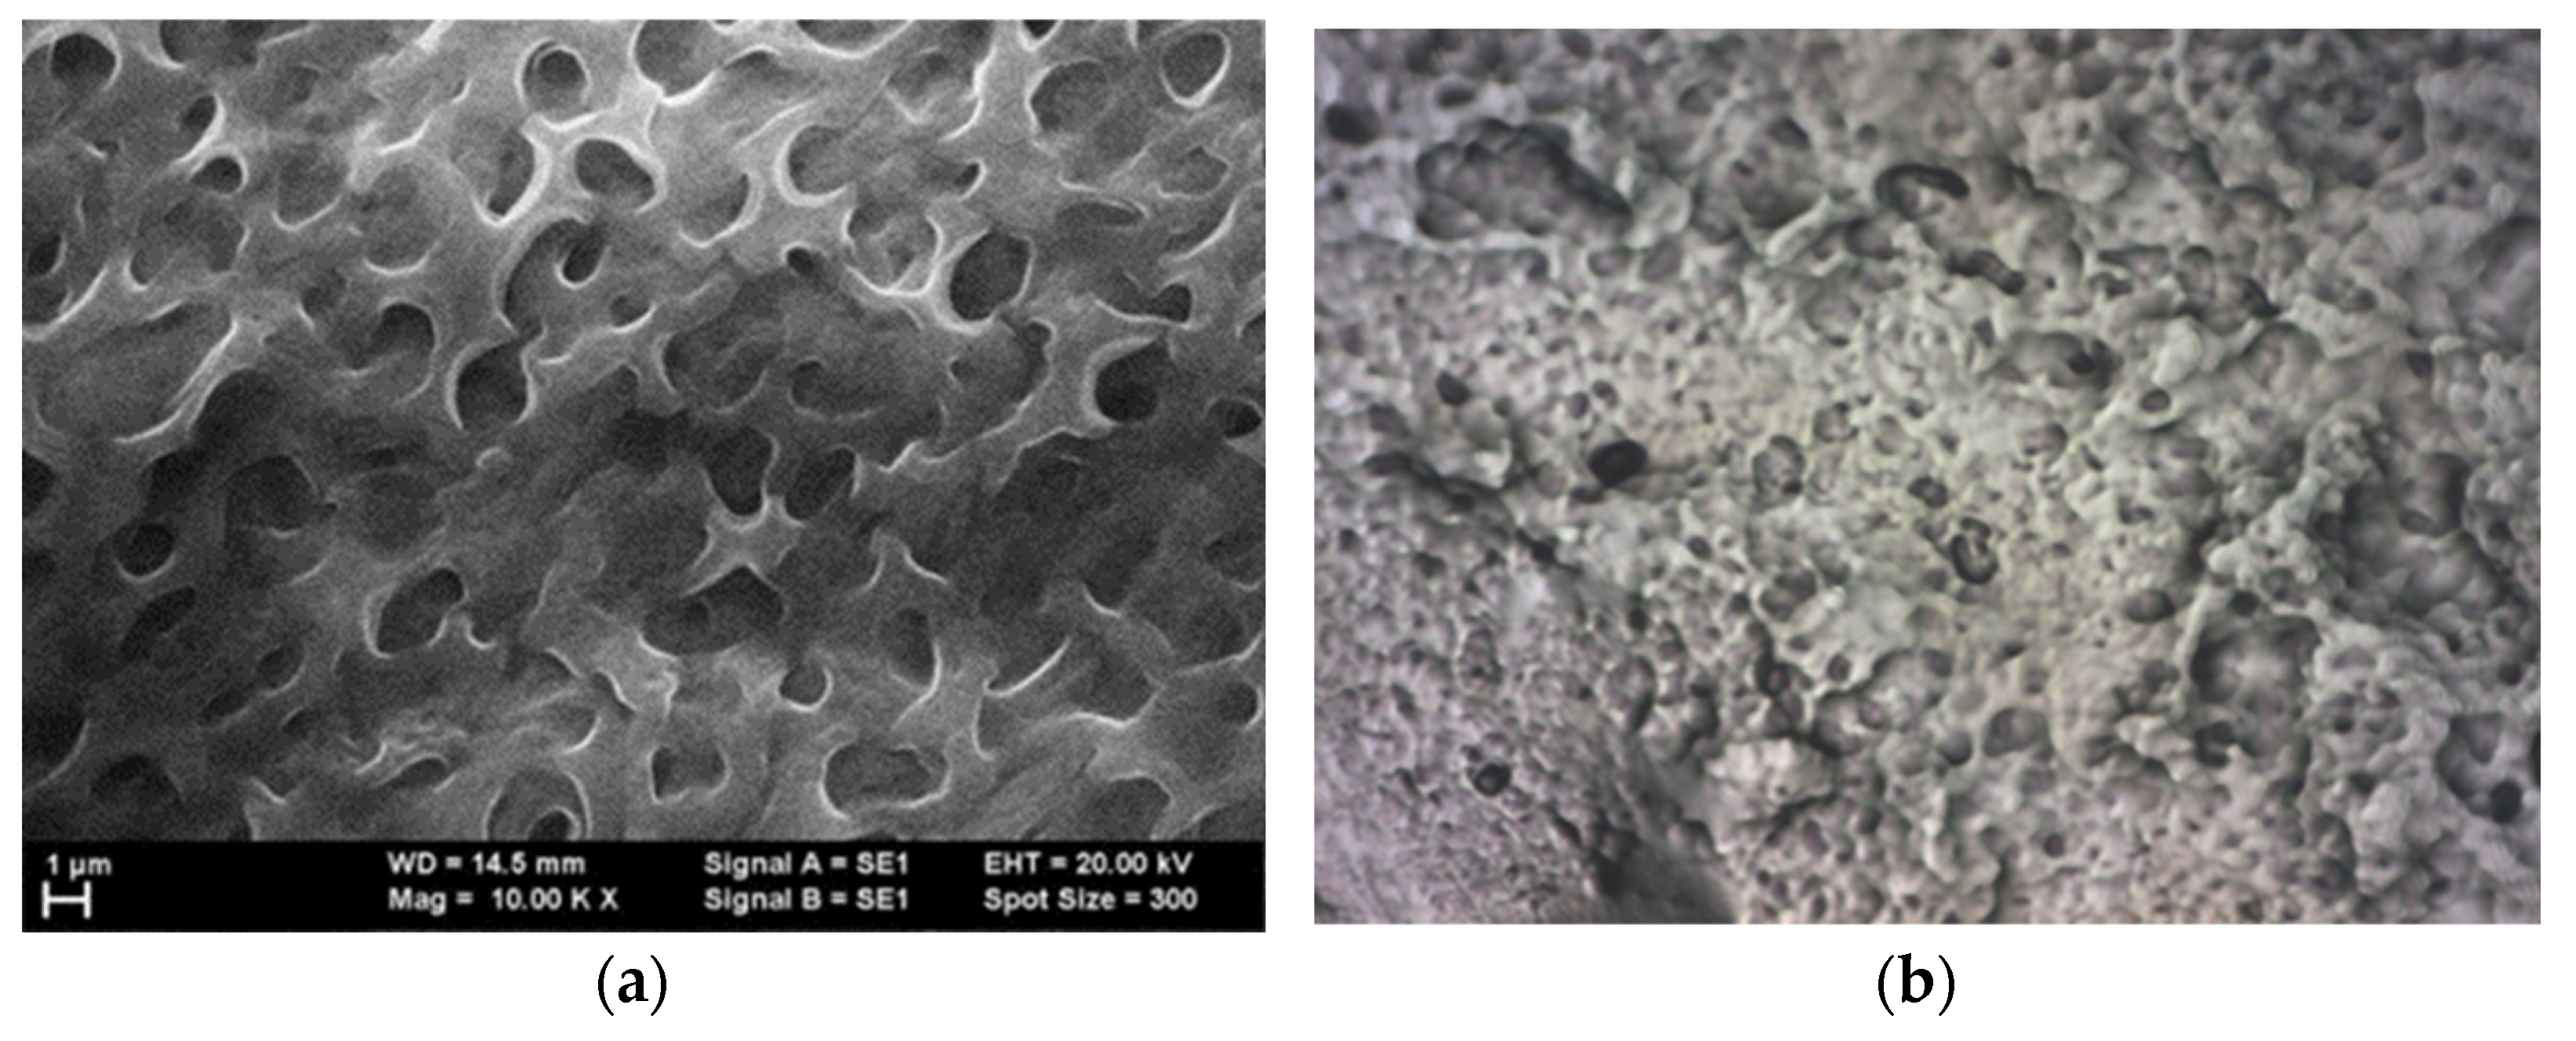
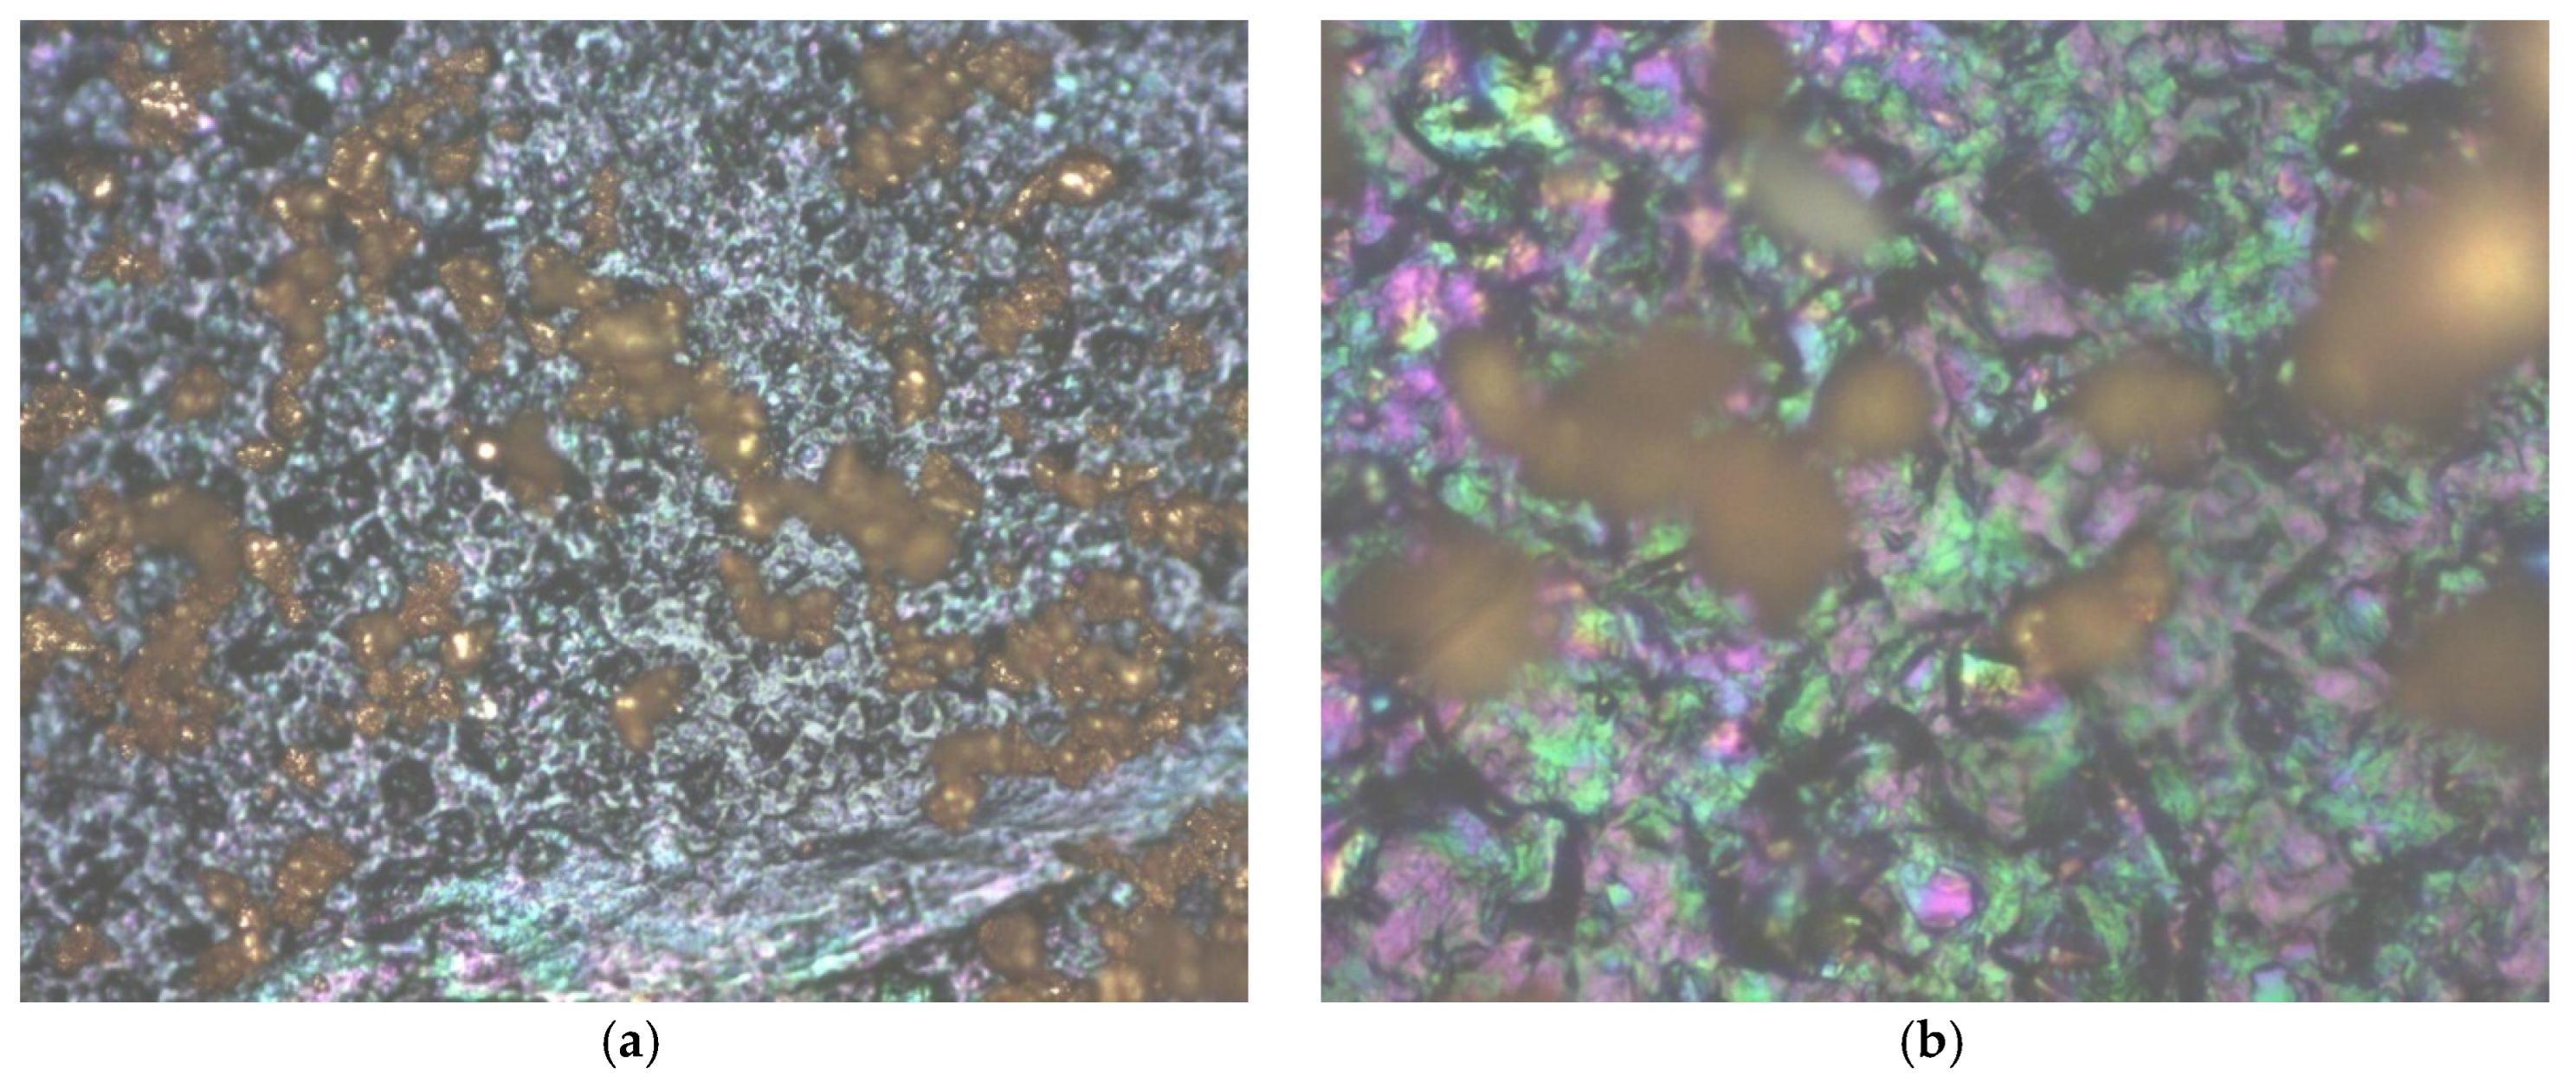
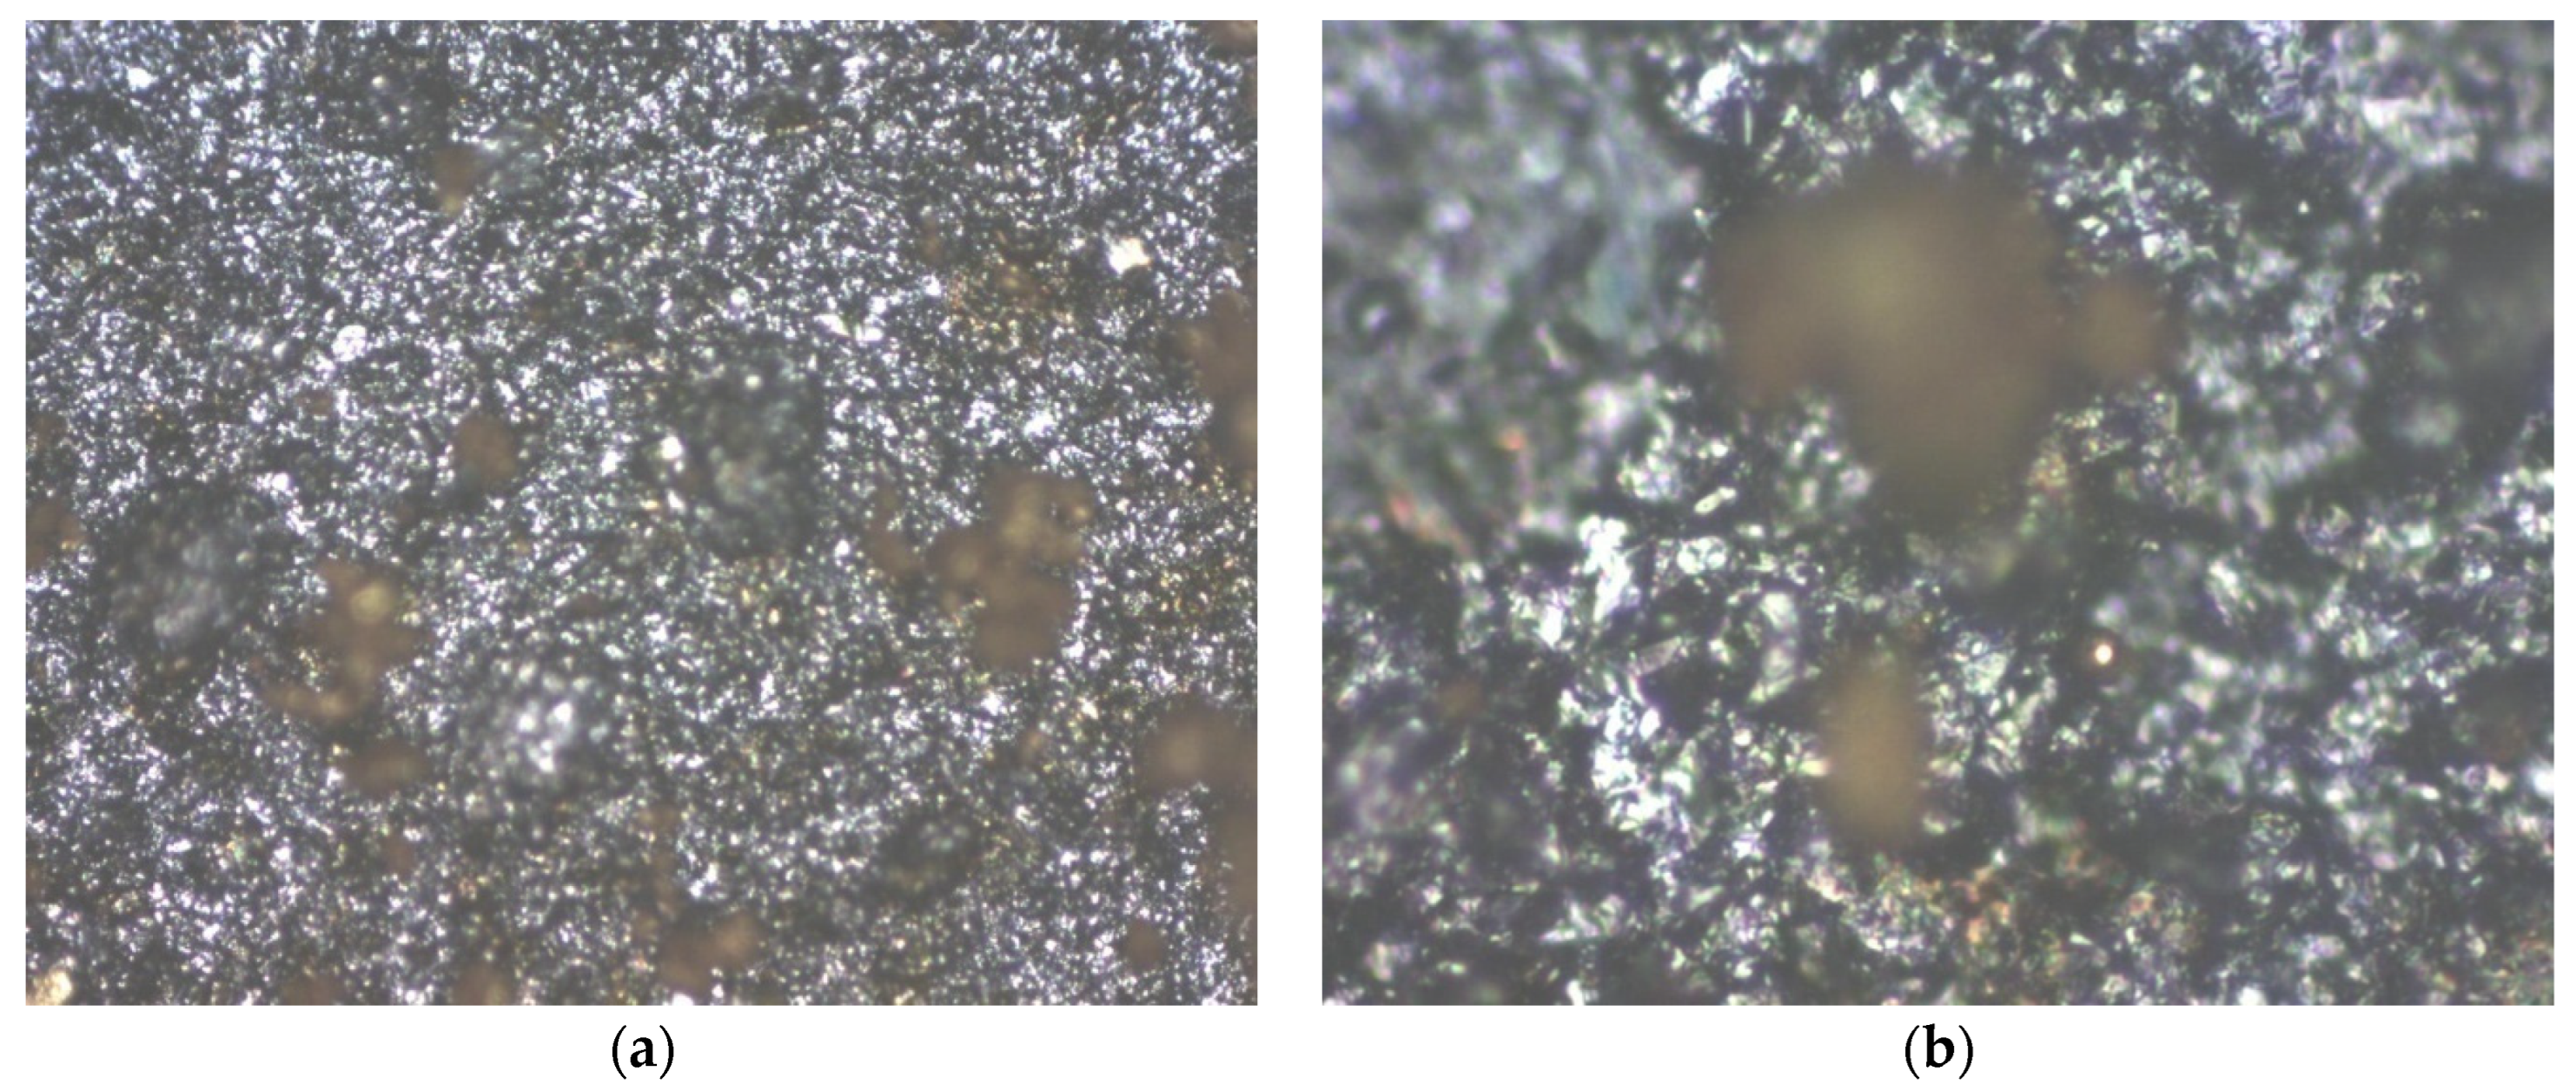
41], a SEM analysis was also introduced for all hybrid structures of graphene-conducting polymers. In the case of graphene covered with P3HT, although, at first glance, it seems to have a fairly uniform grain distribution,
Figure 1a), when relaying to the image at 500×
Figure 1b), it can be noticed that the roughness is quite high. Grains of different sizes but also smoother stretches can be observed,
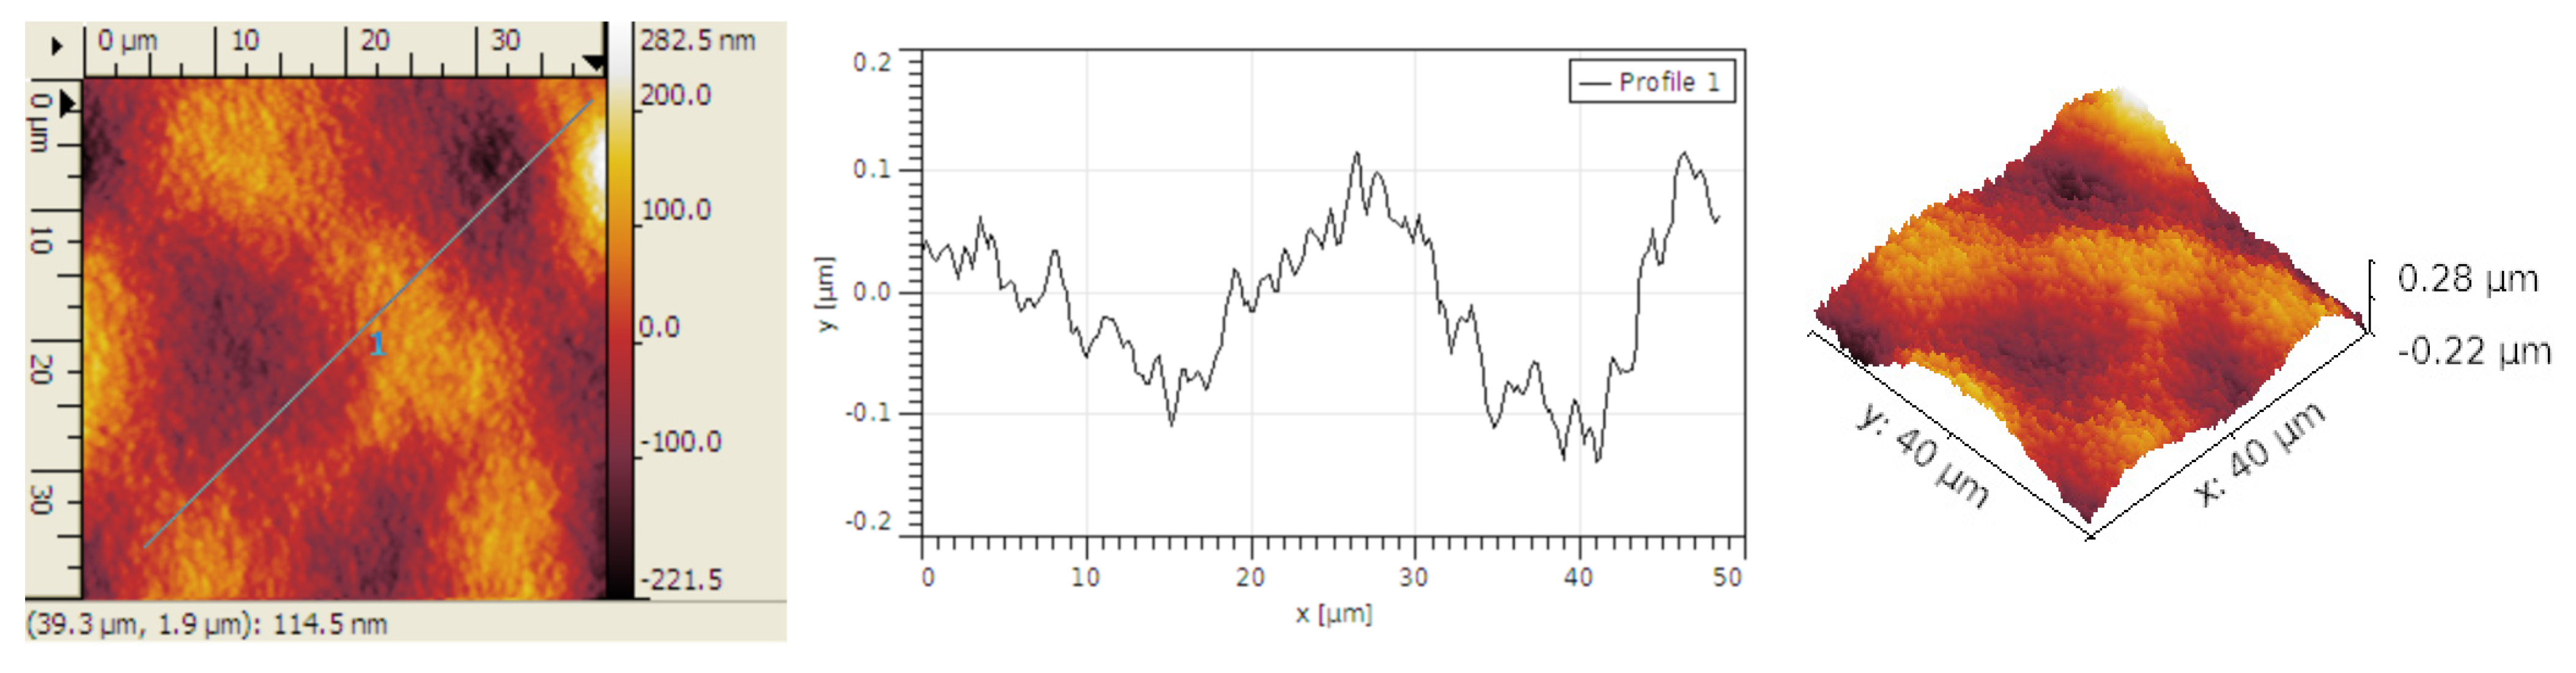
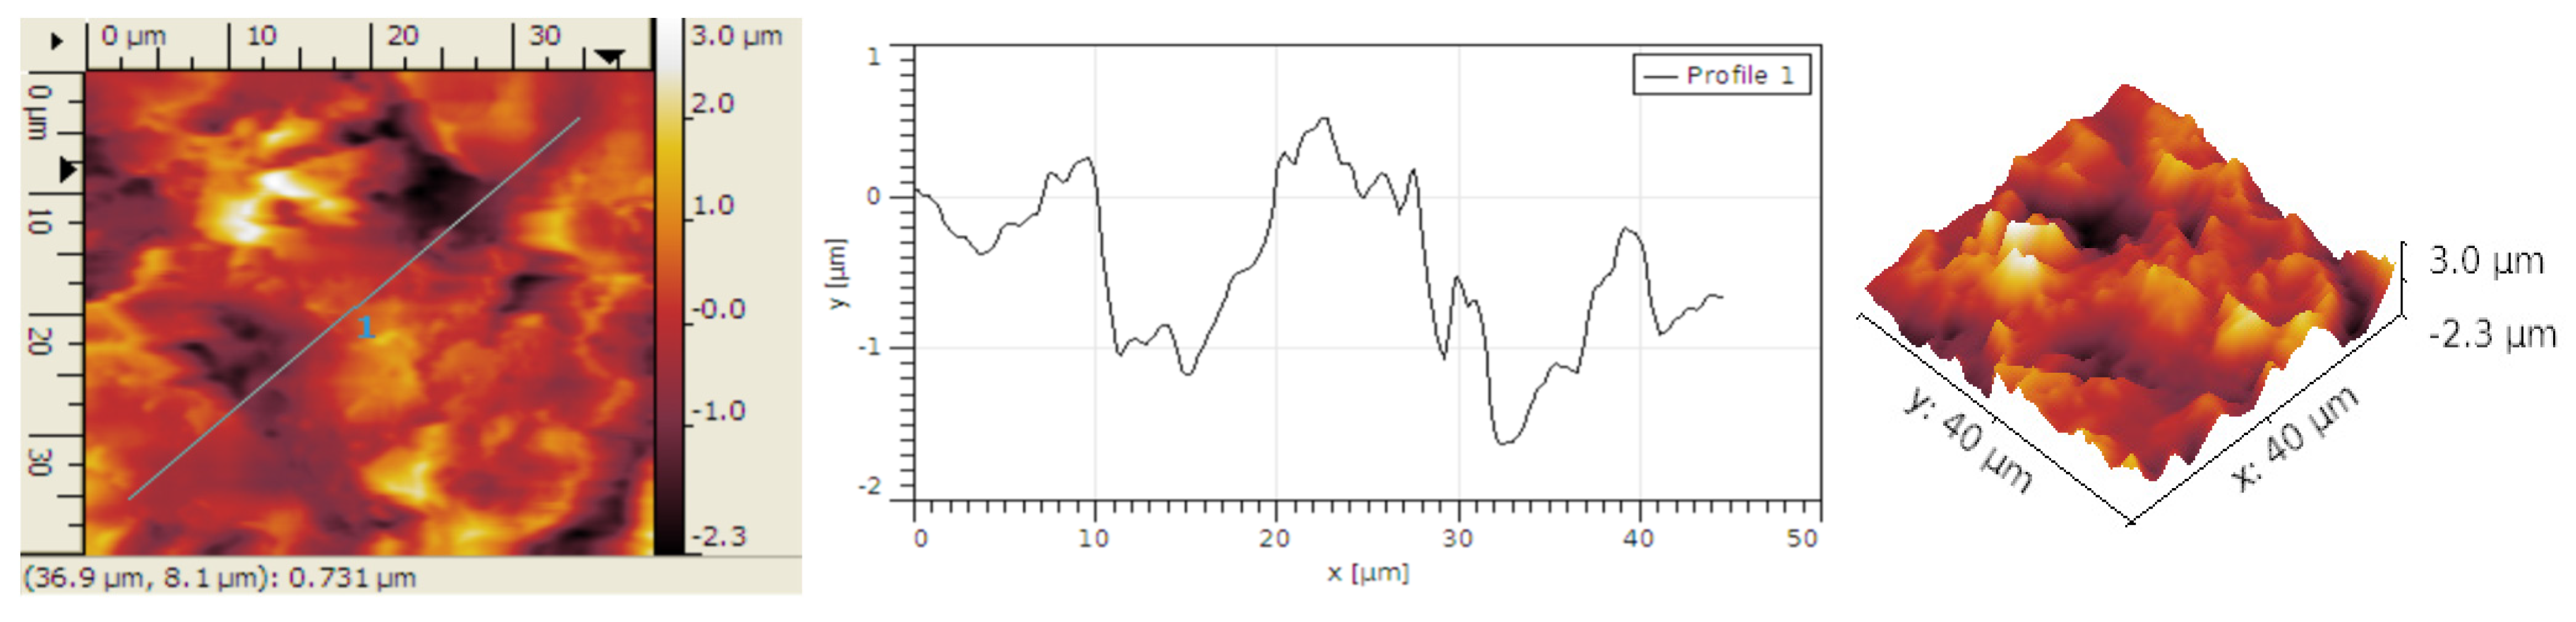
Figure 2.
The grain size is small, typically below 0.3 μm. The grains are typically organized in bigger groups. The Rku values are near 3,
Table 1, indicating that the grain distribution is fairly symmetrical. The Rsk values are minimal, and we can approximate a roughly equal percentage of peaks and hollow distributed across the surface.
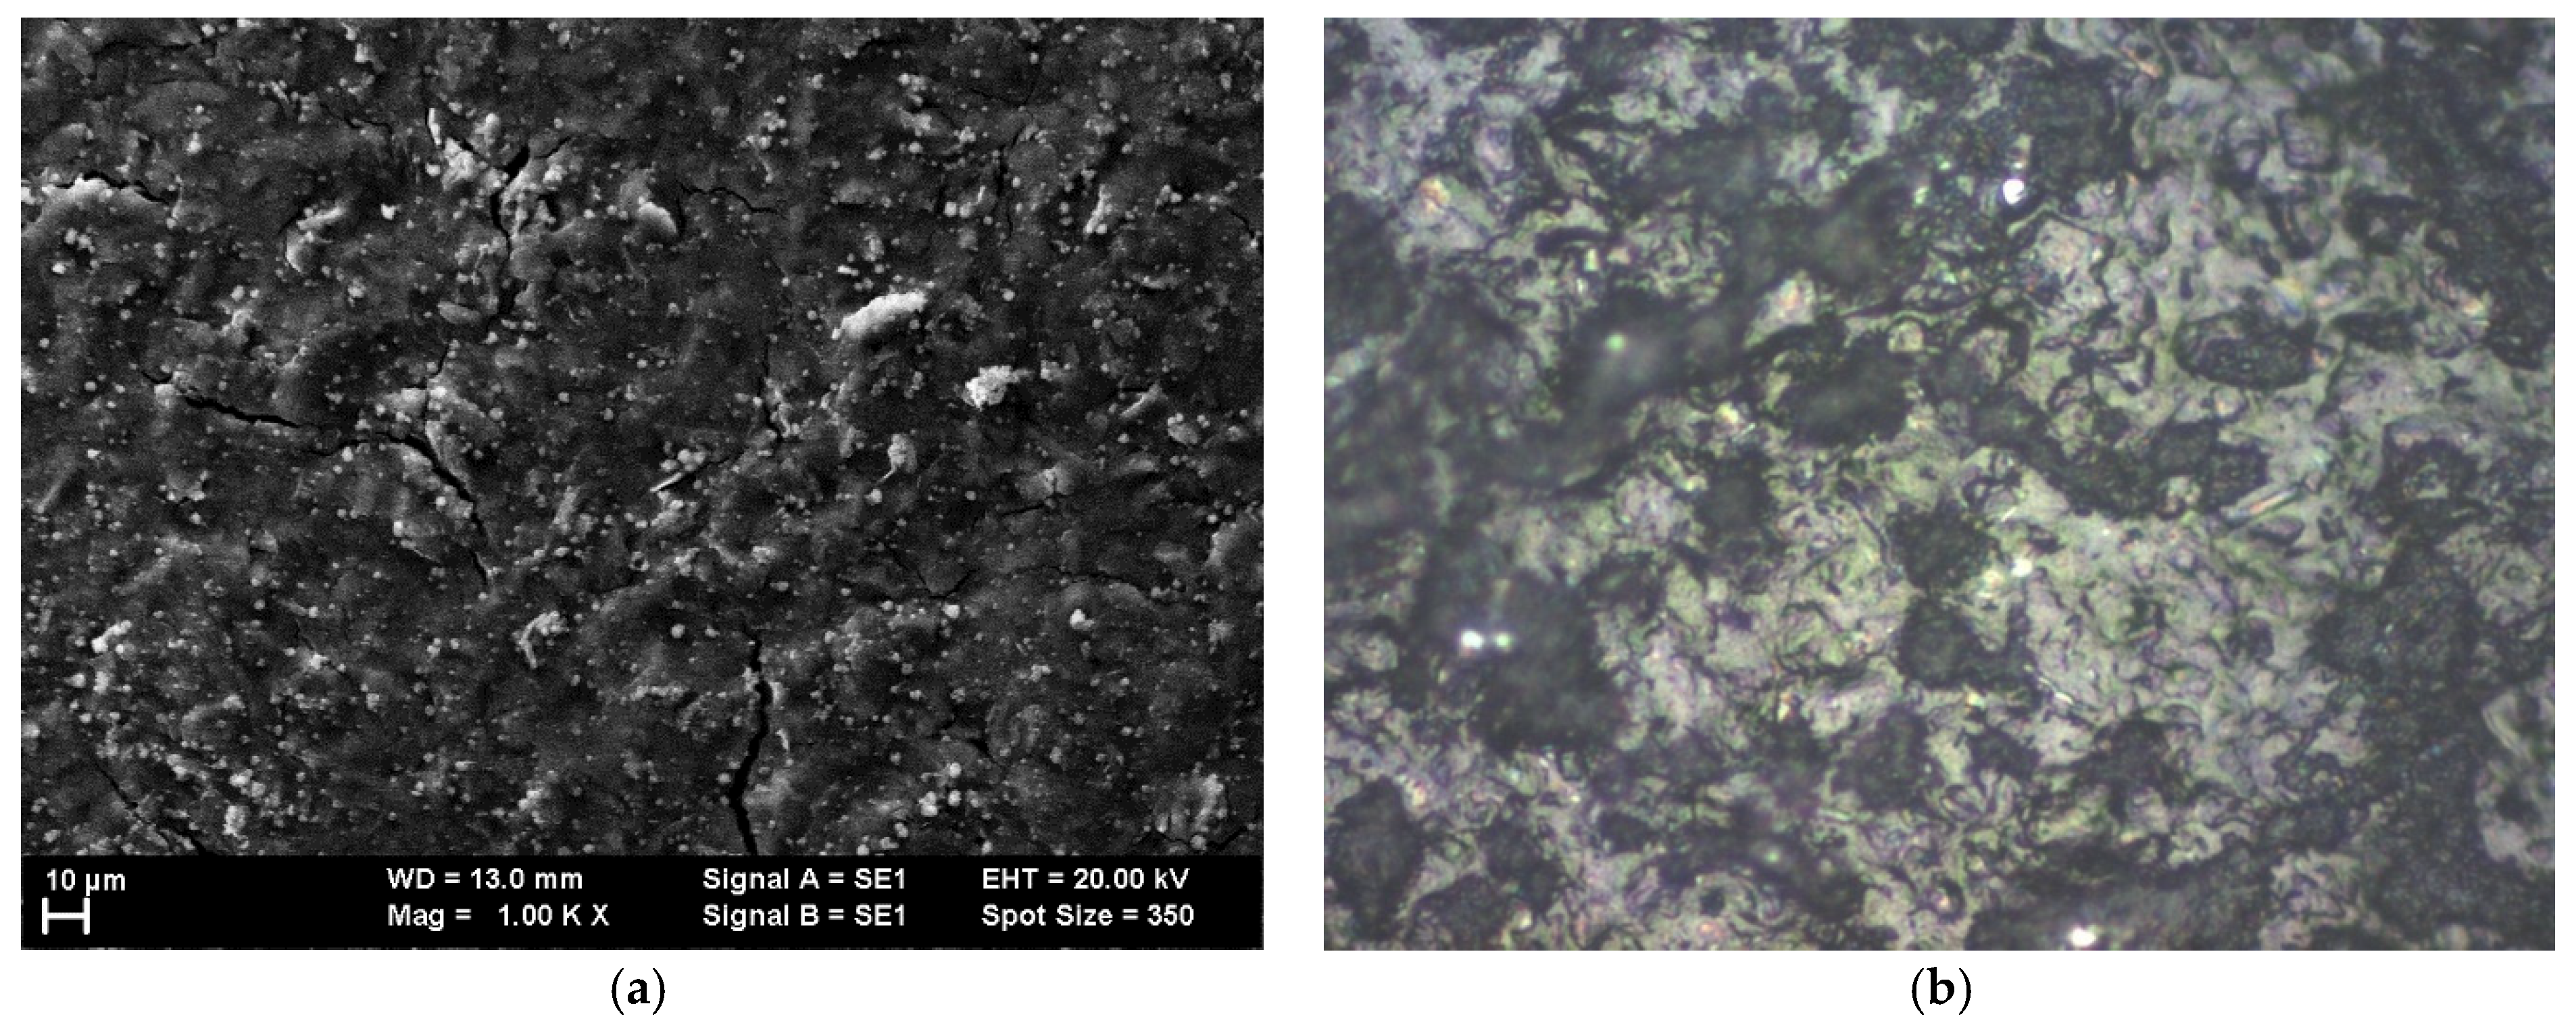
In the case of graphene covered with PANI-EB, we can evaluate a roughly equal percentage of peaks and valleys distributed across the surface, but here the grains are organized in smaller groups and present a higher density,
Figure 3. The grain size is larger, typically over 2.2 μm,
Figure 4, and their concentration is heightened. The Rku values remained near 3, indicating that the grain distribution is symmetrical. The Rsk values are also minimal, comparable with the values for graphene–P3HT structures, suggesting that polymer deposition creates a similar architecture, see
Table 2.
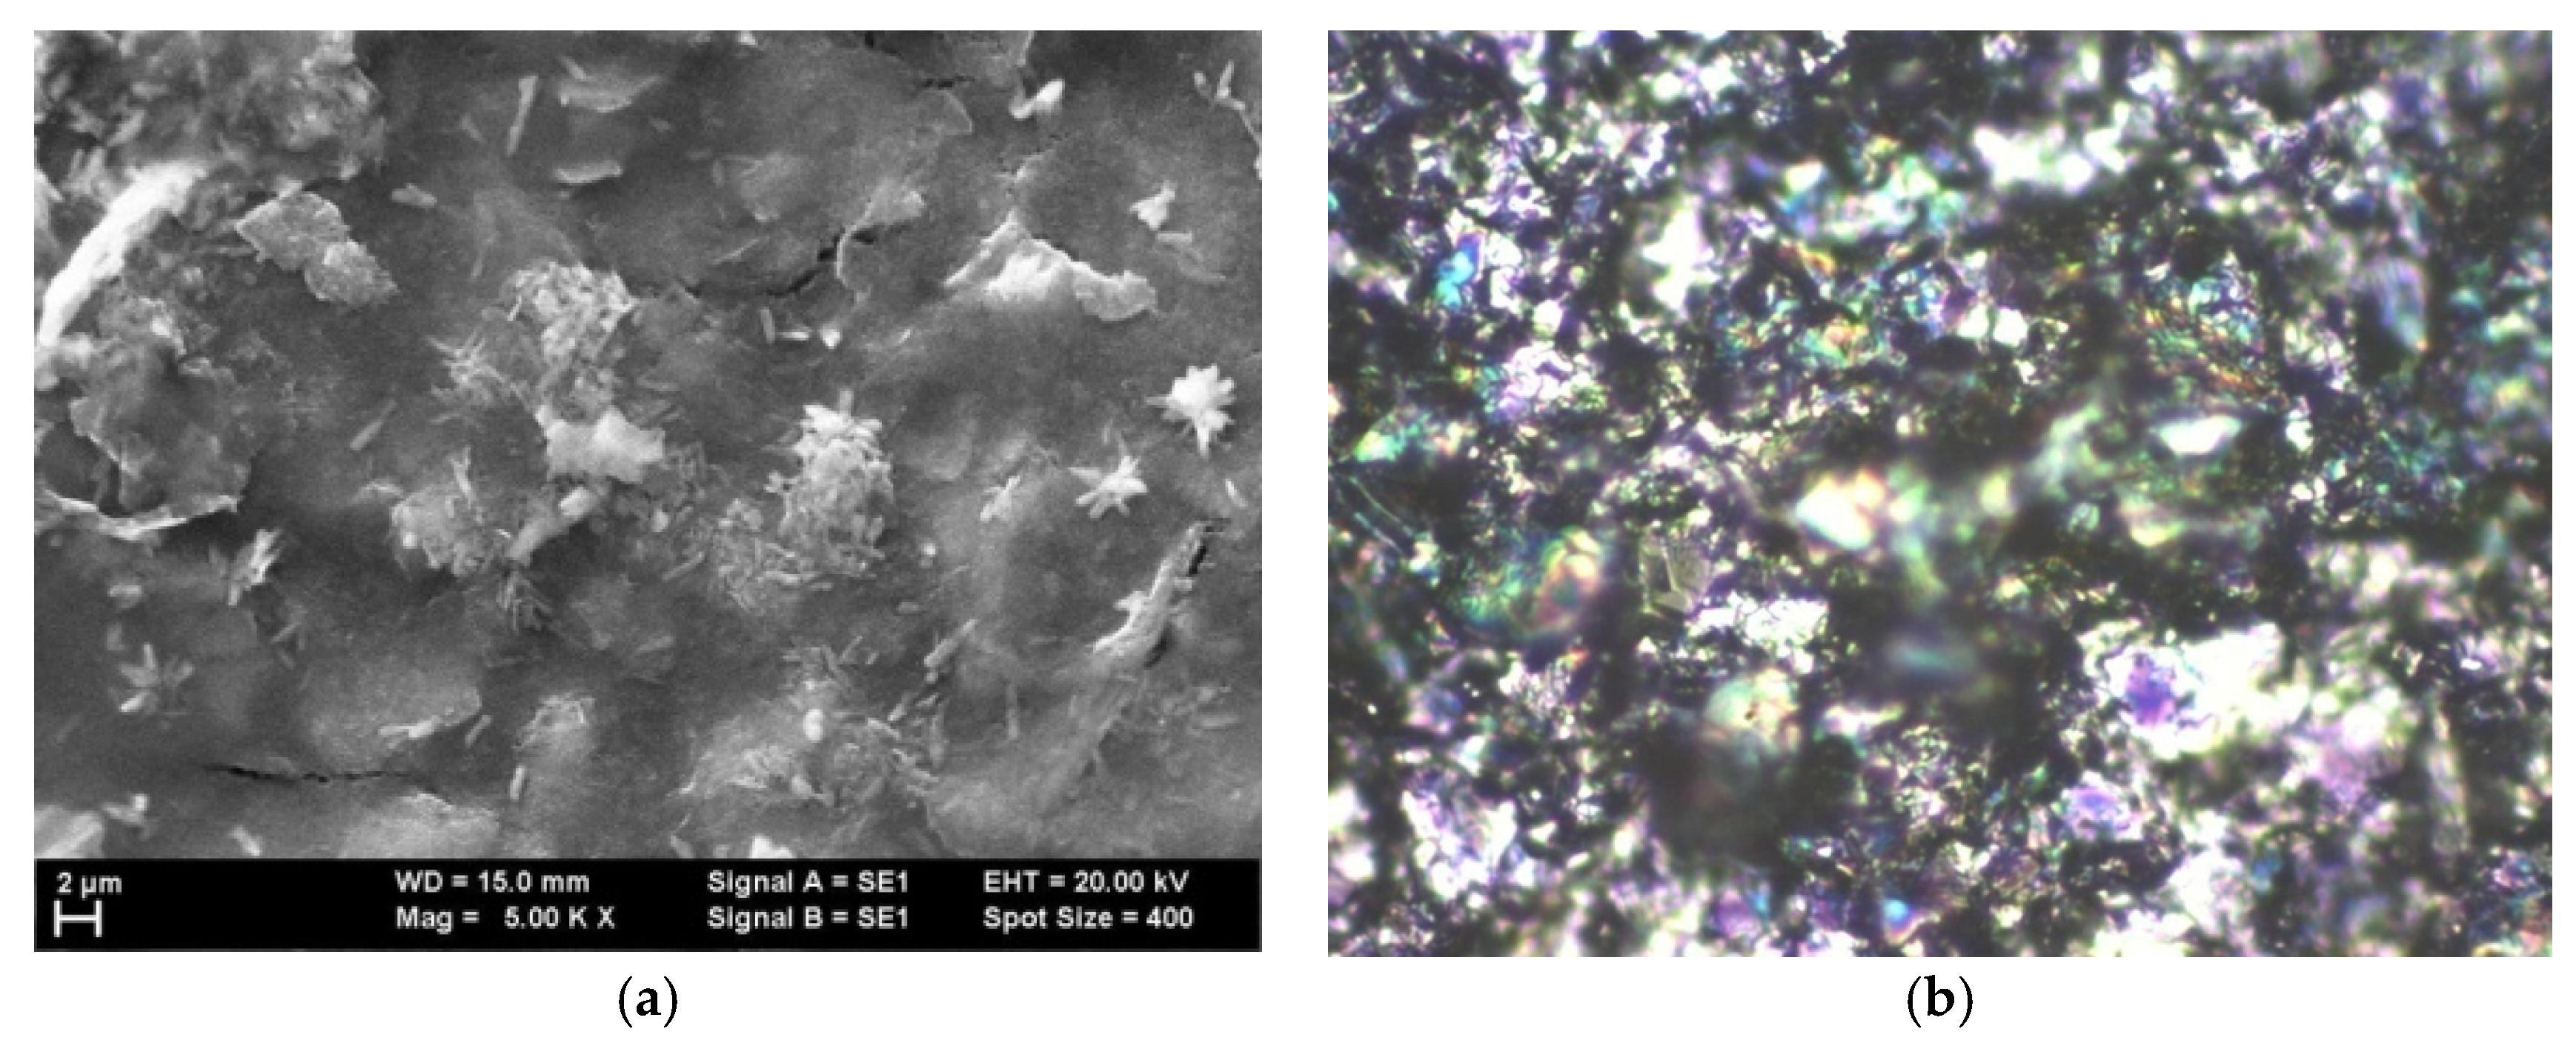
In the case of graphene covered with F8T2, a different topography is observed compared to the structures presented above. Analyzing
Figure 5, even if it seems to present a fairly uniform grain distribution, the roughness is much higher compared to the graphene deposited with P3HT or PANI-EB. The grains are arranged less uniformly, and there are grains of different sizes separated by smoother stretches.
The grain size is generally 3 μm,
Figure 6, about 10 times larger compared to the graphene deposited with P3HT, where the grain dimension was 0.28 μm. But the grain size for graphene–F8T2 assembly is in line with the dimension for graphene deposited with PANI-EB, of 2.2 μm. The grains are generally arranged in smaller clusters, and according to the values of R
Sk and R
ku the grain distribution is quite symmetrical,
Table 3.
In all, AFM emphasized a higher roughness in the case of F8T2 compared to P3HT or PANI-EB, and a larger dimension of grain size.
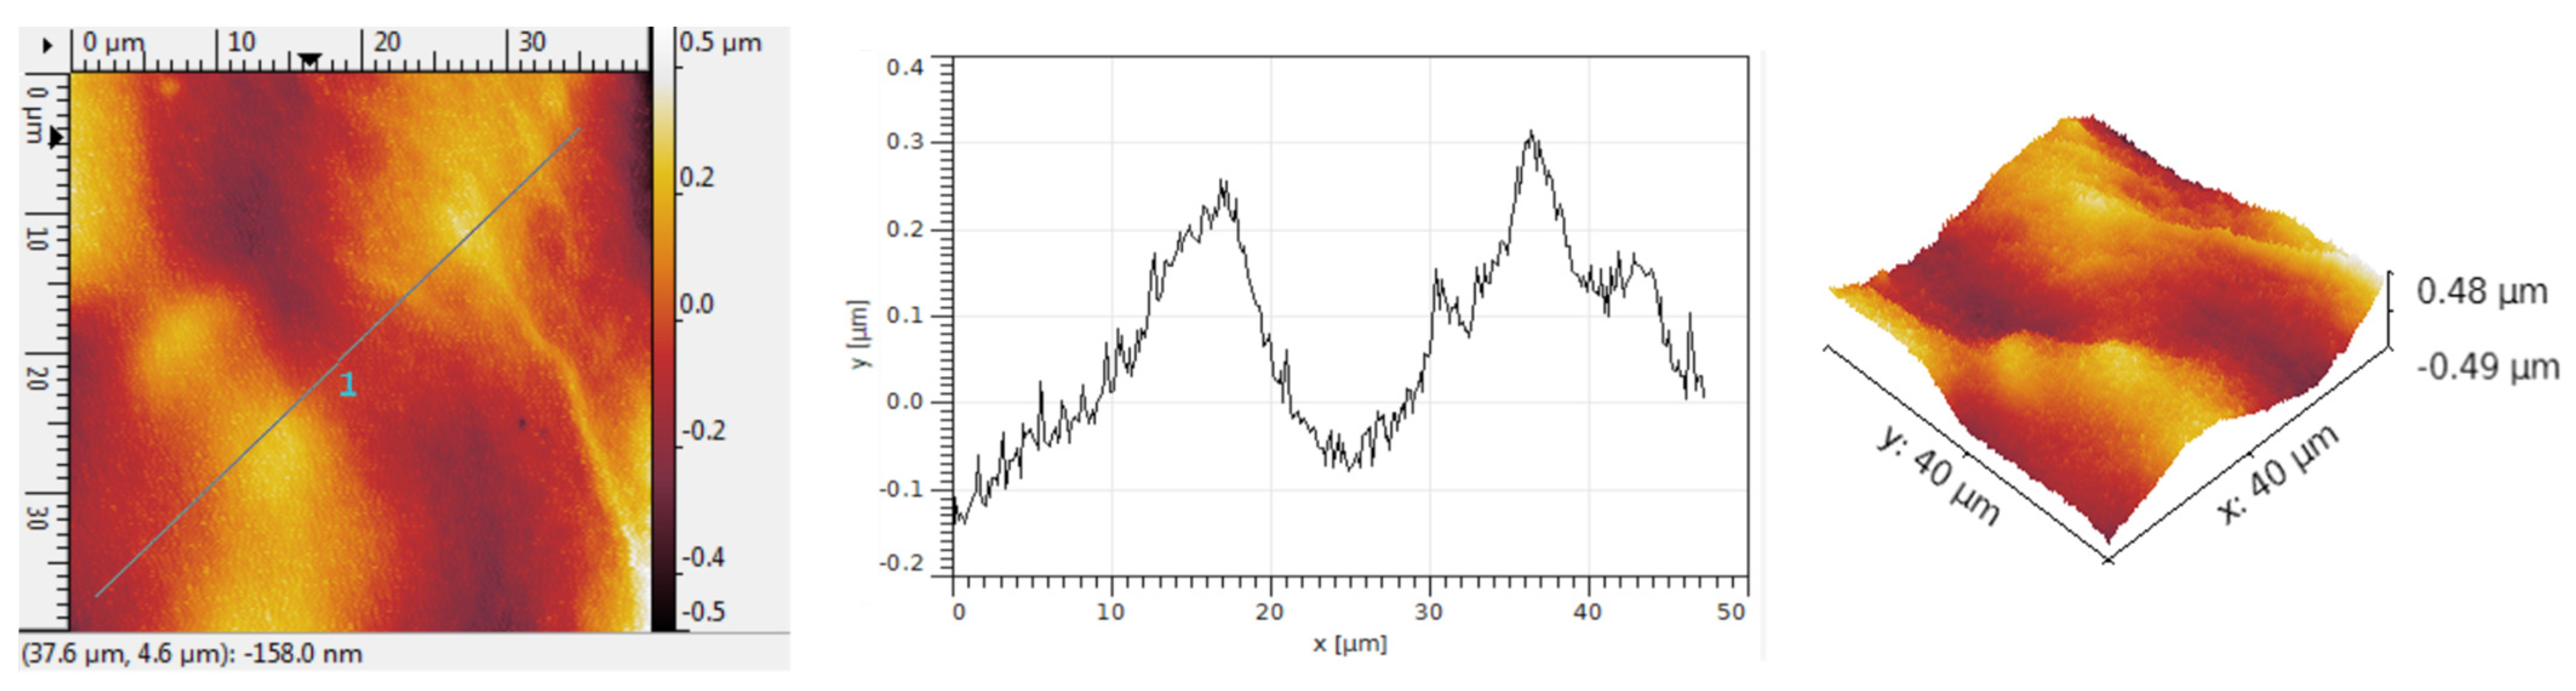
The analysis of the structure obtained after inserting Au nanoparticles within graphene–P3HT assembly is presented in
Figure 7. The existence of gold as quasi-spherical particles with the average dimension of approx. 100 nm is easily observable. However, at first glance, the number of gold particles bonded to the polymer is quite minimal.
The grain size typically measures 0.48 μm, consistent with the size of graphene deposited with PANI-EB without the addition of Au, as shown in
Figure 8. The grains are usually organized in smaller groups too. The R
Sk values are elevated, suggesting the formation of distinct hollows post-Au deposition; however, the structure of these hollows is scattered due to the limited number of Au particles. The R
ku values exceed 4, indicating that the grain symmetry is somewhat altered by the addition of Au, as shown in
Table 4.
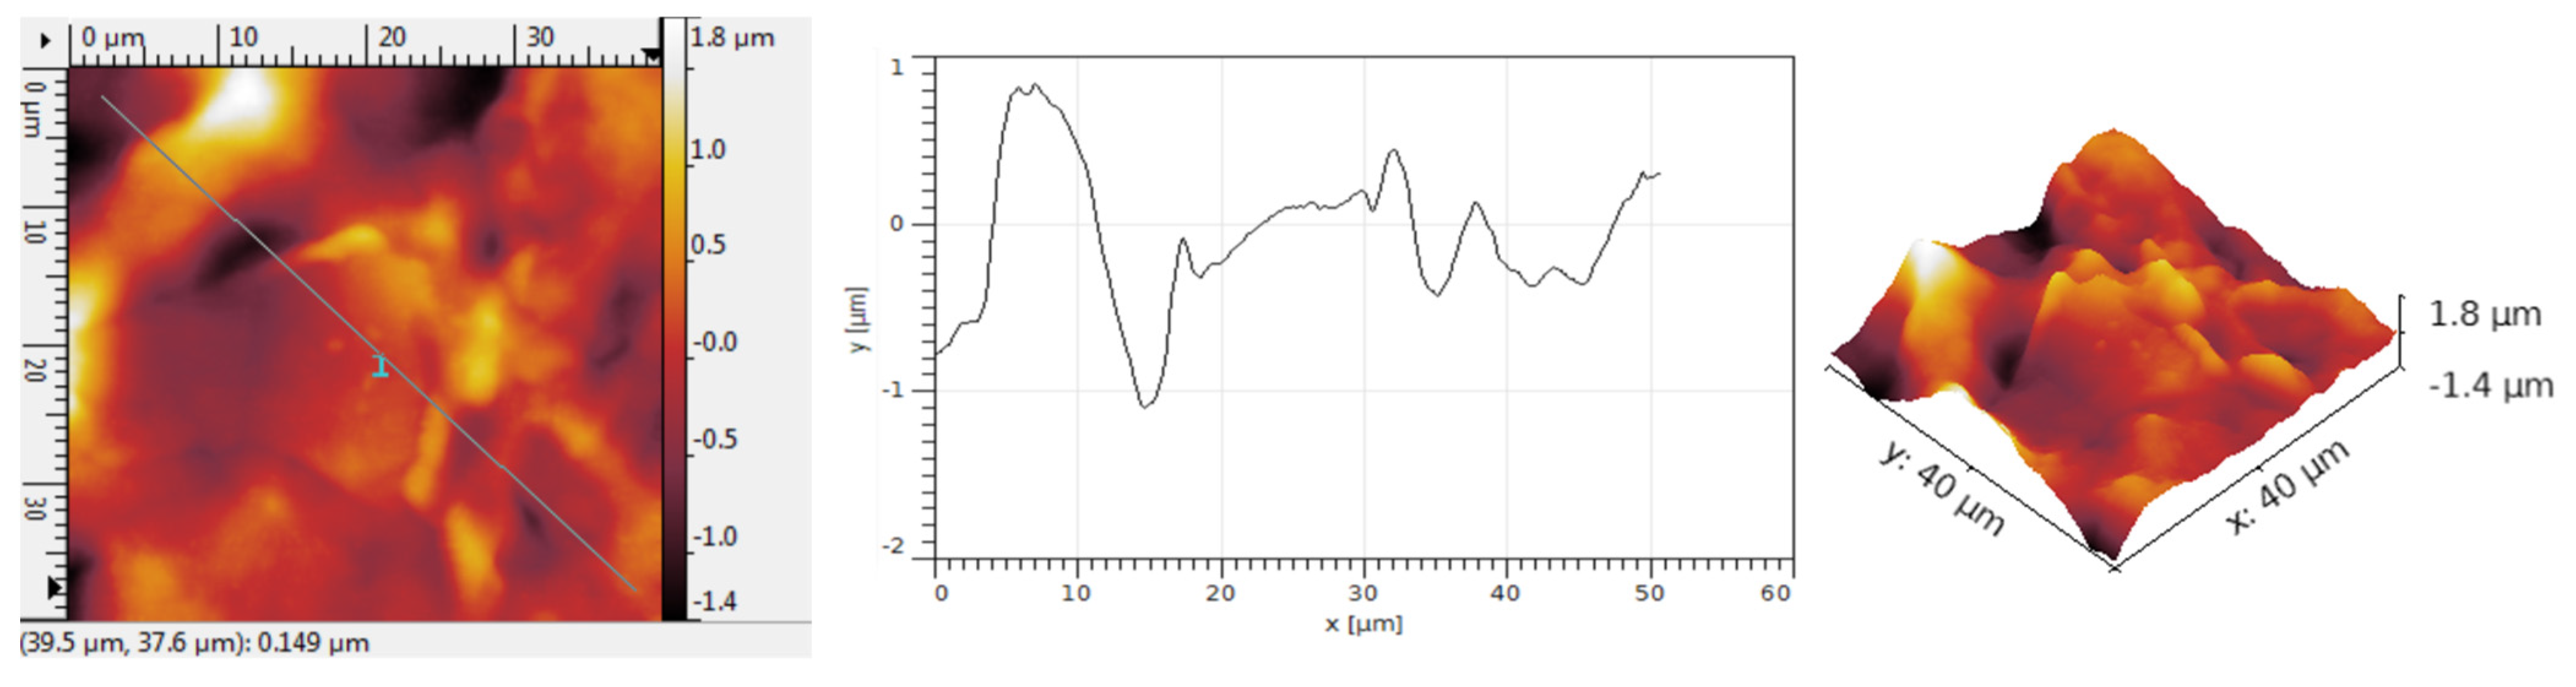
Figure 9 shows the analysis of the structure achieved after incorporating Au nanoparticles into the graphene—PANI-EB assembly. The presence of gold in the form of quasi-spherical particles with an average size of about 100 nm is clearly visible, yet the quantity of metallic particles is greater and somewhat grouped in small clusters.
The grain size is generally 1.8 μm, in line with the dimension for graphene deposited with PANI-EB without Au addition,
Figure 10. The grains are usually organized in larger groups. The R
Sk values are high, indicating the development of unique hollows after Au deposition, characterized by a specific arrangement featuring large hollows among the groups of grains. The R
ku values are over 7, demonstrating that the grain symmetry is completely altered by the inclusion of Au, as illustrated in
Table 5, as integration of metal compels the initial grains to form gaps for Au particles to delve further and gather into small clusters, thereby sharpening the peaks.
Figure 11 illustrates the analysis of the structure obtained after adding Au nanoparticles to the graphene–F8T2 composite. Gold is noticeably present. At first glance, when comparing
Figure 7,
Figure 9 and
Figure 11, in this instance, the area covered with nanoparticles surpasses that of the graphene–P3HT assembly but is fewer compared to the graphene–PANI-EB assembly. The metallic particles are somewhat clustered in larger groups, but the respective clusters are quite dispersed among the graphene–F8T2 grains.
The grain size typically reaches 3.8 μm, aligning with the dimensions for graphene deposited with F8T2 without the addition of Au, as shown in
Figure 12. The grains are typically arranged in smaller clusters. The low R
Sk values suggest the formation of some hollows; however, the architecture of these hollows is scattered, due to the fairly dispersed gold clusters, and overall, the grains settle closely together, resulting in minimal free space among them. The R
ku values exceed 4, indicating that the grain symmetry is somewhat modified by the presence of Au, as shown in
Table 6, although this modification is less significant compared to the graphene–PANI-EB assembly case, since, despite clustering, the Au particle clusters are few and fairly dispersed.
To evaluate the amount of gold in these hybrid structures, energy dispersive X-ray analyses were performed. The images have been very challenging to identify differences regarding the Au peak intensities, as there is a very low amount of gold relative to the graphene quantity, and minimal fluctuation in atomic percentage of gold as well, which renders the images irrelevant. Conversely, because of the weak EDS signal from small nanoparticles, the detection time for these particles increased, and other elements, such as Cu, Fe, and Co (likely connected to the sample holders etc.), appeared in the images, affecting the quality of the Au peak intensities. EDS analysis, a semi-quantitative method, has reasonably confirmed the incorporation of gold nanoparticles into hybrid structures.
Table 7 depicts the weight and atomic percentage of gold atoms in the hybrid samples, but under the previously mentioned experimental conditions, the accuracy of this information is constrained.
In assessing the incorporation of gold nanoparticles into graphene-conducting polymer assemblies, we can infer that the interaction of gold with the polymer structures varies significantly, with P3HT exhibiting the weakest physical connection and lowest quantity of linked gold nanoparticles and PANI-EB showing the strongest. Conversely, the effect of incorporating gold nanoparticles varies, being more individual and dispersed for P3HT, and distinctly clustered and more agglomerated for the other two structures. In every instance, a fairly symmetrical arrangement of grains was observed, with minimized space between them. Structures featuring symmetrical distribution and roughness dimensions at the micrometer scale are regarded as ideal for use as electrochemical sensors, although electrochemical evaluations in various reactants could determine their definitive usefulness.
3.2. Analysis of Electrochemical Functionality
The literature describes various metallization processes for graphene-supported composite materials, such as in [
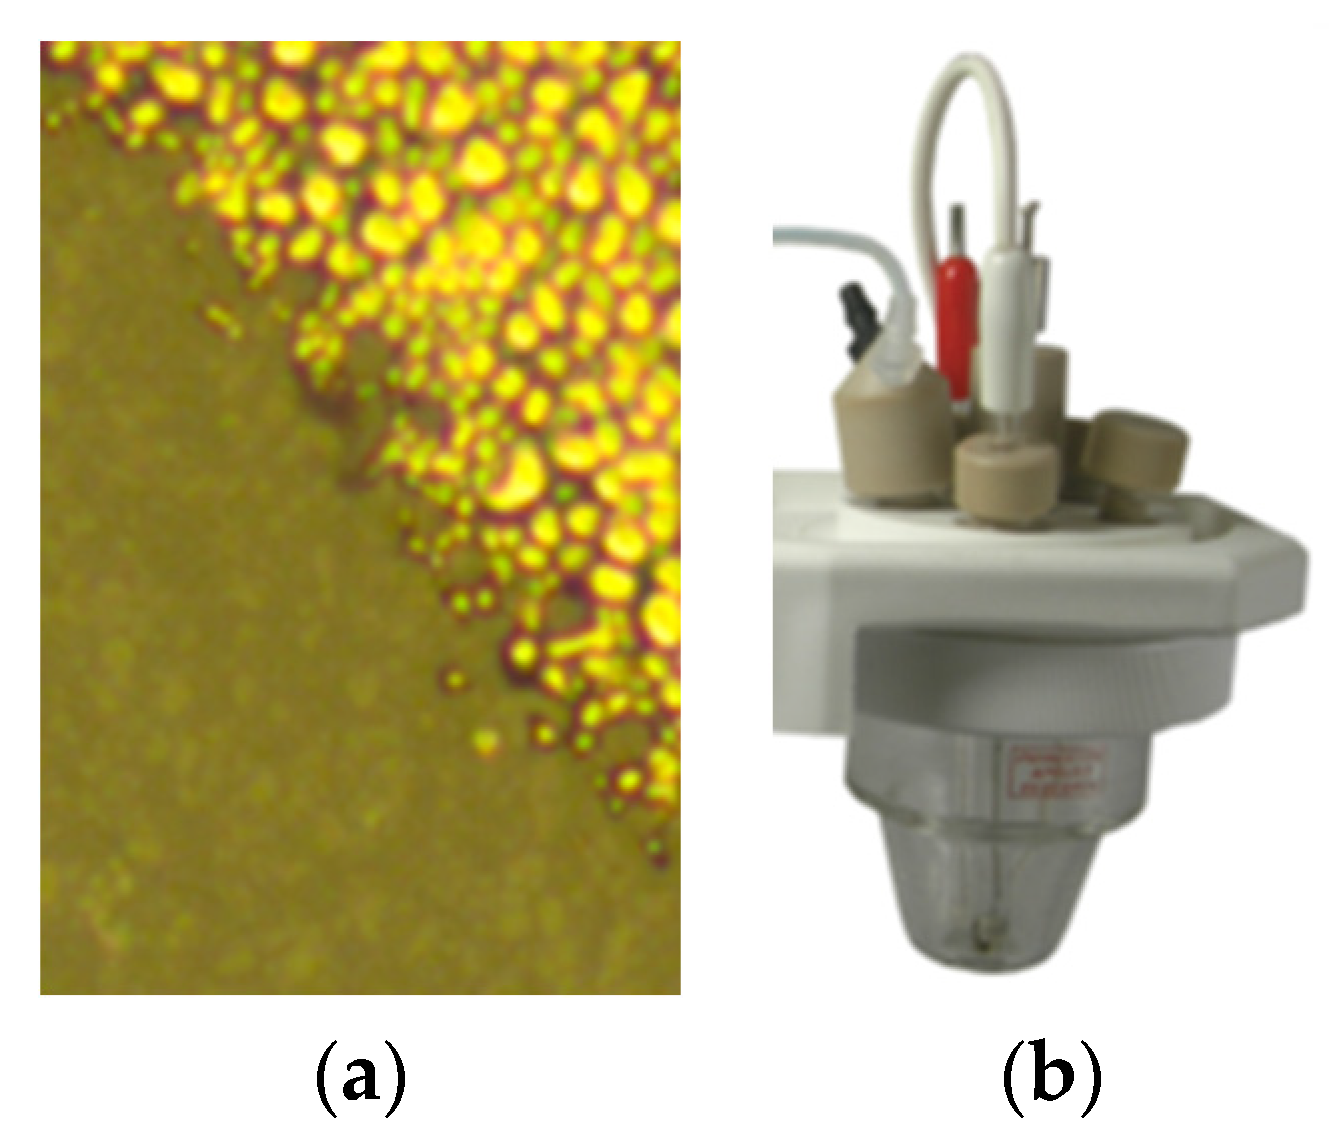
46], but many of them are unsuitable for a basic sensor application. In our instance, an ink-jet printer was utilized, and the metallization was performed using commercial ORGACON SI-J20X ink (Agfa-Gevaert N.V., Mortsel, Belgium) designed for printed electronics, by deposition in 2 layers. A uniform dispersion of the ink on the active area was observed,
Figure 13a. An electrode structure was created from each of the earlier shown hybrid samples, featuring an active surface approximately 1–1.5 cm
2, linked on one side to the connecting conducting path.
The electrochemical cell utilized for obtaining the cyclic voltammograms consisted of three electrodes: one of the previously mentioned electrodes served as the working electrode, the reference electrode was Silver/Silver chloride, and the counter electrode was a Pt spiral of 0.3 mm diameter. The K0264 Micro-Cell Kit configuration, used as electrochemical cell assembly, is presented in
Figure 13b.
The solution employed for the preliminary testing the three working electrodes was a 0.5 M aqueous H
2SO
4 solution, a typical method associated with cyclic voltammetry for examining proton reduction [
47,
48,
49], primarily if pertaining to electrodes that include metallic elements.
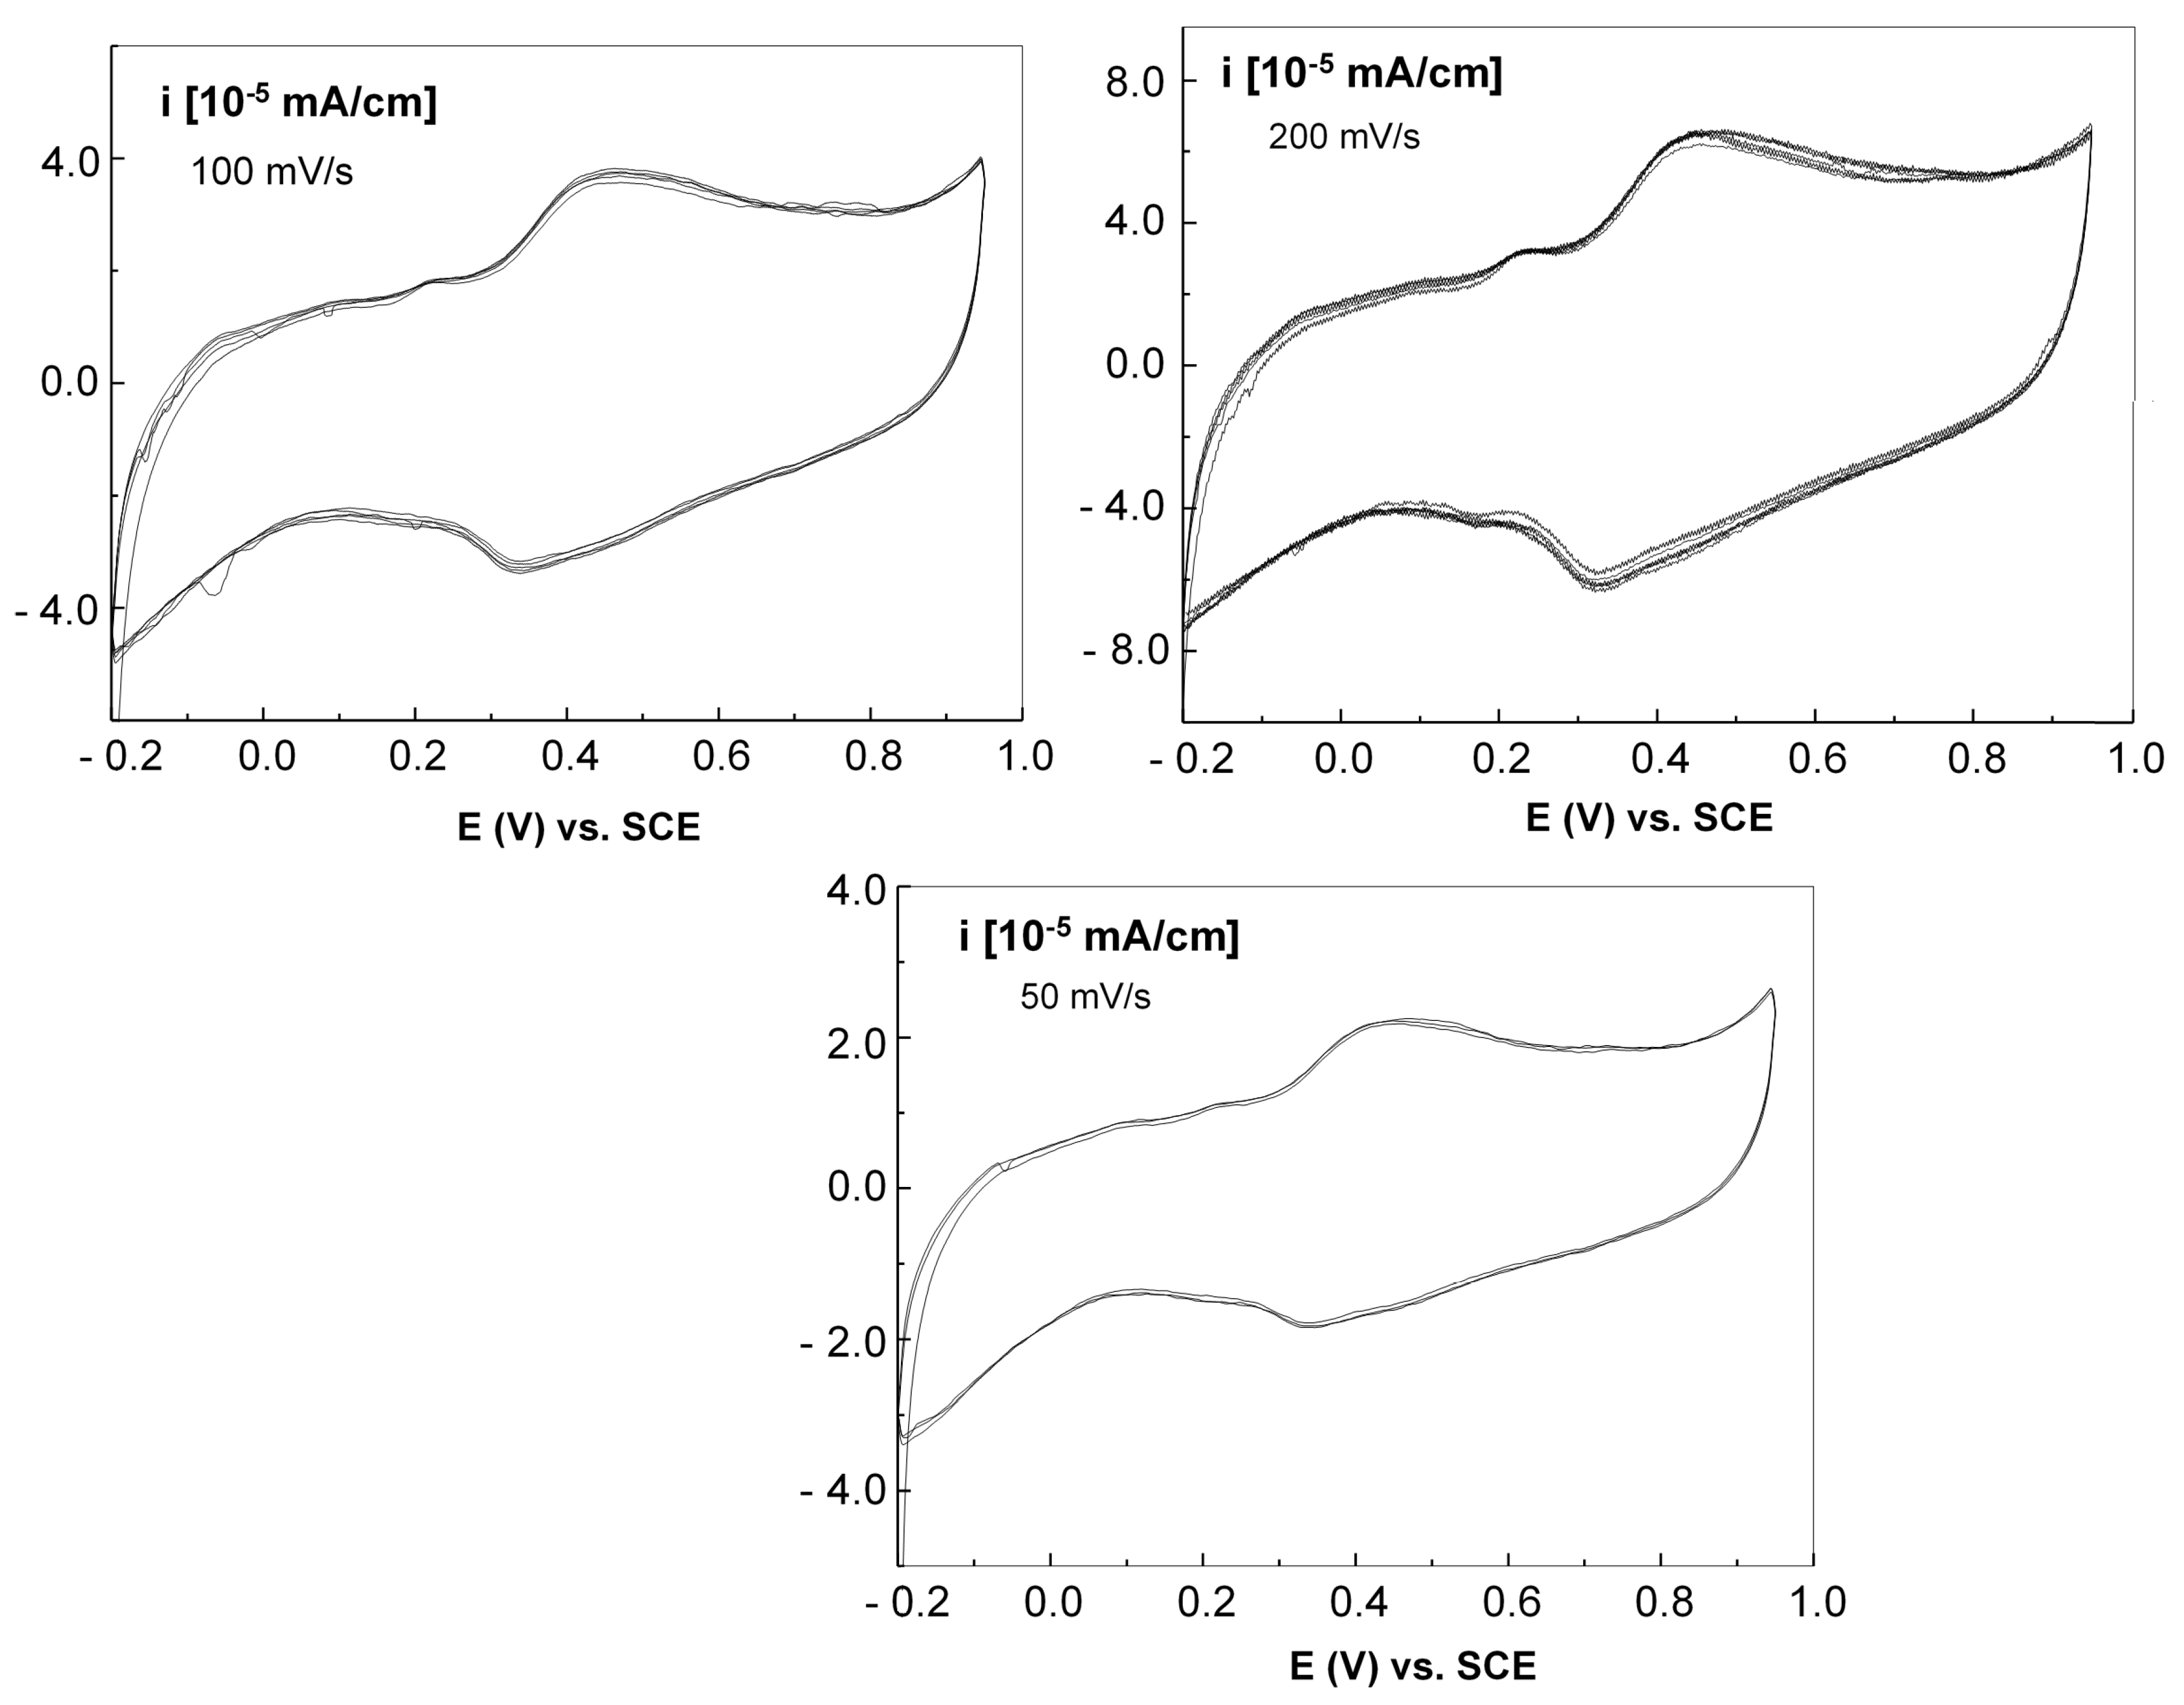
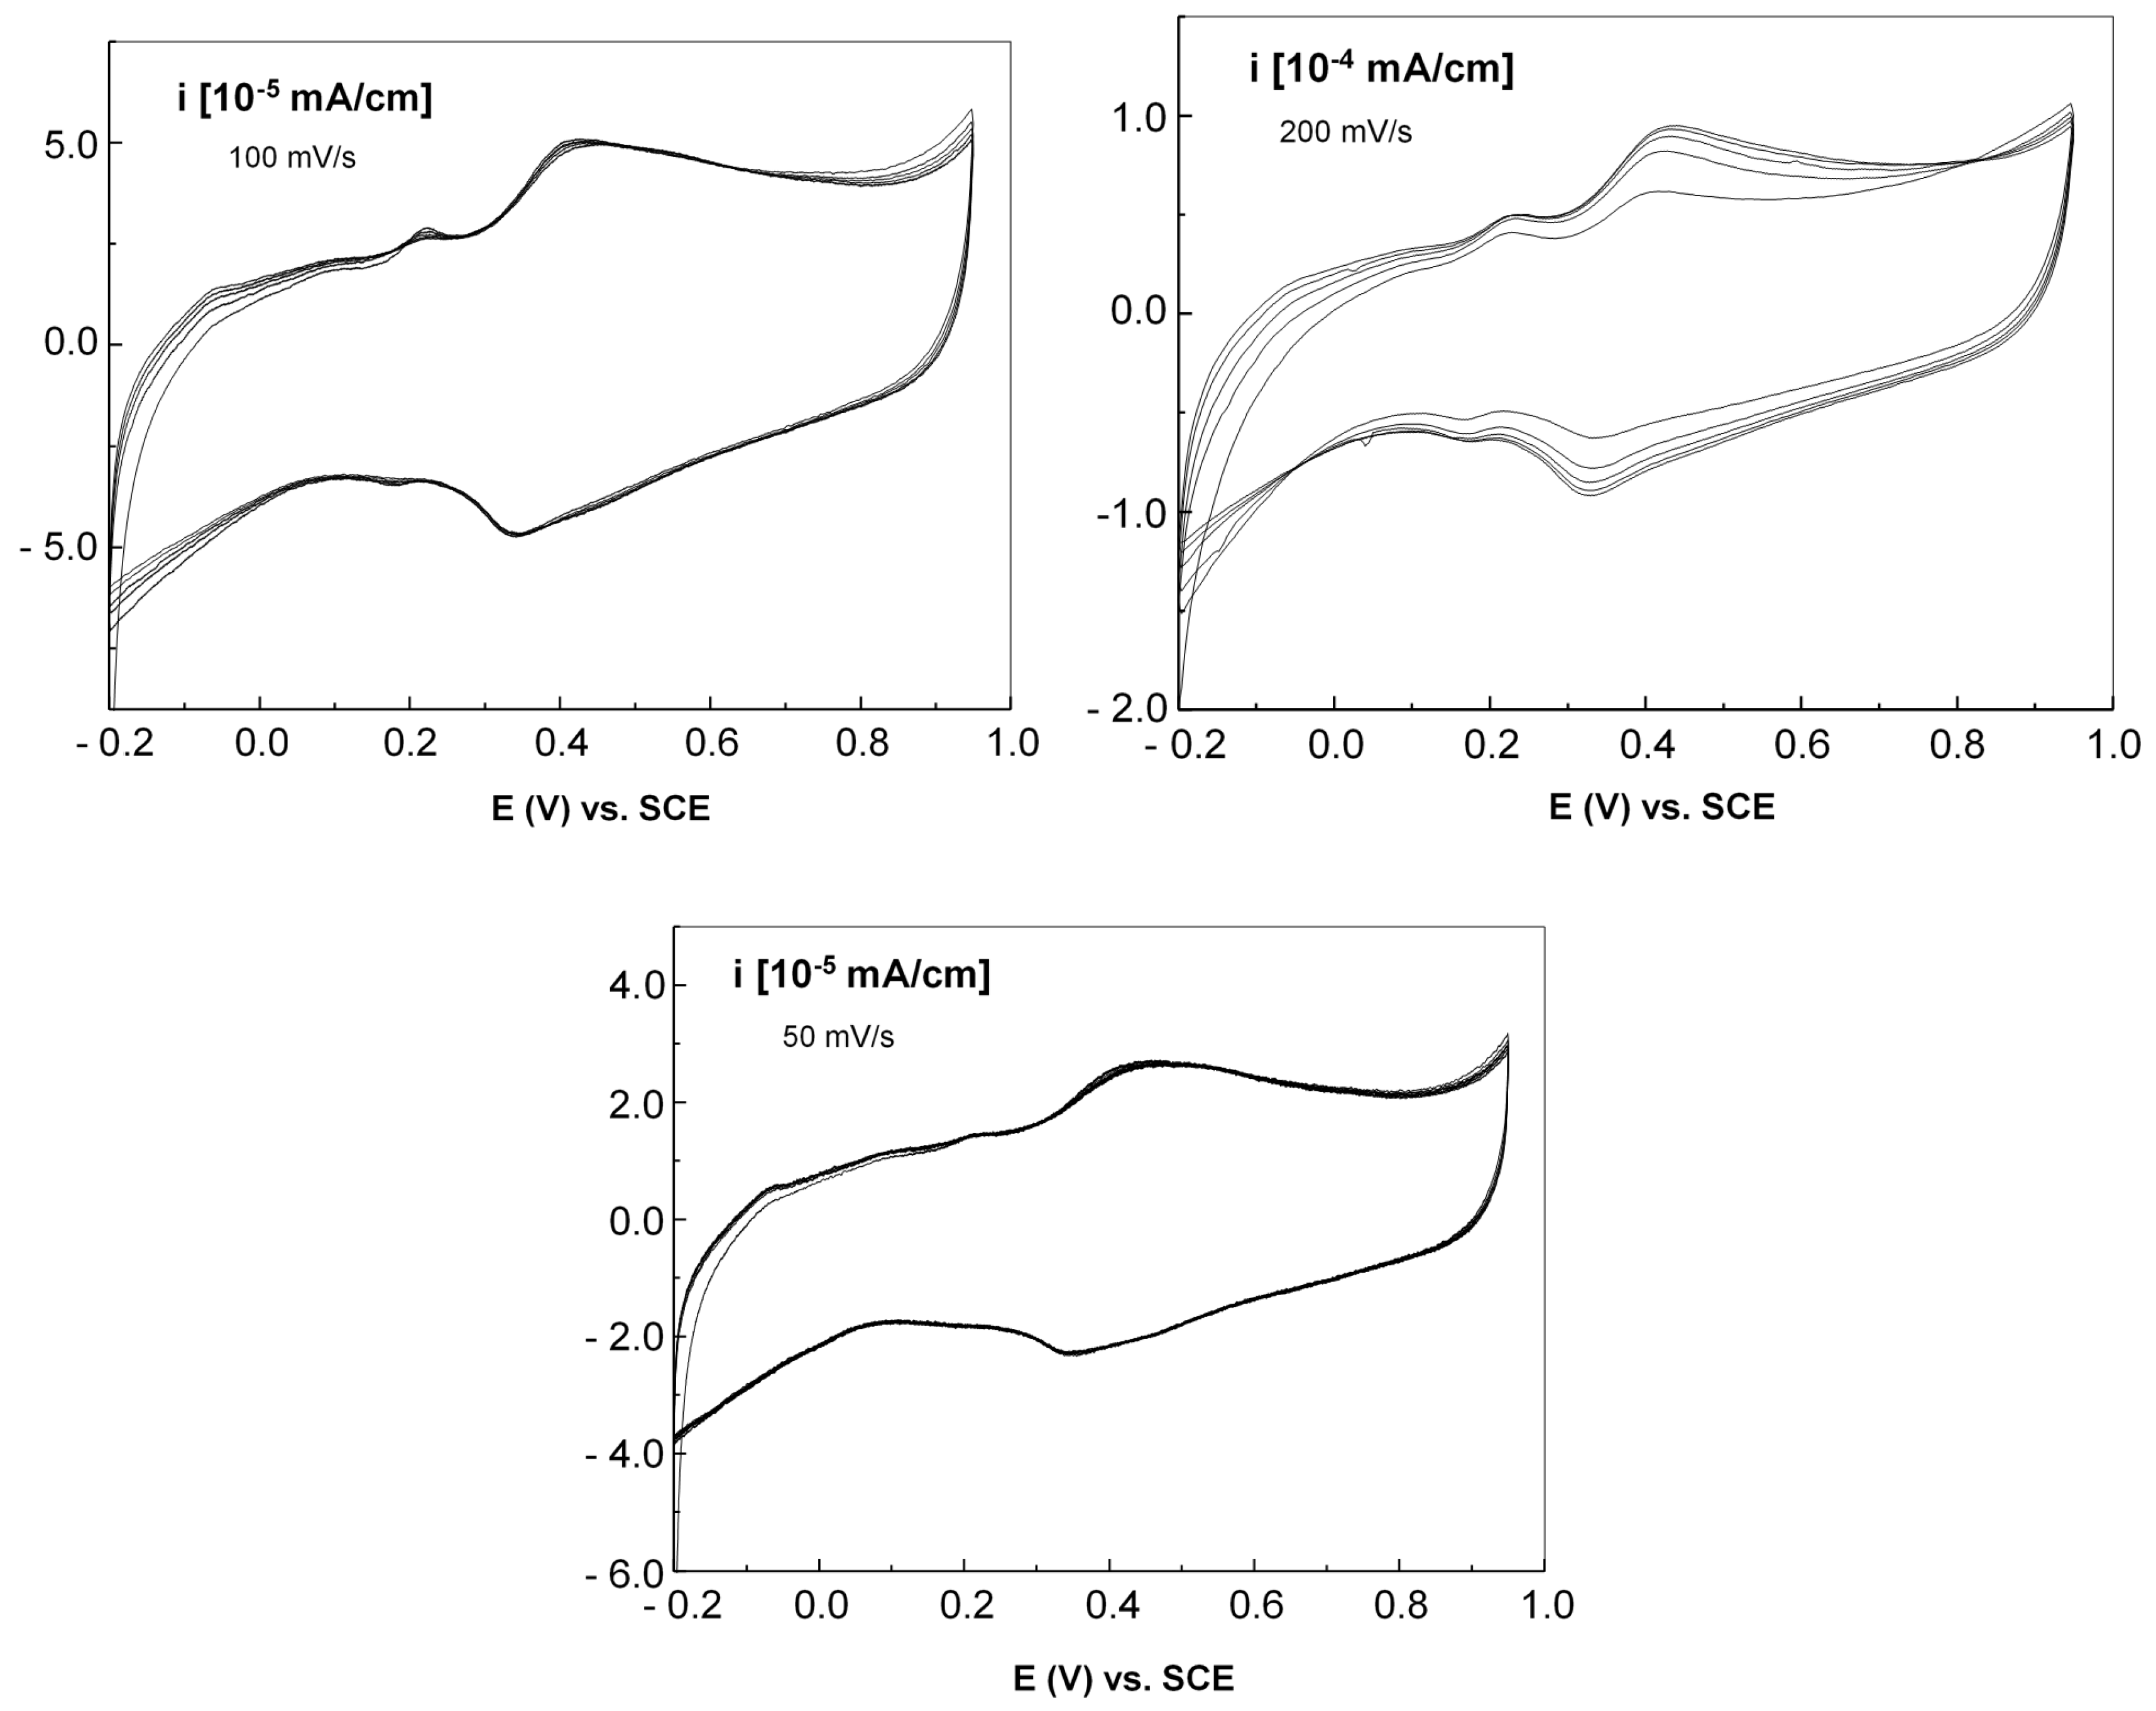
Figure 14 displays the cyclic voltammograms of the graphene–P3HT electrode with Au nanoparticles, employing 3 scanning rates of: 200, 100, and 50 mV/s respectively.
A thorough examination of
Figure 14 shows that the peaks of oxidation and reduction in the voltammograms are found at 439 and 325 mV, respectively, indicating an irreversible process related to the electrochemical doping of P3HT by HSO
4− anions in the vicinity of Au nanoparticles, similar with the cases described in [
50,
51]. As the scanning speed slows down, a reduction in both the anodic and cathodic current densities of the voltammograms is noted.
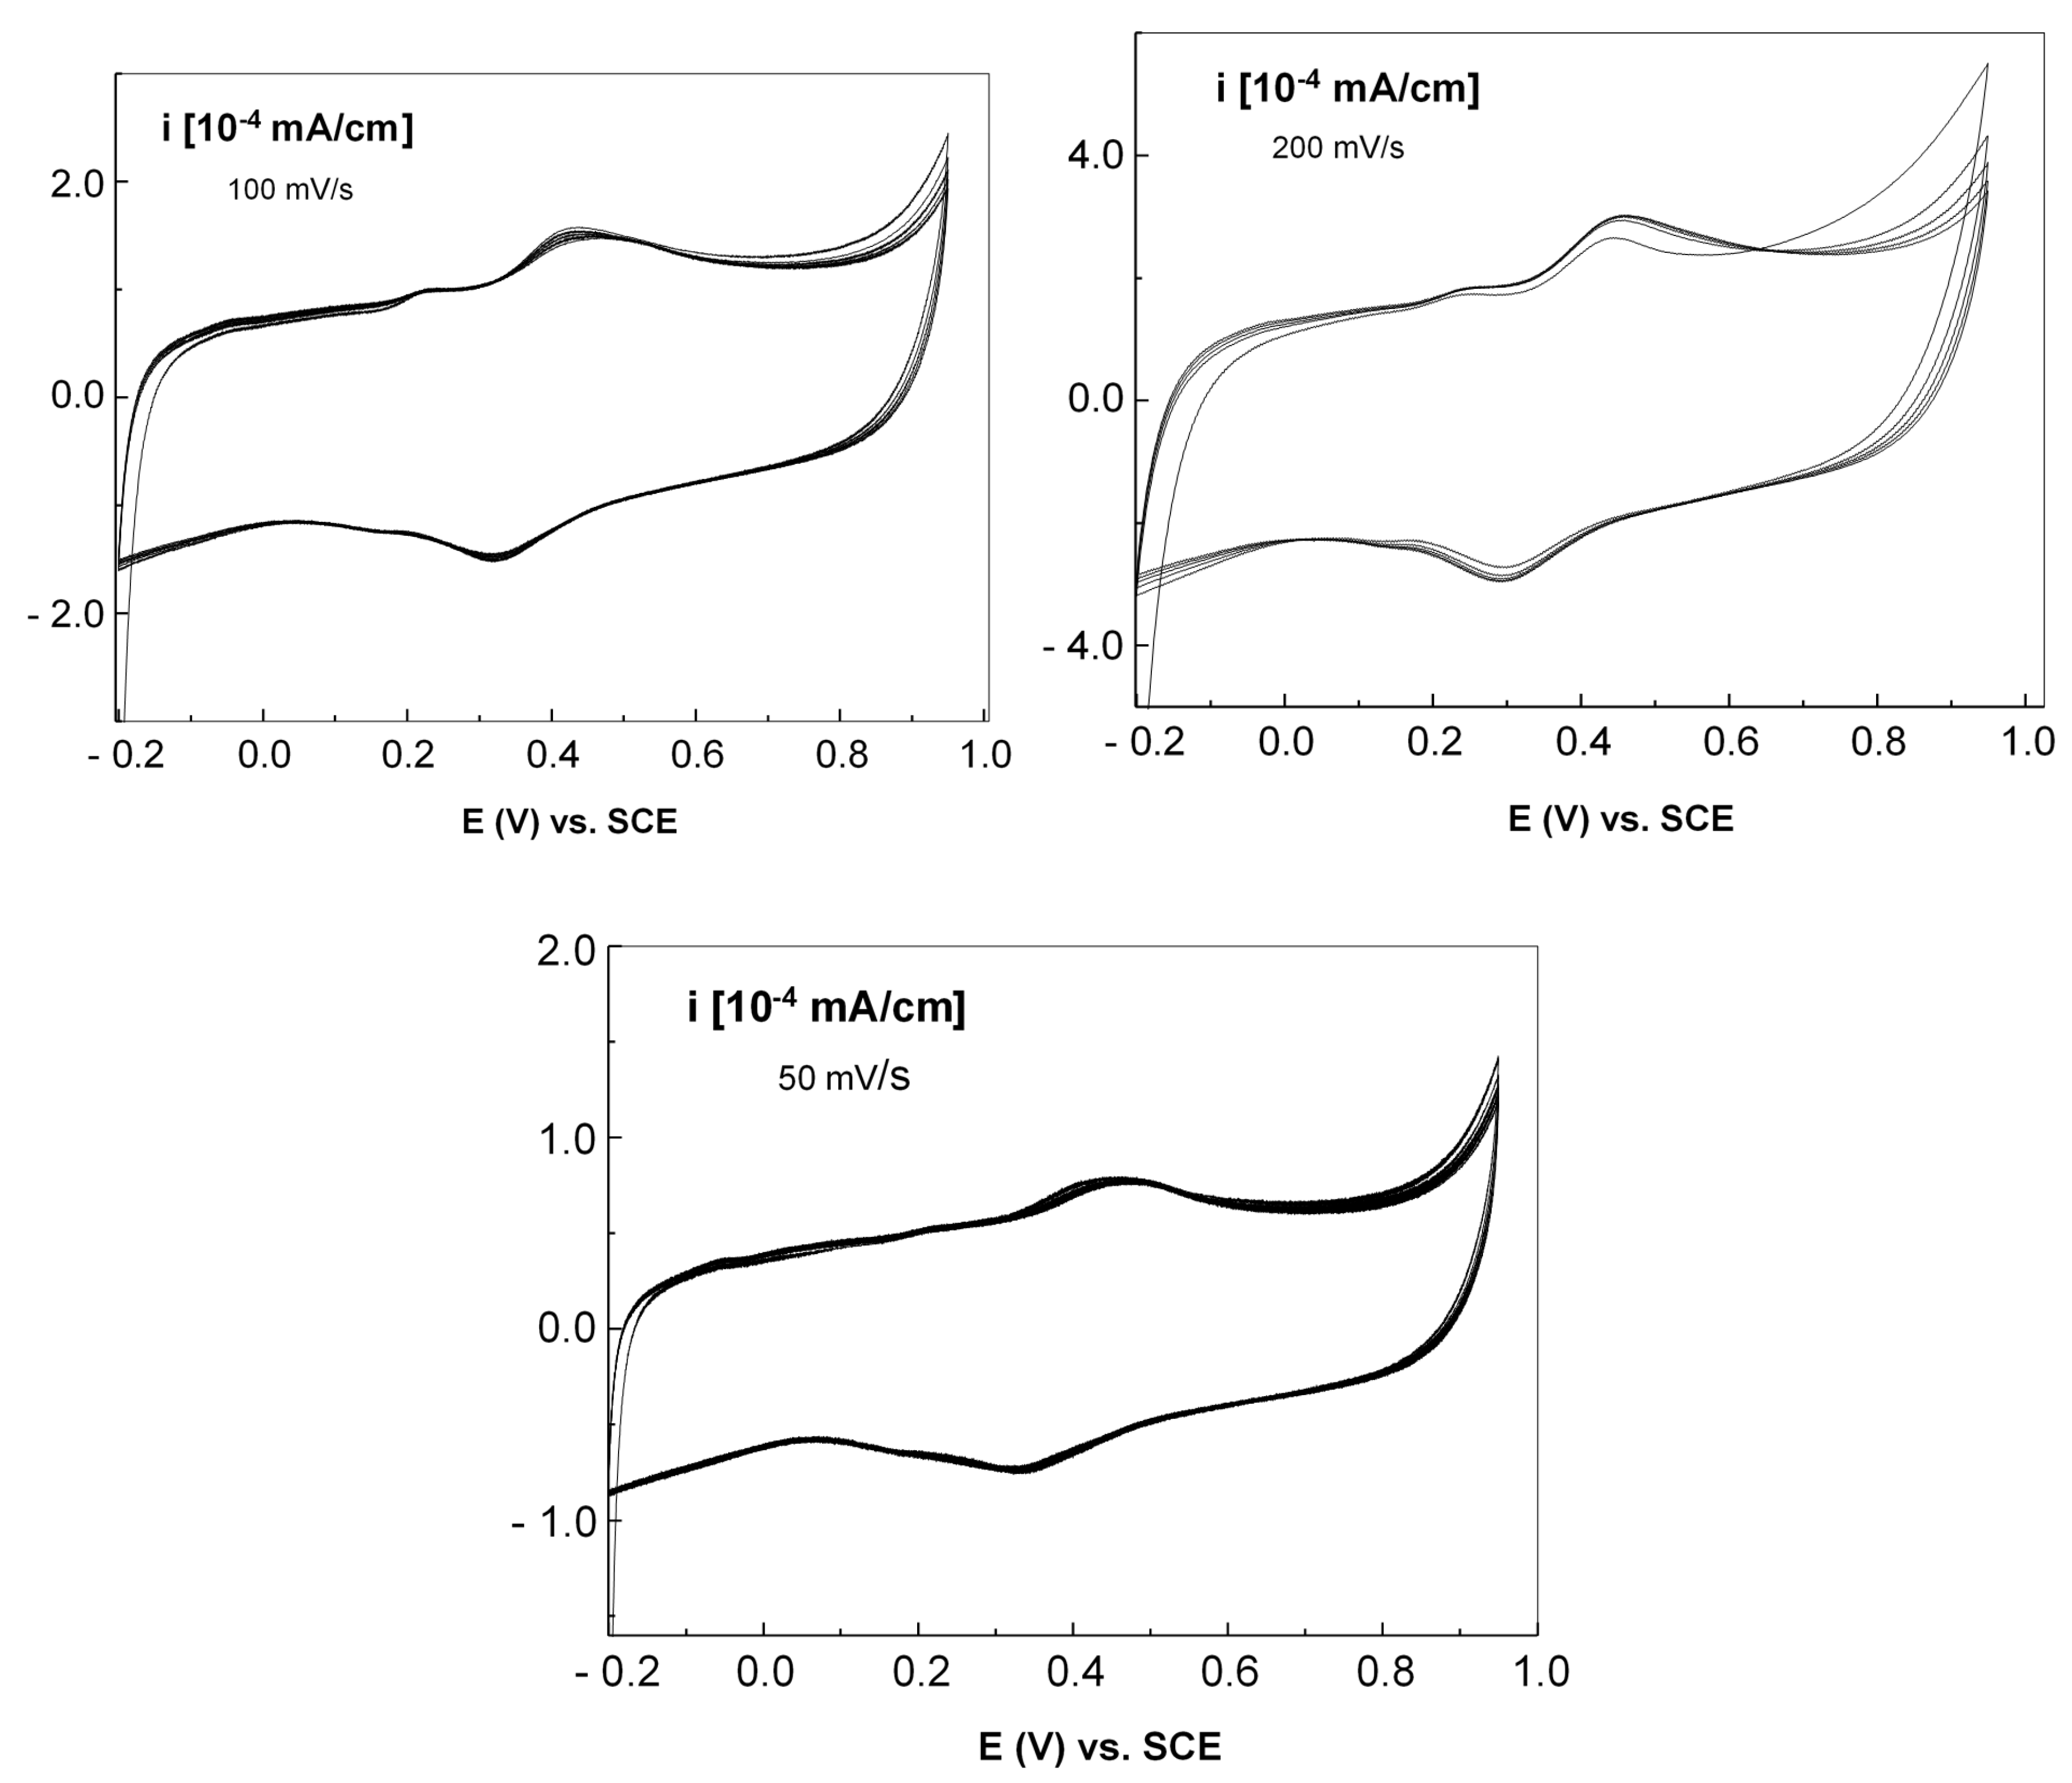
Figure 15 presents the cyclic voltammograms of the graphene–PANI-EB electrode with Au nanoparticles, at the same scanning rates.
It was observed that regardless of the scanning speed, the cyclic voltammograms display an oxidation peak at 450 mV and a reduction peak at 291 mV. This difference in potential between the maximum oxidation and reduction indicates an irreversible process resulting from the doping of PANI-EB, which leads to the creation of emeraldine polyaniline salt (PANI-ES). Furthermore, as the scanning speed decreases, there is a nearly linear drop in the anodic and cathodic current densities, suggesting that the electrochemical process is controlled by diffusion.
Finally,
Figure 16 presents the cyclic voltammograms of the graphene– F8T2 electrode with Au nanoparticles, at the same scanning rates.
Upon examining the voltammograms collected at a sweep rate of 200 mV/s, it is evident that the maximum anodic and cathodic current densities increase with a growing number of cyclic voltammograms. By the conclusion of the 5 cycles, the process generally starts to stabilize, with the oxidation and reduction potentials of 428 and 325 mV, respectively. This effect is reduced at slower scanning speeds. More than this, a slower sweep speed leads to a decreased density of the anodic and cathodic currents, with a slight shift in the positions of the oxidation and reduction peaks; at a sweep speed of 50 mV/s, the potentials of the anodic and cathodic maxima are 448 mV and 337 mV, respectively. The voltage variation linked to the anodic and cathodic peaks suggests an irreversible process tied to the doping of the F8T2 macromolecular compound with gold nanoparticles, especially concerning their clustering in large quantities.
In all cases, especially at higher scanning speeds, preliminary minor oxidation and reduction processes, at potentials of about 200 and 180 mV, respectively, were noticed. They can be explained by the surface oxidation of gold nanoparticles, especially if pertaining to electrodes that include a carbon-based support, as described e.g., in [
52]. A piece of evidence supporting this hypothesis is that for the graphene–F8T2 electrode, the effect is somewhat intensified when taking into account the clustering of Au nanoparticles in greater amounts. The variations of the electrochemical features demonstrated by the three electrodes when exposed to the 0.5 M H
2SO
4 solution distinctly show that the oxidation and reduction reactions at the electrode/electrolyte interface possess an irreversible nature due to the doping of the conjugated polymers, enhanced by the presence of gold nanoparticles.
The notable differences in roughness (grain size) and the arrangement of Au nanoparticles distribution within polymer grains lead to differing behaviors of those structures, and thus, any possible discrepancies in the sensitivity of the created sensing structures can be further clarified by this spatial configuration. At first glance, the oxidation and reduction potentials of the structures appear quite similar, particularly in the presence of sulfuric acid solution. However, a significant distinction can be observed in the values of the anodic and cathodic current densities, which seem to be greatly influenced by the amount and the way the gold nanoparticles are attached to the polymeric grains. In examining the slight oxidation and reduction reactions of Au nanoparticles for graphene–P3HT assembly, the effect appears comparable to that observed for graphene-F8T2 assembly, despite a noticeable difference in the atomic percentage of Au nanoparticles attached to each polymer surface,
Table 7. Conversely, the oxidation and reduction processes of Au nanoparticles are hardly significant for the graphene–PANI-EB assembly, despite the amount of Au nanoparticles attached to the respective polymer surface being similar to that of the graphene-F8T2 assembly. For graphene–P3HT and graphene-F8T2 assemblies, the incorporation of Au nanoparticles appears to provide a distinct effect that does not necessarily improve the polymer’s electrochemical activity. In contrast, for the graphene–PANI-EB assembly, the impact is more synergistic, the oxidation and reduction processes of Au nanoparticles being negligible. These findings are supported by the analysis of Au nanoparticle dispersion linked to
Figure 7,
Figure 9 and
Figure 11, where a more uniform and consistent distribution of Au nanoparticles among the polymer grains is observed solely in the case of the graphene–PANI-EB assembly.
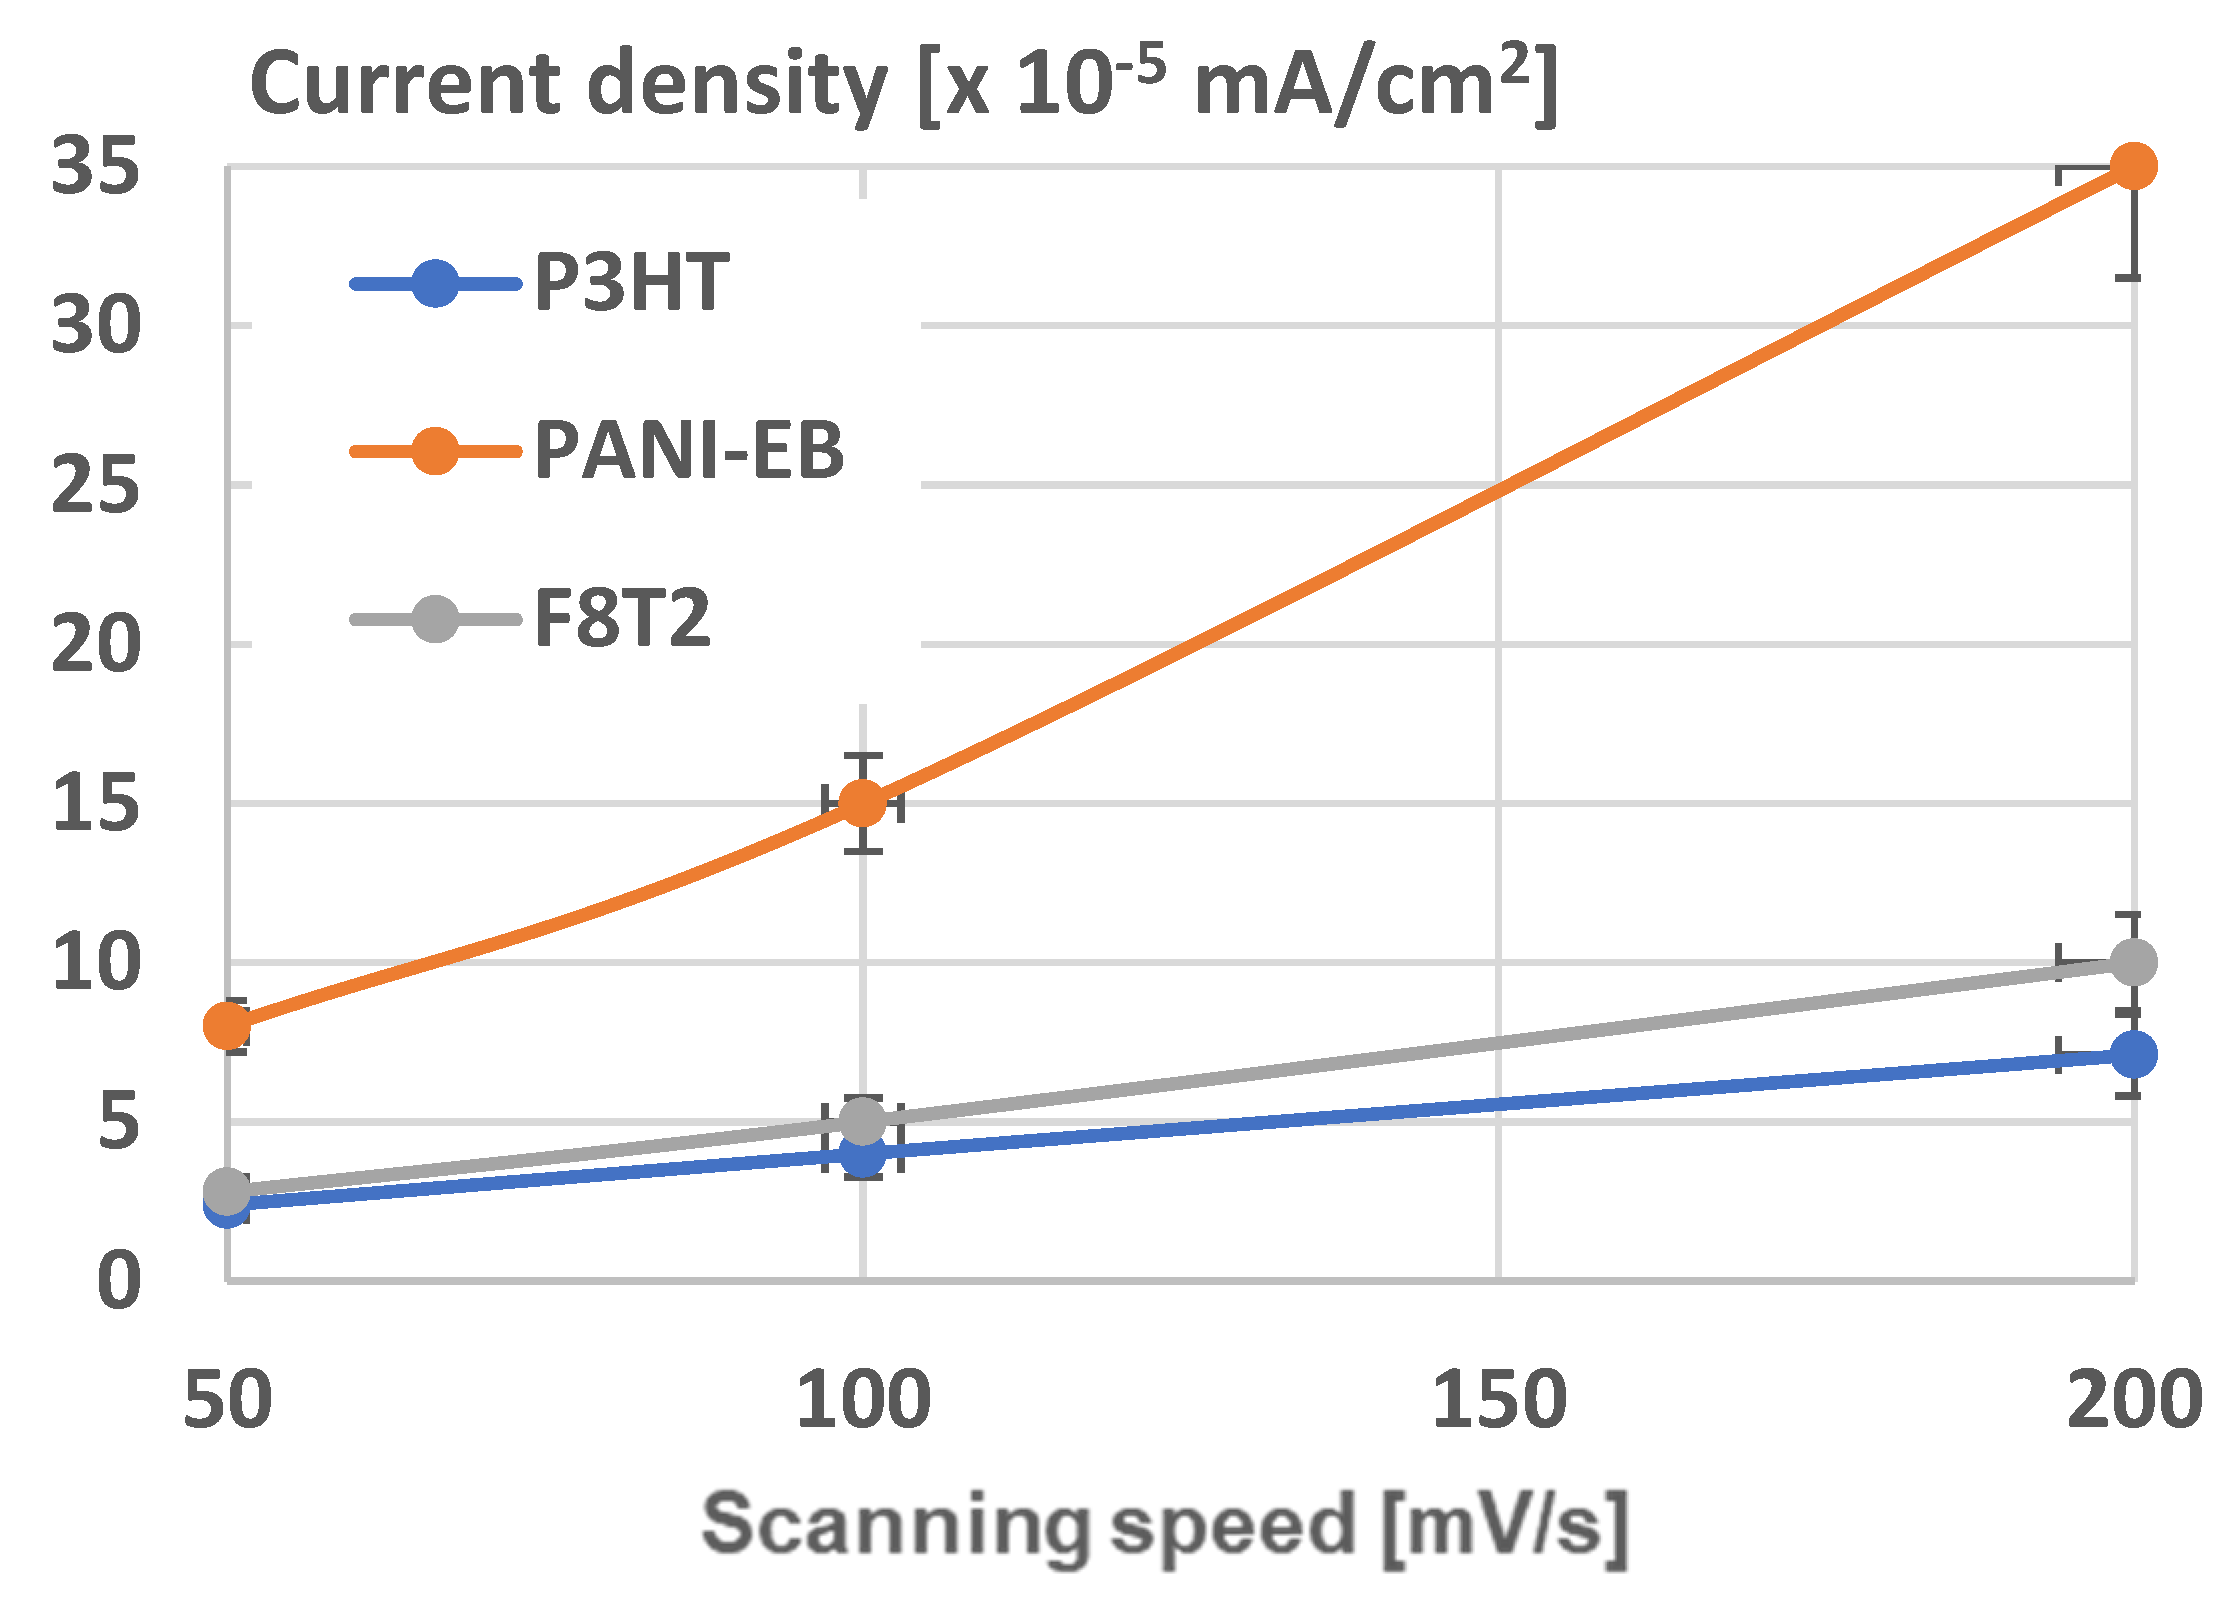
In
Figure 17, the current densities of structures at different scanning speeds is presented for the three graphene-polymer assemblies. The tests were repeated five times, and the results presented achieved a confidence level exceeding 90%. As shown, the most responsive structure is validated to be graphene–PANI-EB integrating Au nanoparticles. The explanation is founded on an adequately large grain size of 1.8 μm of the structure, with a significant quantity of Au nanoparticles, arranged as small clusters uniformly dispersed among the polymer grains, which become sharper due to arrangement of Au nanoparticles.
In contrast to other research on graphene-polyaniline composites that may serve as electrochemical sensors [
53,
54,
55,
56,
57], which primarily focus on graphene clusters embedded within PANI chains and utilize Van der Waals interactions on larger surfaces, the electrode technology introduced in this paper is groundbreaking and highlights a novel approach in altering at the nanoscale the architecture of sensing structures traditionally composed solely of graphene and conducting polymers. Additionally, incorporating gold nanoparticles enhances sensitivity regarding redox potential, both of which are critical attributes for an electrochemical sensor that targets specific biomolecular components for testing. Future research will focus on specifying hybrid structures of graphene–PANI-EB integrating Au nanoparticles for cancer diagnosis, aiming to exceed the results presented in [
58,
59], where the properties of PANI and graphene are examined independently, or the results presented in [
60,
61,
62,
63], where gold nanoparticles and graphene are examined independently.

 ,
, 


