Article

Preclinical Validation of an Electrochemical Sensor for Alcohol Consumption Monitoring in a Polydrug Self-Administration Animal Model

by
Lucía Garrido-Matilla
1,†,
Roberto María-Hormigos
2,†,
Olga Monago-Maraña
2,
Alberto Marcos
2,
Emilio Ambrosio
1,* and
Agustin G. Crevillen
2,*
1
Psychobiology Department, School of Psychology, Universidad Nacional de Educación a Distancia (UNED), E-28040 Madrid, Spain
2
Department of Analytical Sciences, Faculty of Sciences, Universidad Nacional de Educación a Distancia (UNED), E-28232 Las Rozas, Spain
*
Authors to whom correspondence should be addressed.
These authors contributed equally to this work.
Chemosensors 2025, 13(3), 97; https://doi.org/10.3390/chemosensors13030097
Submission received: 31 January 2025 / Revised: 28 February 2025 / Accepted: 6 March 2025 / Published: 8 March 2025
(This article belongs to the Special Issue Electrochemical Sensing in Medical Diagnosis)

Abstract

:
An electrochemical sensor for identification and monitoring of alcoholism was preclinically validated by analyzing plasma from polydrug-consuming rats (alcohol and cocaine). The sensor measures by adsorptive transfer square wave voltammetry the glycosylation level of transferrin, which is an alcoholism biomarker, through a recently reported parameter called the electrochemical index of glycosylation (EIG). Three rat groups were designed: saline group, cocaine group, and cocaine–alcohol group. Moreover, two periods of withdrawal were studied, after 2 days and 30 days. The alcohol–cocaine group after 2 days of withdrawal showed significantly lower EIG values (p < 0.1) than the rest of groups and also alcohol–cocaine group after 30 days of withdrawal, so the sensor was able to identify the alcohol consumption in rats and to monitor the recovery of glycosylation level after 30 days of withdrawal, even combined with cocaine. Furthermore, the effect of sex was also considered. Receiver operating characteristic (ROC) curves were developed for each sex and the corresponding cut-off values were determined. The sensor showed a clinical sensitivity of 70% for male and 75% for female, and a specificity of 67% for both sexes. This preclinical validation demonstrated the possibilities of this sensor for point of care testing of alcoholism, even in cocaine addicts, making it a potential tool for diagnosis and monitoring of alcohol consumption in detox treatments for humans.

Graphical Abstract

1. Introduction

Alcohol use disorder (AUD) is a chronic relapsing condition marked by cycles of abstinence and relapse [1,2]. It affects approximately 23 million people in Europe [3] and 32.6 million in the United States [4]. Notably, ethanol and cocaine co-use is among the most prevalent polysubstance use patterns, with up to 74% of individuals with cocaine use disorder in the U.S. consuming alcohol frequently [5]. Therefore, developing objective techniques to identify problematic drug use would be highly beneficial for treatment and this remains a major challenge in diagnosing substance use disorders.
In the case of AUD, ethanol quantification, in its current use, through breath and blood tests, serves as a clear diagnostic biomarker. These tests constitute the gold standard due to their simplicity and low cost and remain the most accurate biomarkers currently available for detecting alcohol consumption. Ethanol quantification has been particularly useful for assessing abstinence among treatment-seeking individuals and evaluating the therapeutic benefits of medications in clinical trials. However, its utility is limited by ethanol’s pharmacokinetics, as its detection window is restricted to only a few hours after intake due to its short half-life [6,7]. To address this limitation, the development of biomarkers capable of assessing chronic alcohol exposure would be valuable for both research and clinical applications, as they provide an objective tool for verifying self-reported alcohol intake from patients or study participants [8,9]. Biomarkers for estimating alcohol consumption are classified as either direct or indirect. Direct biomarkers originate from ethanol metabolism or its interaction with endogenous compounds, such as phosphatidylethanol (PEth). In contrast, indirect biomarkers reflect changes in specific enzymes or cells in response to acute or chronic alcohol intake [8,10]. Examples of indirect biomarkers include liver enzymes such as alanine transaminase (ALT), aspartate transaminase (AST), and gamma-glutamyl transpeptidase (GGT), as well as carbohydrate-deficient transferrin (CDT). Among long-term biomarkers, PEth and CDT are particularly relevant, as they can be detected for up to four weeks after the last alcohol consumption [6,7], which is highly relevant in the context of AUD. It is also important to consider that several factors, including age, sex, moment of the query (moderate consumption or abstinence), comorbidities, and the co-use of other substances such as cocaine, can influence these markers [7,10]. Therefore, selecting an appropriate biomarker for alcohol detection requires careful consideration of these variables to ensure reliability and accuracy.
CDT is considered to be the group of transferrins (Tfs) having no carbohydrate side-chains (asialo-Tf), one (monosialo-Tf), and two (disialo-Tf), which increase their concentration in blood due to chronic alcohol abuse. The ratio between these low glycosylated glycoforms and the sum of the signals for all glycoforms (from asialo- to hexasialo-Tf) is termed %CDT. Typically, %CDT is measured by HPLC and CZE using UV detection, providing excellent diagnostic performance [11,12]. However, these techniques require benchtop equipment and skilled personnel, so the analysis is performed in clinical laboratories. There is also a fast and simple commercial immunoassay kit for chronic alcohol abuse (N Siemens Latex CDT assay), which uses two selective monoclonal antibodies: one recognizes the structure of asialo- disialo-Tf and the other all Tf glycoforms [13]. The assay relies on an immunonephelometry, so a benchtop instrument is needed.
In this context, the development of point-of-care testing (POCT) for CDT evaluation would help therapists, clinicians, and/or caregivers in the follow-up of rehab process, because POCTs provide immediate and simple information about the patient’s health, without the need for decentralized laboratories. Furthermore, the analysis can be performed near the point of care (physician’s or therapist’s office, or even at home), improving patient convenience and comfort [14,15]. Electrochemical sensors are promising POCT due to their easy miniaturization, low-cost fabrication, multiplexing detection capacity, and portability (handheld potentiostat even for connecting on smartphones) [16,17]. Among electrochemical sensors, screen-printed electrodes (SPEs) have emerged as one of the most relevant because they offer rapid, portable, sensitive, low-cost, and precise analyses; in addition, SPEs are disposable and need a low amount of sample (μL range) [18].
Currently, there are a lot of wearable electrochemical biosensors for real-time alcohol monitoring, using accessible samples such as sweat or interstitial fluid [19]. These biosensors targeted biomarkers that are detectable for a short period of time (<24 h) such as alcohol [20] and ethyl glucuronide [21]. However, the utility of these devices is based on trust in the users, and this can be controversial for alcoholics during detoxification therapies. For instance, many alcoholics tend to underreport their alcohol consumption during interviews in the clinic [6]. Tests performed in situ by clinicians or therapists are more reliable and realistic than those that depend on the patients. Moreover, these tests should target biomarkers for long-term monitoring such as CDT or PEth.
We previously reported an electrochemical approach for the evaluation of CDT by defining a new parameter called “electrochemical index of glycosylation” (EIG) [22]. This parameter is the ratio between the electrochemical signal produced by the carbohydrates from Tf (which were selectively tagged by an electroactive Os(VI) complex) and the signal generated by the oxidation of electroactive amino acids from Tf. We demonstrated that the amount of Os(VI) complex attached to Tf is proportional to the amount of carbohydrates present in Tf. Interestingly, EIG showed an excellent inverse linear correlation with the parameter CDT. The approach combines immunomagnetic beads for selective isolation of Tf, and disposable screen-printed carbon electrodes (SPCE) for electrochemical sensing. We explored this approach for the screening of chronic alcohol abuse in an animal model (Wistar rat) under intravenous passive administration (2 g/kg b.w.) [23]. We found that the electrochemical sensor allowed us to reliably differentiate between rats exposed to alcohol and saline control rats, yielding a sensitivity of 81% and a specificity of 87%.
In this work, a more complex and realistic animal model was devised to perform a deeper preclinical validation of the proposed electrochemical sensor for chronic alcohol abuse identification. The animal experimental design consists of rats fed a saline solution (saline group), rats that self-administered alcohol and cocaine (ALC+COC group), and rats that self-administered cocaine (COC group). This design imitates one of the most common patterns of drug abuse, polydrug use. In addition, each group was subjected to two different periods of withdrawal: rats sacrificed after 2 days (2D) withdrawal and after 30 days (30D). Therefore, six groups were evaluated. The sex was also considered, with a total of 121 young adult rats in this study (65 female and 56 male).

2. Materials and Methods

2.1. Reagents

Anti-transferrin polyclonal antibody was purchased from Abcam (ab82411, Cambridge, UK, reacts with: Mouse, Rat, Guinea pig, Dog, Human). Low-protein-binding microtubes and protein-G magnetic beads (Invitrogen, 30 mg/L, 2.8 µm diameter) were acquired from Thermo Fisher Scientific (Waltham, MA, USA). Potassium osmate (VI) dihydrate, N,N,N’,N’-tetramethylethylenediamine (TEMED), boric acid, phosphoric acid, sodium hydroxide, sodium chloride, acetic acid, disodium hydrogen phosphate dodecahydrate, and sodium dihydrogen phosphate monohydrate were purchased from Merck (Darmstadt, Germany). Hydrochloric acid was acquired in Panreac (Castellar del Vallès, Spain). Ultra-pure water was used for the preparation of solutions (Milli-Q, Merck Millipore, Darmstadt, Germany).

2.2. Instruments

Electrochemical measurements were carried out in a hand-held potentiostat (µ-Stat-I 400s, DropSens, Oviedo, Spain), controlled by DropView 8400 software. Single-use screen-printed carbon electrodes (SPCE) (DRP-110, Metrohm Dropsens, Oviedo, Spain) were used for sensing. They contain a 4 mm diameter working electrode, a counter electrode (both made of carbon), and a reference electrode made of silver. SPCEs need only 50 µL of sample.

2.3. Procedures

2.3.1. Labeling of Transferrin with Os(VI)-Based Electrochemical Tag

The labeling solution contains 30 mM Os(VI)O2(OH)2TEMED complex and 0.2 M phosphate buffer pH 7.0, and it was prepared according to previous work [22]. This electrochemical tag (Os(VI)O2(OH)2TEMED) reacts selectively with carbohydrates and glycans but not with amino acids [24,25].
The transferrin (Tf) contained in the rat plasma was labeled with the Os(VI)-based electrochemical tag as follows: 150 µL of rat plasma was mixed with 100 µL of 30 mM Os(VI)O2(OH)2TEMED solution and then it was incubated overnight at 37 °C and 950 rpm using a Thermo Shaker (PHMT, Grant-Bio, Royston, UK). This reaction yields a Tf-Os(VI)O2TEMED complex (Tf-Os(VI)) [22].

2.3.2. Immunoextraction Using Anti-Tf Magnetic Beads

Anti-Tf magnetic beads (anti-Tf MB) were synthesized as in our previous work [23]. These anti-Tf MBs were then employed to isolate Tf-Os(VI) from the rest of the components present in rat plasma. The immunoextraction protocol was as follows: 1 µL of anti-Tf MBs was dispersed in 50 µL of plasma sample, which contained Tf-Os(VI), using low-protein-binding microtubes. Next, it was incubated for 45 min at 25 °C and 950 rpm (Thermo Shaker, Grant-Bio, Royston, UK). Then anti-Tf MBs were washed with 50 µL of 0.1 M PBS pH 7.4 solution (in triplicate) using a magnet. Finally, anti-Tf MBs containing Tf-Os(VI) were resuspended in 10 µL of 0.2 M Britton Robinson (BR) buffer pH 3.0 and then dropped on the working electrode of SPCE.

2.3.3. Electrochemical Sensing

Electrochemical sensing was carried out by adsorptive transfer square wave voltammetry (AdTSWV) using single-use SPCE. This approach was previously reported by us [23]. It consists of three steps: (i) 10 µL of anti-Tf MBs containing Tf-Os(VI) was dropped on the working electrode and Tf-Os(VI) complex was adsorbed on the surface for 5 min at open circuit potential, (ii) the solution was removed from SPCE and 50 µL of 0.2 M BR buffer pH 3.0 solution was added to SPCE, and (iii) AdTSWV was performed from −1.3 V to +1.2 V (step potential 5 mV, amplitude 50 mV and frequency 100 Hz).
The voltammograms show two peaks: one at −0.9 V, which comes from the Os(VI)-based electrochemical tag attached to Tf carbohydrates, and another at +0.8 V, which comes from electroactive amino acids (cysteine, tryptophan, and tyrosine) of Tf. The ratio between the peak height of both signals is called the electrochemical index of glycosylation (EIG), and it is calculated as follows:
EIG = IOs(VI)/ITf
where IOs(VI) is the height of the peak at −0.9 V and ITf is the height of the peak at +0.8 V.
It is worth mentioning that EIG is inversely proportional to %CDT [22], so the higher the glycosylation degree of Tf, the higher the EIG value.

2.3.4. Animals, Experimental Design, and Plasma Preparation

Animals

All procedures were conducted in accordance with Spanish Legislation on protection of experimental animals and the European Union Laboratory Animal Care Guidelines (EU Directive 2010/63/EU) and have been previously approved by the Bioethics Committee of the Universidad Nacional de Educación a Distancia (UNED, Madrid, Spain) and the Autonomous Community of Madrid (PROEX 327.0-23). Male and female Wistar rats (Charles River Laboratories, Lyon, France) were weaned at 28 days old and housed in single-sex groups before undergoing surgery. Post-surgery, rats were individually housed in controlled conditions (22 °C, 50–60% humidity, 12 h light/dark cycle) with ad libitum access to food and water.

Surgical Procedures

For the drug self-administration procedure, rats were implanted with indwelling jugular vein catheters. Briefly: Under isoflurane anesthesia, a silicone catheter (polyvinyl chloride; 1 mm O.D. and 0.5 I.D.) was inserted into the atrium and guided to the scapular region. Marbofloxacin (0.25 mg/kg, IV) and buprenorphine (0.05 mg/kg, SC) were administered perioperatively and continued for three days post-surgery. Catheters were maintained by daily flushing with saline containing heparin and gentamicin. Functionality was verified using sodium thiopental (0.10 mg/kg), with loss of consciousness confirming proper catheter function.

Self-Administration Protocol

The procedure is extensively described in reference [26]. After autoshaping with food pellets under a fixed ratio 1 (FR-1) schedule, self-administration sessions began. Rats were assigned to three groups: saline (SALINE), cocaine (COC; 1 mg/kg body weight injection), and cocaine + alcohol (ALC+COC; 0.133 g/kg ethanol b.w. inj. + 1 mg/kg cocaine b.w. inj.). Sessions were conducted in operant conditioning chambers equipped with active and inactive levers, with lever presses on the active lever delivering the reinforcer. Ethanol was gradually introduced over the first three sessions to the ALC+COC group.
The self-administration began at 54 ± 2 days of age and consisted of 10 daily extended-access 6 h sessions. Subsequently, rats underwent withdrawal for either 2 days (2D) or 30 days (30D).

Sample Collection and Analysis

After the withdrawal periods, rats were euthanized by decapitation, and blood samples were collected into heparinized tubes. Plasma was isolated by centrifugation (1500× g, 10 °C, 12 min) and stored at −80 °C. Plasma proteins were removed using filtration (30 kDa), followed by centrifugation (3000× g, 4 °C, 45 min).

2.3.5. Statistical Studies

Statistical analysis employed non-parametric tests due to the differing sample sizes across groups. The Kruskal–Wallis test was used to evaluate differences among the three treatment groups, and the Mann–Whitney U test was applied to determine which specific groups displayed significant differences.
All statistical analyses were conducted using IBM SPSS Statistical version 27 (IBM, Armonk, NY, USA). Test statistics, degrees of freedom, and p-values were reported in the Results and Discussion Section. A p-value less than 0.1 was considered statistically significant.

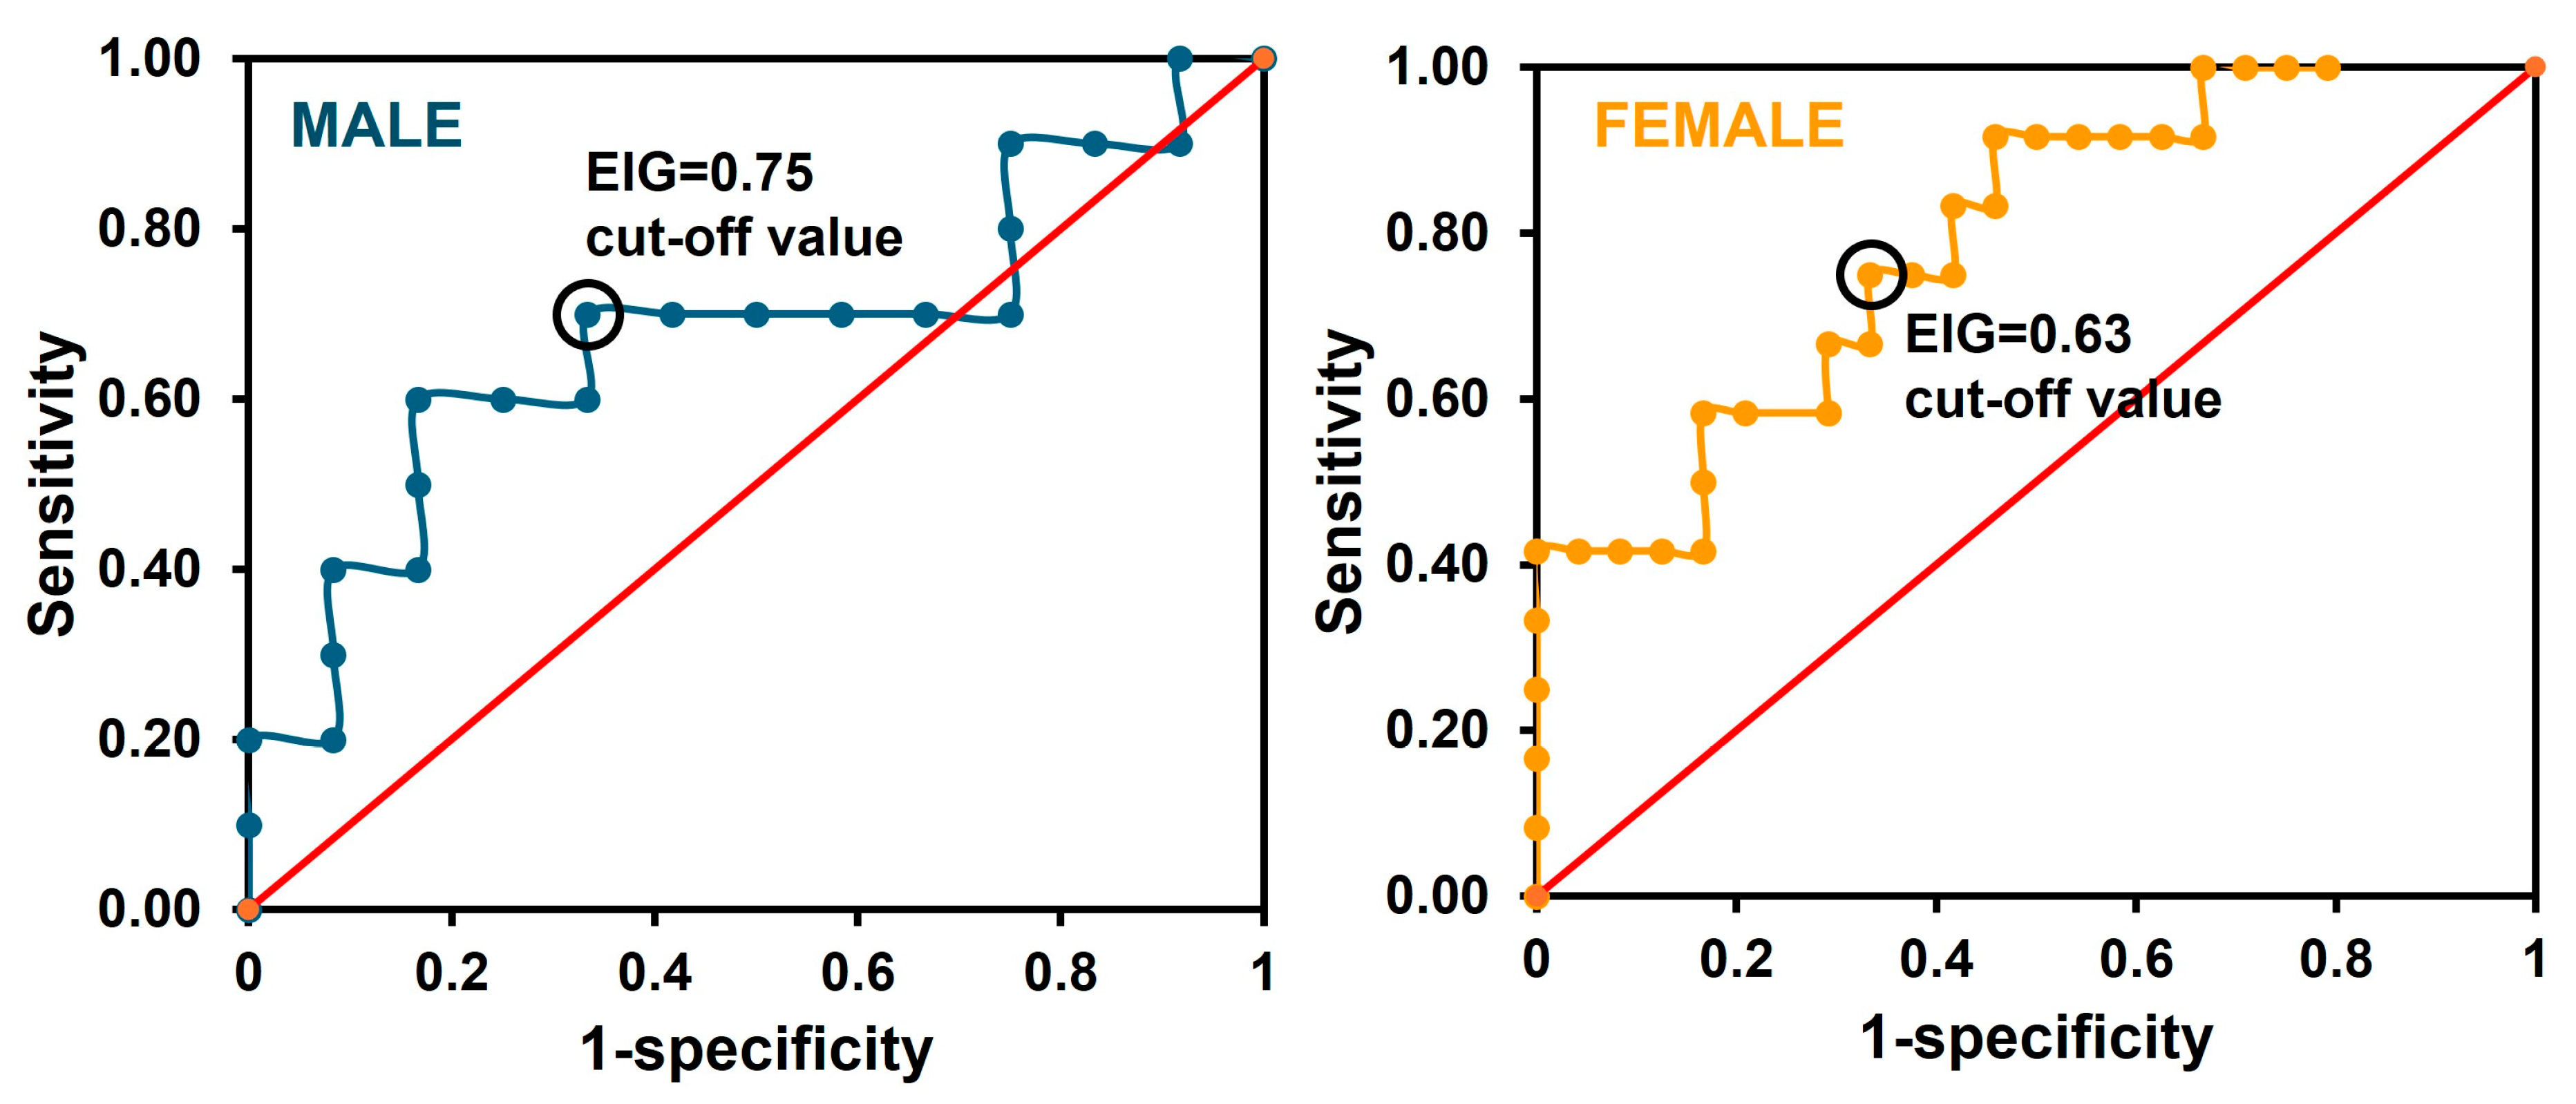
2.3.6. Clinical Sensitivity and Specificity

The clinical sensitivity and specificity of the sensor were calculated using the following equations:
Sensitivity = TP/(TP + FN);  Specificity = TN/(FP + TN)
where TP are the number of true positives, FN the number of false negatives, TN the number of true negatives, and FP the number of false positives.
The dichotomous diagnostic performance of the sensor was evaluated by the Youden’s index:
Youden’s index = Sensitivity + Specificity − 1

3. Results and Discussion

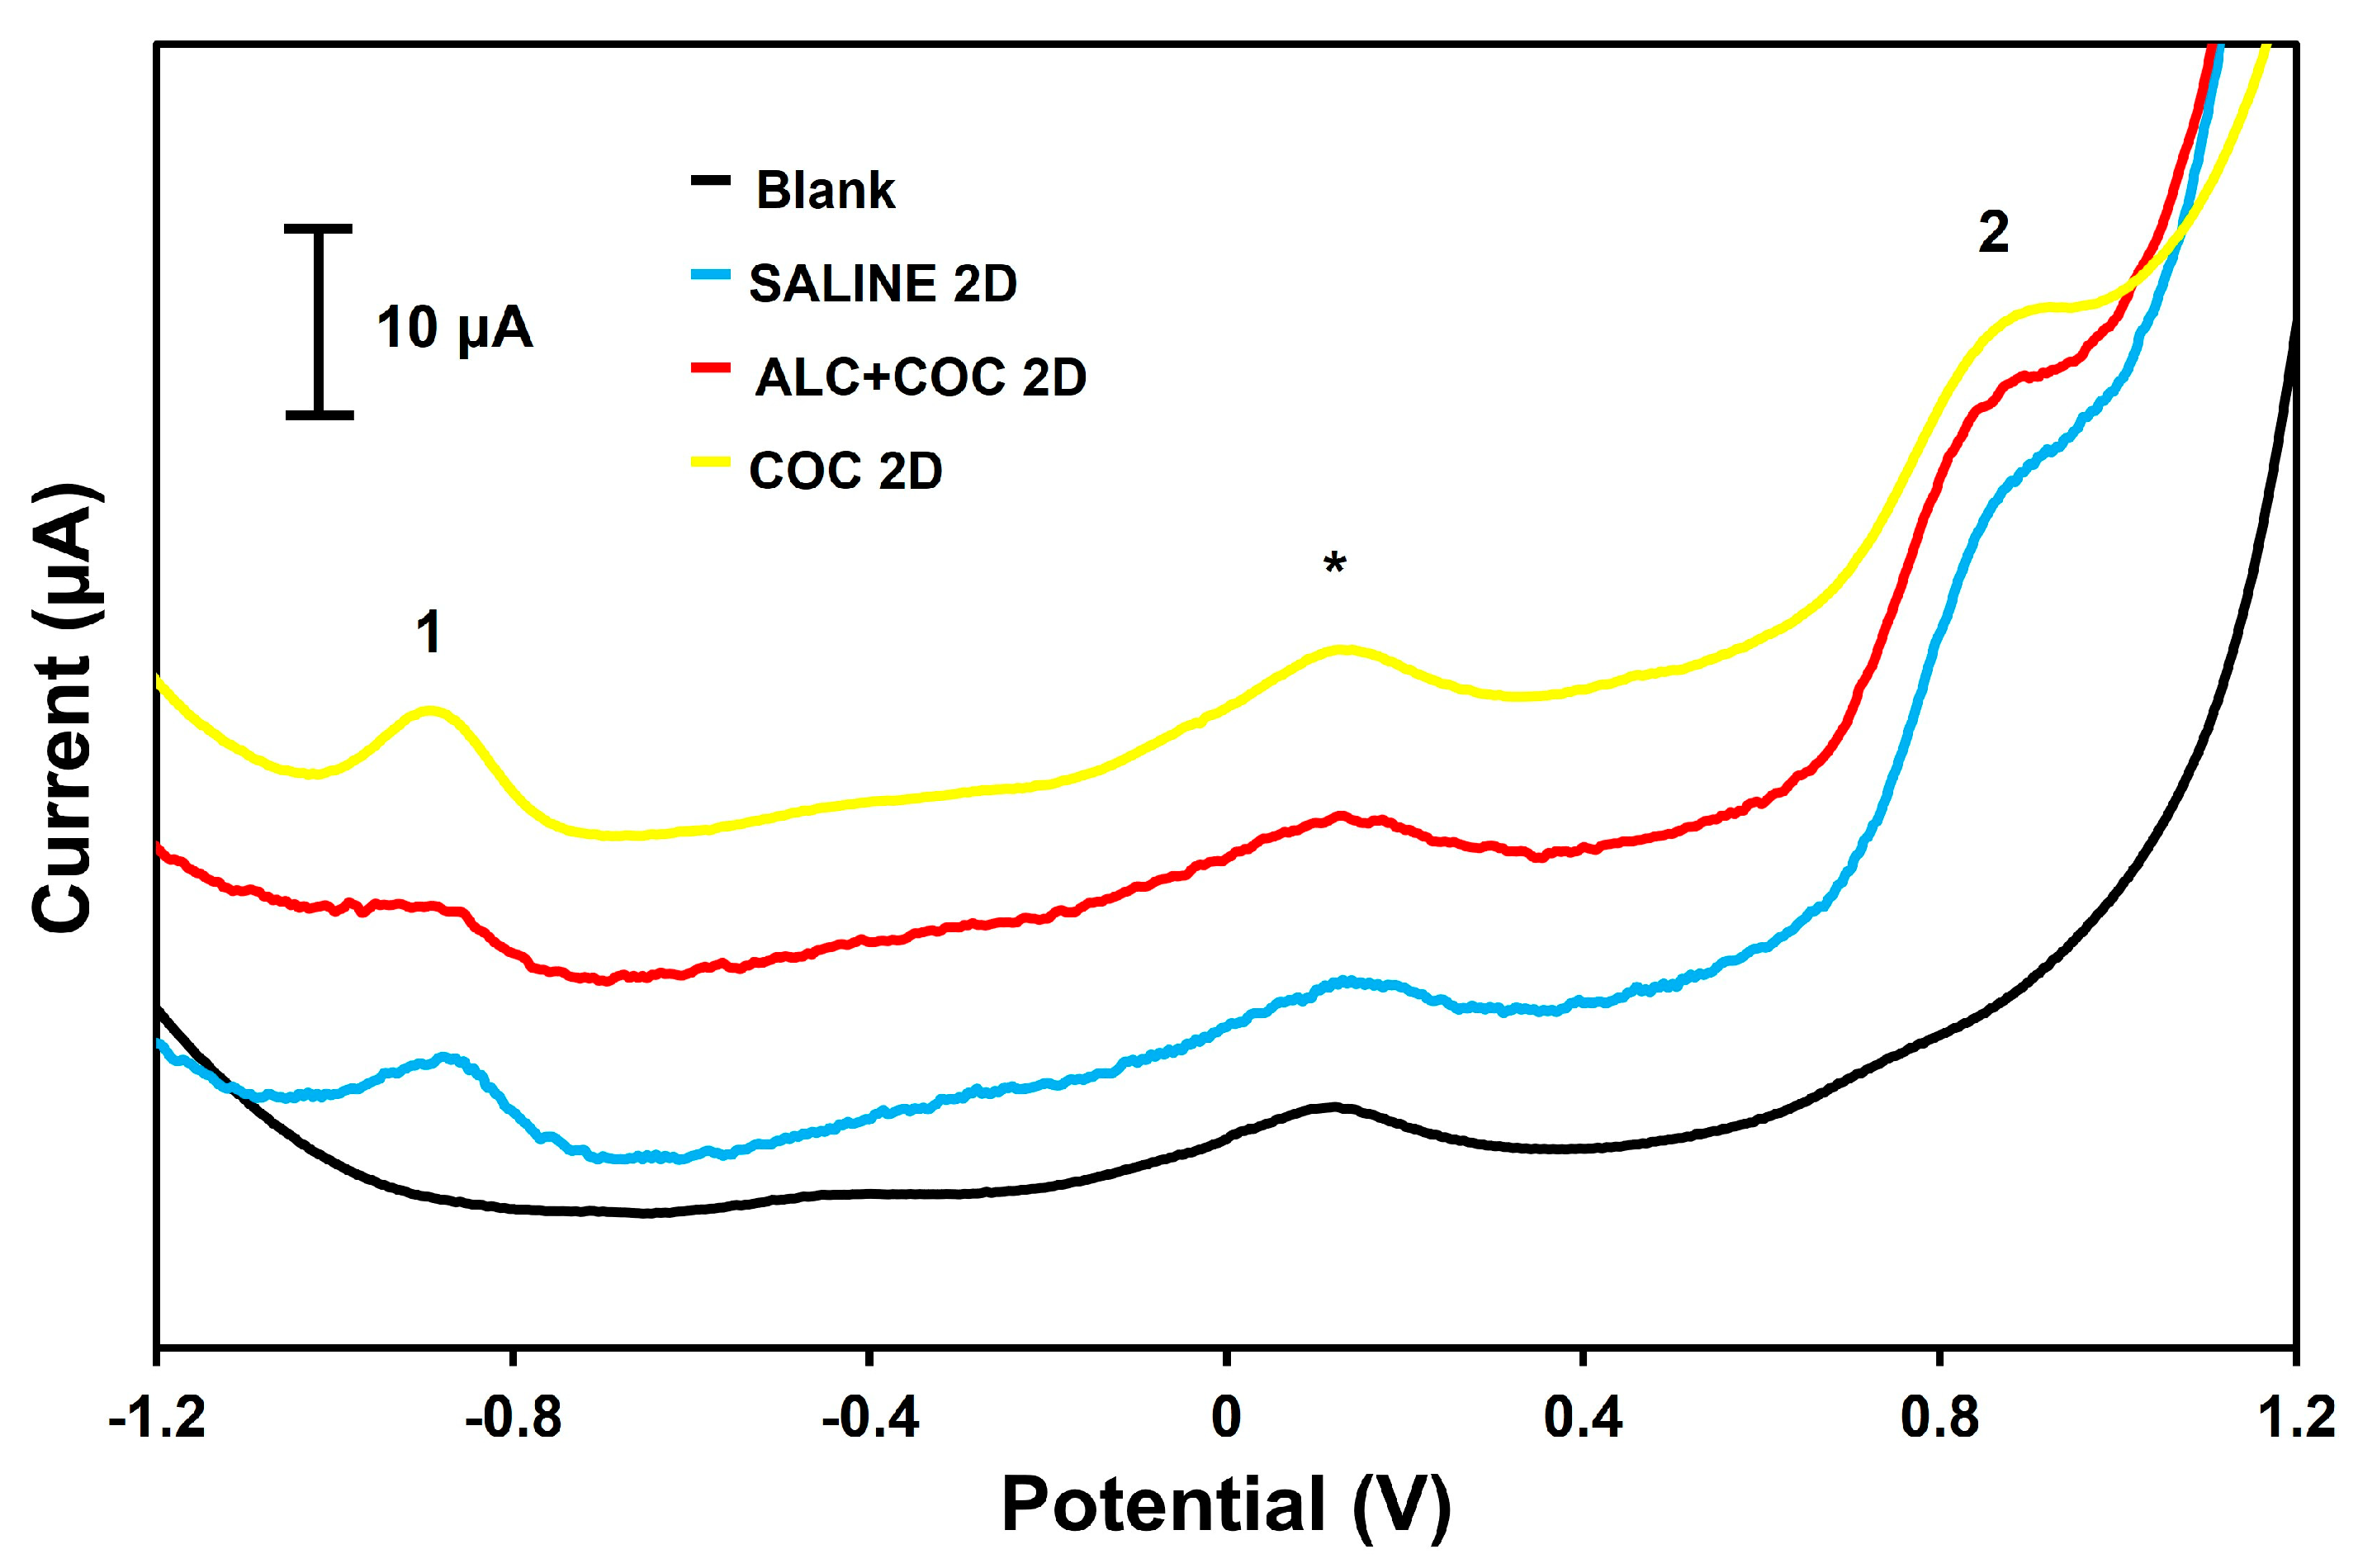
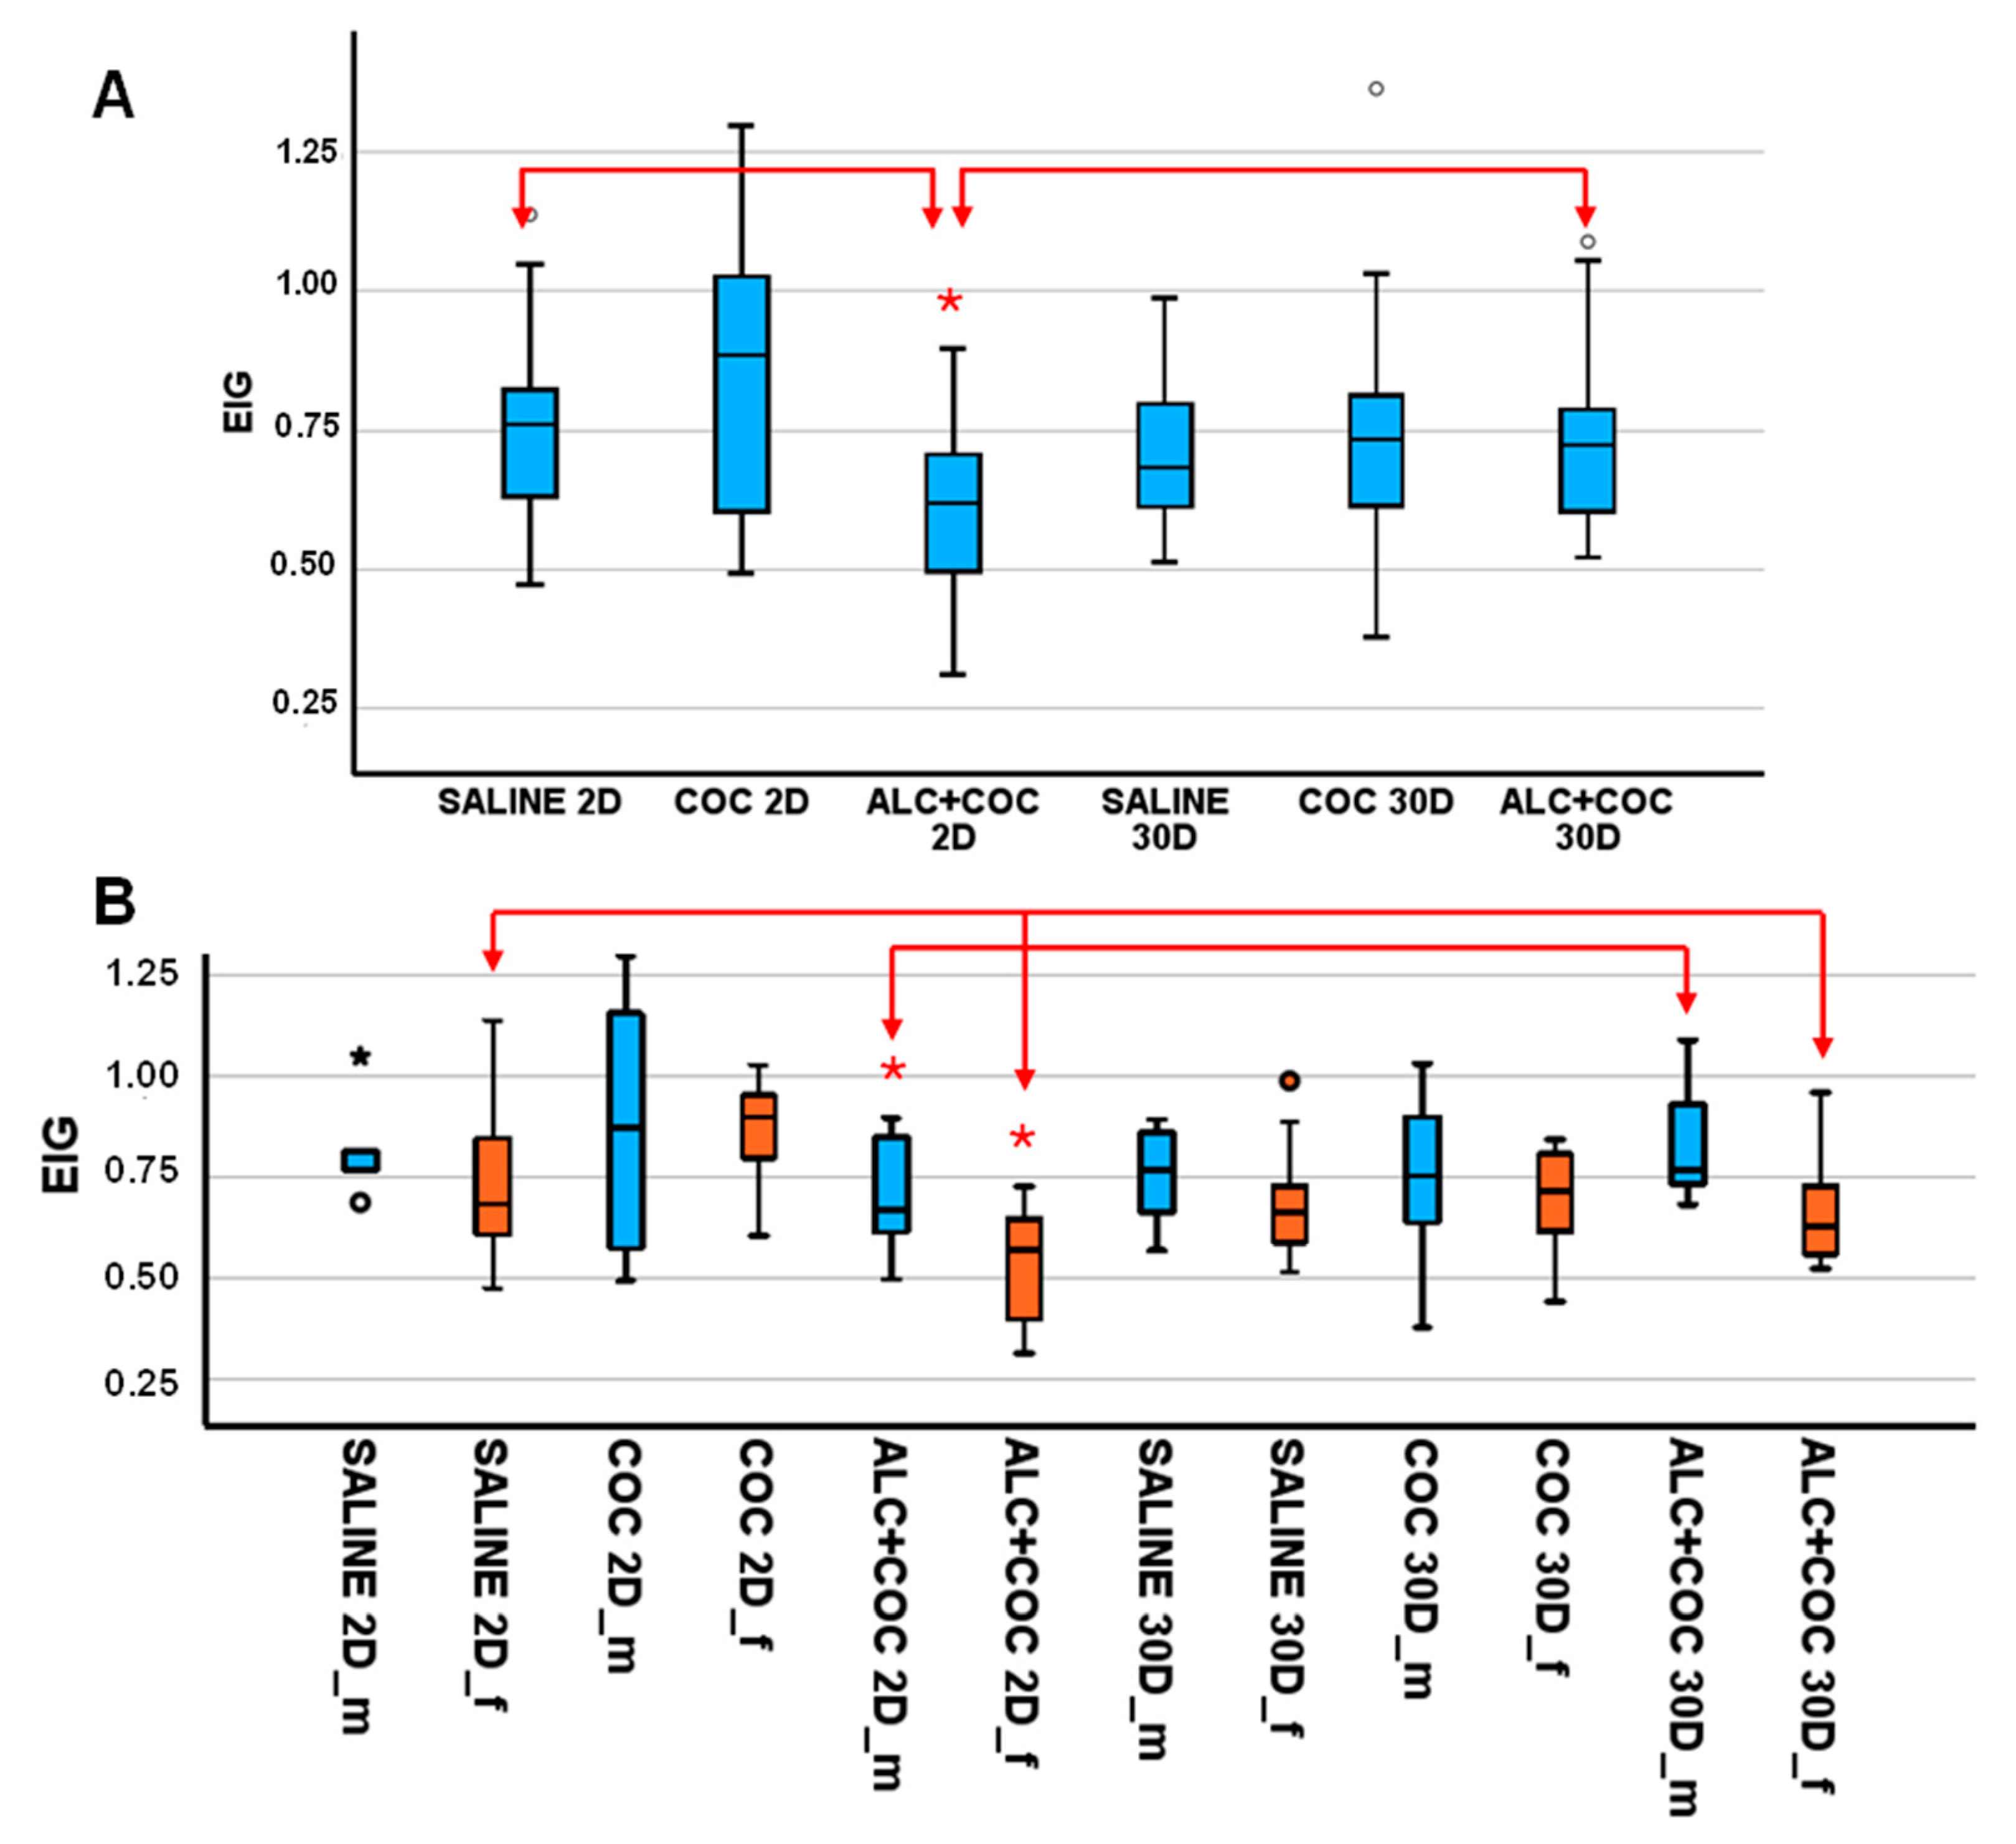
3.1. EIG Level in Rat Plasma from Polydrug-Consuming Rats

Although clinical studies with volunteers have not found a relationship between cocaine consumption and CDT values [27], there are, to our best knowledge, no preclinical studies with animal models of simultaneous self-administration of alcohol and cocaine. In the present study, we want to contribute to fill this gap. Our experimental design is shown in Figure 1. Six groups were designed in this study according to the different treatments (i) and withdrawal period (ii): (i) rats fed saline solution (SALINE, control), rats that self-administered alcohol and cocaine (ALC+COC), and rats that self-administered cocaine (COC); and (ii) rats sacrificed after 2 days (2D) of withdrawal and after 30 days (30D) of withdrawal. The groups were labelled SALINE 2D, SALINE 30D, ALC+COC 2D, ALC+COC 30D, COC 2D, and COC 30D. It is worth mentioning that rats do not self-administer alcohol intravenously in relevant doses. However, the combination with cocaine compensates for the potential aversive nature of intravenous ethanol alone self-administration, reaching doses of 133 mg of alcohol per infusion [26,28]. Moreover, the two withdrawal periods allowed us to evaluate the expected recovery of protein glycosylation after a long time of alcohol withdrawal (30D). The sex dimension was also considered by selecting female (F) and male (M) rats for every group. There were 121 rats (65 female and 56 male) in total for this study.
The EIG values for each rat and the corresponding standard deviation are collected in Table S1. Every plasma sample was analyzed in triplicate. Regarding EIG parameters, the higher the amount of carbohydrates in Tf (glycosylation level), the higher the EIG value. For illustrative purposes, Figure 2 shows SWV voltammograms from one representative sample of each 2D withdrawal group (SALINE 2D, ALC+COC 2D, and COC 2D). As we reported previously, two peaks appear at −0.9 V (peak 1) and at +0.8 V (peak 2), corresponding to the Tf-Os (VI) signal. Peak 1 is due to Os(VI) electrochemistry [29] and peak 2 is due to the electrochemical oxidation of amino acid residues (Cys, Trp, Tyr) from Tf [22]. The EIG value of each sample is calculated by using the intensity of both peaks (1 and 2) and Equation (1).
Figure 3A shows the box and whiskers plot of EIG for each subgroup without considering sex. The lowest EIG median corresponds to the ALC+COC 2D subgroup and the highest to the COC 2D subgroup. To evaluate if there are significant differences among the groups, a statistical study was carried out. The confidence level was set at 90%, because of the low number of individuals in some groups (for instance, n = 5 for SALINE 2D male). In addition, due to the lack of normality of some groups, and the heterogeneous number of individuals per subgroup (from 17 for SALINE 2D to 28 for ALC+COC 30D), non-parametric tests were used [30]. According to the Kruskal–Wallis H test, there were significant differences (p = 0.004) by effect of treatment (SALINE, ALC+COC and COC) among the 2D groups, but not among 30D groups (p = 0.239). Focusing on 2D groups, further statistical analysis performed between the different groups (Mann–Whitney U) revealed a reduction in EIG values by effect of alcohol, with significant differences between the SALINE vs. ALC+COC (p = 0.015) and COC vs. ALC+COC (p = 0.003) groups, but not between SALINE vs. COC groups (p = 0.248). As expected, alcohol consumption caused a decrease in the glycosylation of transferrin (lower EIG) for rats, but not cocaine consumption. It is well known that chronic alcohol abuse affects glycosylation of proteins [31]; for this reason, CDT is used as a biomarker of this disorder [11]. However, the effect of cocaine abuse on transferrin has only been described for the saturation of transferrin [32] (amount of iron bound to this protein), and not for its glycosylation. So, the comparison of EIG results obtained between SALINE and COC groups seems to indicate the negligible effect of cocaine in protein glycosylation. Moreover, EIG value for ALC+COC 2D subgroup was significantly lower than ALC+COC 30D subgroup (p = 0.022), indicating that the loss of transferrin glycosylation from alcohol consumption was recovered after 30 days of withdrawal. In sum, the sensor was able to monitor the decrease in EIG (transferrin glycosylation) owing to alcohol consumption, and also the recovery of EIG to basal levels after a long withdrawal period (30 days).
Then, sex dimension was also studied (see Figure 3B). In all groups, except COC 2D, the EIG median was slightly lower for female than for male rats. In fact, we found significant differences between sexes (all male cases vs. all female cases, Mann–Whitney U test, p = 0.002). In this sense, Trbojević-Akmačić et al. reported that men produce Tf with higher carbohydrate branching and chain length than women [33], so our results in rats are coherent with those provided for humans. Kruskal–Wallis H test showed significant differences among the 2D groups (SALINE, ALC+COC and COC) for female rats (p = 0.002) but not for male rats (p = 0.380). In addition, there were no significant differences among 30D groups for either female (p = 0.442) or male (p = 0.589) rats. Regarding alcohol effect (2D group), there were significant differences between ALC+COC 2D and SALINE 2D for female rats (Mann–Whitney U test, p = 0.015), but not for male rats (p = 0.157). Moreover, ALC+COC 2D female rats showed significantly lower EIG values than ALC+COC 2D males (p = 0.025). However, there are no significant differences between male and female rats in SALINE 2D group (p = 0.279). This may indicate a higher toxic effect of alcohol on female than male rats, as reported for humans [34]. Moreover, regarding the withdrawal period of 30D, we found significant differences between ALC+COC 2D and ALC+COC 30D for female (p = 0.082) and male rats (p = 0.043), but not among 30D groups (SALINE, ALC+COC, COC) (Kruskal–Wallis H test, p = 0.589 for male and p = 0.442 for female). So, this withdrawal period is enough for the recovery of protein glycosylation in both sexes.

3.2. Preclinical Validation of the Sensor

In our previous article [23], we reported an EIG cut-off value of 0.61 to identify alcohol abuse in rats. In that case, the corresponding receiver operating characteristic (ROC) curve was plotted by using two well-controlled groups: SALINE and ALCOHOL. Rats from the alcohol group received 2 g alcohol per kg body weight by using an intravenous catheter for 21 days. Furthermore, the sex dimension was not addressed in these experiments. In this case, the first approach was to use this cut-off value on the new set of data (Table S1), considering SALINE 2D and 30D, ALC+COC 30D, and COC 2D and COC 30D as negative samples (non-alcohol consumers); and only ALC+COC 2D as positive sample (alcohol consumers), considering the statistical analysis performed previously. Results are shown in Table 1, and it can be observed that only 30% of alcoholic male rats were correctly classified and 67% of alcoholic female rats were correctly classified. In general, 40 of 56 male rats’ samples were correctly classified, and 44 of 65 samples were correctly classified, giving rise to 71% and 68% of correct classification, respectively.
Using Equation (2), this cut-off value yields a sensitivity of 50% and a specificity of 74%. Clearly, the sensitivity is not satisfactory for screening purposes, because it means 50% false negatives. It is better to obtain a false positive (specificity) than a false negative (sensitivity), because a false positive can be confirmed later by a more robust bench-top instrument.
Considering the latter and the EIG differences between female and male rats showed in this work, it was considered necessary to establish a new cut-off value for alcohol chronic abuse considering the sex dimension. To this end, the data from SALINE group (2D and 30D) were chosen as negative cases (control group); and data from ALC+COC 2D were chosen as positive cases. With these data, the corresponding ROC curves were plotted for male and female rats (see Figure 4). The best diagnostic performance of the sensor was provided by the EIG values of 0.75 for male (Youden’ index = 0.37), and 0.63 for female (Youden’ index = 0.42). These new cut-off values were higher than in our previous work (EIG = 0.61) [23], surely due to the lower amount of alcohol ingested by rats in the self-administered mode (current work) with respect to passive direct vein infusion (previous work). These new cut-off values yielded a sensitivity of 70% for male and 83% for female, and a specificity of 57% for male and 58% for female rats, reducing the number of false negatives (higher sensitivity) with respect to the previous cut-off value (EIG = 0.61).
These new cut-off values were used to classify all samples from the different groups (SALINE 2D and 30D, ALC+COC 2D and 30D, and COC 2D and 30D), considering sex (see Table 2). Samples from groups SALINE 2D, SALINE 30D, COC2D, COC30D, and ALC+COC 30D were considered as non-alcohol samples, and the group ALC+COC 2D was considered as alcohol samples. As can be seen in Table 2, 70% of alcoholic male rats were correctly classified, and 83% of alcoholic female rats were correctly classified. In general, 33 of 56 male rats’ samples were correctly classified, and 41 of 65 female rats’ samples were correctly classified, giving rise to 59 and 63% of correct classification, respectively.
Although these values of general correct classification are lower than those previously reported with the 0.61 EIG cut-off value, it must be considered an improvement in correct classification for alcoholic rats from 30% to 70% in male rats with the new EIG cut-off value and from 67 to 83% in female rats. In contrast, this improvement in alcoholic rats’ classification is countered in the total rats’ classification by the misclassification of the larger population of non-alcoholic rats, whose correct classification decreased from 80% to 57% in male rats and from 68 to 58% in female rats, with the new EIG cut-off values. All in all, the new EIG cut-off values produced a significant improvement of the chronic alcohol consumers classification sample, minimizing false negatives, which is the main handicap of a sensor for its clinical application. In addition, the sensitivity provided by the sensor is in the range of other CDT-based assays for humans (28–90%) [35].
Currently, there are some immunoassays for CDT assessment, such as the commercial immunoassay kit “N Siemens Latex CDT assay”. Table 3 shows some representative examples where these immunoassays were used. The diagnostic performance of this immunoassay depends on the state of the patient (comorbidity, pregnancy, etc.), and the alcohol consumption pattern (heavy, moderate, etc.). In this sense, our approach showed lower diagnosis performance, but it was applied to an animal model, so the comparison is not easy. However, our method employs a hand-held instrument and it can be used near the point of care, unlike commercial immunoassays that need bench-top equipment (plate reader, nephelometer). Moreover, our sensor is disposable (preventing cross-contamination), cheap, and easy-to-use, so it is a potential candidate for a POCT used by non-specialized personnel in detox treatments.
Finally, the proposed POCT is a perfect complement to breath alcohol test (gold standard), because the latter gives information on short-term alcohol consumption and the former on long-term consumption.

4. Conclusions

In this work, an electrochemical sensor for alcohol abuse identification was validated by the analysis of plasma from rats that self-administered alcohol and cocaine, trying to imitate this frequent human polyconsumption pattern. The proposed sensor was able to discriminate between alcohol-consuming rats (ALC+COC 2D group) and non-alcohol-consuming rats (SALINE and COC), with the former showing significantly lower EIG values. Moreover, there were significant differences between ALC+COC 2D group and ALC+COC 30D group, so after 30 days of withdrawal, the EIG values of rats returned to normal values.
Regarding the sex, female rats that self-administered cocaine and alcohol showed significantly lower EIG values than males after two withdrawal days, demonstrating higher influence of alcohol on females than males. This fact led us to establish different cut-off values according to sex (0.63 for female and 0.75 for male). According to these new cut-off values, the sensor showed a sensitivity of 70% for male and 75% for female rats, and a specificity of 67% for both sexes.
Our sensor shows specific characteristics to be used as POCT for alcohol abuse screening and monitoring such as portability, disposability, low-cost, and user-friendly, even when alcohol consumption is combined with cocaine. Although this sensor did not provide extraordinary sensitivity and specificity, it was able to monitor the decrease in EIG due to alcohol consumption, and the recovery of EIG after a long withdrawal period. Therefore, this sensor may be a useful tool for physicians, therapists, and caregivers in detox processes, after carrying out the corresponding clinical validation in humans. The latter is our next step.

Supplementary Materials

The following supporting information can be downloaded at: https://www.mdpi.com/article/10.3390/chemosensors13030097/s1, Table S1: EIG evaluation of plasma sample from the different rat groups.

Author Contributions

Conceptualization, A.G.C. and E.A.; methodology, A.G.C. and E.A.; validation, A.G.C., R.M.-H. and O.M.-M.; formal analysis, A.M., O.M.-M. and A.G.C.; investigation, R.M.-H., A.M. and L.G.-M.; resources, A.M. and L.G.-M.; data curation, O.M.-M.; writing—original draft preparation, A.G.C.; writing—review and editing, all authors; visualization, O.M.-M., R.M.-H., A.G.C. and L.G.-M.; supervision, A.G.C. and E.A; project administration, A.G.C. and E.A.; funding acquisition, E.A. All authors have read and agreed to the published version of the manuscript.

Funding

This research was funded by Plan Nacional sobre Drogas, Ministerio de Sanidad, Spain, grant number 2021I043, and by Plan de promoción de la investigación UNED-MANT 2022–2024, UNED, Spain.

Institutional Review Board Statement

The animal study protocol was approved by the Bioethics Committee of the Universidad Nacional de Educación a Distancia (UNED, Madrid, Spain) and the Autonomous Community of Madrid (PROEX 327.0-23).

Data Availability Statement

The research data are stored in Zenodo repository (https://zenodo.org/records/14809589, access date 6 March 2025).

Acknowledgments

L.G.M. acknowledges the pre-doc fellowship granted by UNED.

Conflicts of Interest

The authors declare no conflicts of interest.

Abbreviations

The following abbreviations are used in this manuscript:
AdTSWVadsorptive transfer square wave voltammetry
ALCAlcohol
AUDAlcohol use disorders
CDTCarbohydrate-deficient transferrin
COCCocaine
EIGElectrochemical index of glycosylation
POCTPoint-of-care testing
ROCReceiver operating characteristic
SWVSquare wave voltammetry
TfTransferrin
TEMEDN,N,N’,N’-tetramethylethylenediamine

References

  1. Feltenstein, M.W.; See, R.E.; Fuchs, R.A. Neural Substrates and Circuits of Drug Addiction. Cold Spring Harb. Perspect. Med. 2021, 11, a039628. [Google Scholar] [CrossRef] [PubMed]
  2. Fleurya, M.-J.; Djouini, A.; Huỳnh, C.; Tremblay, J.; Ferland, F.; Ménard, J.-M.; Belleville, G. Remission from substance use disorders: A systematic review and meta-analysis. Drug Alcohol Depend. 2016, 168, 293–306. [Google Scholar] [CrossRef] [PubMed]
  3. Rehm, J.; Anderson, P.; Barry, J.; Dimitrov, P.; Elekes, Z.; Feijão, F.; Frick, U.; Gual, A.; Gmel, J.G.; Kraus, L.; et al. Prevalence of and Potential Influencing Factors for Alcohol Dependence in Europe. Eur. Addict. Res. 2014, 21, 6–18. [Google Scholar] [CrossRef] [PubMed]
  4. Grant, B.F.; Goldstein, R.B.; Saha, T.D.; Chou, S.P.; Jung, J.; Zhang, H.; Pickering, R.P.; Ruan, W.J.; Smith, S.M.; Huang, B.; et al. Epidemiology of DSM-5 Alcohol Use Disorder: Results From the National Epidemiologic Survey on Alcohol and Related Conditions III. JAMA Psychiatry 2015, 72, 757–766. [Google Scholar] [CrossRef]
  5. Liu, Y.; Williamson, V.G.; Setlow, B.; Cottler, L.B.; Knackstedt, L.A. The importance of considering polysubstance use: Lessons from cocaine research. Drug Alcohol Depend. 2018, 192, 16–28. [Google Scholar] [CrossRef]
  6. Cabezas, J.; Lucey, M.R.; Bataller, R. Biomarkers for Monitoring Alcohol Use. Clin. Liver Dis. 2016, 8, 59–63. [Google Scholar] [CrossRef]
  7. Liu, J.; Man, K. Biomarkers for monitoring alcohol sobriety after liver transplantation for alcoholic liver disease. J. Gastroenterol. Hepatol. 2023, 38, 1227–1232. [Google Scholar] [CrossRef]
  8. Andresen-Streichert, H.; Müller, A.; Glahn, A.; Skopp, G.; Sterneck, M. Alcohol Biomarkers in Clinical and Forensic Contexts. Dtsch. Arztebl. Int. 2018, 115, 309–315. [Google Scholar] [CrossRef]
  9. Volkow, N.D.; Koob, G.; Baler, R. Biomarkers in substance use disorders. ACS Chem. Neurosci. 2015, 6, 522–525. [Google Scholar] [CrossRef]
  10. Van Uytfanghe, K.; De Boosere, E.; Stove, C.P. Monitoring the use of alcohol—A critical overview of the state-of-the-art biomarkers. WIREs Forensic. Sci. 2022, 4, e1457. [Google Scholar] [CrossRef]
  11. Bortolotti, F.; Sorio, D.; Bertaso, A.; Tagliaro, F. Analytical and diagnostic aspects of carbohydrate deficient transferrin (CDT): A critical review over years 2007–2017. J. Pharm. Biomed. Anal. 2018, 147, 2–12. [Google Scholar] [CrossRef] [PubMed]
  12. Caslavska, J.; Thormann, W. Monitoring of alcohol markers by capillary electrophoresis. J. Sep. Sci. 2013, 36, 75–95. [Google Scholar] [CrossRef]
  13. Delanghe, J.R.; Helander, A.; Wielders, J.P.; Pekelharing, J.M.; Roth, H.J.; Schellenberg, F.; Born, C.; Yagmur, E.; Gentzer, W.; Althaus, H. Development and multicenter evaluation of the N Latex CDT direct immunonephelometric assay for serum carbohydrate-deficient transferrin. Clin. Chem. 2007, 53, 1115–1121. [Google Scholar] [CrossRef]
  14. Kim, C.; Kang, M.S.; Raja, I.S.; Joung, Y.K.; Han, D.-W. Advancements in nanobiosensor technologies for in-vitro diagnostics to point of care testing. Heliyon 2024, 10, e40306. [Google Scholar] [CrossRef] [PubMed]
  15. Vashist, S.K.; Luppa, P.B.; Yeo, L.Y.; Ozcan, A.; Luong, J.H.T. Emerging Technologies for Next-Generation Point-of-Care Testing. Trends Biotechnol. 2015, 33, 692–705. [Google Scholar] [CrossRef]
  16. Hernández-Rodríguez, J.F.; Rojas, D.; Escarpa, A. Electrochemical Sensing Directions for Next-Generation Healthcare: Trends, Challenges, and Frontiers. Anal. Chem. 2020, 93, 167–183. [Google Scholar] [CrossRef] [PubMed]
  17. Dai, Y.; Liu, C.C. Recent Advances on Electrochemical Biosensing Strategies toward Universal Point-of-Care Systems. Angew Chem. Int. Ed. Engl. 2019, 58, 12355–12368. [Google Scholar] [CrossRef]
  18. Paimard, G.; Ghasali, E.; Baeza, M. Screen-Printed Electrodes: Fabrication, Modification, and Biosensing Applications. Chemosensors 2023, 11, 113. [Google Scholar] [CrossRef]
  19. Campbell, A.S.; Kim, J.; Wang, J. Wearable electrochemical alcohol biosensors. Cur. Op. Electrochem. 2018, 10, 126–135. [Google Scholar] [CrossRef]
  20. Costa, N.G.; Antunes, J.C.; Paleo, A.J.; Rocha, A.M. A Review on Flexible Electrochemical Biosensors to Monitor Alcohol in Sweat. Biosensors 2022, 12, 252. [Google Scholar] [CrossRef]
  21. Lin, K.-C.; Kinnamon, D.; Sankhala, D.; Muthukumar, S.; Prasad, S. AWARE: A Wearable Awareness with Real-time Exposure, for monitoring alcohol consumption impact through ethyl glucuronide detection. Alcohol 2019, 81, 93–99. [Google Scholar] [CrossRef]
  22. Sierra, T.; Crevillen, A.G.; Escarpa, A. Electrochemical sensor for the assessment of carbohydrate deficient transferrin: Application to diagnosis of congenital disorders of glycosilation. Biosens. Bioelectron. 2021, 179, 113098. [Google Scholar] [CrossRef] [PubMed]
  23. Rodriguez-Hidalgo, G.; Sierra, T.; Dortez, S.; Marcos, A.; Ambrosio, E.; Crevillen, A.G.; Escarpa, A. Transferrin analysis in wistar rats plasma: Towards an electrochemical point-of-care approach for the screening of alcohol abuse. Microchem. J. 2022, 181, 107738. [Google Scholar] [CrossRef]
  24. Trefulka, M.; Paleček, E. Direct chemical modification and voltammetric detection of glycans in glycoproteins. Electrochem. Commun. 2014, 48, 52–55. [Google Scholar] [CrossRef]
  25. Trefulka, M.; Černocká, H.; Staroňová, T.; Ostatná, V. Voltammetric analysis of glycoproteins containing sialylated and neutral glycans at pyrolytic graphite electrode. Bioelectrochemistry 2024, 163, 108851. [Google Scholar] [CrossRef]
  26. Marcos, A.; Moreno, M.; Orihuel, J.; Ucha, M.; de Paz, A.M.; Higuera-Matas, A.; Capellán, R.; Crego, A.L.; Martínez-Larrañaga, M.-R.; Ambrosio, E.; et al. The effects of combined intravenous cocaine and ethanol self-administration on the behavioral and amino acid profile of young adult rats. PLoS ONE 2020, 15, e0227044. [Google Scholar] [CrossRef] [PubMed]
  27. Conigrave, K.M.; Degenhardt, L.J.; Whitfield, J.B.; Saunders, J.B.; Helander, A.; Tabakoff, B. CDT, GGT, and AST as markers of alcohol use: The WHO/ISBRA Collaborative Project. Alcohol. Clin. Exp. Res. 2002, 26, 332–339. [Google Scholar] [CrossRef]
  28. Ikegami, A.; Olsen, C.M.; Fleming, S.M.; E Guerra, E.; A Bittner, M.; Wagner, J.; Duvauchelle, C.L. Intravenous ethanol/cocaine self-administration initiates high intake of intravenous ethanol alone. Pharmacol. Biochem. Behav. 2002, 72, 787–794. [Google Scholar] [CrossRef]
  29. Sierra, T.; González, M.C.; Moreno, B.; Crevillen, A.G.; Escarpa, A. Total α1-acid glycoprotein determination in serum samples using disposable screen-printed electrodes and osmium (VI) as electrochemical tag. Talanta 2018, 180, 206–210. [Google Scholar] [CrossRef]
  30. Nahm, F.S. Nonparametric statistical tests for the continuous data: The basic concept and the practical use. Korean J. Anesthesiol. 2016, 69, 8–14. [Google Scholar] [CrossRef]
  31. Waszkiewicz, N.; Szajda, S.D.; Zalewska, A.; Szulc, A.; Kępka, A.; Minarowska, A.; Wojewódzka-Żelezniakowicz, M.; Konarzewska, B.; Chojnowska, S.; Ładny, J.R.; et al. Alcohol abuse and glycoconjugate metabolism. Folia Histochem. Cytobiol. 2012, 50, 1–11. [Google Scholar] [CrossRef]
  32. Ersche, K.D.; Acosta-Cabronero, J.; Jones, P.S.; Ziauddeen, H.; van Swelm, R.P.L.; Laarakkers, C.M.M.; Raha-Chowdhury, R.; Williams, G.B. Disrupted iron regulation in the brain and periphery in cocaine addiction. Transl. Psychiatry 2017, 7, e1040. [Google Scholar] [CrossRef] [PubMed]
  33. Trbojević-Akmačić, I.; Vučković, F.; Pribić, T.; Vilaj, M.; Černigoj, U.; Vidič, J.; Šimunović, J.; Kępka, A.; Kolčić, I.; Klarić, L.; et al. Comparative analysis of transferrin and IgG N-glycosylation in two human populations. Commun. Biol. 2023, 6, 312. [Google Scholar] [CrossRef]
  34. Cargiulo, T. Understanding the health impact of alcohol dependence. Am. J. Health Pharm. 2007, 64, S5–S11. [Google Scholar] [CrossRef] [PubMed]
  35. Nanau, R.M.; Neuman, M.G. Biomolecules and Biomarkers Used in Diagnosis of Alcohol Drinking and in Monitoring Therapeutic Interventions. Biomolecules 2015, 5, 1339–1385. [Google Scholar] [CrossRef]
  36. Suzuki, T.; Eguchi, A.; Shigefuku, R.; Nagao, S.; Morikawa, M.; Sugimoto, K.; Iwasa, M.; Takei, Y. Accuracy of carbohydrate-deficient transferrin as a biomarker of chronic alcohol abuse during treatment for alcoholism. Hepatol. Res. 2021, 52, 120–127. [Google Scholar] [CrossRef]
  37. Chrostek, L.; Cylwik, B.; Gruszewska, E.; Tobolczyk, J. The diagnostic power of direct carbohydrate-deficient transferrin immunoassay in alcoholics. Absolute or relative values? Alcohol 2012, 46, 69–73. [Google Scholar] [CrossRef] [PubMed]
  38. Ireland, J.; Cheng, D.M.; Samet, J.H.; Bridden, C.; Quinn, E.; Saitz, R. Operating characteristics of carbohydrate-deficient transferrin (CDT) for identifying unhealthy alcohol use in adults with HIV infection. AIDS Care 2011, 23, 1483–1491. [Google Scholar] [CrossRef]
  39. Madhubala, V.; Subhashree, A.R.; Shanthi, B. Serum Carbohydrate Deficient Transferrin as A Sensitive Marker in Diagnosing Alcohol Abuse: A Case—Control Study. J. Clin. Diagn. Res. 2013, 7, 197–200. [Google Scholar] [CrossRef]
Figure 1. Experimental design to evaluate the level of EIG in polydrug-consuming rats.
Chemosensors 13 00097 g001
Figure 2. SWV voltammograms corresponding to SALINE 2D female sample (blue line, sample 17), to ALC+COC 2D female sample (red line, sample 48), to COC 2D female sample (yellow line, sample 99) and blank (black line, only anti-Tf magnetic beads). Peaks: (1) carbohydrate signal, (2) amino acids signal, * unknown.
Chemosensors 13 00097 g002
Figure 3. Box and whiskers plot for each group without considering sex (A) and considering sex (blue for male, and orange for female) (B). Red arrows and asterisks indicate the groups that show significant differences from other groups (p < 0.1). Black asterisk and circles are outliers.
Chemosensors 13 00097 g003
Figure 4. ROC curves for alcohol abuse identification in male (blue line) and female rats (orange line). The red line corresponds to the no discrimination line.
Chemosensors 13 00097 g004
Table 1. Classification of female (F) and male (M) rats as alcohol and non-alcohol consumers using EIG cut-off value of 0.61.
Classification2D30D30D2D
M (SAL)M (COC)M (SAL)M (COC)M (ALC+COC)M (ALC+COC)
Non-alcoholAlcohol
Non-alcohol5767127
Alcohol041403
%Correct classification8030
71
Classification2D30D30D2D
F (SAL)F (COC)F (SAL)F (COC)F (ALC+COC)F (ALC+COC)
Non-alcoholAlcohol
Non-alcohol968584
Alcohol314188
%Correct classification6867
68
The numbers in italics mean the number of samples correctly classified.
Table 2. Classification of female (F) and male (M) rats as alcohol and non-alcohol consumers using EIG cut-off value of 0.63 for female and 0.75 for male.
Classification2D30D30D2D
M (SAL)M (COC)M (SAL)M (COC)M (ALC+C0C)M (ALC+COC)
Non-alcoholAlcohol
Non-alcohol464483
Alcohol153747
%Correct classification5770
59
Classification2D30D30D2D
F (SAL)F (COC)F (SAL)F (COC)F (ALC+COC)F (ALC+COC)
Non-alcoholAlcohol
Non-alcohol767562
Alcohol51511010
%Correct classification5883
63
The numbers in italics mean the number of samples correctly classified.
Table 3. Immunoassay methods based on transferrin glycosylation for alcoholism diagnosis.
MethodPortabilityStudied GroupBiomarker/Cut-OffDiagnostic PerformanceRef.
N Latex CDT direct immuno-nephelometric assayNo126 Japanese alcohol-dependent patients (107 men/19 women)%CDT/1.9%77.9% sensitivity,
77.1% specificity
[36]
N Latex CDT direct immuno-nephelometric assayNo127 Polish adult alcoholics (44 men/100 women)%CDT/2.12%91.3% sensitivity,
90.4% specificity
[37]
N Latex CDT direct immuno-nephelometric assayNo47 HIV-positive heavy drinkers with self-reported alcohol consumption (32 men/15 women)%CDT/2.6%36% sensitivity,
88% specificity
[38]
Turbidimetric immunoassay, ELISA method (Biorad)No25 chronic alcoholic men%CDT/2.6%84% sensitivity,
92% specificity
[39]
Immuno-magnetic beads and electrochemical sensorYes121 alcohol and cocaine self-administered rats (56 male/65 female)EIG/0.75 for male
0.63 for female
70% sensitivity, 67% specificity for male.
75% sensitivity,
67% specificity for female.
This work
Disclaimer/Publisher’s Note: The statements, opinions and data contained in all publications are solely those of the individual author(s) and contributor(s) and not of MDPI and/or the editor(s). MDPI and/or the editor(s) disclaim responsibility for any injury to people or property resulting from any ideas, methods, instructions or products referred to in the content.

