Article

A Comprehensive Study of P-g-C3N4/MOF-199 Composite for Electrochemical Sensing of Metformin in Pharmaceutical Samples

by
Sara Dehdashtian
1,2,
Shengnian Wang
1,2 and
Teresa A. Murray
2,*
1
Institute for Micromanufacturing, Louisiana Tech University, Ruston, LA 71272, USA
2
Center for Biomedical Engineering and Rehabilitation Sciences, Louisiana Tech University, Ruston, LA 71272, USA
*
Author to whom correspondence should be addressed.
Chemosensors 2025, 13(3), 82; https://doi.org/10.3390/chemosensors13030082
Submission received: 26 December 2024 / Revised: 11 February 2025 / Accepted: 17 February 2025 / Published: 2 March 2025
(This article belongs to the Special Issue Electrochemical Sensing in Medical Diagnosis)

Abstract

:
A novel electrochemical sensor (P-g-C3N4/MOF-199/CPE) was developed to determine the metformin concentration in pharmaceutical samples. In this sensor, the copper units of MOF-199 of the composite electrode specifically capture metformin molecules so that the sensing selectivity is remarkably improved. Phosphorus-doped graphitic carbon nitrides (P-g-C3N4) further enhance the electrical conductivity and sensitivity of the sensor. The physical and chemical properties of these electrode modifiers were first characterized, followed by electrochemical sensing tests of metformin under different scan rates and pH values. A 39-fold increase in the electrooxidation current of metformin was found in this composite electrode when compared to its bare carbon paste counterpart. A limit of detection (LOD) of 0.15 nM was achieved in the linear sensing range of 0.5 to 1200 nM for metformin. The sensor also showed good reliability and recovery when detecting metformin in pharmaceutical samples. For the first time, we addressed the appearance of adsorption-based peaks in the voltammograms of electrochemical sensors for metformin as a common feature when copper ions are incorporated into the electrode structure. The electrochemical mechanism of metformin was also illustrated by highlighting the hydrolysis of oxime. The nature of all pH-dependent anodic and cathodic peaks in our sensing results confirms the proposed mechanism.

1. Introduction

Metformin is a biguanide drug that has been extensively used to treat Type-2 diabetes mellitus for a few decades [1]. It is also effective in reducing cancer risk and tumorigenesis [2] by activating adenosine 5′ monophosphate-activated protein kinase, an essential mediator of the tumor suppressor, such as the mechanistic target of rapamycin, to inhibit the growth of tumor cells [3]. Despite its low price and excellent safety record, metformin carries a black box warning for lactic acidosis, a rare but severe adverse effect with an incidence rate of approximately 1 in 30,000 patients [4,5,6]. This complication is mainly seen in diabetic patients with renal and hepatic abnormalities [6]. Therefore, it is important to have simple, fast, and reliable methods to monitor the concentration of metformin. Various approaches, including high-performance liquid chromatography (HPLC) [7], spectrophotometry [8], and capillary electrophoresis [9], have been applied to determine the concentration of metformin. However, these approaches are either expensive or involve time-consuming steps. Additionally, there is a day-long delay in sending samples to a lab with this type of equipment and receiving results. In contrast, electrochemical sensors for metformin detection are simple, fast, and sensitive, which positions them as attractive alternatives to traditional detection methods [10]. However, the current electrochemical sensors still face challenges in quantifying ultra-trace amounts of metformin. New designs and/or composite electrodes are necessary to perform metformin detection in pharmaceutical samples with high enough sensitivity.
In this study, a composite containing phosphorus-doped graphitic carbon nitride and a copper-based metal–organic framework (P-g-C3N4/MOF-199) was used to modify carbon paste electrodes for the fabrication of a new type of metformin sensor. Metal–organic frameworks (MOFs) are used in electrochemical sensors because of their huge specific surface areas, rich active metal sites, and porous structures. Since their first synthesis in 1995 by Yaghi’s group [11], the merits of MOFs have been extensively investigated in applications including catalysis, gas adsorption, separation, and the removal of hazardous organic materials, as well as sensor applications [12,13]. MOF-199 (also known as HKUST-1, Cu-BTC, and Basolite C300) is a copper-based microporous MOF composed of dimeric copper units bridged by benzene-1,3,5-tricarboxylate (BTC) linkers as a paddlewheel structure [14].
The copper units in the structure of MOF-199 promote the accumulation of metformin on the electrode surface through complexing with copper units and, consequently, improve the sensitivity and selectivity of the sensor [10]. Phosphorus-doped graphitic carbon nitrides (P-g-C3N4) are also included in the sensing electrode to achieve the desired mechanical and electrical properties [15,16]. Doping g-C3N4 with heteroatoms, such as B, P, S, or I, was found to be effective in regulating the electronic properties of an electrochemical sensor [17]. As for the P-g-C3N4 used in this study, its electrical conductivity increases by four orders of magnitude after doping versus its pristine counterparts [18]. Therefore, this new nanocomposite (P-g-C3N4/MOF-199) was introduced in this study to detect metformin in real pharmaceutical samples. To the best of our knowledge, there are no other reports of its use (i.e., P-g-C3N4/MOF-199 composite) for electrochemical sensors. For the first time, we addressed the appearance of adsorption-based peaks in the voltammograms of electrochemical sensors for metformin as a common feature when copper ions are incorporated into the electrode structure. The electrochemical mechanism of metformin was also illustrated by highlighting the hydrolysis of oxime. The nature of all pH-dependent anodic and cathodic peaks in our sensing results confirms the proposed mechanism. This study represents a significant step toward a deeper understanding of the metformin oxidation process at the electrode surface.

2. Materials and Methods

2.1. Materials and Instruments

The graphite powder was purchased from Merck and used in the preparation of carbon paste electrodes (CPEs). All other reagents (analytical grade) were purchased from Sigma-Aldrich (St. Louis, MO, USA). The phosphate buffer solutions were prepared from orthophosphoric acid and its salts in the pH range of 2.0–12.0.

2.2. Synthesis of MOF-199

The synthesis of MOF-199 was performed by using a solvothermal method [19] with Cu(NO3)2 and benzenetricarboxylic acid as precursors [20]. A solid mixture of copper (II) nitrate hemi(pentahydrate) (Cu(NO3)2·2.5 H2O) and 1,3,5-benzenetricarboxylic acid was dissolved in a mixture of EtOH, H2O, and DMF. After 10 min of stirring, this mixture was heated in an oven at 85 °C for 20 h. The blue solid product was filtered and washed with DMF. After that, the prepared MOF-199 was immersed in 30 mL DMF for 24 hr. Finally, the product (MOF-199) was filtered and dried at 170 °C for 24 h.

2.3. Synthesis of Graphitic Carbon Nitride (g-C3N4)

The synthesis of g-C3N4 followed a procedure reported in the literature [21]. For the synthesis of g-C3N4, 2 g of melamine was placed in a crucible and heated in a furnace at 580 °C for 90 min. The product was dissolved in 25 mL of deionized water and sonicated for 15 min. g-C3N4 was obtained by filtration.

2.4. Synthesis of Phosphorus-Doped Graphitic Carbon Nitride (P-g-C3N4)

For the synthesis of P-g-C3N4, 100 mL of an aqueous solution of phosphoric acid 2% (vol./vol.) was added to melamine, and the mixture was stirred for 1 h. The precipitate was filtered, placed in a crucible, and heated in a furnace at 550 °C for 1 h. Then, this product was dissolved in 25 mL of deionized water and sonicated for 15 min. P-g-C3N4 was obtained by filtration [21].

2.5. Fabrication of Modified Electrodes

The working electrodes were fabricated using graphite powder and paraffin oil. To prepare the modified electrode, an optimized amount of composite (P-g-C3N4/MOF-199) was mixed with graphite powder and paraffin oil. The formed paste was then incorporated into the end of a spacer and inserted into a holder to create the electrochemical electrodes for metformin sensing. The bare carbon paste electrode was prepared similarly, using only graphite powder and paraffin oil.

2.6. Material Characterization

Fourier transform infrared (FTIR) spectra were recorded on a Thermo Nicolet, Avatar 330 FTIR Spectrometer, USA. Field emission scanning electron microscopy (FE-SEM) with an integrated energy dispersive X-ray spectrum (EDS) module was performed by a Hitachi (S-4800), Tokyo, Japan). Wide-angle X-ray diffraction (XRD) measurements were performed on an XPertPro using Cu-K α radiation (λ = 1.54 Å). Nitrogen adsorption isotherms of the samples (>0.10 g) were obtained at −196 °C on a Micromeritics NOVA 2020e Surface Area and Porosity Analyzer. Before each measurement, the samples were degassed at 150 °C.

2.7. Electrochemical Measurements

Electrochemical experiments were performed using a Metrohm (Autolab, Utrecht, The Netherlands, model PGSTAT302N) electrochemical potentiostat. Electrochemical impedance spectroscopy (EIS) measurements were conducted in a frequency range of 0.1 to 105 Hz at an applied potential of 0.24 V and an amplitude of 0.01 VRMS. Cyclic voltammograms (CVs) of the prepared electrodes were recorded at various scan rates in 0.1 M phosphate buffer solutions in the range of −0.25 V to 1.2 V. Differential pulse voltammetry (DPV) was performed with a pulse amplitude of 50 mV and pulse width of 40 ms at a scan rate of 60 mV s−1.
The sensitivity (S) of a sensor is defined as the gradient of the linear portion of the curve as:
S = ΔIC
where ΔI is the change in current (in ampere (A)) and ΔC is the change in concentration (in mol/L) in the linear region.
The LOD is defined as the lowest concentration of an analyte that can be reproducibly determined, with a specified level of confidence, in a sample compared to a blank measurement. The LOD can be calculated as:
LOD = k × σ/S
where σ is the standard deviation of the blank measurements (i.e., noise level), S is the sensitivity calculated using Equation (2), and k is the confidence level parameter. The confidence level parameter is set as k = 3 in the calculation of the LOD. Alternatively, the confidence level parameter is set as k = 10 to calculate the level of quantification (LOQ) [22].

3. Results and Discussion

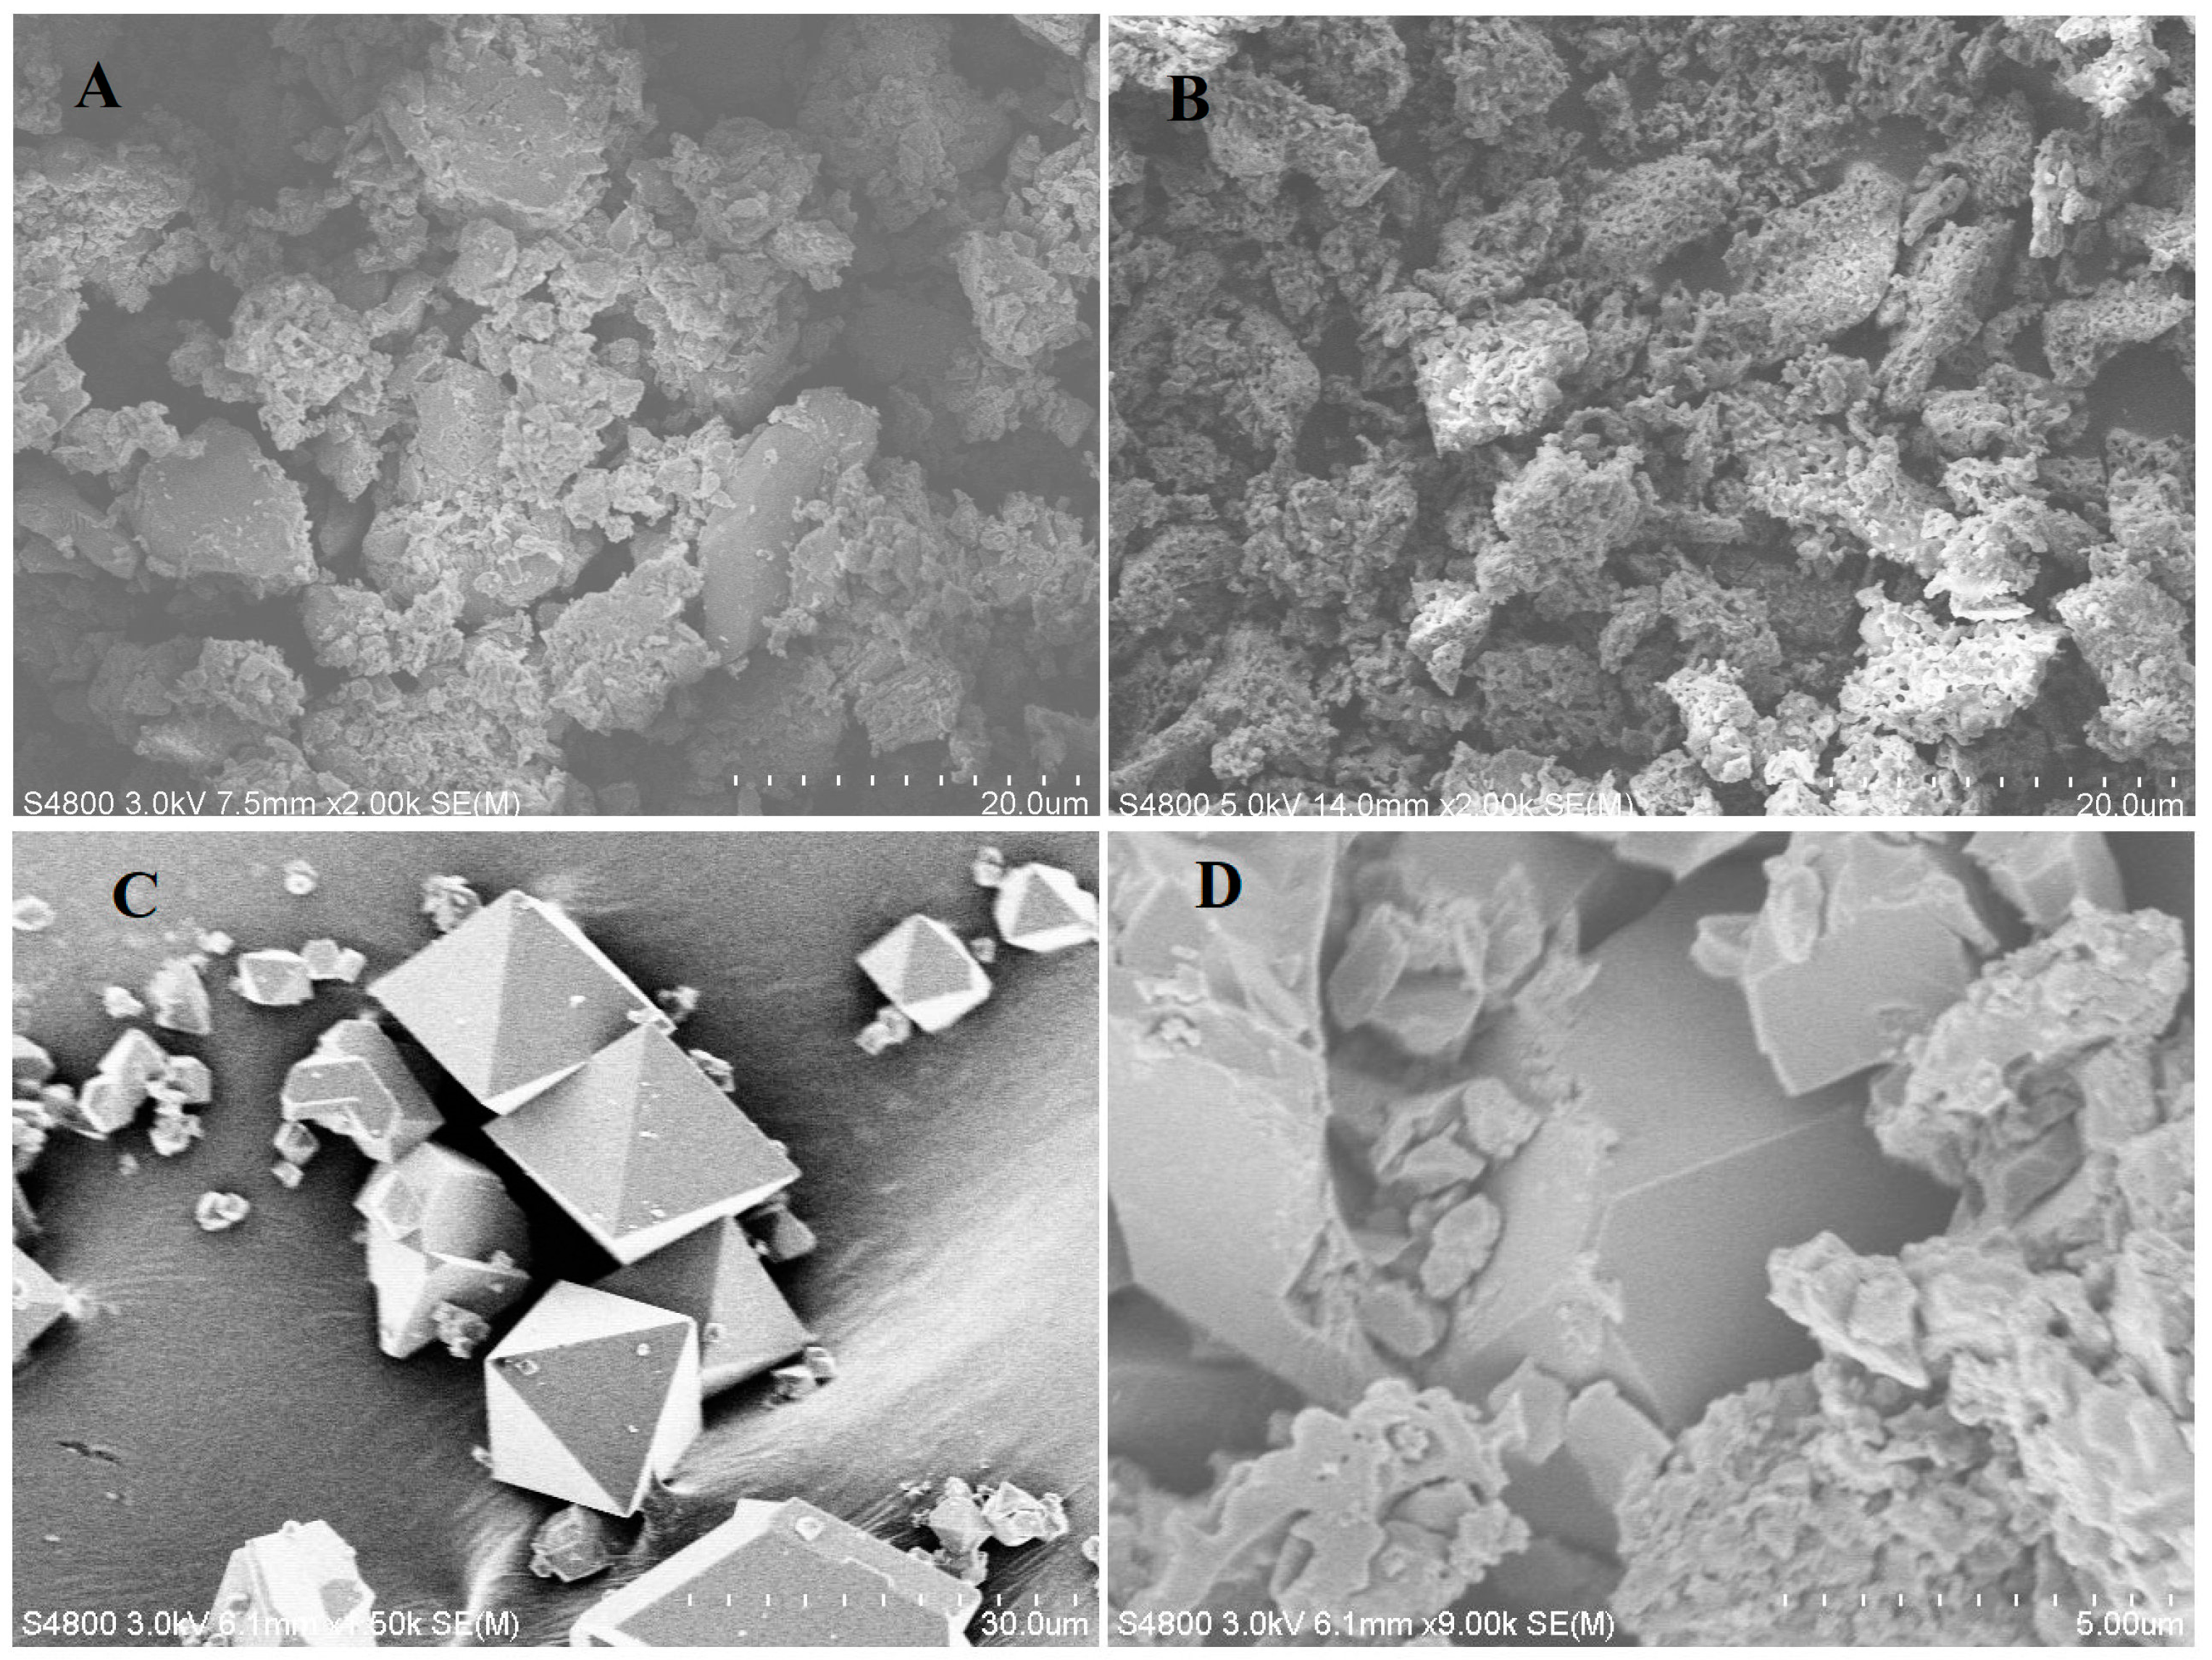
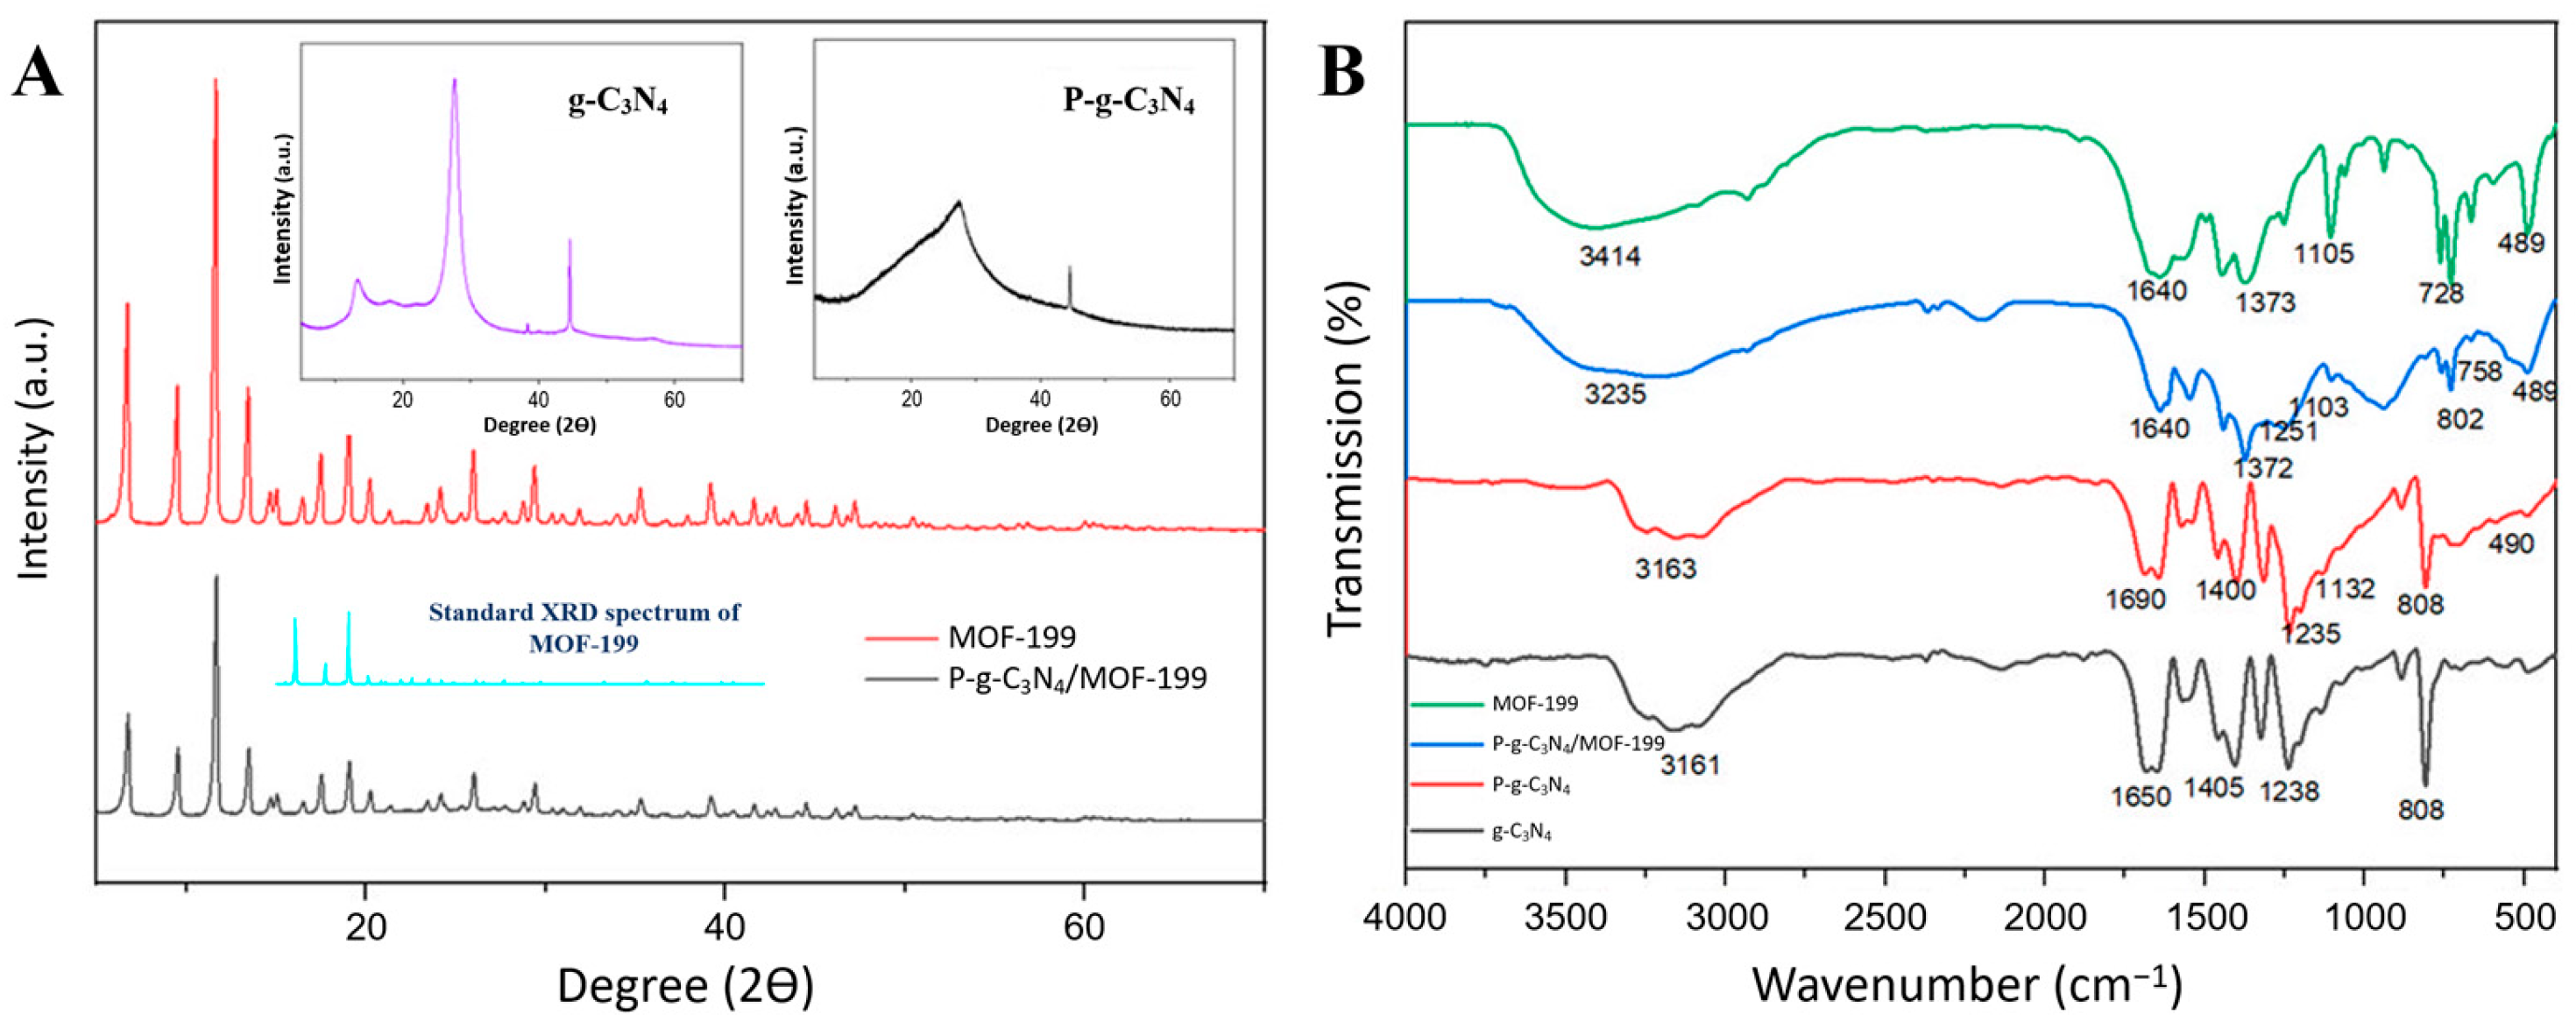
3.1. Characterization of the Phosphorus-Doped Graphitic Carbon Nitride (P-g-C3N4) and MOF

The morphologies of all synthesized compounds were examined with FE-SEM. As shown in Figure 1A, the g-C3N4 sample exhibits a relatively large grain size and a stacked sheet-like morphology, whereas the P-g-C3N4 particles are much smaller and aggregate into a more rough and porous structure (Figure 1B). The incorporation of phosphorus atoms in g-C3N4 disrupts its planar structure, making it less crystalline. On the contrary, the octahedral-shaped crystals of MOF-199 (Figure 1C) are well preserved in the composite of P-g-C3N4/MOF-199 (Figure 1D), given the well-defined edges shown in their SEM images. The recorded EDS spectrum of the composites reveals its inclusion of carbon (C), nitrogen (N), oxygen (O), phosphorus (P), and copper (Cu) elements, with ~5.76% phosphorous and 2.93% copper, as shown in Figure S1.
XRD was used to further reveal the molecule structures of the compounds in the composite of P-g-C3N4/MOF-199. As displayed in Figure 2A, pure g-C3N4 exhibits a strong peak centered at 2θ = 27.5°, corresponding to the (002) plane of an aromatic system, together with another peak at 2θ = 13.7°, which can be assigned to the (100) plane. The diffraction pattern of P-g-C3N4 is less obvious when compared to that of pure g-C3N4. The doping of P atoms reduces the diffraction area and/or the crystalline degree of C3N4, as reflected in their morphology differences in the SEM images (Figure 1A,B). The well-defined XRD spectra of MOF-199 are shown in both the as-synthesized MOF-199 and the composites of P-g-C3N4/MOF-199, with all major diffraction peaks at 6.7°, 9.5°, 11.6°, 13.4°, 19.2°, 26°, and 29.3°, matching what is reported in the literature [23]. The preservation of MOF-199 crystals in the composites also agrees with what is observed in their SEM images (Figure 1C,D).
FTIR spectroscopy was further used to characterize the functional groups of the pure compounds (g-C3N4, P-g-C3N4, and MOF-199) and the composites (P-g-C3N4/MOF-199). As shown in Figure 2B, the FTIR spectrum of P-g-C3N4 is like the g-C3N4 spectrum, in general: the peak at 3100–3300 cm−1 is caused by the vibrations of the O-H and N-H bonds, and the absorption bands at 1234–1687 cm−1 are assigned to the stretching vibrations of aromatic C-N heterocycles. Also, the peak at 808 cm−1 is ascribed to the s-triazine cycle. Only a slight decrease in intensity was observed for the peaks in P-g-C3N4 compared to that of g-C3N4 due to the interactions between phosphorus and g-C3N4. The FTIR spectrum of MOF-199 showed a broad peak in the range of 2800–3500 cm−1 due to the presence of water and hydroxyl groups. The stretching vibration at 1640 cm−1 indicated the reaction between the carboxylic group and metal ions. The band at 489 cm−1 is attributed to the Cu–O bond, the peaks at 728–760 cm−1 are ascribed to the substitution of Cu on the benzene group, and the Cu-O-C band is observed at 1105 cm−1 in MOF-199. The composite (P-g-C3N4/MOF-199) carries all the characteristic peaks of the pure compounds (g-C3N4, P-g-C3N4, and MOF-199) mentioned above. The distinct peaks at 802 and 1103 cm−1 of the as-synthesized composite reflect the presence of the s-triazine moiety and P-O bond. Based on these observations, we conclude that g-C3N4, P-g-C3N4, and MOF-199 retained their structures in the composite material.
N2 physical adsorption was performed to evaluate the surface area of the composites. As shown in Figure S2, a type I adsorption/desorption isotherm is received, suggesting the dominance of micropores because of the presence of MOF-199. The BET surface area of the composites is calculated to be 653 m2g−1, and the total pore volume is 0.325 cm3/g. A small portion of adsorption at P/P0 < 0.3, and a tiny hysteresis loop can be seen at 0.40 < P/P0 < 0.95 contributed by mesopores. This suggests the existence of a mesoporous space, which is likely created by nanoparticle aggregates.

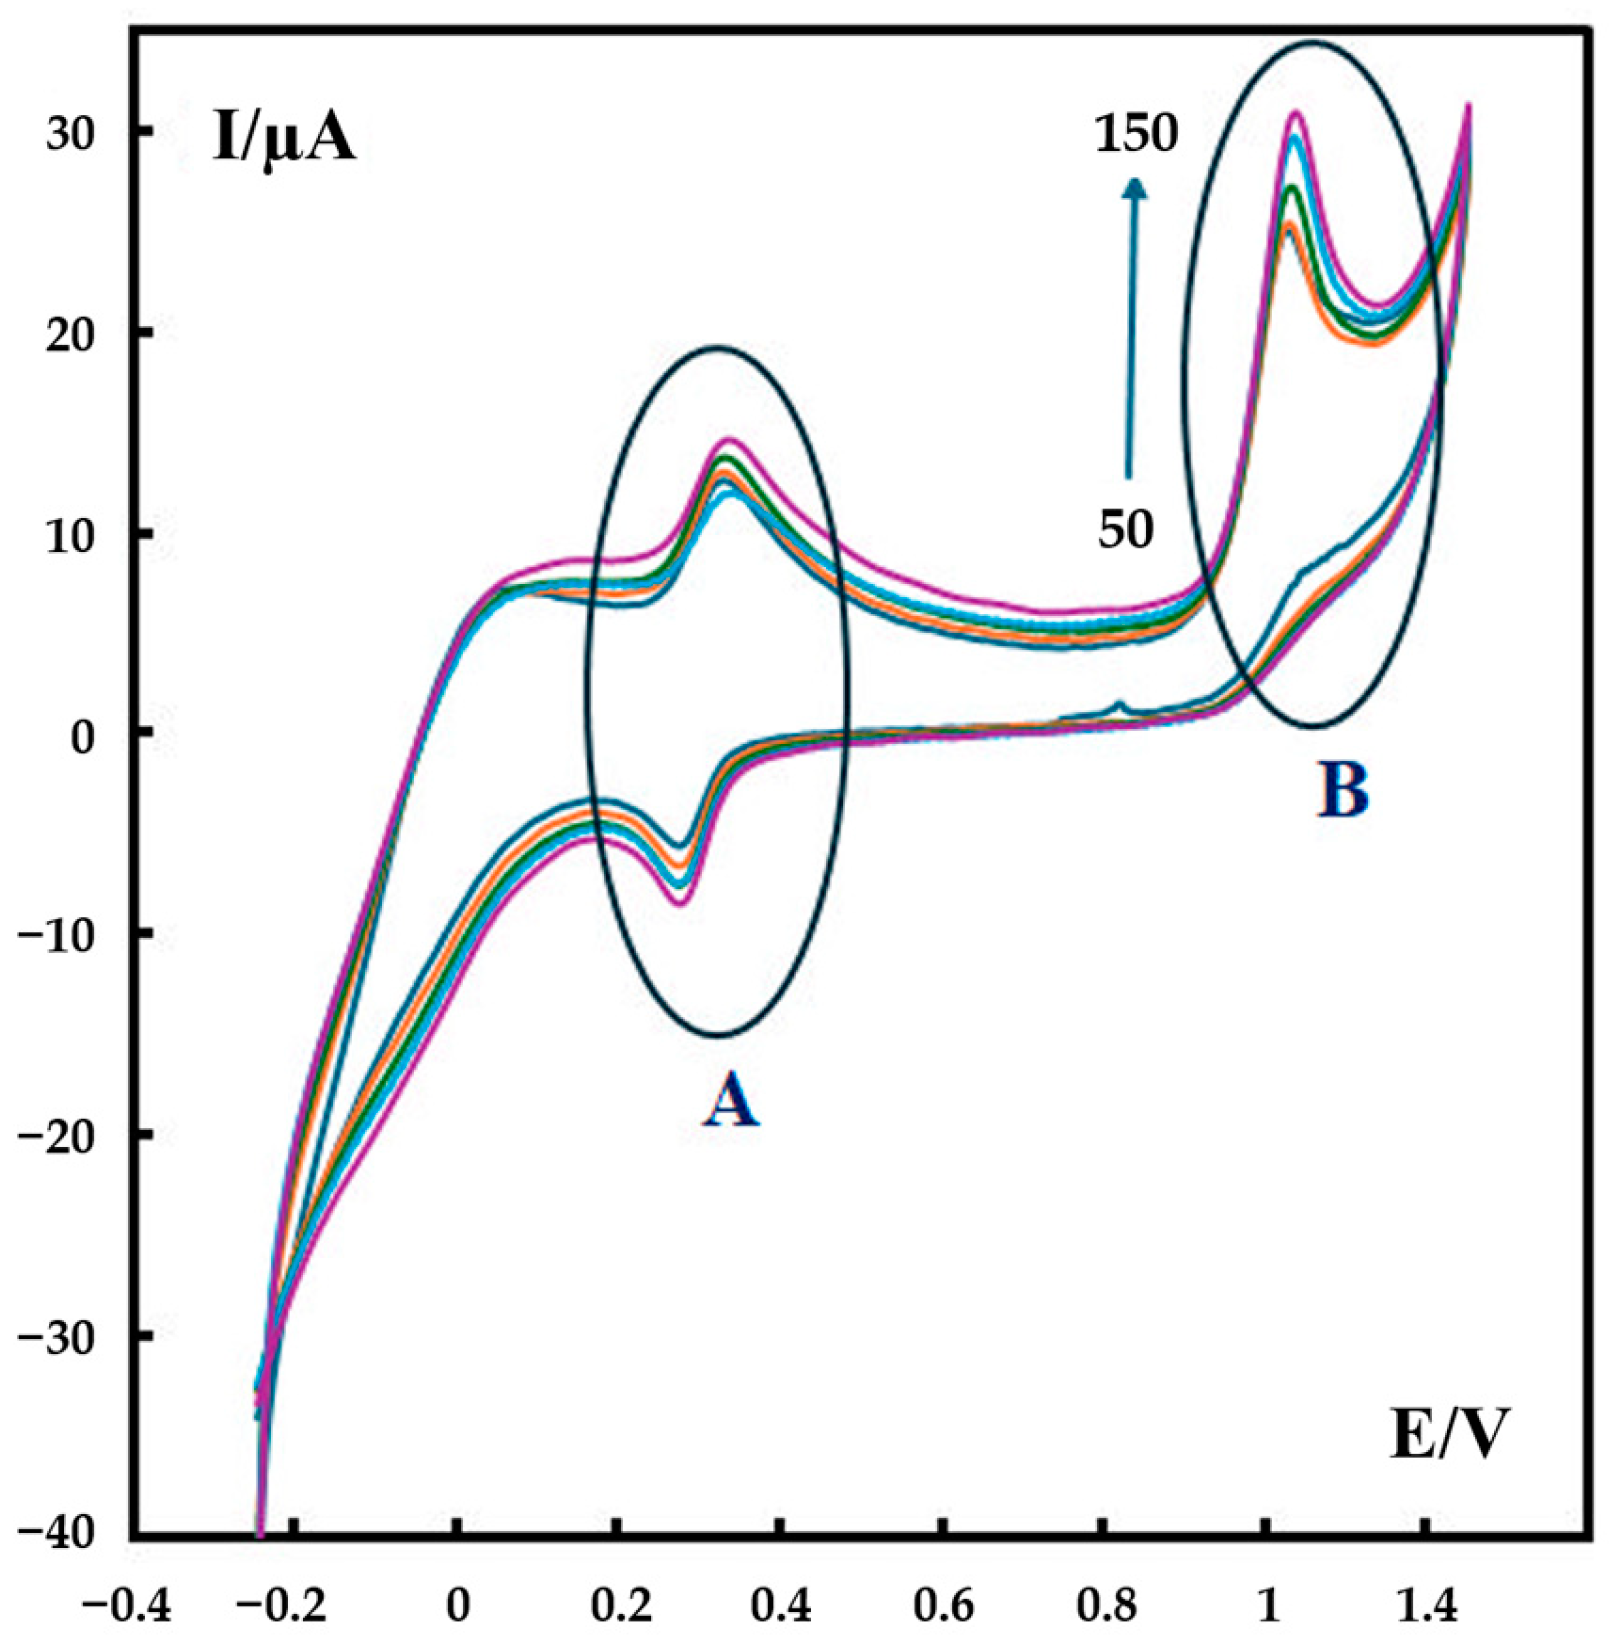
3.2. Characterization of P-g-C3N4/MOF-199/CPE Modified Electrode

P-g-C3N4/MOF-199/CPE was also characterized by EIS using [Fe(CN)6]3−/4− as an electrochemical redox probe. In electrochemical impedance measurement, the semicircle diameter of impedance equals the electron transfer resistance (Ret), which controls the electron transfer kinetics of the redox probe at the electrode surface. Figure S3 presents the Nyquist diagrams of the bare CPE (a) and P-g-C3N4/MOF-199/CPE (b) in 5 mM [Fe(CN)6]3−/4− and 0.1 M KCl. P-g-C3N4/MOF-199/CPE shows a small semicircle in the high-frequency region when compared with the bare CPE, indicating lower electron transfer resistance. This can be attributed to the copper ions and also phosphorus atoms with good conductivity and large surface area in the modified electrode, which could effectively increase the rate of electron transfer between the electrode surface and [Fe(CN)6]3−/4− and decrease interface electron transfer resistance.

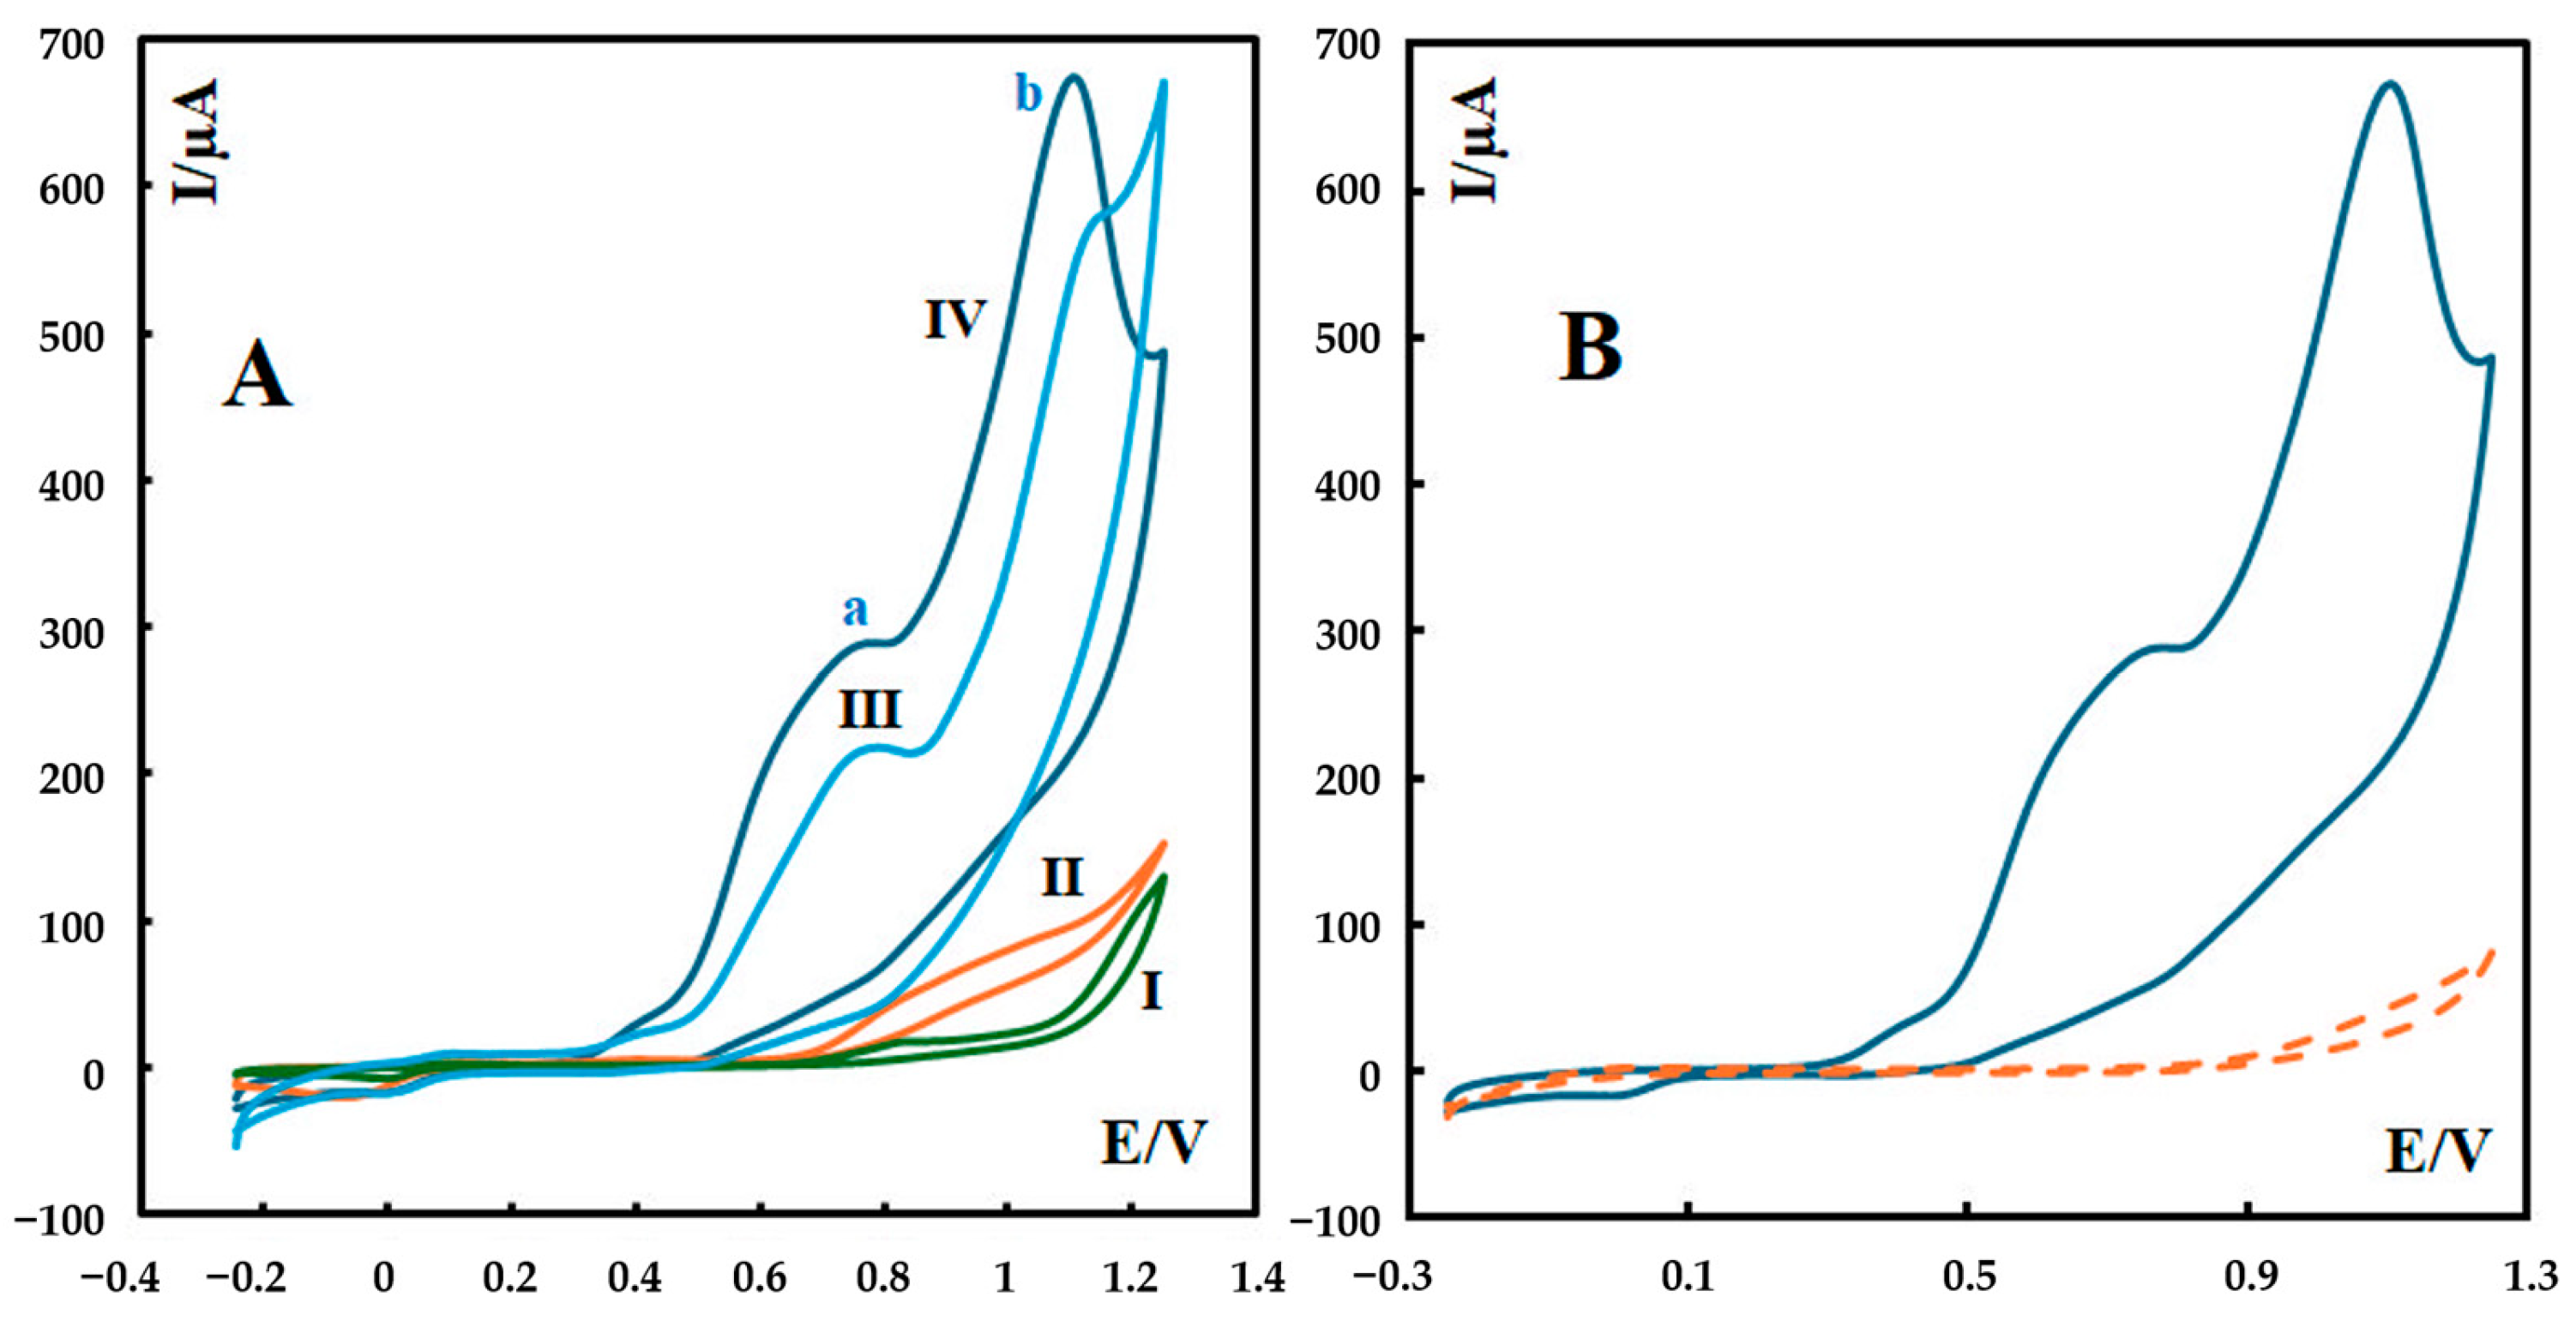
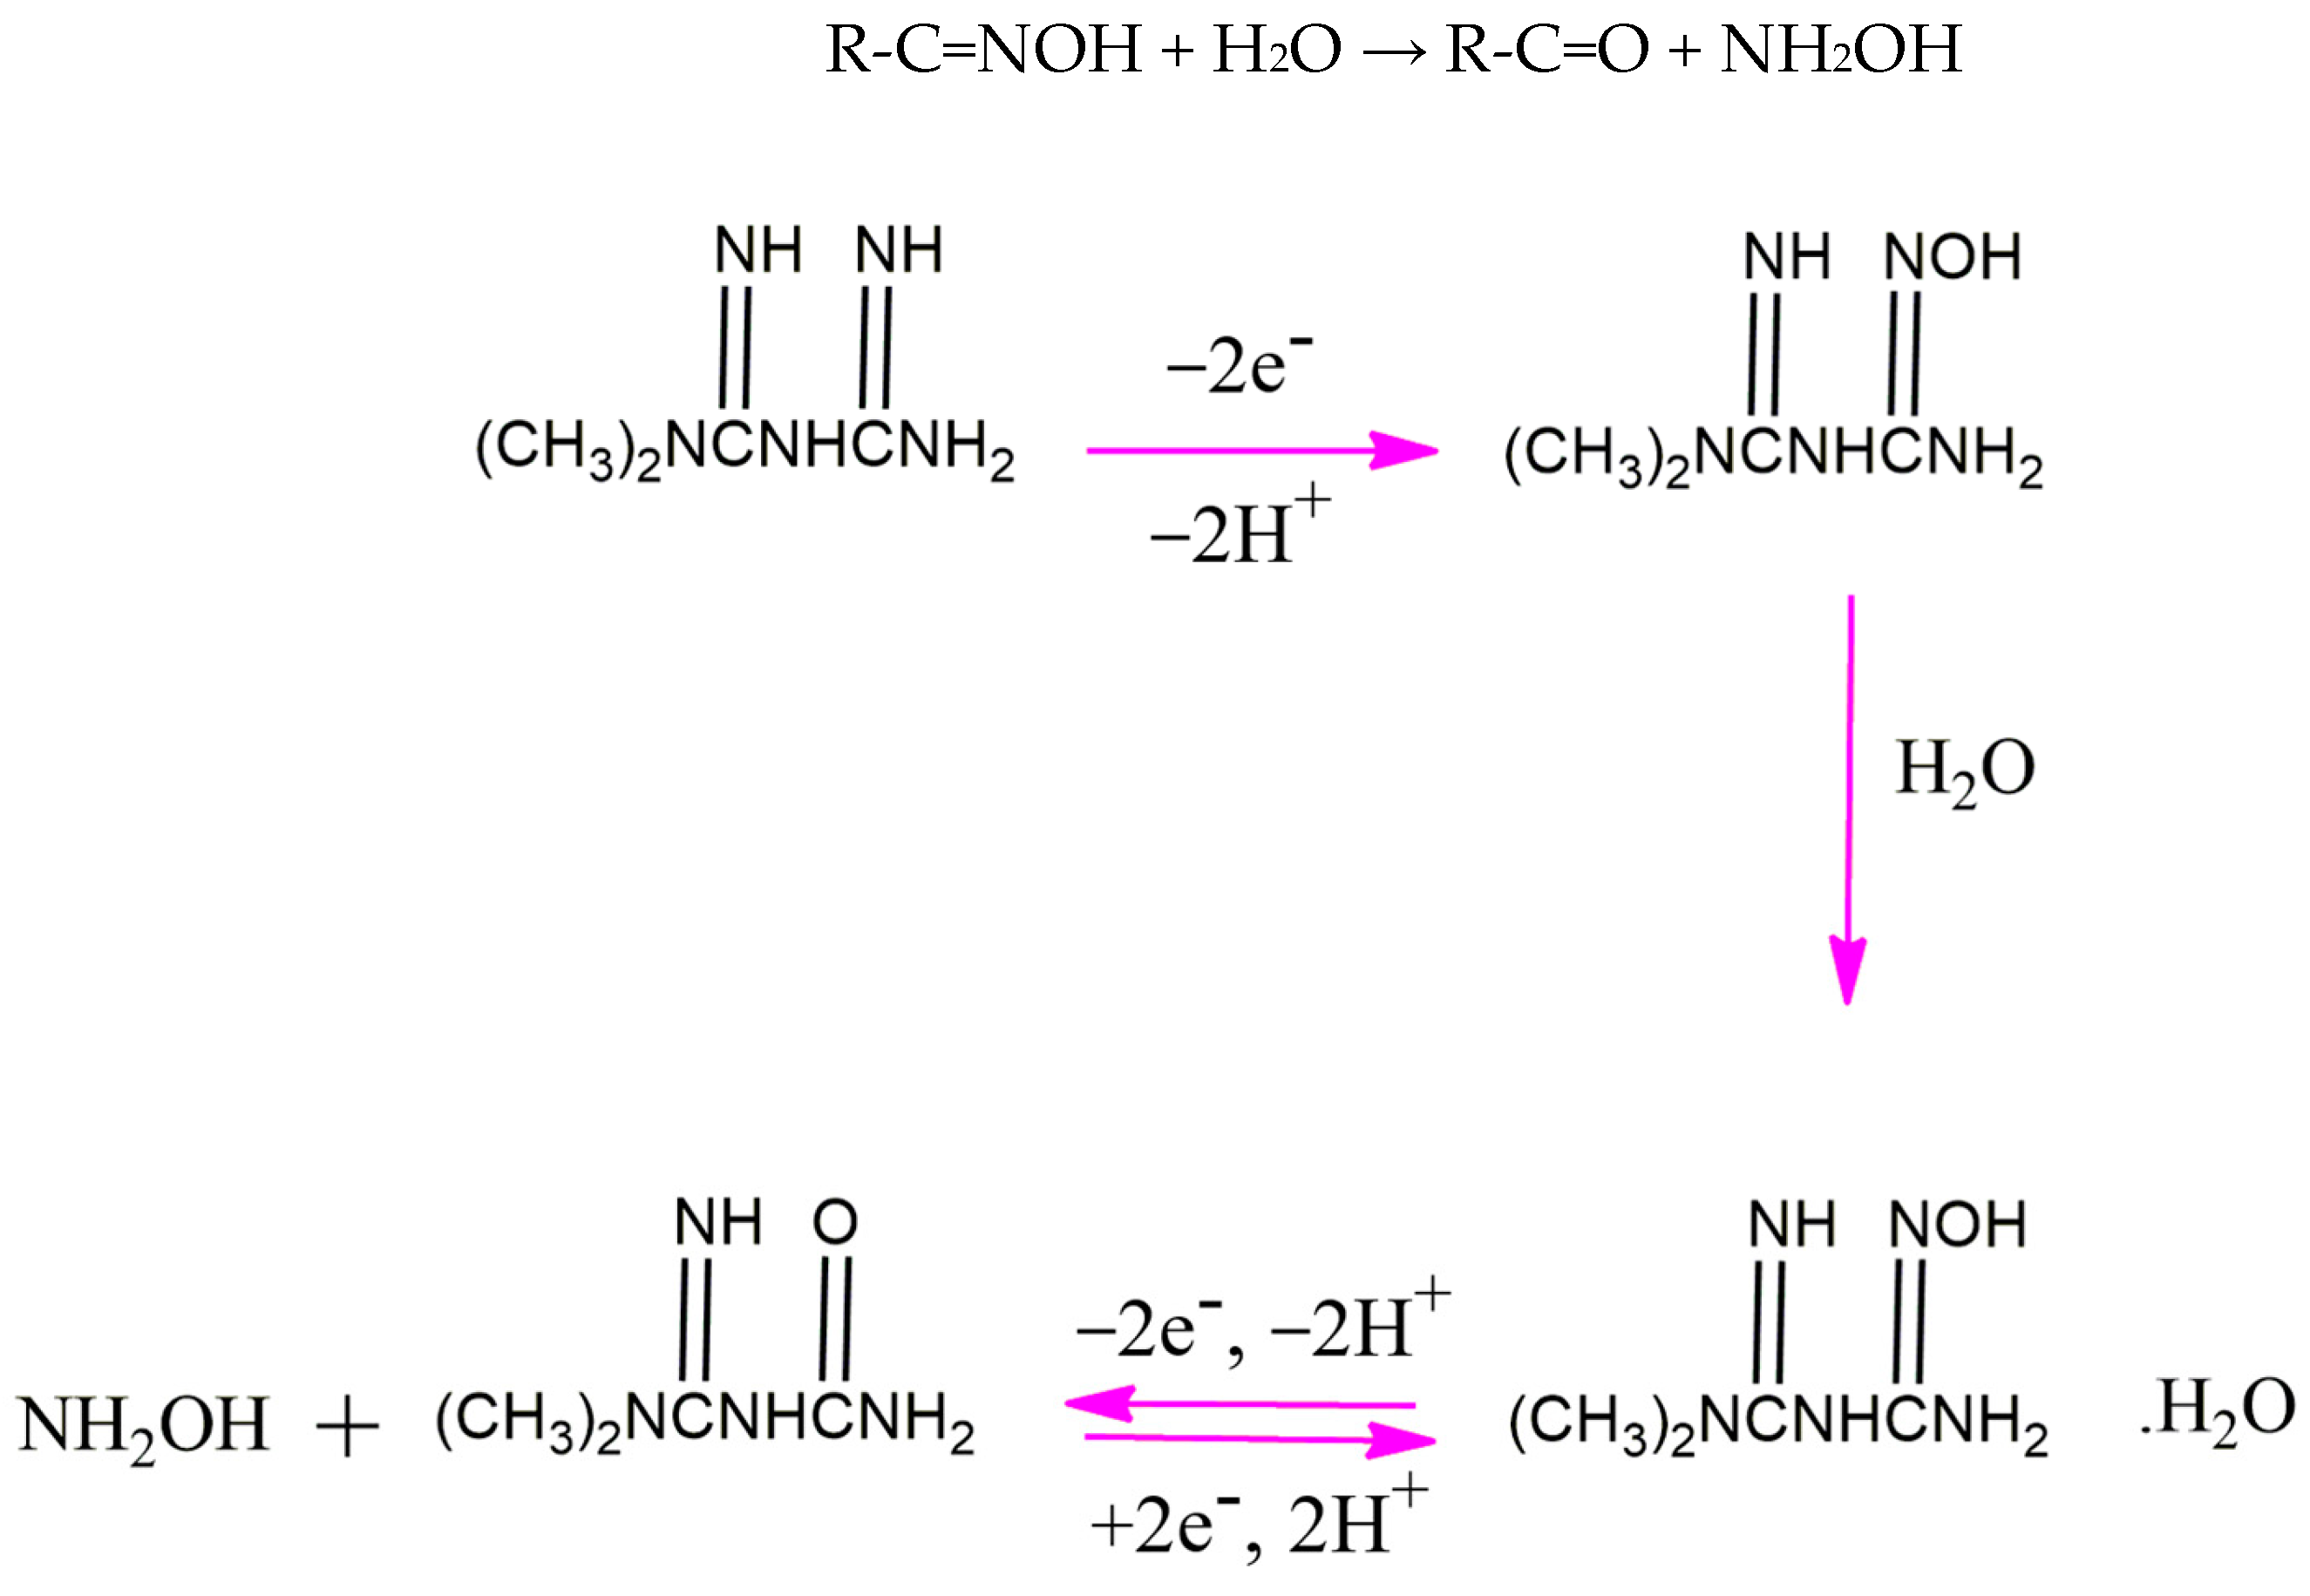
3.3. Electrochemical Behavior of Metformin at P-g-C3N4/MOF-199/CPE

The cyclic voltammograms (CVs) of P-g-C3N4/MOF-199/CPE, P-g-C3N4/CPE, MOF-199/CPE, and the bare CPE at a scan rate of 100 mV s−1 in 0.1 M phosphate buffer solution (pH 12) are shown in Figure 3. The oxidation of metformin at the surface of the bare carbon paste electrode produces a weak anodic peak (curve I in Figure 3A). At the surface of P-g-C3N4/CPE, the oxidation current of metformin further increased, indicating higher sensitivity compared to the bare electrode (curve II in Figure 3A). The better sensitivity and the shift in the anodic peak potential toward a less positive value indicate the fast electron transfer of metformin at the surface of P-g-C3N4/CPE. The anodic current increased remarkably when MOF-199/CPE was used as a modifier in the body of the carbon paste electrode (curve III in Figure 3A). The anodic current peak of metformin at the surface of MOF-199/CPE was significantly enhanced to reflect an enhanced electron-transfer rate on MOF-199/CPE. This is due to the electron-mediating action of Cu2+ ions in the MOF structure. Moreover, a high affinity of the MOF to the metformin molecules, due to a strong chelating action of metformin toward the Cu2+ ions of the MOF, can provide more active adsorption sites and electrocatalytic reaction centers, together with a high surface area of the MOF. All these factors help improve the electrocatalytic reactions and sensing performance of the fabricated composite electrode [24].
The most increased sensitivity of the modified electrode was achieved when P-g-C3N4/MOF-199 was utilized as the modifier (curve IV in Figure 3A). The composite electrode takes advantage of both P-g-C3N4 and MOF-199 components to further leverage the oxidation current of metformin 39 times higher than what is observed at the surface of the bare electrode. Also, the cyclic voltammograms of P-g-C3N4/MOF-199/CPE in the absence and in the presence of metformin can be seen in Figure 3B.
The cyclic voltammograms of metformin at the surface of P-g-C3N4/MOF-199/CPE and MOF-199/CPE in this condition (0.1 M phosphate buffer solution (pH 12)) show two major anodic peaks for the first electrooxidation reaction (irreversible reaction). For P-g-C3N4/MOF-199/CPE, these two peaks can be seen at 0.70 V (peak a) and 1.11 V (peak b) in curve IV in Figure 3A. The first anodic peak (peak a) is associated with adsorption, and the second one is due to diffusion. We further investigated the relation between the peak current and the scan rate for these two peaks, and the results are shown in Section 3.3.
The same observation about the adsorption peak has been reported for the electrooxidation of metformin [25]. This is related to the adsorption of the reaction product(s) on the electrode surface. It is notable that this adsorption-based peak can be seen in cyclic voltammograms in which copper ions have been used as the modifier in the fabricated electrochemical sensors [10,24,26]. Strong chelation between Cu2+ ions in the structure of the modifier and metformin leads to a high affinity of the modifier to metformin molecules. This provides a large number of active adsorption sites in the cyclic voltammograms to enhance the appearance of an adsorption-based peak.

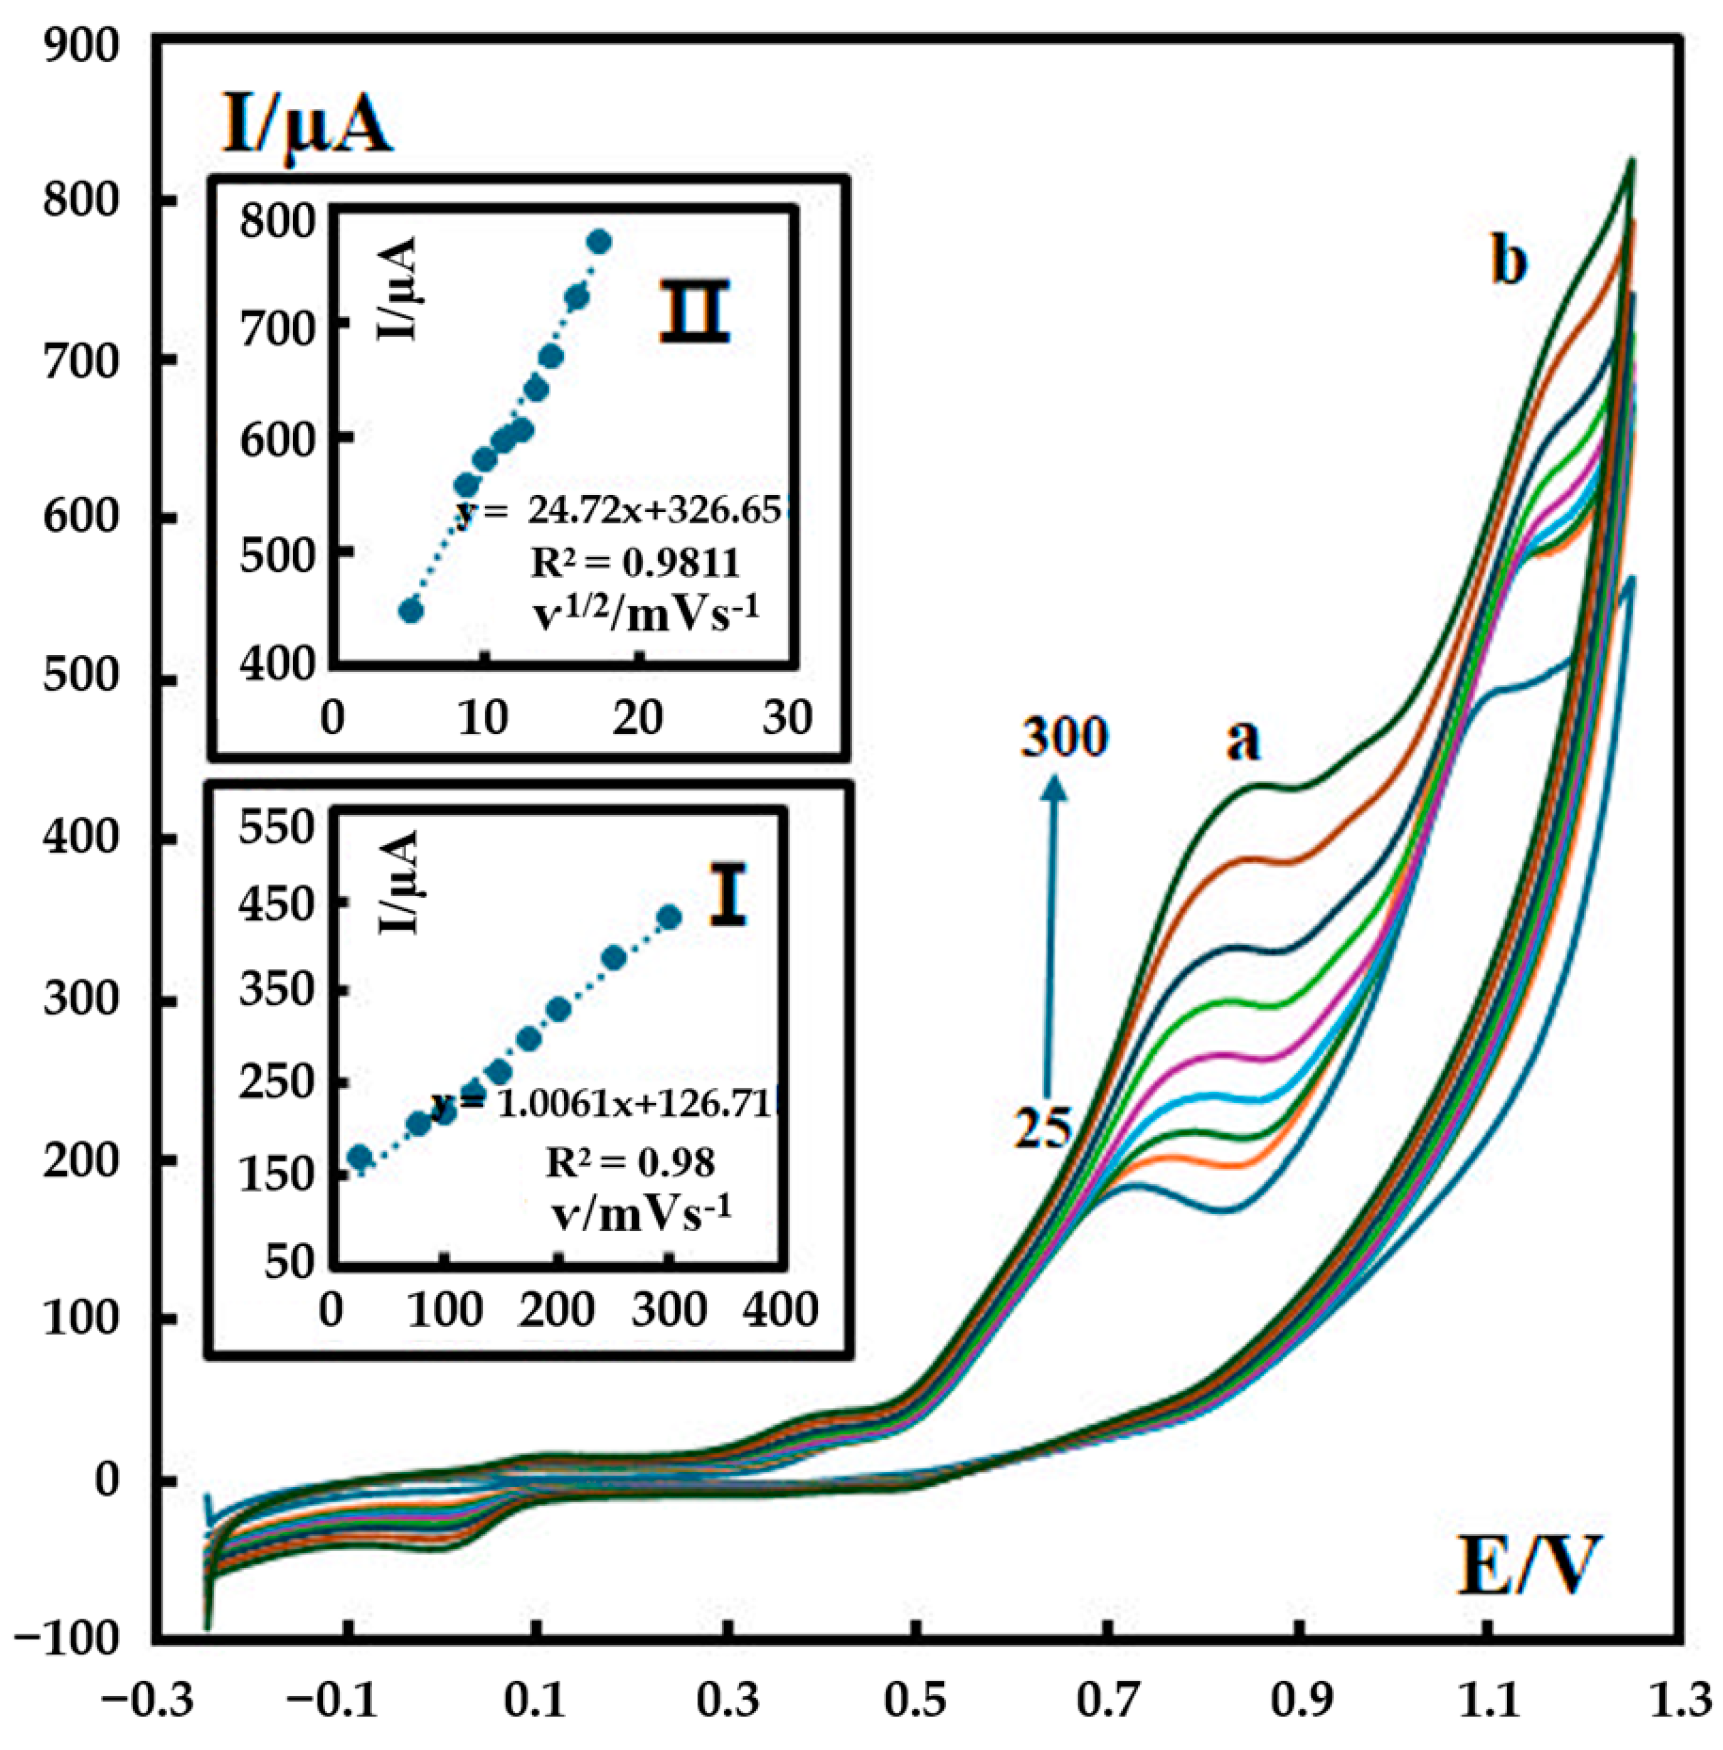
3.4. Effect of the Scan Rate
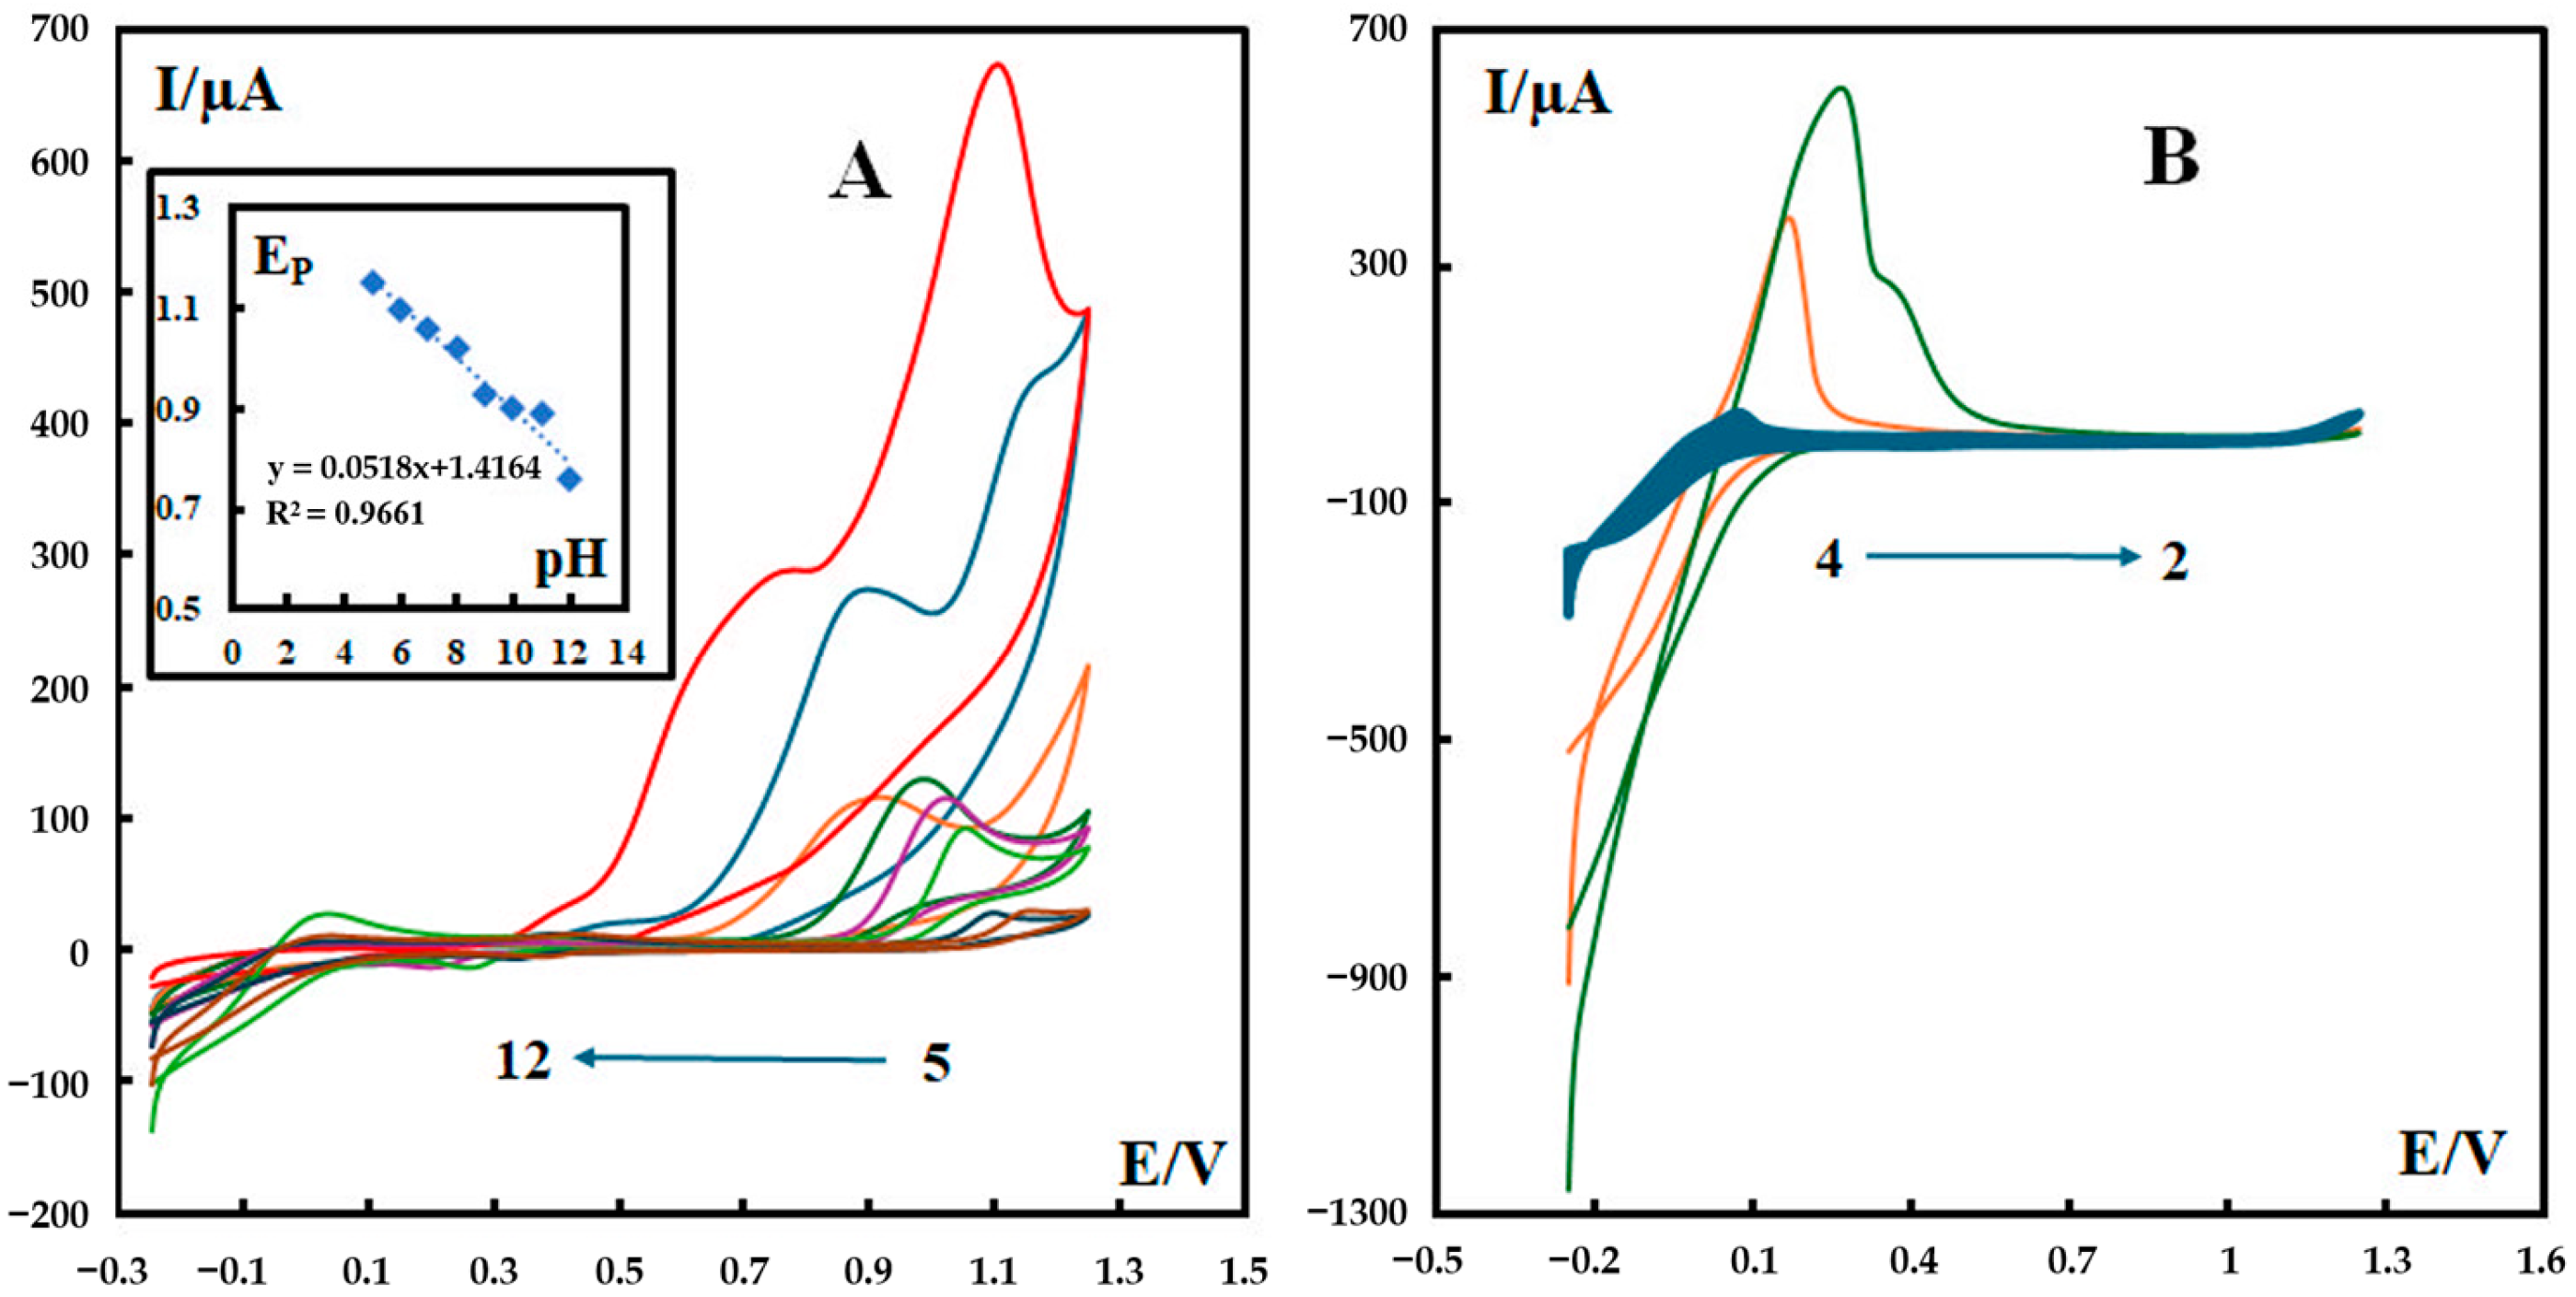
Cyclic voltammograms of 600 nM metformin in a phosphate buffer solution (pH 12) were recorded at different scan rates (25–300 mV s−1), as shown in Figure 4. For Peak a, a linear relationship was obtained between the peak current and the scan rate (ν) in the range of 25–300 mV s−1 (inset I in Figure 4). For Peak b, a linear relationship was obtained between the peak current and the square root of the scan rate in the range of 25–300 mV s−1 (inset II in Figure 4). This observation confirms that the electron transfer reaction of metformin on P-g-C3N4/MOF-199/CPE is a combination of diffusion-controlled (I ∝ ν1/2) and adsorption-controlled (I ∝ ν) processes.

3.5. Effect of pH

The effect of pH on the electrochemical behavior of metformin at the surface of C3N4/MOF-199/CPE was investigated in a pH range of 2.0 to 12.0 of the phosphate buffer solution (0.1 M). The results (Figure 5) show that the anodic peak current increases when the pH value increases. It is notable that only for the two pH values of 11 and 12 can both major anodic peaks be seen for the first electrooxidation reaction (irreversible reaction), while at the other pH values, only one anodic peak appears (Figure 5A). At a pH of 12.0, the oxidation peak of metformin has the most well-defined shape, the largest current, and the lowest oxidation potential. Therefore, this pH value was selected for further electrochemical tests. For lower pH values of 2, 3, and 4, the behavior of metformin at the surface of P-g-C3N4/MOF-199/CPE is quite different compared to the other pH values (i.e., pH = 5–12). For clarification, the voltammograms for these pH values are shown in Figure 5B.
These observations are consistent with previous reports about the electrochemical behavior of metformin. It has been reported that metformin has two dissociation constants (pKa1 = 2.93 and pKa2 = 11.51) [27], which explains the different CV behaviors of our composite electrodes in two pH ranges (2–4 and 5–12). Metformin presents as an uncharged species at pH 12, which facilitates the formation of a complex with Cu(II). During the anodic scan of potential, this reduces the repulsive interactions of metformin with the electrode surface or Cu2+ ions. As a result, the accumulation of metformin at the surface of the modified electrode is enhanced.
It is also notable to mention that MOF-199 maintains its structural integrity and stability in a phosphate buffer solution at pH 12, and electrochemical studies have been conducted at this pH [24].
As can be seen in the inset of Figure 5A, the Ep value shifts negatively with the increase in the solution pH and the slope of the linear regression in the range of pH values from 5 to 12 (−0.0518 mV pH−1), very close to the theoretical value of −0.059 mV pH−1. This is consistent with the proposed mechanism for the electrooxidation of metformin based on our serial study [10,24,26,28] with equal numbers of electrons and protons. In our proposed mechanism (Scheme 1), the first step is an irreversible reaction losing two electrons and two protons. After interacting with water molecules (Step 2), the intermediate compound experiences a reversible reaction that also involves two electrons and two protons. In the third step, oxime is hydrolyzed into the corresponding carbonyl compound and hydroxylamine. The hydrolysis of oxime involves a serial reaction, including the protonation of oxime, the formation of a carbocation, water attack on the carbocation, and deprotonation. The overall reaction can be summarized as follows:
R-C=NOH + H2O → R-C=O + NH2OH
Cyclic voltammograms of 600 nM metformin in phosphate buffer solution (pH 7) at different scan rates (50–150 mV s−1) further support this proposed mechanism. As shown in Figure 6, two electrooxidation peaks appear in the CV curves: Part A is related to the second oxidation–reduction reaction given in Scheme 1, and Part B is related to the first oxidation in this scheme.

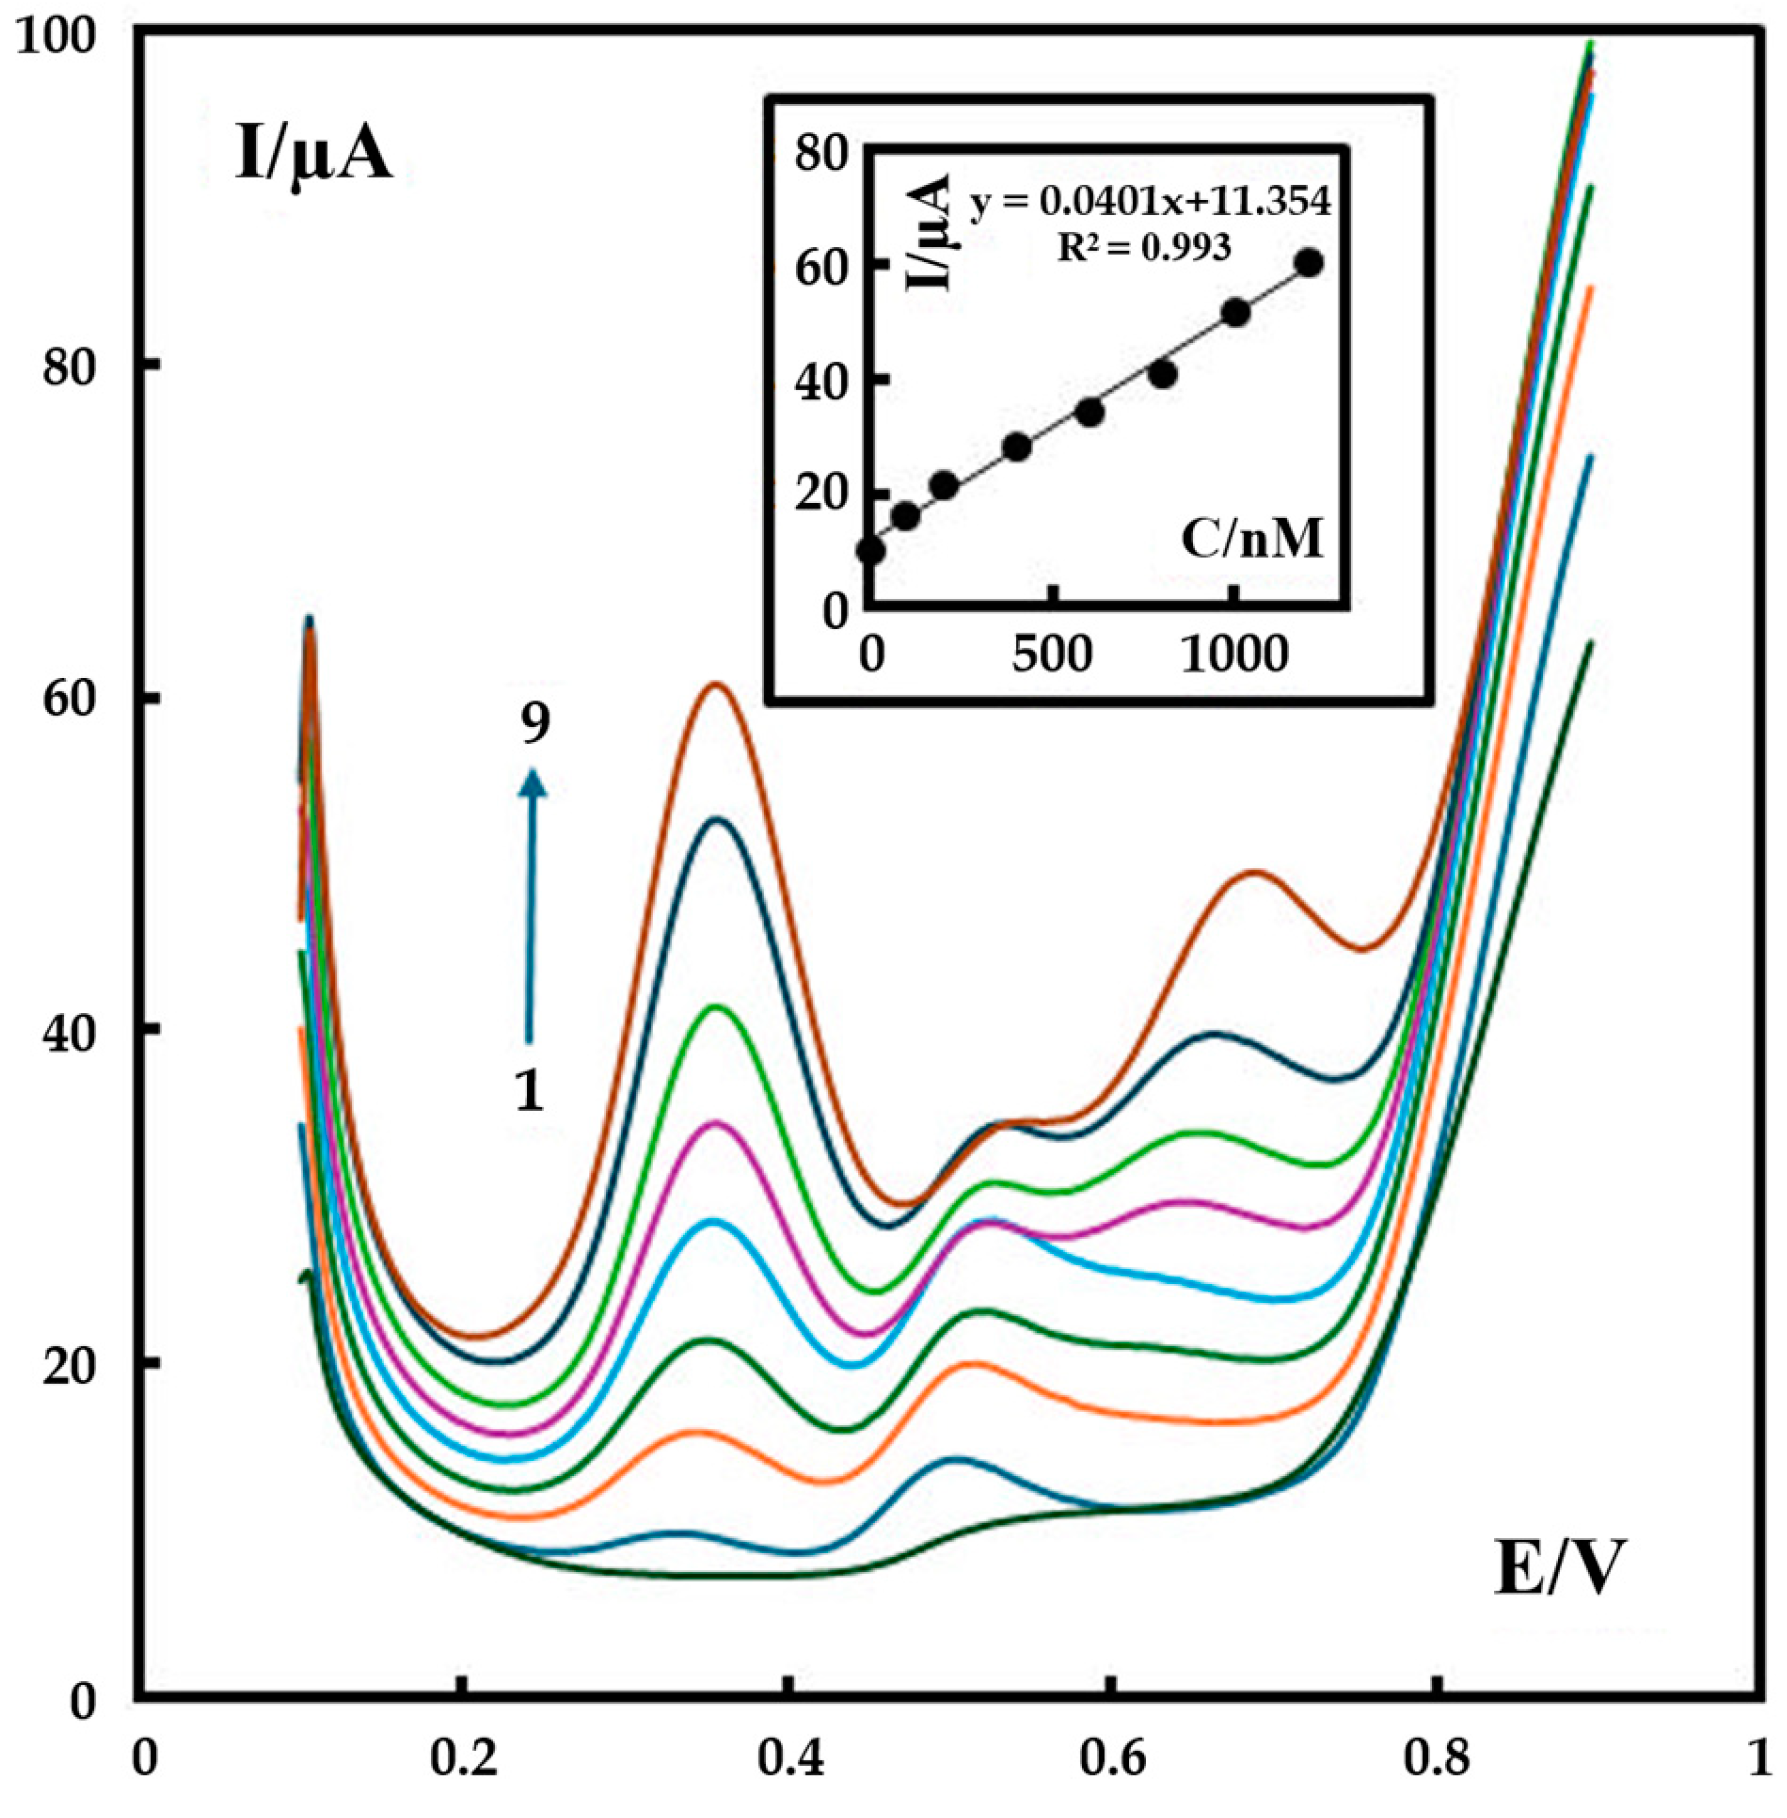
3.6. Analytical Performance

Differential pulse voltammetry (DPV) with a pulse amplitude of 50 mV, a pulse width of 40 ms, and a scan rate of 60 mV s−1 was used for the determination of metformin on the surface of P-g-C3N4/MOF-199/CPE. For the first peak, the calibration curve was established with the linear ranges of 0.5 to 1200 nM metformin (inset of Figure 7). The corresponding regression equation (Equation (3)) is:
IP (μA) = 11.354 + 0.0401C (metformin (nM)) (r2 = 0.993)
Based on these observations, the LOD and the limit of quantitation (LOQ) of metformin detection are 0.15 nM and 0.5 nM, respectively, for our new P-g-C3N4/MOF-199/CPE sensor, which shows a significant advance when compared to some previously reported electrochemical sensors (Table 1).
The stability experiments show that the fabricated sensor can retain 94% of its initial signal for three weeks, demonstrating its good stability (Figure S4). The reproducibility of this sensor was investigated by using the DPV test. Three freshly packed electrodes were prepared on three consecutive days, and the peak current of a solution containing 1200 nM of metformin was measured on each electrode. The obtained results showed a standard deviation of less than ±0.96, demonstrating the acceptable reproducibility of this sensor (Figure S5).

3.7. Interference Study

To check the tolerance of the composite electrochemical sensor, some major interference compounds, including glucose, ascorbic acid, dopamine, uric acid, urea, citric acid, paracetamol, glycine, serine, and epinephrine, were added to the sample solutions. The results show that a 300-fold increase in the concentration of these interferents did not influence the response of the metformin sensing signal (Figure S6). The complex formation of metformin molecules with copper units in the MOF-199 structure leads to the selective accumulation of this compound at the surface of P-g-C3N4/MOF-199/CPE. Therefore, MOF-199 not only provides remarkably improved sensitivity but also increased selectivity for the electrochemical determination of metformin.

3.8. Analytical Application

A MET HCl tablet containing 500 mg of MET was first ground into fine powder using a mortar and then dissolved in distilled water to a final concentration of 10 µM. The concentration of metformin was then determined by our P-g-C3N4/MOF-199/CPE electrochemical sensor based on a pre-established calibration curve (Figure S7). The results were used to calculate the related recovery rate. As can be seen in Table 2, starting with a concentration of 400 nM, the recovery of the spiked samples is acceptable. These data confirm the excellent performance of our sensors in measuring the metformin concentration in pharmaceutical samples.

4. Conclusions

A novel electrochemical sensor was prepared using a composite containing phosphorus-doped graphitic carbon nitride and a copper-based metal organic framework (P-g-C3N4/MOF-199). We conducted a comprehensive electrochemical study of this sensor as well as the oxidation mechanism of metformin at the electrode surface. The fabricated sensor has outstanding characteristics, including fast operation, reproducibility, accuracy, and low cost. Benefiting from the advantages of a copper-based MOF and P-g-C3N4, the electrochemical sensor shows excellent performance in the detection of metformin in pharmaceutical samples. In addition, this study clarifies the electrochemical oxidation of metformin based on a deep analysis of changes in anodic and cathodic peaks, which gives new insight into the metformin oxidation mechanism at the electrode surface.

Supplementary Materials

The following supporting information can be downloaded at https://www.mdpi.com/article/10.3390/chemosensors13030082/s1. Figure S1: EDS spectra of the synthesized P-g-C3N4/MOF-199 composite; Figure S2: N2 sorption isotherms of the P-g-C3N4/MOF-199 composite; Figure S3: EIS for (a) CPE and (b) P-g-C3N4/MOF-199/CPE in 5 mM [Fe(CN)6 ]3−/4− with 0.1 M KCl; Figure S4: The DPV results (current (in Amperes) versus potential (in Volts)) of metformin (1200 nM) in 0.1M phosphate buffer (pH 12), (1) at the surface of a freshly packed electrode and (2) at the surface of this electrode after three weeks; Figure S5: The DPV results of metformin (1200 nM) in 0.1M phosphate buffer solutions (pH 12) at the surface of three different electrodes; Figure S6:The DPV results of metformin in 0.1M phosphate buffer (pH 12) solutions. The solid lines represent the signal of metformin (1200 nM) in the absence of interferents, and the dashed lines for the signal of metformin (1200 nM) at the presence of interferents (1–10). The numbers 1 to 10 correspond to glucose, ascorbic acid, dopamine, uric acid, urea, citric acid, paracetamol, glycine, serine, and epinephrine, respectively; Figure S7: The DPV results of metformin in 0.1M phosphate buffer (pH 12) that are presented in drug tablets (A) and after spiking with different concentrations (B: 200, C: 400 and D: 600 nM, respectively). The dashed lines represent the actual amounts of metformin. The solid lines show the expected amounts of metformin based on the calibration curve.

Author Contributions

Conceptualization, methodology, investigation, original draft, S.D.; funding acquisition, T.A.M.; validation, S.W.; formal analysis, project administration, supervision, resources, writing—review and editing, T.A.M. and S.W. All authors have read and agreed to the published version of the manuscript.

Funding

This research was funded by the U.S. National Science Foundation, grant number OIA 2217824 to T.A.M.

Institutional Review Board Statement

Not applicable.

Informed Consent Statement

Not applicable.

Data Availability Statement

Conflicts of Interest

The authors declare no conflicts of interest.

References

  1. Zhou, J.; Massey, S.; Story, D.; Li, L. Metformin: An old drug with new applications. Int. J. Mol. Sci. 2018, 19, 2863. [Google Scholar] [CrossRef] [PubMed]
  2. Vancura, A.; Bu, P.; Bhagwat, M.; Zeng, J.; Vancurova, I. Metformin as an anticancer agent. Trends Pharmacol. Sci. 2018, 39, 867–878. [Google Scholar] [CrossRef] [PubMed]
  3. Guppy, A.; Jamal-Hanjani, M.; Pickering, L. Anticancer effects of metformin and its potential use as a therapeutic agent for breast cancer. Future Oncol. 2011, 7, 727–736. [Google Scholar] [CrossRef] [PubMed]
  4. Foretz, M.; Guigas, B.; Viollet, B. Understanding the glucoregulatory mechanisms of metformin in type 2 diabetes mellitus. Nat. Rev. Endocrinol. 2019, 15, 569–589. [Google Scholar] [CrossRef]
  5. Karunarathna, I.; Kusumarathna, K.; Jayathilaka, P.; Rathnayake, B.; Bandara, S.; Wijesinghe, A.; Priyalath, N.; Gunarathna, I.; Disanayake, D.; Kurukulasooriya, P.; et al. Comprehensive Review of Metformin: Indications, Contraindications, and Potential Applications. Uva Clin. 2024, 1–7. [Google Scholar]
  6. Zhang, Y.; Zhou, F.; Guan, J.; Zhou, L.; Chen, B. Action Mechanism of Metformin and Its Application in Hematological Malignancy Treatments: A Review. Biomolecules 2023, 13, 250. [Google Scholar] [CrossRef]
  7. Gedawy, A.; Al-Salami, H.; Dass, C.R. Development and validation of a new analytical HPLC method for simultaneous determination of the antidiabetic drugs, metformin and gliclazide. J. Food Drug Anal. 2019, 27, 315–322. [Google Scholar] [CrossRef]
  8. Lamie, N.T.; Mahrouse, M.A. Smart spectrophotometric methods based on normalized spectra for simultaneous determination of alogliptin and metformin in their combined tablets. Spectrochim. Acta Part A Mol. Biomol. Spectrosc. 2018, 204, 743–747. [Google Scholar] [CrossRef]
  9. ALOthman, Z.A.; Alsheetan, K.M.; AL-Anazy, M.M.; Locatelli, M.; Ali, I. Metformin residue analysis in water by MWCNTs-based solid-phase micromembrane tip extraction and capillary electrophoresis methods. Int. J. Environ. Sci. Technol. 2021, 18, 3419–3426. [Google Scholar] [CrossRef]
  10. Dehdashtian, S.; Gholivand, M.B.; Shamsipur, M.; Karimi, Z. A nano sized functionalized mesoporous silica modified carbon paste electrode as a novel, simple, robust and selective anti-diabetic metformin sensor. Sens. Actuators B Chem. 2015, 221, 807–815. [Google Scholar] [CrossRef]
  11. Shu, J.-C.; Yang, X.-Y.; Zhang, X.-R.; Huang, X.-Y.; Cao, M.-S.; Li, L.; Yang, H.-J.; Cao, W.-Q. Tailoring MOF-based materials to tune electromagnetic property for great microwave absorbers and devices. Carbon 2020, 162, 157–171. [Google Scholar] [CrossRef]
  12. Dehdashtian, S.; Hashemi, B.; Aeenmehr, A. The application of perlite/cobalt oxide/reduced graphene oxide (PC-rGO)/metal organic framework (MOF) composite as electrode modifier for direct sensing of anticancer drug idarubicin. IEEE Sens. J. 2019, 19, 11739–11745. [Google Scholar] [CrossRef]
  13. Karimi-Maleh, H.; Yola, M.L.; Atar, N.; Orooji, Y.; Karimi, F.; Kumar, P.S.; Rouhi, J.; Baghayeri, M. A novel detection method for organophosphorus insecticide fenamiphos: Molecularly imprinted electrochemical sensor based on core-shell Co3O4@ MOF-74 nanocomposite. J. Colloid Interface Sci. 2021, 592, 174–185. [Google Scholar] [CrossRef] [PubMed]
  14. Gupta, N.K.; Bae, J.; Kim, K.S. From MOF-199 Microrods to CuO Nanoparticles for Room-Temperature Desulfurization: Regeneration and Repurposing Spent Adsorbents as Sustainable Approaches. ACS Omega 2021, 6, 25631–25641. [Google Scholar] [CrossRef]
  15. Wang, Q.; Gou, H.; Zhu, L.; Huang, H.-T.; Biswas, A.; Chaloux, B.L.; Epshteyn, A.; Yesinowski, J.P.; Liu, Z.; Cody, G. Modifying Carbon Nitride through Extreme Phosphorus Substitution. ACS Mater. Lett. 2019, 1, 14–19. [Google Scholar] [CrossRef]
  16. Wang, X.; Wang, X.; Tian, W.; Meng, A.; Li, Z.; Li, S.; Wang, L.; Li, G. High-energy ball-milling constructing P-doped g-C3N4/MoP heterojunction with Mo-N bond bridged interface and Schottky barrier for enhanced photocatalytic H2 evolution. Appl. Catal. B Environ. 2022, 303, 120933. [Google Scholar] [CrossRef]
  17. Ma, T.Y.; Ran, J.; Dai, S.; Jaroniec, M.; Qiao, S.Z. Phosphorus-doped graphitic carbon nitrides grown in situ on carbon-fiber paper: Flexible and reversible oxygen electrodes. Angew. Chem. 2015, 127, 4729–4733. [Google Scholar] [CrossRef]
  18. Su, J.; Geng, P.; Li, X.; Zhao, Q.; Quan, X.; Chen, G. Novel phosphorus doped carbon nitride modified TiO2 nanotube arrays with improved photoelectrochemical performance. Nanoscale 2015, 7, 16282–16289. [Google Scholar] [CrossRef]
  19. Britt, D.; Tranchemontagne, D.; Yaghi, O.M. Metal-organic frameworks with high capacity and selectivity for harmful gases. Proc. Natl. Acad. Sci. USA 2008, 105, 11623–11627. [Google Scholar] [CrossRef]
  20. Mahmoodi, N.M.; Abdi, J. Nanoporous metal-organic framework (MOF-199): Synthesis, characterization and photocatalytic degradation of Basic Blue 41. Microchem. J. 2019, 144, 436–442. [Google Scholar] [CrossRef]
  21. Chegeni, M.; Dehghan, N. Preparation of Phosphorus Doped Graphitic Carbon Nitride Using a Simple Method and Its Application for Removing Methylene Blue. Phys. Chem. Res. 2020, 8, 31–44. [Google Scholar]
  22. Tiwari, J.N.; Vij, V.; Kemp, K.C.; Kim, K.S. Engineered Carbon-Nanomaterial-Based Electrochemical Sensors for Biomolecules. ACS Nano 2016, 10, 46–48. [Google Scholar] [CrossRef] [PubMed]
  23. Khder, A.S.; Morad, M.; Altass, H.M.; Ibrahim, A.A.; Ahmed, S.A. Unprecedented green chemistry approach: Tungstophosphoric acid encapsulated in MOF 199 as competent acid catalyst for some significant organic transformations. J. Porous Mater. 2021, 28, 129–142. [Google Scholar] [CrossRef]
  24. Hadi, M.; Poorgholi, H.; Mostaanzadeh, H. Determination of Metformin at Metal–Organic Framework (Cu-BTC) Nanocrystals/Multi-walled Carbon Nanotubes Modified Glassy Carbon Electrode. S. Afr. J. Chem. 2016, 69, 132–139. [Google Scholar] [CrossRef]
  25. Sattarahmady, N.; Heli, H.; Faramarzi, F. Nickel oxide nanotubes-carbon microparticles/Nafion nanocomposite for the electrooxidation and sensitive detection of metformin. Talanta 2010, 82, 1126–1135. [Google Scholar] [CrossRef] [PubMed]
  26. Gholivand, M.B.; Mohammadi-Behzad, L. Differential pulse voltammetric determination of metformin using copper-loaded activated charcoal modified electrode. Anal. Biochem. 2013, 438, 53–60. [Google Scholar] [CrossRef] [PubMed]
  27. Abu-el-Wafa, S.M.; El-Ries, M.A.; Ahmed, F.H. Formation of metformin complexes with some transition metal ions: Their biological activity. Inorg. Chim. Acta 1987, 136, 127–131. [Google Scholar] [CrossRef]
  28. Tian, X.J.; Song, J.F. Catalytic action of copper (II) ion on electrochemical oxidation of metformine and voltammetric determination of metformine in pharmace. J. Pharm. Biomed. Anal. 2007, 44, 1192–1196. [Google Scholar] [CrossRef] [PubMed]
  29. Mirzajani, R.; Karimi, S. Preparation of γ-Fe2O3/hydroxyapatite/Cu(II) magnetic nanocomposite and its application for electrochemical detection of metformin in urine and pharmaceutical samples. Sens. Actuators B Chem. 2018, 270, 405–416. [Google Scholar] [CrossRef]
  30. Wu, L.; Lu, X.; Wu, Y.; Huang, C.; Gu, C.; Tian, Y.; Ma, J. An electrochemical sensor based on synergistic enhancement effects between nitrogen-doped carbon nanotubes and copper ions for ultrasensitive determination of anti-diabetic metformin. Sci. Total Environ. 2023, 878, 163120. [Google Scholar] [CrossRef] [PubMed]
  31. Ghanbari, M.H.; Sharafi, P.; Nayebossadr, S.; Norouzi, Z. Utilizing a nanocomposite consisting of zinc ferrite, copper oxide, and gold nanoparticles in the fabrication of a metformin electrochemical sensor supported on a glassy carbon electrode. Microchim. Acta 2020, 187, 1–11. [Google Scholar] [CrossRef]
  32. Attia, A.K.; Salem, W.M.; Mohamed, M.A. Voltammetric assay of metformin hydrochloride using pyrogallol modified carbon paste electrode. Acta Chim. Slov. 2015, 62, 588–594. [Google Scholar] [CrossRef] [PubMed]
  33. Jawad SE, Z.; Ibrahim, M.; Fatima, B.; Chohan, T.A.; Hussain, D.; Najam-ul-Haq, M. Fabrication and employment of cobalt doped yttrium iron garnets for the electrochemical analysis of antidiabetic, metformin in serum of type 2 diabetes mellitus patients. Discov. Nano 2023, 18, 21. [Google Scholar] [CrossRef]
  34. Haq, I.; Cruz, A.G.; Di Masi, S.; Cowen, T.; Allcock, N.S.; Malitesta, C.; Mujahid, A.; Hussain, T.; Piletska, E.; Piletsky, S.A. Smart nano-actuators for electrochemical sensing of Metformin in human plasma. Sens. Actuators B Chem. 2023, 376, 132928. [Google Scholar] [CrossRef]
  35. Hao, Y.; Zhang, H.; Yue, X.; Zhao, Z.; Zhao, S. A novel electrochemical sensor based on Cu(Ⅱ) metal organic framework for the determination of metformin. Microchem. J. 2023, 191, 108849. [Google Scholar] [CrossRef]
  36. Shih, Y.-J.; Su, Y.-Q.; Chen, W.-H.; Lin, S.-K.; He, Y.-C.; Huang, C.-P. Copper nanoparticles encapsulated in reduced graphene oxide electrode (CuxrGO1−x) for the electrochemical quantification of metformin in water. Chem. Eng. J. 2023, 471, 144676. [Google Scholar] [CrossRef]
  37. Zamani, S.; Ghanbari, K.; Bonyadi, S. Electrochemical determination of metformin via a carbon paste electrode modified with an Ag NPs/Cu2O/CuO-decorated bacterial nanocellulose composite. Anal. Methods 2023, 15, 4606–4614. [Google Scholar] [CrossRef]
Figure 1. SEM images of g-C3N4 (A), P-g-C3N4 (B), MOF-199 (C), and the P-g-C3N4/MOF-199 composite (D).
Chemosensors 13 00082 g001
Figure 2. The XRD (A) and FTIR (B) spectra of g-C3N4, P-g-C3N4, MOF-199, and P-g-C3N4/MOF-199. The standard XRD spectrum of MOF-199 was added in panel (A) for better illustration.
Chemosensors 13 00082 g002
Figure 3. (A) CVs of 600 nM metformin recorded in 0.1 M phosphate buffer solution (pH 12) at a scan rate of 100 mV s−1 at the surface of different electrodes: (I) unmodified CPE, (II) P-g-C3N4/CPE, (III) MOF-199/CPE, and (IV) P-g-C3N4/MOF-199/CPE. For P-g-C3N4/MOF-199/CPE, two major anodic peaks can be seen at 0.70 V (peak a) and 1.11 V (peak b) in curve IV. (B) CV of P-g-C3N4/MOF-199/CPE recorded in 0.1 M phosphate buffer solution (pH 12) at a scan rate of 100 mV s−1 in the absence (dashed line) and in the presence of 600 nM metformin (solid line).
Chemosensors 13 00082 g003
Figure 4. CVs of 500 nM metformin recorded in 0.1 M phosphate buffer (pH 12) at different scan rates at the surface of P-g-C3N4/MOF-199/CPE. The scan rates are 25–300 mV s−1. Insets: (I) variation in Ip with ʋ for Peak a and (II) variation in Ip with ʋ1/2 for Peak b. The colored curves represent the CV results at various scan rates from 25 mV s−1 (the bottom curve) to 300 mV s−1 (the top curve).
Chemosensors 13 00082 g004
Figure 5. Effect of pH on the CVs of 600 nM metformin recorded in 0.1 M phosphate buffer solution at a scan rate of 100 mV s−1 at different pH values at the surface of P-g-C3N4/MOF-199/CPE. Panel (A) shows the cyclic voltammograms related to pH values in the range of 5 to 12, and its inset shows the variation in peak potential versus pH values. Panel (B) shows the cyclic voltammograms related to pH values in the range of 2 to 4. The colored curves represent the CV results of the testing solution with a pH value of 5–12 (from right to left) in panel (A) and 2–4 (from right to left) in panel (B), respectively.
Chemosensors 13 00082 g005
Scheme 1. The proposed mechanism for the electrooxidation of metformin at the surface of P-g-C3N4/MOF-199/CPE [10,24,26,28].
Chemosensors 13 00082 sch001
Figure 6. CVs of 600 nM metformin recorded in 0.1 M phosphate buffer (pH 7) at different scan rates at the surface of P-g-C3N4/MOF-199/CPE. The scan rates are 50–150 mV s−1. The colored curves represent the CV result of the testing solution with a scan rate of 50–150 mV s−1 (from bottom to top), respectively.
Chemosensors 13 00082 g006
Figure 7. The DPV results of sample solutions containing different concentrations of metformin (0, 0.5, 100, 200, 400, 600, 800, 1000, 1200 nM) recorded in 0.1 M phosphate buffer (pH 12). The inset shows the plot of the peak current as a function of metformin concentration in the range of 0.5–1200 nM. The colored curves represent the DPV result of the testing solution with a metformin concentration of 0 nM (the bottom curve) −1200 nM (the top curve), respectively.
Chemosensors 13 00082 g007
Table 1. Comparison of the performance of various electrodes for metformin detection.
ElectrodeMethodLinear RangeDetection LimitReference Number
SBA-15-Cu(II)–CPEDPV0.1–65 μM30 nM[10]
Cu-BTC (nano)/CNTs GCECV0.50–25.00 μM0.12 µM[24]
Copper-loaded, activated-charcoal-modified electrodeDPV0.05–60 μM0.009 μM[26]
MWCNT/PEDPV0.2 to 1.0 × 10 μM0.067 μM[28]
γ-Fe2O3@HAp/Cu(II)-CPEASDPV0.1 to 80 μM14 nM[29]
NCNT-Chi/GCEDPV0.3–10 µM9.6 nM[30]
ZnFe2O4-CuO/GCEDPV1.0 nM to 1.0 μM0.3 nM[31]
Pyrogallol-Modified CPEDPV0.8–6 μM0.0663 μM[32]
Co-doped YIG/GCEDPV0–60 μM0.04 μM[33]
Screen-printed platinum electrodes (SPPEs)DPV100–2000 pM9 pM[34]
Nitrogen-doped carbon nanotubes (NCNTs)DPV0.3–10 µM9.6 nM[30]
Glassy carbon electrode modified with a CuBTC/Nafion mixtureDPV0.5–280 µM0.19 µM[35]
CuxrGO1−x/GCEDPV2–70 µM0.09 µM[36]
Ag NPs/Cu2O/CuO/BNC/CPECV0.1–1000.0 μM42.3 nM[37]
P-g-C3N4/MOF-199/CPEDPV0.5 to 1200 nM0.15 nMThis work
Table 2. Voltammetric determination of MET in tablet (n = 5) and recovery data obtained for MET added in specified concentrations of MET in buffer solution (pH 12) using P-g-C3N4/MOF-199/CPE.
SampleAdded (nM)Found (nM)Recovery (%)RSD (%)
Tablet-411 3.7
200579963.1
4008081013.4
600977972.7
Disclaimer/Publisher’s Note: The statements, opinions and data contained in all publications are solely those of the individual author(s) and contributor(s) and not of MDPI and/or the editor(s). MDPI and/or the editor(s) disclaim responsibility for any injury to people or property resulting from any ideas, methods, instructions or products referred to in the content.

