Abstract
This study explores the effectiveness of functional near-infrared spectroscopy (fNIRS) as an implicit measurement tool for evaluating sweetness intensity and affective value. Thirty-two participants tasted sucrose solutions at concentrations of 0.15 M, 0.3 M, and 0.6 M, while both their neural responses were recorded with a 24-channel fNIRS system and their self-reported assessments of sweetness intensity and affective value were collected. The neural fNIRS data were converted into oxygenated hemoglobin (HbO) and deoxygenated hemoglobin (HbR) concentrations using the modified Beer–Lambert Law, and analyzed through univariate activation analysis and multivariable decoding analysis to identify neural activation patterns associated with sweetness perception. The results showed significant activation in the dorsolateral prefrontal cortex (dlPFC) and orbitofrontal cortex (OFC) in response to varying levels of sweetness intensity and affective value, with channels 8, 10, 12, 13, 14, 15, and 17 consistently activated across all sucrose concentrations. As sweetness concentration increased from 0.15 M to 0.6 M, the number of significantly activated channels rose from seven to eleven, indicating stronger and more widespread neural responses corresponding to higher sweetness intensity. The multivariable decoding analysis further demonstrated the capability of fNIRS in accurately distinguishing positive affective responses, with up to 72.1% accuracy. The moderate positive correlation between explicit self-reports and implicit fNIRS data regarding sweetness intensity further supports the validity of fNIRS as a reliable tool for assessing taste perception. This study highlights the potential of fNIRS in sensory neuroscience, demonstrating its effectiveness in capturing the neural mechanisms underlying sweet taste perception.
1. Introduction
Intensity and affective value, as key dimensions of taste perception, play significant roles in influencing consumer food choices and are critical for the quality control and marketing of food products [1,2,3]. However, accurately evaluating these dimensions is challenging because taste perception involves not only chemosensory input but additionally involves complex cognitive and emotional processes, including the integration of past experiences, personal preferences, and emotional responses. Currently, self-report-based explicit evaluation methods, such as the nine-point hedonic scale and the visual analog scale (VAS), are widely employed to measure consumer preferences and taste attribute intensity [4,5]. While these explicit methods are advantageous for quick data collection, ease of use, and straightforward analysis, they primarily capture conscious, verbal responses, potentially missing crucial non-verbal sensations and subconscious cognitive reactions that significantly contribute to sweetness intensity and affective value [6,7]. Therefore, there is a need for implicit measurement techniques that can access deeper layers of cognitive and emotional processing involved in taste perception [8].
Implicit neuroimaging techniques, such as electroencephalography (EEG) and functional magnetic resonance imaging (fMRI), have been employed to overcome the limitations of explicit measurement methods [9]. These methods capture subtle neural and physiological responses, providing a more comprehensive understanding of taste perception. Currently, neuroimaging research in taste perception mainly targets the regional representation of taste within the brain [10] and the precise decoding of specific taste attributes [11]. EEG offers high temporal resolution, which allows for the decoding analysis of neural activity linked to taste qualities and affective value responses. However, its limited spatial resolution and susceptibility to interference from head movements reduce its effectiveness in extracting detailed neural patterns associated with taste perception [12]. In contrast, fMRI identifies specific brain areas involved in processing taste intensity and affective value, providing a more comprehensive spatial exploration of taste attributes. However, the supine position required during fMRI scans may alter natural taste perception, which could potentially affect the results of implicit measurements [13]. Moreover, the low temporal resolution and high cost of fMRI equipment restrict most research to laboratory settings, which restricts its broader application.
In this context, functional near-infrared spectroscopy (fNIRS) has emerged as a promising neuroimaging technique for evaluating perceptual processes by measuring changes in cerebral oxygen levels. fNIRS provides higher spatial resolution than EEG and higher temporal resolution than fMRI, allowing it to capture subtle changes in perception processes with a balance between temporal and spatial precision. Additionally, fNIRS exhibits higher tolerance to motion artifacts, enabling it to acquire more precise implicit information during naturalistic tasks compared to EEG [14,15]. Its outstanding portability, low cost, and ability to collect data in participants’ natural state further position fNIRS as more suitable than fMRI for investigating the relationship between perception and brain activity [16,17]. Recent studies have highlighted the potential of fNIRS in better understanding complex taste perception processes. Laves et al. [18] explored neural correlates of food preference using fNIRS, revealing detailed brain activation patterns in response to different taste stimuli. Similarly, Meyerding et al. [19] utilized fNIRS to study neural activation in response to sweet and bitter tastes, as well as different types of chocolates, providing valuable insights into the neurophysiological underpinnings of taste perception. Minematsu et al. [20] monitored changes in oxygenated hemoglobin levels in response to sweet and bitter stimuli, showing distinct patterns for pleasant and unpleasant edibles, particularly in the anterior prefrontal cortex. These studies underscore the feasibility of using fNIRS to investigate taste perception and highlight its advantages over other neuroimaging techniques.
Despite recent progress, the application of fNIRS in quantifying sweetness intensity and linking it to explicit consumer reports remains underexplored. Most prior studies have primarily focused on identifying neural responses to different taste stimuli without specifically addressing variations in taste intensity or integrating implicit neural signals with explicit consumer reports. This study aims to contribute to bridging this research gap by leveraging fNIRS to explore the assessment of sweetness intensity and its associated affective value. Specifically, this study seeks to (1) validate the effectiveness of fNIRS in measuring sweet taste responses through univariate activation analysis via Support Vector Machine (SVM) classifiers; (2) achieve the effective decoding of sweetness intensity and affective value using multivariate decoding analysis; and (3) demonstrate the correlation between implicit fNIRS-based measurements and explicit self-reports through feature correlation and result consistency analysis.
2. Materials and Methods
2.1. Participants
A total of 32 volunteers from Zhejiang University were recruited to participate in the experiment, controlling for variables such as age, education level, and lifestyle. None of the participants had impairments in taste perception, and none had a history of neurological disorders, diabetes, or recent use of medications affecting taste perception. They were asked to abstain from eating, drinking, or smoking tobacco for at least one hour before the experiment to control for dietary influences on taste perception. Participants were informed about the nature, procedure, and potential risks of the study, as well as their right to withdraw at any time. Written informed consent was obtained from all participants before the start of the experiment, and they received monetary compensation. Of the 32 participants, 29 provided viable fNIRS data. One participant failed to attend, and two did not complete the experiment. All 29 participants included in the analysis were right-handed, with 17 females and 12 males. The mean age was 21 ± 1 years. All procedures performed in this study involving human participants were in accordance with the Medical Ethics Committee in the School of Medicine of Zhejiang University, and with the 1964 Helsinki declaration and its later amendments or comparable ethical standards.
2.2. Sweetness Stimuli
Sucrose solutions at three concentrations were used as sweet stimuli to represent varying levels of sweetness intensity: 0.15 M (low), 0.3 M (medium), and 0.6 M (high). These specific concentrations were derived from median concentrations identified in prior neuroimaging investigations of taste perception, which were compiled in previous neuroimaging meta-analyses [9,21,22,23,24]. Food-grade sucrose and deionized water were used to prepare these solutions. Sucrose was accurately weighed and dissolved in deionized water to achieve the desired molar concentrations. The solutions were stored in airtight glass containers at 4 °C to prevent contamination until use. Before each experimental session, the sucrose solutions were brought to room temperature. Deionized water was used as a tasteless reference to minimize potential interference from oral motor activity.
2.3. fNIRS Measurement
The portable 24-channel optical topography system (Brite24, Artinis Medical Systems, https://www.artinis.com/brite, accessed on 6 July 2024) with dual-wavelength emitters was used to record the fNIRS data. Optical signals were measured at wavelengths of 760 and 850 nm. This system incorporates 18 optodes (10 transmitters and 8 receivers) placed bilaterally in frontal to prefrontal locations, as indicated in Figure 1. The receiver–transmitter distance was set at 30 mm. A soft neoprene head cap was selected to match the subject’s head circumference. This ensured optimal optode-to-scalp coupling for an enhanced signal-to-noise ratio. Each emitter–detector module on the head cap is arranged in an array and equipped with adjustable brackets. After placing the head cap, the transmitters and receivers were positioned, and the brackets on each module were adjusted for the optimal alignment of the optodes with the skin to enhance signal reception. A movement sensor calibration was performed before each use, utilizing the device’s built-in 9-axis position sensor, to ensure accurate sensor alignment for optimal signal recording. Oxysoft software (version 1.81) was used to monitor signal quality, record the fNIRS data during the experiment, and assist in the movement sensor calibration.
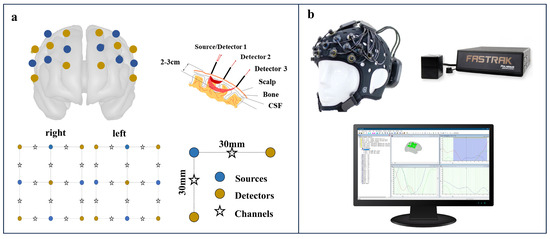
Figure 1.
Functional near-infrared spectroscopy (fNIRS) system setup. (a) Optode arrangement on a brain model with 30 mm source-detector spacing. (b) Equipment setup including head cap with optodes, positioning device, and real-time data monitoring.
A participant’s cranial morphology was evaluated using a Patriot device (a 3D digitizer from Polhemus Inc., Colchester, VT, USA), which aligned the cranial structure with a standard brain model and determined the positions of the fNIRS optodes relative to the template brain. Given the device’s susceptibility to electromagnetic interference, all experiments were conducted in an environment with minimal electromagnetic disturbances.
To ensure the precise and repeatable administration of taste stimuli during the fNIRS measurement, a self-developed delivery apparatus based on miniature peristaltic pumps was employed. The device features an open-source software and hardware architecture, and allows for swift adjustments to infusion parameters during experiments. It can perform the rapid injection of small volumes of taste solutions directly into the participant’s mouth, which minimized manual handling and reduced movement artifacts. The setup is illustrated in Figure S1, which outlines the integration of control modules, pump-driving units, and liquid transport paths, all coordinated for automated delivery directly to the participant’s mouth. Figures S2 and S3 show the detailed hardware configuration and software interface, respectively. This design helped maintain consistent timing and volume delivery, which were essential for reliable functional near-infrared spectroscopy (fNIRS) measurements.
2.4. Experimental Procedure
Before beginning the experiment, participants were provided with comprehensive information about the test content. To mitigate the influence of negative emotions and satiety, measurements were scheduled for the morning (10–11 a.m.) and afternoon (3–4 p.m.) sessions [25]. The study was conducted in a tranquil, fragrance-free, and secure environment with a maintained temperature of 26 ± 1 °C. Participants were seated and instructed to adhere strictly to guidelines which include avoiding conversation or movement, staying relaxed, maintaining steady breathing, and focusing on taste perception. The fNIRS equipment was then installed and calibrated according to Section 2.3. The signal quality of the channels was checked, and the topographical layout was set up before recording. Participants were asked to remain as calm as possible throughout the experiment and avoid any strong head movements. Then, the self-developed solution delivery apparatus was pre-configured with parameters for injection time, intervals, and volume. The fNIRS experiment was combined with a sensory evaluation approach (detailed below). After completing the fNIRS measurements, the headcap was removed from the participants.
2.5. Experimental Setup
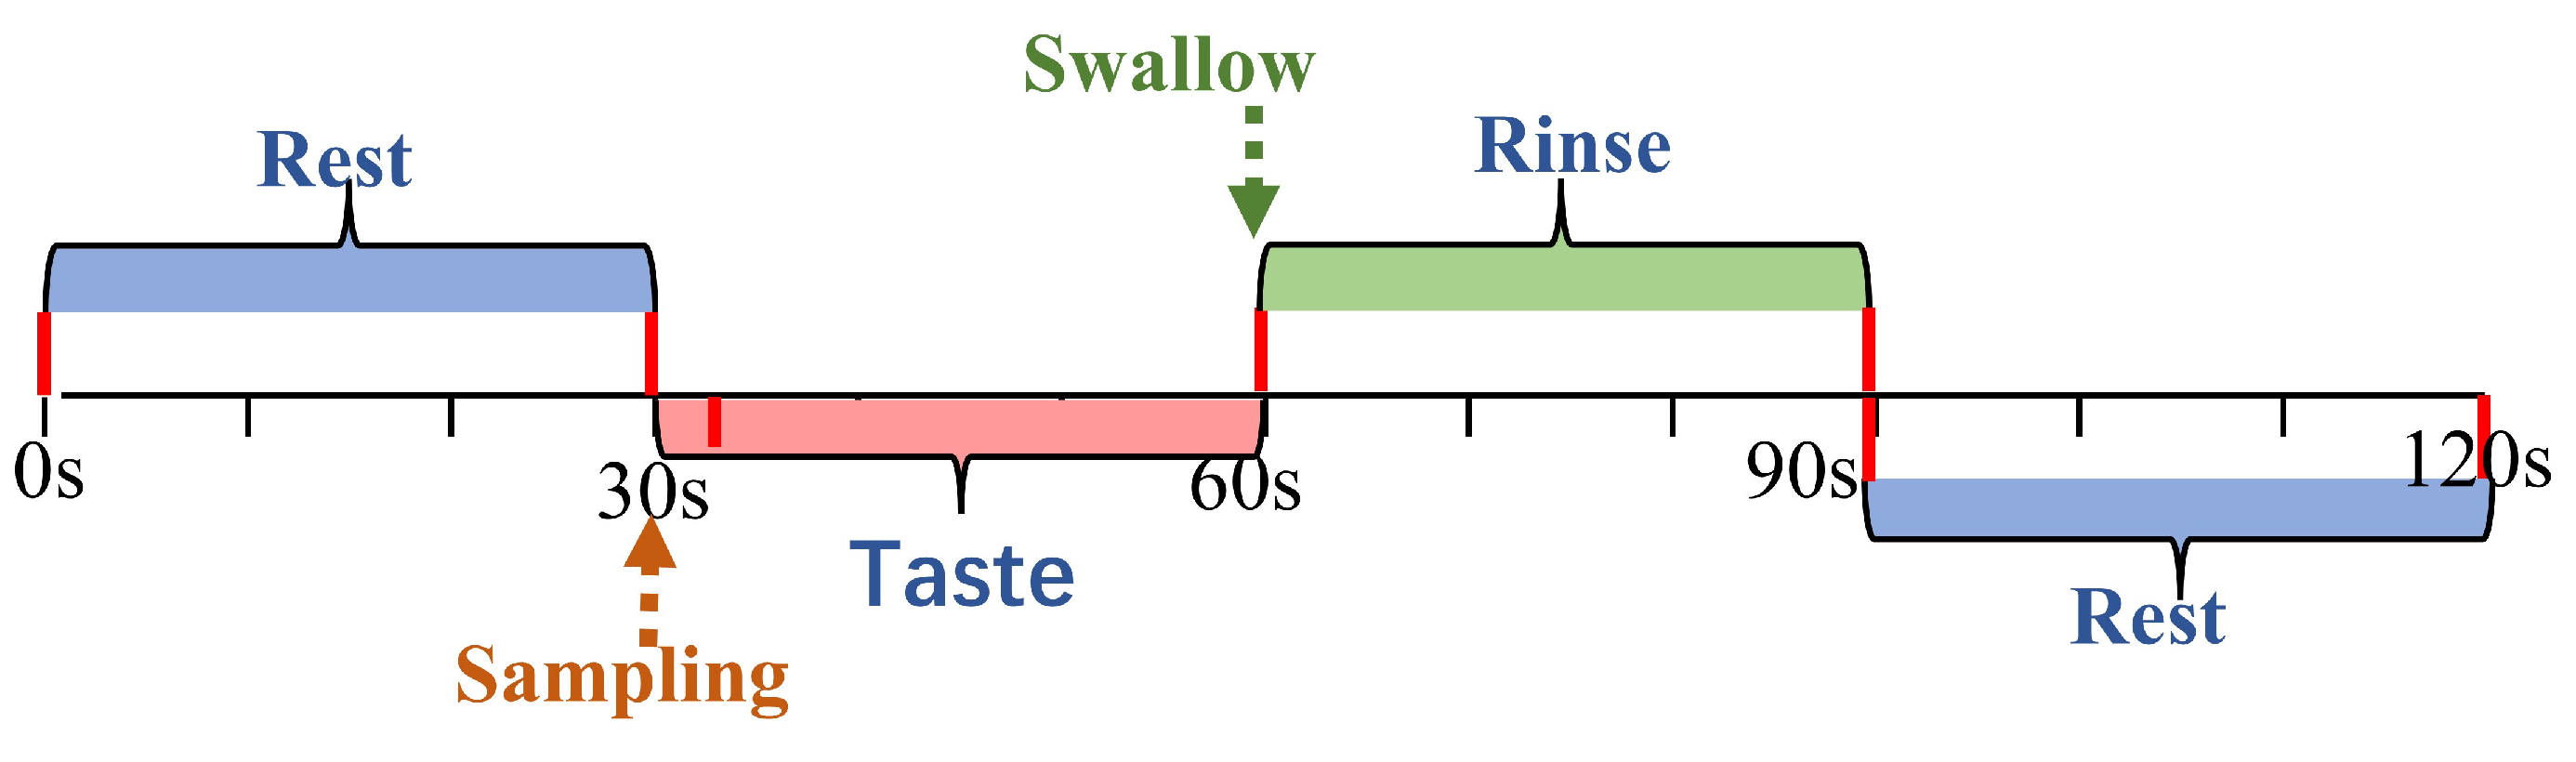
The experiment consisted of four conditions, tasting three different concentrations of sucrose solution and deionized water, which served as a tasteless control. The tasting was carried out blindly, which means that participants knew that they would taste different intensities of sucrose solutions but did not know the specific concentrations. Each experimental trial consisted of the following steps (Figure 2): The participants rested for 30 s. After the rest period, 2 mL of sucrose solution was infused into their mouth by the solution delivery system. Participants held the solution in their mouth for 30 s to taste it, then swallowed it and rinsed their mouths for an additional 30 s to eradicate any lingering taste. Participants then were asked to rate the perceived sweetness intensity using a 15-point scale ranging from 0 (’absent’) to 14 (’highly intense’). They also rated the affective value using a 9-point scale ranging from −4 (’extremely unpleasant’) to +4 (’extremely pleasant’). To ensure consistency, participants were trained on the scales in a pre-test session to familiarize them with their application. The rating and resting period took a total of 30 s, during which the next sample was prepared. Each sample was tasted three times in total.
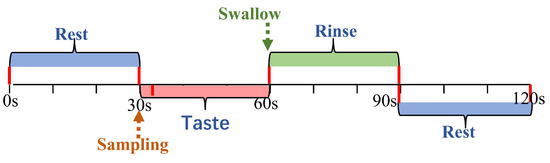
Figure 2.
Experimental trial schedule. Timeline of rest, taste, and rinse phases with corresponding durations for fNIRS trials.
2.6. Data Analysis
2.6.1. Explicit Analysis Based on Self-Report
Sweetness intensity data for each sucrose concentrations (0.15 M, 0.3 M, 0.6 M) were visualized using box plots and analyzed using one-way ANOVA followed by Tukey post hoc tests (p < 0.05) to determine significant differences. Affective value data were analyzed using similar statistical methods. Furthermore, a simplified two-dimensional emotion model was used to visualize the distribution of affective value ratings across participants.
2.6.2. Implicit Analysis Based on fNIRS Data
- Preprocessing of fNIRS data
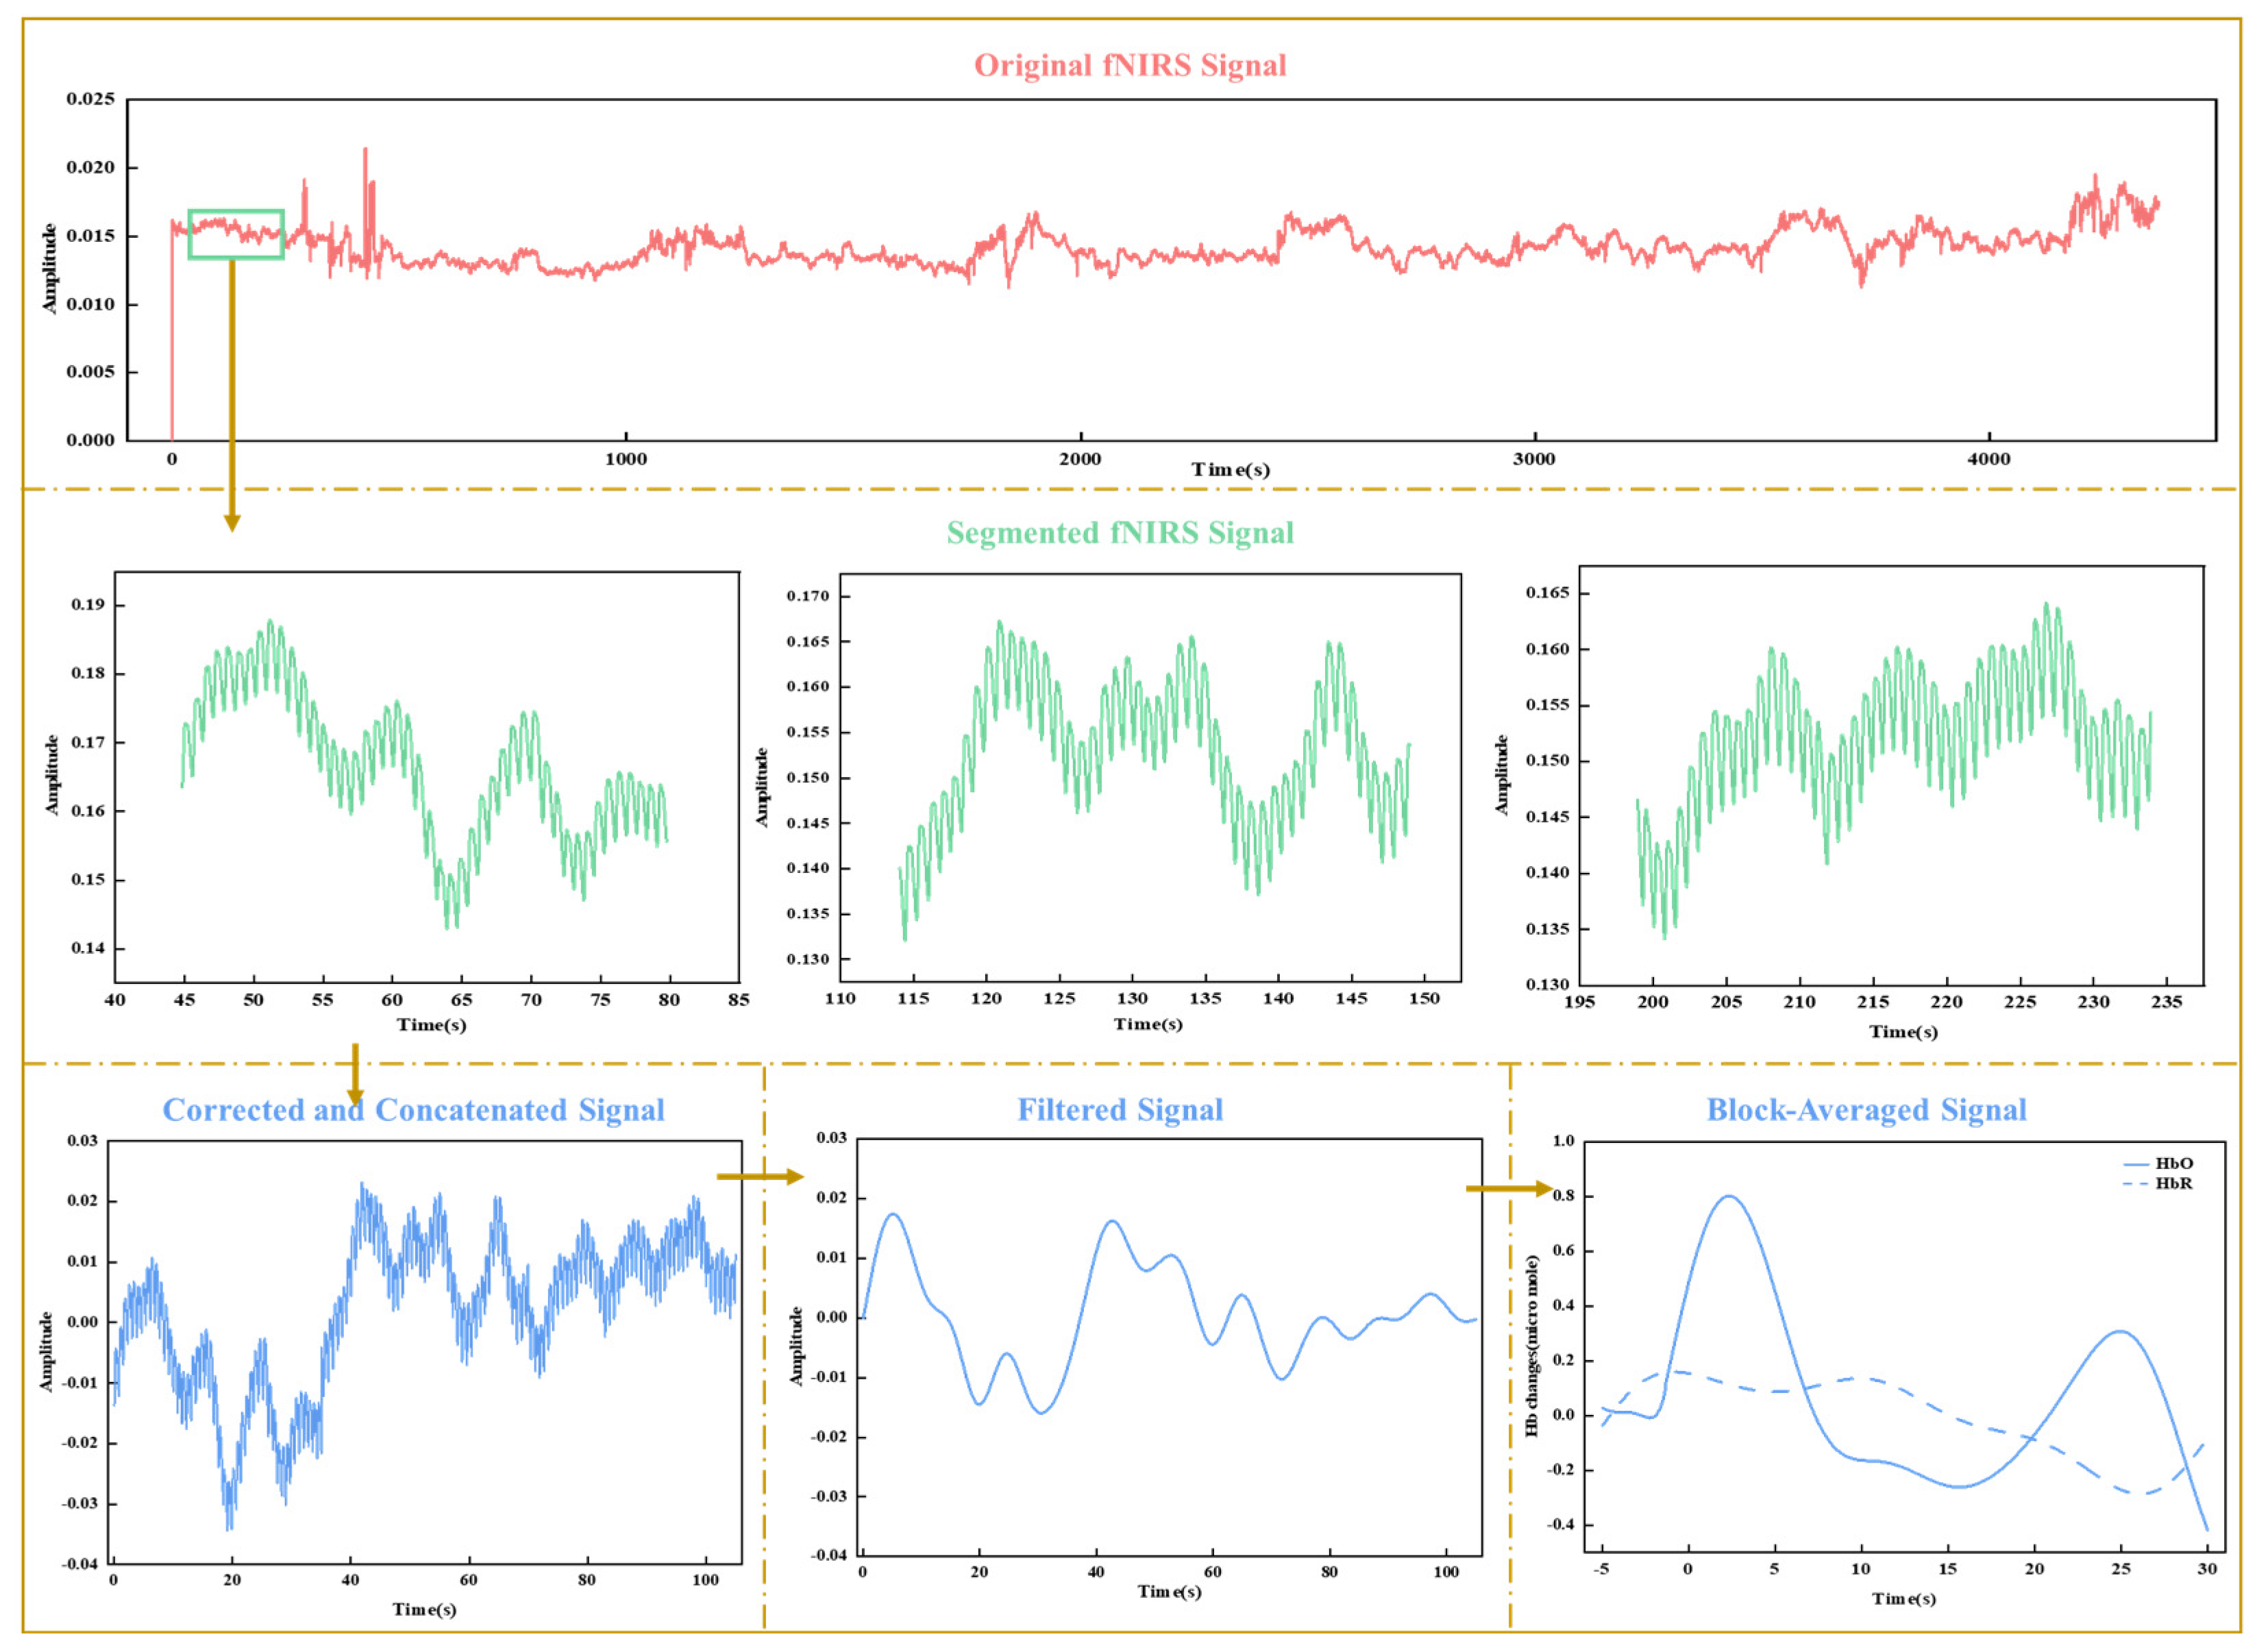
The entire experiment generated continuous original fNIRS signals, representing changes in detected light intensities corresponding to all experimental conditions. The original signals underwent the following preprocessing steps: (1) Data quality screening: Plotted figures of the original signals were visually inspected to identify and remove channels or trials with poor optode contact, motion artifacts, or outliers that deviated significantly from similar trials within each condition. Channels with a coefficient of variation greater than 15% and trial coefficients exceeding 5% were excluded. (2) Downsampling and conversion to optical density (OD): The data were downsampled to 25 Hz to reduce computational load. The light intensities were converted to OD values by calculating the logarithmic ratio of detected to incident light intensity, accounting for attenuation caused by absorption and scattering in brain tissue. (3) Epoch segmentation and baseline correction: The OD signals were segmented into 35-s epochs around the sweet stimulus for each trial, starting 5 s before the stimulus onset (0 s). Baseline correction was performed using the mean optical density (OD) calculated from −5 to 0 s. The corrected segments were spliced together by stimulus type to ensure continuity and consistency for subsequent analyses. (4) For each channel, data segments exhibiting sudden amplitude changes exceeding a predefined threshold (AMPthresh = 5) or a signal drift caused by artifacts greater than the standard deviation threshold (STDEVthresh = 50) are identified as motion artifacts. Principal Component Analysis (PCA) is applied to the motion artifact segments to remove the components that account for 90% of the total variance, as motion artifacts typically cause large fluctuations corresponding to the principal components with large variance. By removing these components, motion artifact interference is effectively eliminated, minimizing physiological noise and correcting for motion artifacts [26,27]. (5) Band-pass filtering: A band-pass filter (0.01–0.1 Hz) was applied to the signals to remove low and high frequencies associated with body movements, heart rate, and skin blood flow. (6) Conversion to HbO and HbR concentrations: The filtered signals were converted to oxygenated (HbO) and deoxygenated hemoglobin (HbR) concentrations using the modified Beer–Lambert Law (see Supplementary Materials for detailed definitions). (7) Block average: For each experimental condition, the HbO and HbR concentrations obtained from individual trials were averaged to reduce trial-to-trial variability and increase the signal-to-noise ratio. Figure 3 illustrates the key preprocessing steps, starting with the original fNIRS signals and including segmentation, correction, filtering, and block averaging.
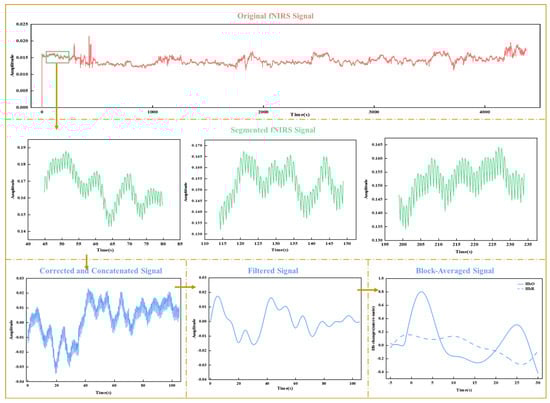
Figure 3.
Visualization of key fNIRS data preprocessing steps.
- Feature Extraction of fNIRS data
Only the processed HbO signals were used for feature extraction and analysis, as they exhibited a superior signal-to-noise ratio compared to HbR signals [20]. Eight parameters representing different specific aspects of HbO concentration curves (as shown in the bottom-rightmost subplot of Figure 3) during the 0–20 s post-stimulus time window were extracted as features, including the maximum value, mean value, area under the curve, standard deviation, left slope for the time window of 2–7 s, sample entropy, approximate entropy, and an 8th-order autoregressive (AR) model (without extensions) (see Supplementary Materials for detailed definitions and calculations) These features capture various dimensions of the neural response, providing a comprehensive representation of the data. The maximum value, mean value, and area under the curve reflect the overall magnitude of neural activation related to sweetness intensity. The standard deviation captures response variability, indicating sensitivity. The left slope (2–7 s) reflects rapid neural changes linked to initial sensory processing. Sample and approximate entropy assess response complexity, indicating sensory processing depth. Autoregressive model parameters capture temporal dynamics, reflecting the brain’s predictive processing of sweetness. The features extracted from the HbO signals across different fNIRS channels were then concatenated horizontally to form a fusion feature set.
- Univariate activation analysis
Univariate activation analysis was used to explore the neural activation patterns in the prefrontal cortex in response to a sucrose solution. The extracted HbO signals’ features were employed to determine if all 24 fNIRS channels were activated by sweetness intensity and affective value, and a paired t-test was conducted across these channels to compare the neural responses under different conditions. Specifically, for sweetness intensity, neural responses to sucrose concentrations (low, medium, and high) were compared relative to the tasteless solution. For affective value, neural responses to positive and negative affective values were compared relative to neutral affective conditions. The significance threshold was set at p < 0.05. To address the issue of multiple comparisons across 24 fNIRS channels, Benjamani–Hochberg correction was applied to control the false discovery rate (FDR). Specifically, the p-values obtained from paired t-tests for each channel were ranked in ascending order, and significance thresholds based on their ranks and the total number of comparisons. Channels with p-values below their respective thresholds were deemed significantly activated.
- Multivariable decoding analysis
To investigate the neural correlates of sweetness intensity and affective value, we employed a Support Vector Machine (SVM) with a Radial Basis Function (RBF) kernel for multivariable decoding analysis. The analysis was conducted using a custom MATLAB script (2021b) with the LIBSVM machine learning library and the extracted fNIRS feature set [28,29]. SVM was chosen for its robustness in handling high-dimensional data, capturing non-linear relationships, and its effectiveness in small-sample neuroimaging classification. Decoding accuracy was computed as the proportion of correctly classified instances:
To assess the generalization of the decoding results, a leave-one-out cross-validation (LOO-CV) process was performed. In each iteration, decoding accuracy was calculated, and the average decoding accuracy was reported as the final result:
where n is the total number of iterations in the cross-validation. This approach ensures robustness by evaluating model performance across all trials.
The SVM classifier was trained with two sets of target labels: (1) sweetness intensity levels, represented by discrete labels (SU1, SU2, and SU3), and (2) affective value, categorized as positive and negative. These labels were numerically encoded (e.g., 0 for negative and 1 for positive) to train the SVM classifier. Statistical significance of decoding accuracy was evaluated using empirical p-values derived from repeated classification with permuted labels, generating a null distribution for comparison.
2.6.3. Relationship Analysis Between Explicit and Implicit Measurement
To explore the relationship between fNIRS-based implicit measures and self-reported explicit measures of sweetness perception, correlation and consistency analyses were performed. The input data for clustering relationship analysis included two primary components: (1) explicit data, which consisted of self-reported evaluations of sweetness intensity and affective value, and (2) implicit data, which were derived from features extracted from the preprocessed fNIRS signals. The correlation analysis examined the relationship between the implicit and explicit feature datasets. For the consistency analysis, the sweetness intensity evaluated data were divided into three groups (low intensity, medium intensity, high intensity), and affective value data were split into two categories (positive and negative). These categories were designed to align with the subjective perceptions captured in the explicit evaluations. In parallel, the implicit data were grouped using unsupervised K-means clustering, with predefined cluster numbers (k = 3 for sweetness intensity and k = 2 for affective value) and the Euclidean distance metric. The clusters were labeled based on the largest feature subset exhibiting matching attributes, with each cluster assigned a label according to the predominant features within it. The Proportion of Consistency (POC) was calculated by comparing the sample labels from the categorization and clustering results with the original labels, yielding consistency values for both explicit and implicit data. The relationships between sweetness intensity and the POC, as well as affective value and POC, were then explored by fitting regression curves. For the implicit data, the clustering results for each feature subset were used to fit individual regression curves for the relationships between sweetness intensity, affective value, and the POC. These individual regression curves were then further analyzed using a mixed-effects model to obtain the composite regression curves for sweetness intensity (denoted as ya1) and affective value (denoted as ya2). For the explicit data, the regression curves were directly fitted for the relationships between sweetness intensity and the POC (denoted as yb1) and affective value and the POC (denoted as yb2). These curves were compared to evaluate the alignment between the explicit model (based on manual categorization) and the implicit model (based on unsupervised clustering) in terms of their ability to capture the relationship between taste attributes (sweetness intensity and affective value) and the POC. To quantify the degree of alignment, a composite similarity index () was computed. The index integrates length similarity (( and orientation similarity ()), with thresholds (LS ≥ 0.9 for strong consistency, 0.6 ≤ LS < 0.9 for moderate consistency, and LS < 0.6 for low consistency) which were set to assess the consistency between the explicit and implicit models. The composite similarity was defined as:
where
Here, and represent the regression curves derived from explicit and implicit data models, respectively. and represent the lengths of and . and represent the horizontal inclination of and . and are the similarity weight.
3. Results
3.1. Self-Report-Based Explicit Analysis Results
3.1.1. Sweetness Intensity
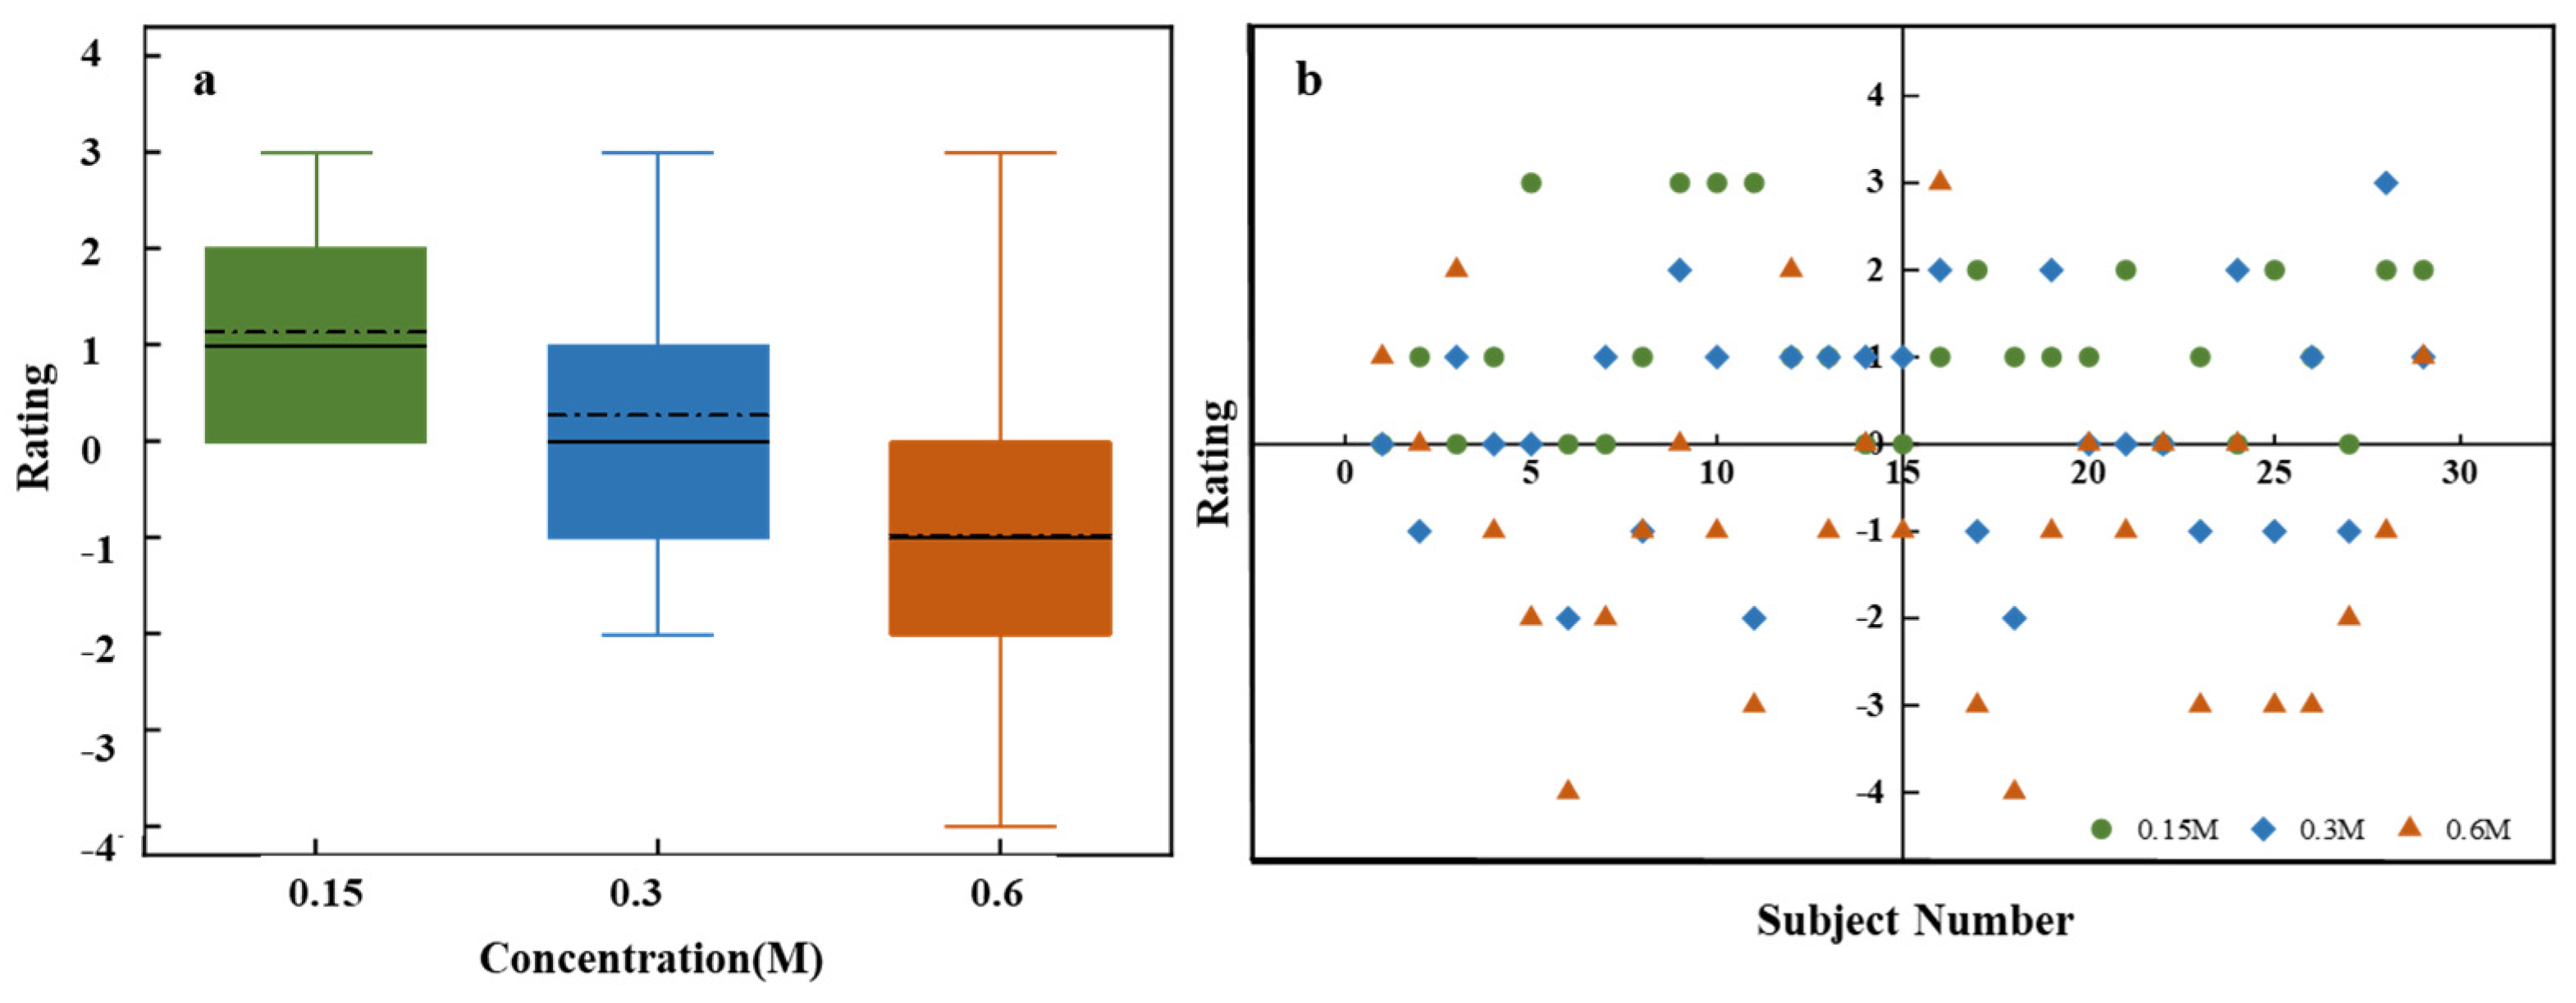
Figure 4a shows sweetness intensity assessments for sucrose solutions with varying concentrations. One-way ANOVA results indicated significant differences in sweetness intensity across different concentrations (F = 129.62, p = 2.1141 × 10⁻²⁶). Sweetness intensity increased with sucrose concentration, demonstrating a clear positive correlation. However, the box plot reveals substantial variability in sweetness intensity assessments across different concentrations. At low and medium concentrations, broader variability is observed, which reflects inter-individual differences in taste perception. In contrast, the narrower variability at high concentrations suggests greater consistency among participants. This may be due to individual differences in taste receptor sensitivity at lower concentrations, whereas saturation effects at higher concentrations lead to more uniform perception [30].
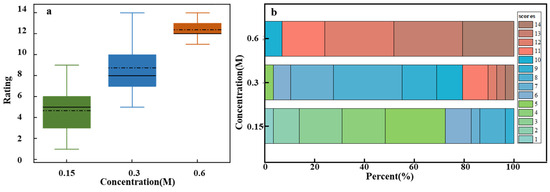
Figure 4.
Sweetness intensity evaluation for sucrose solutions of different concentrations. (a) Box plot of ratings for low (0.15 M), medium (0.3 M), and high (0.6 M) concentrations. (b) Stacked bar chart of individual ratings’ distribution on a 15-point scale.
Figure 4b presents a more detailed analysis of the sensory evaluation data, which includes specific assessments provided by all participants for different concentrations of sucrose solution. Each box represents the overall distribution of assessments for low, medium, and high sucrose concentrations on a 15-point scale. Different colors represent various assessment levels, with the color size indicating the proportion of individuals giving that rating. For instance, the 0.15 M concentration box mainly shows assessments in the 1–5 range (green), 0.3 M primarily showed assessments in the middle range (blue), and 0.6 M showed assessments mostly in the higher range (red). This overlap, particularly in the medium concentration range where both green and red hues may appear, highlights the subjectivity and individual variability in taste perception. These differences in responses could be due to personal taste preferences and psychophysiological factors [31,32]. For example, one participant rated the 0.15 M solution as a 3 and considered it mildly sweet, whereas another participant rated the same concentration as a 7, indicating a stronger sensitivity to sweetness.
3.1.2. Affective Value
Figure 5a depicts the affective value for sweetness at different sucrose concentrations. ANOVA results reveal significant differences in affective value scores across concentrations (F = 16.19, p = 1.12718 × 10⁻⁸). As sucrose concentration increases, affective value scores decline significantly, which indicates a negative correlation. High concentrations of sucrose may lead to an unpleasant taste experience, likely due to overstimulation, taste fatigue, or saturation effects. Additionally, the heightened sensitivity to sugar intake, driven by the high sweetness and energy density of the solution, may also contribute to this decline in affective value. Conversely, low-concentration sucrose solutions tend to elicit a milder sweetness that better aligns with taste preferences, leading to higher affective value scores.

Figure 5.
Affective value evaluation for sucrose solutions of different concentrations. (a) Box plots for low (0.15 M), medium (0.3 M), and high (0.6 M) concentrations. (b) Scatter plot of individual ratings.
Figure 5b displays individual evaluation distributions for different sucrose concentrations. Low-concentration solutions have concentrated high scores, while medium concentrations show a broader distribution. High concentrations encompass the entire assessment range, suggesting greater variability and significant individual differences. The broad distribution of ratings at higher concentrations suggests that while some individuals may enjoy the heightened sweetness, others may find it overwhelming or unpleasant.
While sweetness intensity increases with sucrose concentration, affective value decreases. This indicates that higher sweetness levels are perceived as less pleasant, which contrasts with the expected model where pleasantness increases up to an optimal point before declining. The absence of this expected optimal point in the current study may be due to the specific concentration gradient used, potentially failing to capture the peak level of pleasantness. Nevertheless, this finding underscores the complexity of determining an optimal sweetness concentration that balances both taste intensity and emotional value. The score distributions and individual differences shown in Figure 4b and Figure 5b further highlight the subjectivity and diversity of taste perception, influenced by both explicit factors like sucrose concentration and implicit factors such as physiological and psychological states, as well as personal preferences [33]. For example, a hungry participant might find higher sweetness more pleasant, while a stressed participant may perceive the same concentration as unpleasant. Since self-reports may not fully capture these implicit influences, integrating implicit measurement techniques is essential for a comprehensive understanding of taste perception.
3.2. fNIRS-Based Implicit Data Analysis Results
3.2.1. Sweetness Intensity
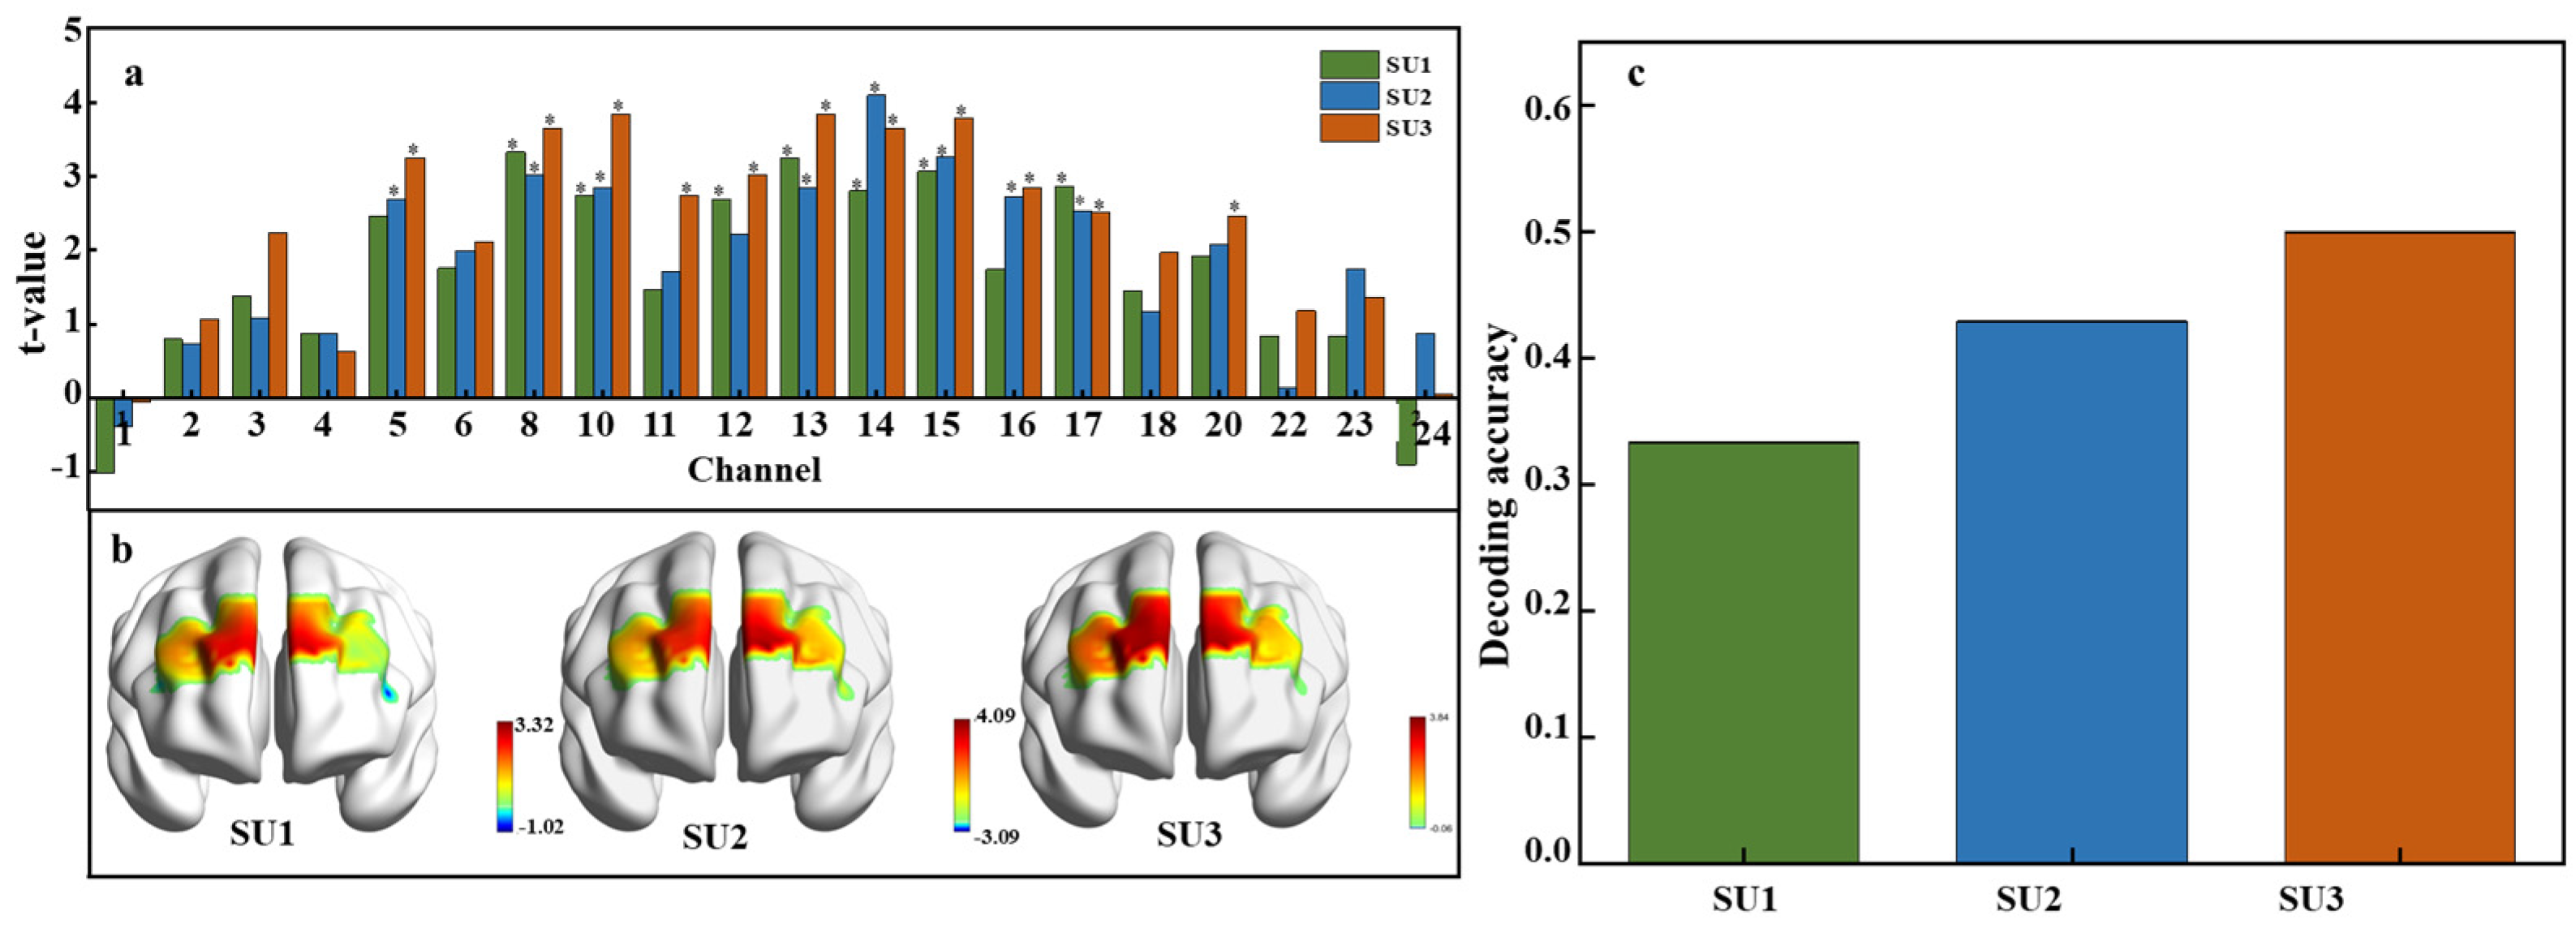
To examine neural activation in response to varying sweetness intensities, a paired t-test was conducted across all 24 fNIRS channels using the extracted HbO signal feature data. Neural responses to low, medium, and high sucrose concentrations were compared against a tasteless baseline. Figure 6a illustrates significant activations at different concentrations. At the low concentration (0.15 M), significant activations were observed in channels 8, 10, 12, 13, 14, 15, and 17. Channel 8 showed the highest t-value, indicating the most pronounced response. For the medium concentration (0.3 M), channels 5, 8, 10, 13, 14, 15, 16, and 17 were engaged, and channel 14 demonstrated the strongest response. The high concentration (0.6 M) markedly activated channels 5, 8, 10, 11, 12, 13, 14, 15, 16, 17, and 20, where channel 10 registered the highest t-value. Further analysis showed that channels 8, 10, 13, 14, 15, and 17 were consistently activated across sucrose concentrations, and this suggests their general sensitivity to the solution. In contrast, channels 11 and 20 were only activated at high concentrations (SU3), which may reflect a specific sensitivity to high sweetness levels. Additionally, the t-values increased with sucrose concentration, indicating a stronger neural response at higher sweetness levels. The number of activated channels also grew from seven at the low concentration to eleven at the high concentration, which reflects a broader neural response to higher sweetness levels.

Figure 6.
Neural activation and decoding accuracy across sweetness intensity. (a) T-values for each channel under low, medium, and high sucrose concentrations, p < 0.05. SU1 = 0.15 M (low concentration), SU2 = 0.3 M (medium concentration), and SU3 = 0.6 M (high concentration). (b) Spatial distribution of t-values across brain regions. (c) Decoding accuracy for each concentration.
The t-test values across different brain regions at various sweetness concentrations are visualized in Figure 6b, showing the spatial distribution of neural activation induced by sweet sucrose solutions. As sweetness concentration increases, the range of activated brain regions expands. Specifically, significant activation is observed bilaterally in the dlPFC under a low concentration. A medium concentration stimulates greater activation in the right dlPFC and the left orbitofrontal cortex, while a high concentration activates both dlPFC regions and the left orbitofrontal cortex. Figure 6c displays the average decoding accuracy, defined as the proportion of correctly predicted sweetness concentrations, with accuracy reaching up to 50% at the highest sucrose concentration. This suggests that higher concentrations of sucrose not only elicit stronger neural activations but may also slightly enhance the discriminability of neural patterns associated with different levels of sweetness. However, despite these neural activations and the above-chance decoding accuracy, the ability to accurately classify sweetness levels based on fNIRS data alone remains moderate.
3.2.2. Affect Value
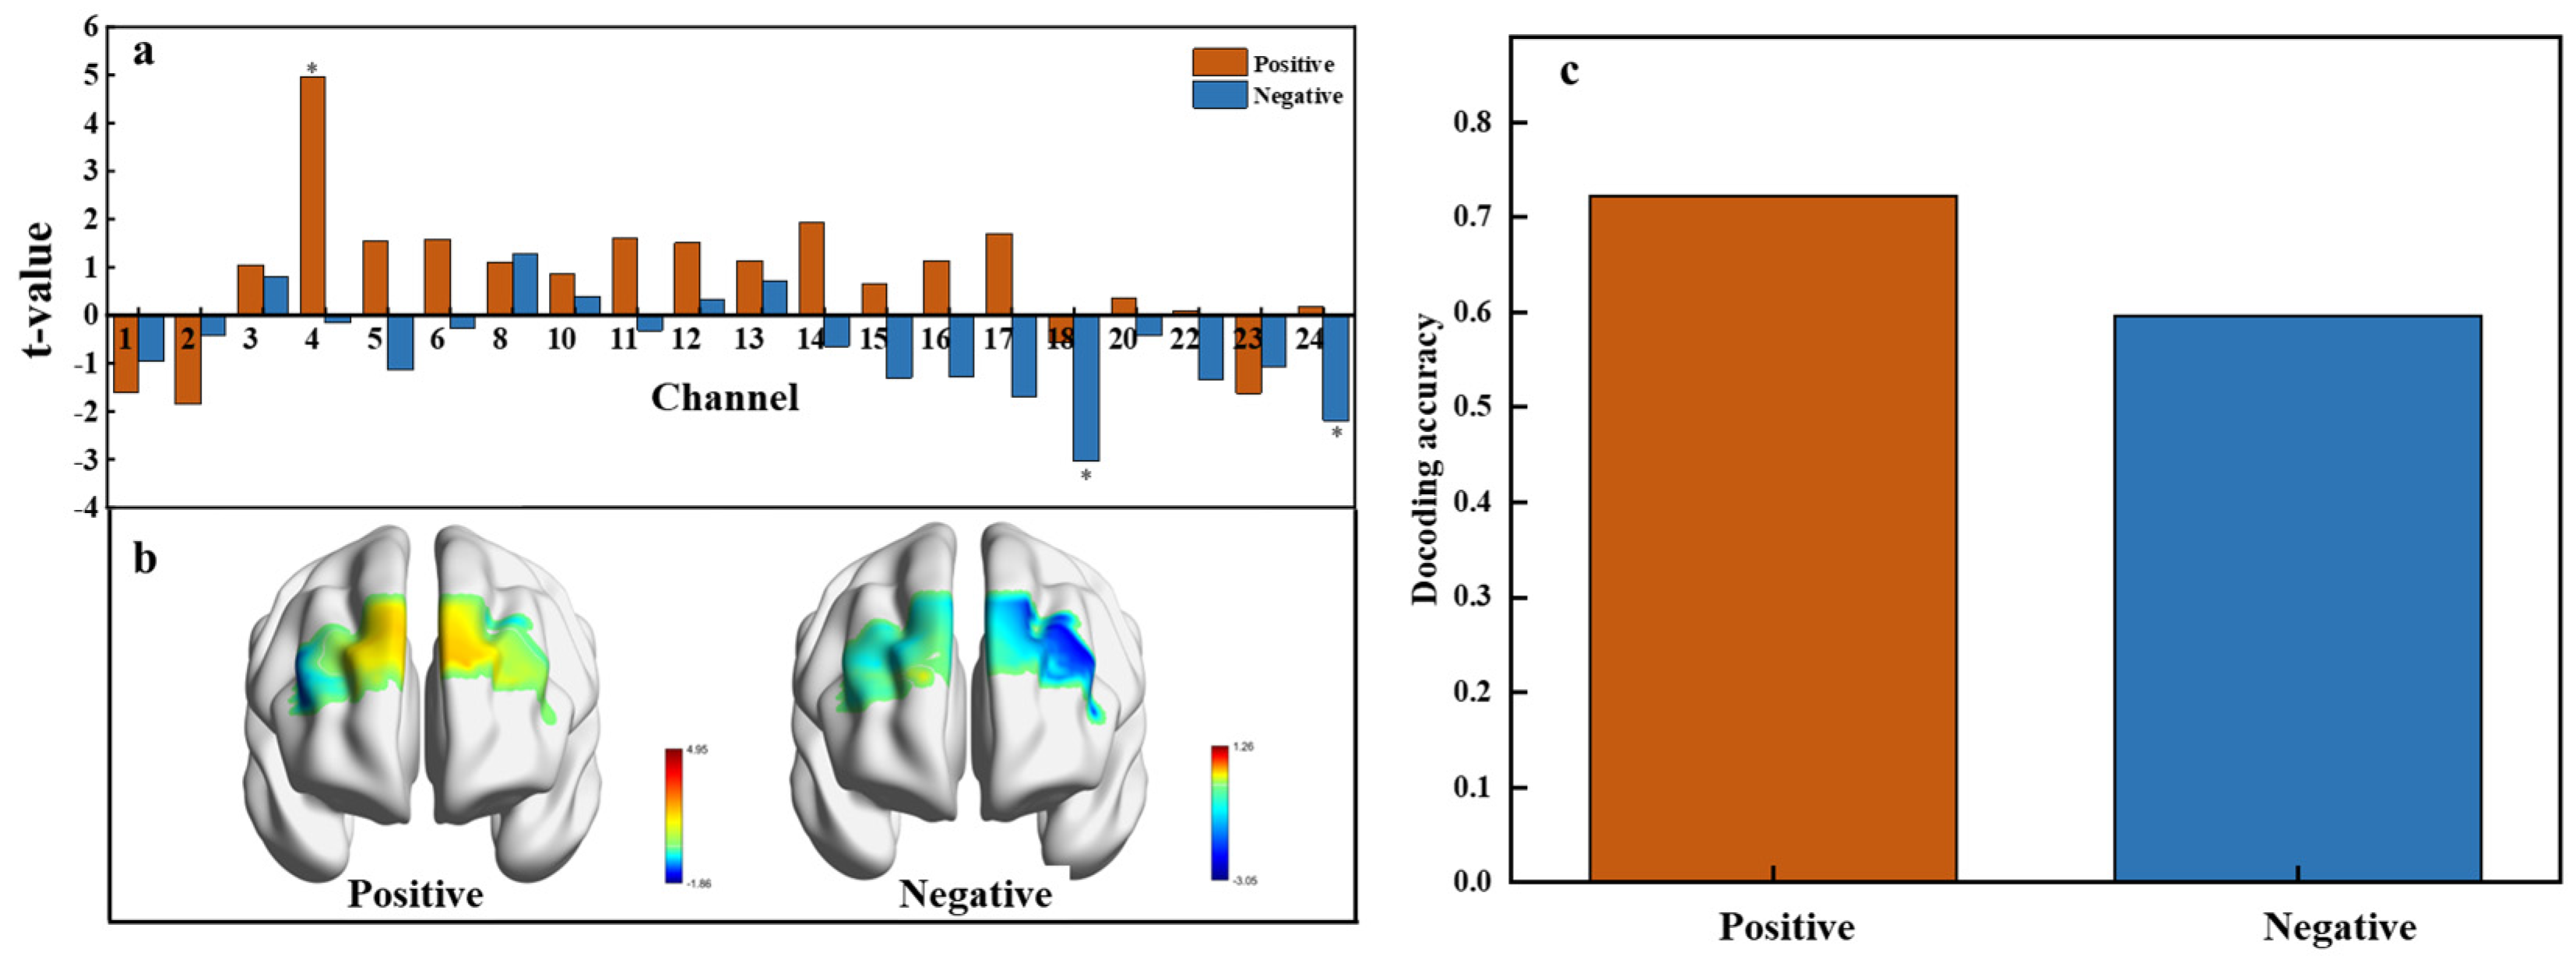
To investigate neural activation in response to positive and negative affective values, neural responses to emotional conditions were compared against a neutral baseline using data from 24 fNIRS channels. Paired t-tests revealed significant activations in specific channels (Figure 7a). Specifically, channel 4 exhibited significant activation for the positive affective value, while channels 18 and 24 were significantly activated for the negative affective value. Positive t-values indicate heightened neural activity compared to the baseline, while negative t-values suggest decreased activity. This distribution underscores the differential neural responses to affective valence, with a predominance of positive t-values under positive affective conditions and negative t-values under negative conditions. The subsequent visualization of t-test values in brain regions (Figure 7b) shows that positive emotional activation primarily engages the right lateral orbitofrontal cortex (OFC), while negative emotional activation is linked to the left lateral orbitofrontal cortex (OFC) and the left ventrolateral prefrontal cortex.
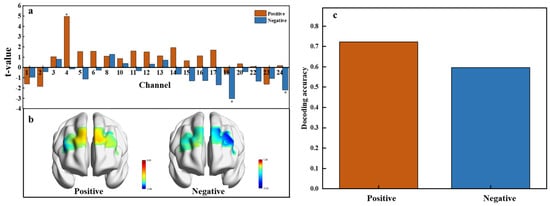
Figure 7.
Neural activation and decoding accuracy across affective value. (a) T-values for each channel under positive (orange) and negative (blue) conditions, p < 0.05. (b) Spatial distribution of t-values across brain regions showing activation related to positive and negative affective responses. (c) Decoding accuracy for positive and negative affective responses.
The multivariable decoding analysis using Support Vector Machines (SVMs) yielded a decoding accuracy of 72.15% for the positive affective value and 59.56% for the negative affective value (Figure 7c). The lower accuracy for the negative affective value may result from the diverse emotions triggered by different sweetness levels, such as disgust at high concentrations, disappointment at low concentrations, or anxiety over health concerns with high sugar intake. These variations likely lead to less consistent neural patterns, which complicate the decoding of negative emotions.
3.3. Relationship Between Explicit and Implicit Measurement
3.3.1. Sweetness Intensity
Correlation analysis between explicit sweetness intensity ratings and implicit fNIRS features (Figure S4) revealed predominantly weak correlations, with most coefficients below 0.2. Some features show slightly stronger correlations. For instance, the correlation coefficient for the approximate entropy feature reaches 0.25, which still indicates a weak positive correlation with explicit intensity evaluation. Approximate entropy assesses time series complexity, with a focus on repetitive pattern occurrences. Increased sensory stimulation often leads to more repetitive neural activity patterns, thereby increasing approximate entropy values. The sample entropy feature exhibits a correlation coefficient above 0.3, representing a moderate positive correlation. This finding suggests that stronger sweetness perception may involve more intricate neural processing, which leads to higher sample entropy values. Conversely, the correlation coefficient for the left slope feature is below −0.2, indicating an increase in neural activity change with heightened sweetness intensity. This negative slope implies a decrease in oxyhemoglobin concentration, with larger absolute values suggesting more pronounced fluctuations in neural activity corresponding to changes in sweetness intensity.
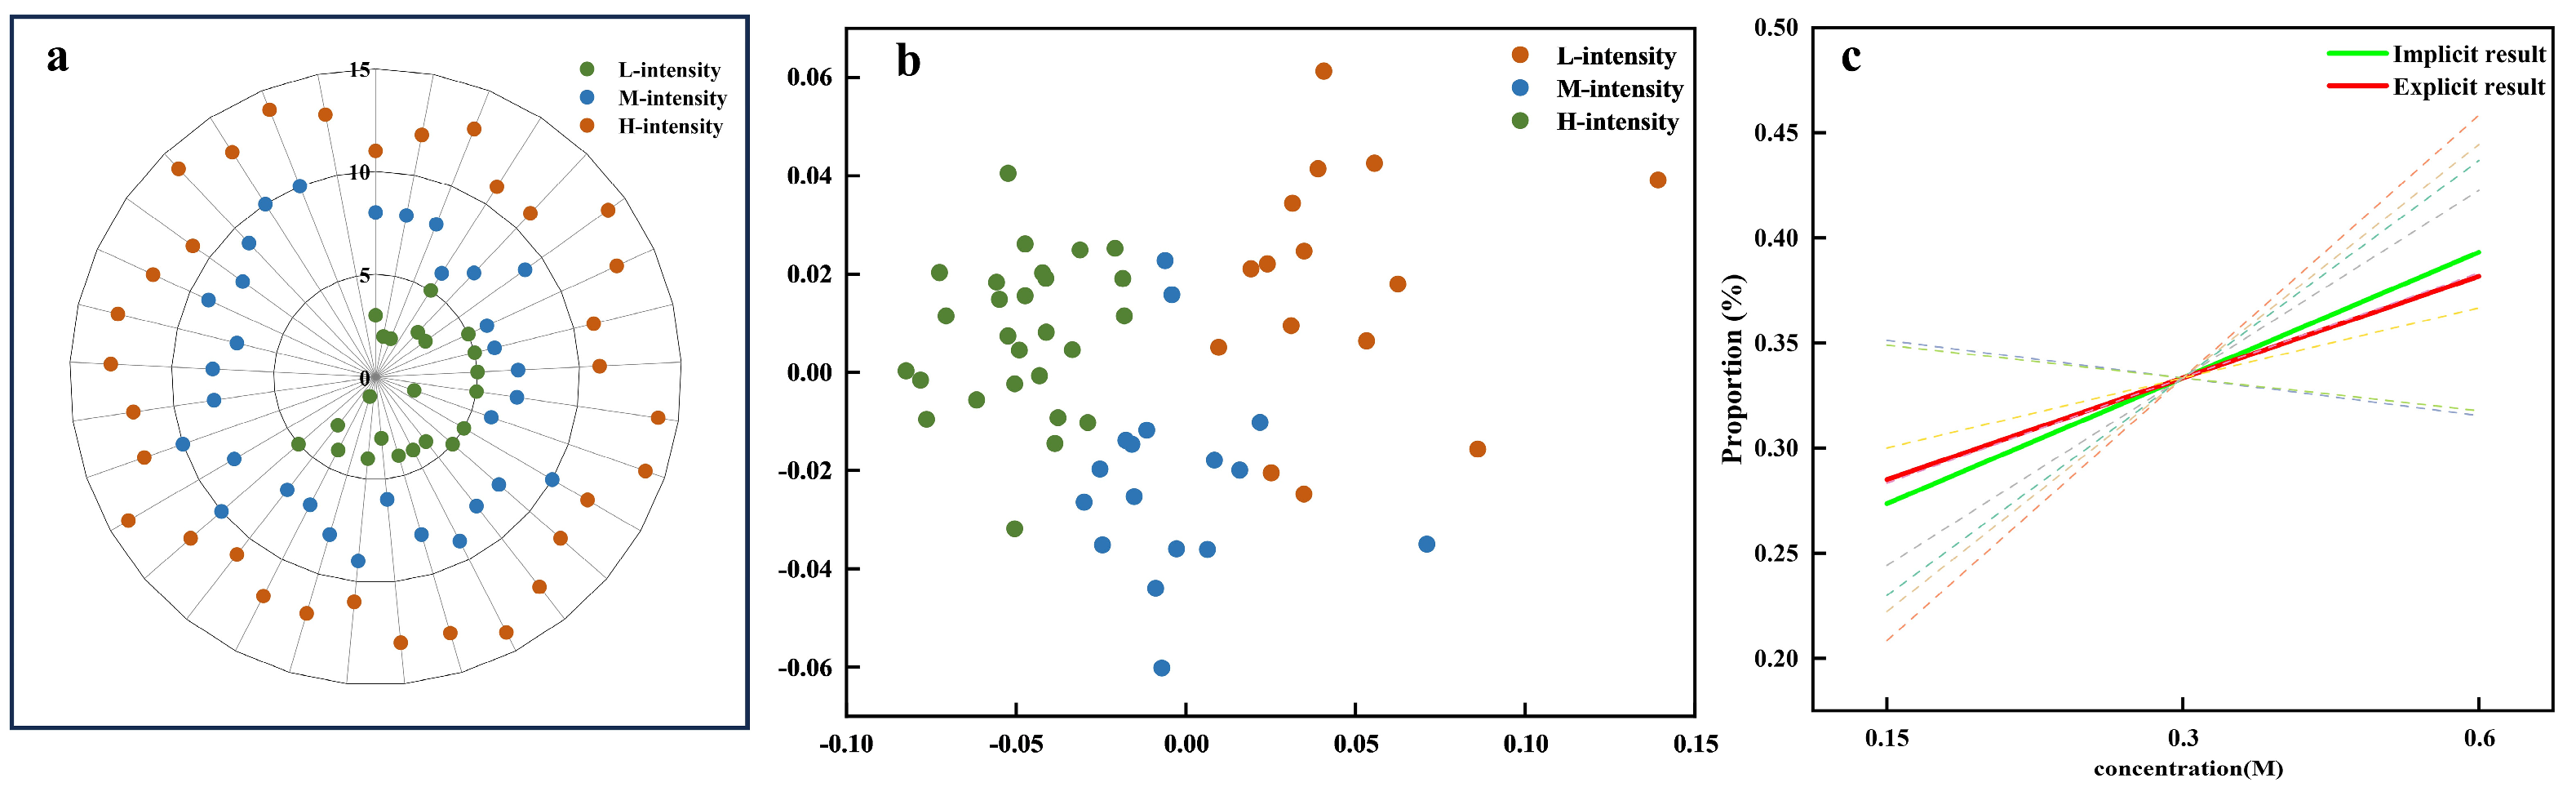
Figure 8 illustrates the consistency analysis between explicit and implicit measures of sweetness intensity. In the explicit data, the sweetness intensity evaluations were manually categorized into three levels: low (L-intensity), medium (M-intensity), and high (H-intensity), as shown in Figure 8a. Similarly, the implicit data were grouped using unsupervised K-means clustering with predefined cluster numbers (k = 3), which revealed three distinct clusters corresponding to different levels of sweetness intensity (Figure 8b). These clusters were labeled based on the predominant feature attribute within each group. The consistency analysis quantified the alignment between explicit and implicit data models by calculating the Proportion of Consistency (POC). The analysis revealed a positive correlation between the POC and sweetness intensity, indicating that higher sweetness levels were more consistently identified across both methods (Figure 8c). The dashed lines represent the individual regression curves fitted to each feature subset (based on clustering results). These individual regression curves were then further analyzed using a mixed-effects model to obtain the composite regression curves (the green solid line). The green solid line (ya1 = 0.2248x + 0.2547) corresponds to the regression line derived from the implicit data (based on K-means clustering), capturing the relationship between the implicit sweetness intensity (x) and the POC (y). In contrast, the red dashed line (yb1 = 0.2151x + 0.2581) represents the regression line derived from the explicit data, reflecting the relationship between the self-reported explicit sweetness intensity levels and the POC. The high composite similarity index of 0.998 further confirms that both the explicit and implicit data models consistently capture the same underlying relationship between sweetness intensity and the POC. This alignment suggests that both measurement approaches are effective in capturing the sensory perception of sweetness intensity.
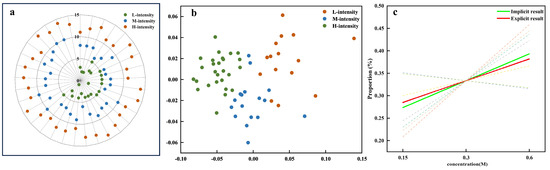
Figure 8.
Result consistency across sweetness intensity measures. (a) Explicit data clusters: L-intensity (low intensity), M-intensity (medium intensity), and H-intensity (high intensity). (b) Implicit data clusters. (c) Regression curves for POC (Proportion of Consistency) analysis comparing implicit (green) and explicit (red) results, with dashed lines representing variations across different feature datasets.
3.3.2. Affect Value
The correlation coefficients between explicit and implicit features related to affective value are generally below 0.2 (Figure S5), indicating a weak correlation. The correlation coefficient for the sample entropy features is close to 0.3, which suggests a near-moderate positive relationship between the two measurements. Emotional experiences typically activate the brain’s reward system, and this activation results in complex patterns of neural activity. Conversely, the correlation coefficient for the left slope is below −0.2, reflecting a negative correlation with explicit affective value evaluations. The left slope represents the rate of change in neural activity, where steeper slopes correspond to faster decreases in oxyhemoglobin concentration. This finding suggests that when participants perceive less pleasure, there is a more rapid change in neural activity, as indicated by a decrease in oxygenated hemoglobin concentration.
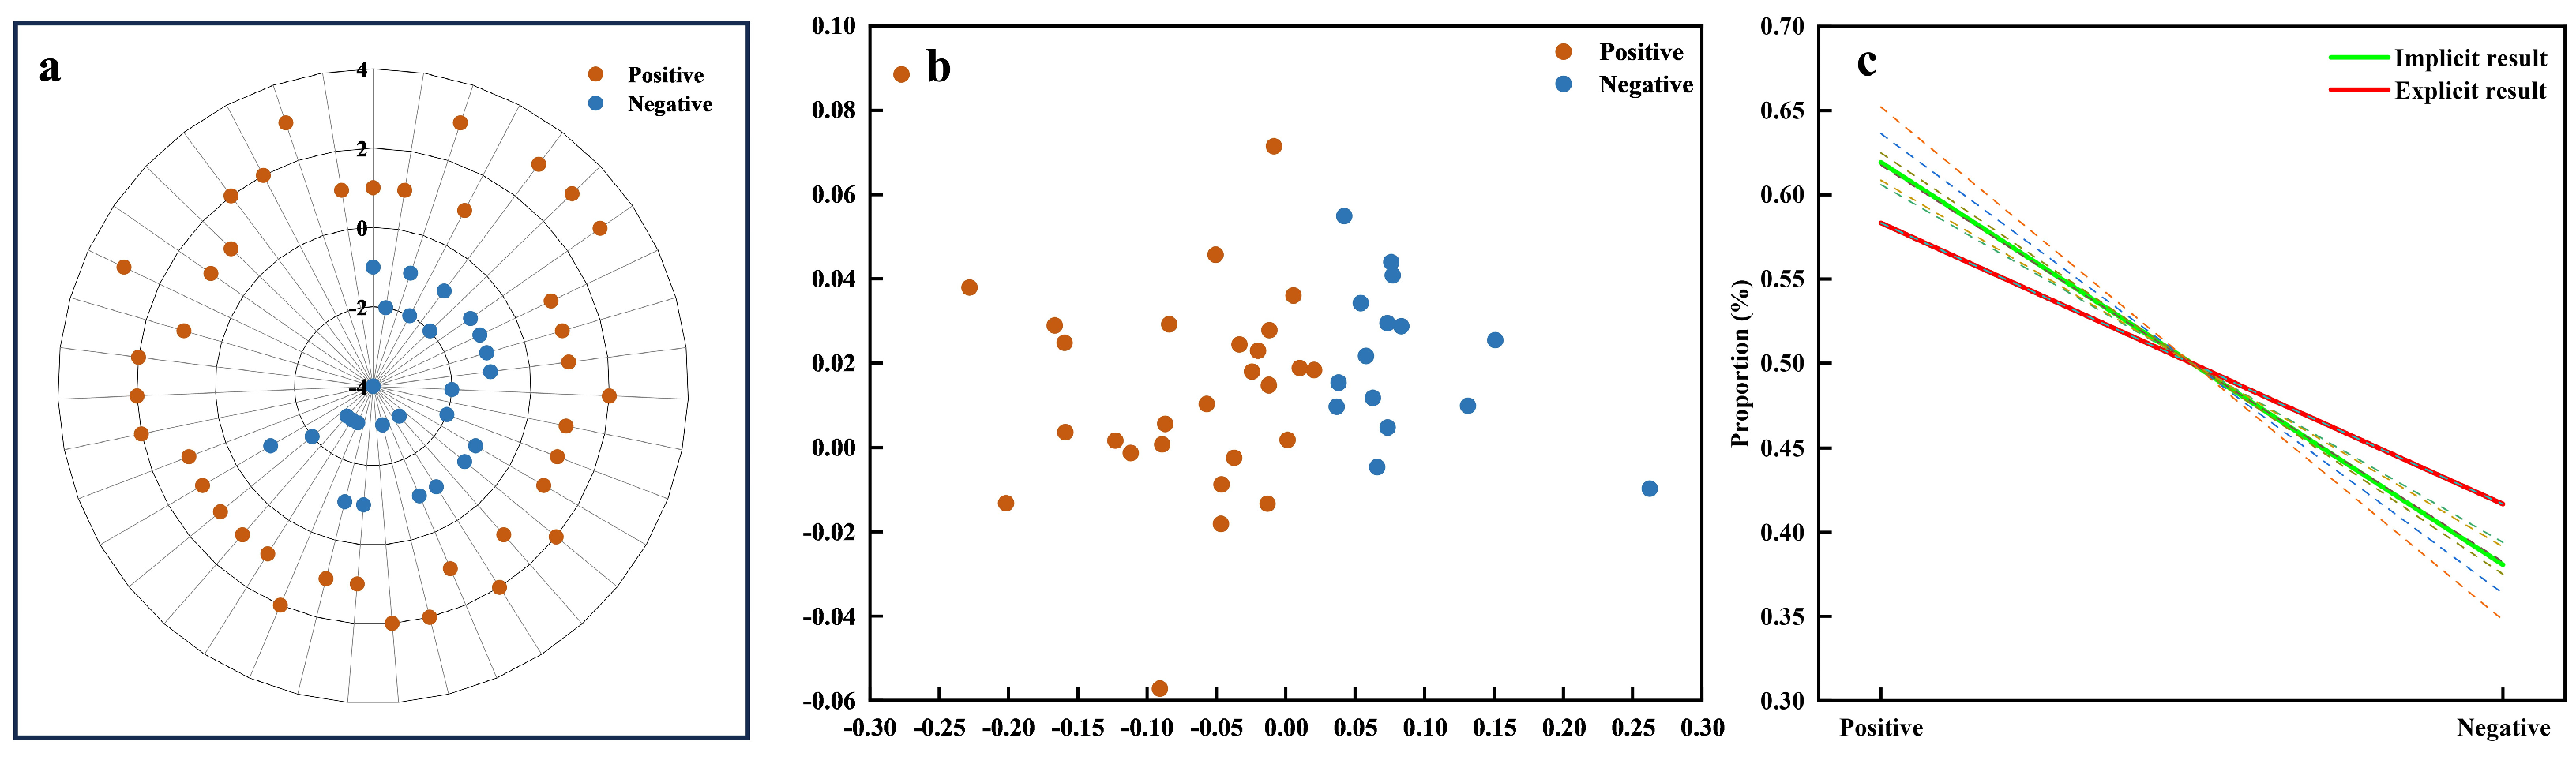
The assessment of the resulting consistency between explicit and implicit measures of affective value is illustrated in Figure 9. In the explicit data, the affective value evaluations were manually categorized into two groups: positive and negative affective value, as shown in Figure 9a. Similarly, the implicit data were clustered using unsupervised K-means clustering (k = 2), revealing two distinct clusters that correspond to positive and negative affective values (Figure 9b). These clusters were labeled based on the predominant feature attribute within each group. A negative correlation between the POC and affective value was observed, suggesting that more negative affective evaluations were more consistently identified across both explicit and implicit measures (Figure 9c). The dashed lines represent the individual regression curves for each feature subset (based on clustering results), which were then analyzed using a mixed-effects model to derive the composite regression curve (green solid line). In the regression curves, ya2 = −0.2386x + 0.8579 (green) represents the regression line from the implicit data (based on K-means clustering), while the red dashed line yb2 = −0.16666x + 0.7499 (red) corresponds to the regression line from the explicit data, both reflecting the relationship between affective value (x) and the POC (y). The composite similarity index of 0.8887 further emphasizes the substantial alignment between the explicit and implicit data models, demonstrating that both models consistently capture the relationship between affective value and the POC.
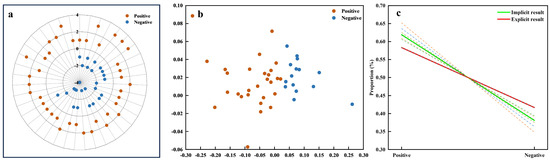
Figure 9.
Result consistency for affective value. (a) Radar plot of explicit data clusters. (b) Scatter plot of implicit data clusters. (c) Regression curves for POC (Proportion of Consistency) analysis comparing implicit (green) and explicit (red) results, with dashed lines representing variations across different feature datasets.
4. Discussion
This research investigates the feasibility of using fNIRS implicit measurement methodologies to evaluate the intensity and affective value of sweetness, and examines their association with explicit measurement. Our findings reveal that varying concentrations of sweetness evoke significant activation within specific cerebral regions, with higher concentrations eliciting more pronounced neural responses. Additionally, a positive correlation is observed between sweetness concentration and the accuracy of decoding sweetness information. Furthermore, analysis of affective value indicates that positive affective value exhibits greater discernibility, contrasting with the relationship observed with sweetness intensity. Correlation analysis suggests a degree of coherence between fNIRS implicit measurements and explicit self-report techniques, particularly in capturing certain aspects of sweetness perception and its affective evaluation.
4.1. Effectiveness and Feasibility of fNIRS in Sweetness Perception Research
4.1.1. Neural Activation Patterns
The activation analysis in this study revealed that different sucrose concentrations elicited significant neural activations in specific brain regions, particularly within the prefrontal cortex. These findings are consistent with previous research demonstrating the involvement of the prefrontal cortex in response to sweetness stimuli [10,22]. Specifically, varying sucrose concentrations primarily activated the dorsolateral prefrontal cortex (dlPFC). The dlPFC is known for its involvement in working memory [34], attention to diverse information types [35], the integration of multiple cognitive demands [36], and response choice [37]. However, the observed activation may not be related to general attention processes, since the activation of the dorsolateral prefrontal cortex was specifically caused by stimulation with a single sweet substance. The stimulus was limited to a single basic taste (sweetness), and participants only needed to taste and rate it, without the need for selecting preferences or integrating multiple gustatory stimuli. Therefore, the observed dlPFC activation is likely attributable to working memory [38] demands associated with rating taste intensity rather than integrating multiple cognitive tasks. The dlPFC’s involvement in working memory suggests that it plays a crucial role in the cognitive evaluation of taste intensity, supporting the idea that the observed activations are specifically related to processing sweetness intensity rather than general attentional or integrative functions.
In the analysis of affective value, positive affective responses were primarily associated with significant activation in the right lateral orbitofrontal cortex (OFC), whereas negative affective responses involved activations in the left lateral OFC and the left ventrolateral prefrontal cortex. These results align with prior studies highlighting the OFC’s critical role in encoding subjective affective experiences and reward value [10,39,40]. The lateral OFC has been implicated in processing pleasantness and reward evaluation, while the ventrolateral prefrontal cortex is associated with processing negative emotions and inhibitory control.
These findings provide supplementary evidence supporting the significant association between the OFC and subjective affective responses to taste stimuli. The ability to detect specific neural activation patterns associated with sweet perception using fNIRS-based implicit measurement techniques underscores the effectiveness and feasibility of fNIRS in studying taste perception.
4.1.2. Decoding Accuracy and Classification
The cross-subject group model based on fNIRS data achieved a decoding accuracy of 72.15% when distinguishing between positive and negative affective values, which exceeded the chance level. This demonstrates the effectiveness of using fNIRS data to decode affective responses to sweetness. The higher accuracy for positive affective value suggests that neural responses to pleasant stimuli are more consistent and distinguishable than those to unpleasant stimuli, which may be more variable due to the complexity of negative emotions (e.g., disgust, disappointment). For sweetness intensity, the decoding accuracy, while moderate at 50%, was still above the chance level expected for a three-class classification. This indicates that while fNIRS can capture neural differences associated with varying sweetness levels, achieving accurate classification based solely on fNIRS data presents challenges. Contributing factors may include individual variability in taste perception, overlapping neural activations for different sweetness levels, and the inherent limitations of fNIRS technology.
Advancements in fNIRS data analysis techniques, including the development of more sensitive multivariable decoding analyses, aim to unveil highly reproducible brain activity patterns across various conditions. These advancements address the impact of subjective factors and participant variability commonly encountered in traditional research [41,42]. The findings of this study demonstrate that multivariable decoding analysis can effectively extract detailed information about differences in sweetness intensity and affective value.
Overall, the results underscore the feasibility of fNIRS technology in taste perception research and highlight its potential as an objective tool for taste assessment. By capturing neural activations associated with both the intensity and the affective value of sweetness, fNIRS provides valuable insights into the neural mechanisms underlying taste perception. Despite the moderate decoding accuracy for sweetness intensity, the ability to exceed chance levels indicates that fNIRS can detect meaningful neural patterns related to taste stimuli.
4.2. Correlation and Complementarity Between Implicit and Explicit Measures
Building upon the established efficacy of fNIRS technology in detecting neural patterns related to sweet taste perception, we explored the relationship between implicit neural responses and explicit self-reported measures of sweetness intensity and affective value. This investigation aimed to understand how these two methodologies correlate and complement each other in capturing the multifaceted experience of sweetness.
This research revealed that while there are weak correlations between explicit and implicit measures at the feature level, these methods capture different, yet complementary aspects of sweetness perception. Specifically, explicit measures reflect conscious evaluations that can be influenced by personal biases, social desirability, and introspective limitations, whereas implicit measures using fNIRS offer a deeper understanding by capturing neural responses that may be beyond conscious awareness. This finding aligns with previous research, which emphasizes the value of combining implicit and explicit measures for a more comprehensive understanding of sensory perception [43,44].
For sweetness intensity, a moderate positive correlation was observed between the sample entropy feature from fNIRS data and explicit intensity ratings. Sample entropy reflects the complexity and irregularity of neural activity, suggesting that higher perceived sweetness intensity is associated with more complex neural responses [45]. This indicates that implicit measures can capture the nuanced neural dynamics underlying intensity perception, offering a deeper understanding beyond conscious evaluations [46]. In terms of affective value, while most fNIRS features showed weak correlations with explicit affective ratings, the sample entropy feature again demonstrated a moderate positive correlation. Additionally, the left slope feature exhibited a weak negative correlation with explicit affective evaluations. The left slope represents the rate of change in neural activity, with steeper negative slopes indicating faster decreases in oxyhemoglobin concentration, potentially reflecting less pleasant emotional responses. These results suggest that implicit measures capture physiological indicators related to emotional processing, which may not be fully captured through self-report data [8,43].
Our results are consistent with those of Mehta et al., who reported weak to moderate correlations between explicit and implicit emotional responses during product tasting. Using a nine-point hedonic scale for explicit ratings and facial expression analysis for implicit responses, they found correlation coefficients of r = −0.33 and r = −0.38, respectively. These findings align with our observation that implicit measures can provide additional insights into emotional responses that are not fully captured by self-reports [47]. Similarly, Danner et al. studied consumer responses to various juices and found moderate correlations between self-reported liking and implicit physiological measures, with correlation coefficients of r = 0.45 for skin conductance level (SCL) and r = 0.38 for pulse volume amplitude (PVA). Their results suggest that, while self-reports capture overall liking, implicit measures can detect physiological responses not fully reflected in explicit ratings. Our findings are in line with these observations, suggesting that implicit measures, such as fNIRS, can reveal the complexity of neural responses to sweetness intensity beyond what is captured by self-reports [48]. Moreover, Irene et al. investigated the relationship between explicit sensory judgments and implicit EEG measures during beer tasting. They found strong correlations between self-reports and EEG measures for expert beer tasters (r = 0.67), with weaker correlations for non-experts (r = 0.45). This highlights the role of expertise in aligning explicit and implicit measures and supports our view that fNIRS provides complementary insights into the neural dynamics underlying sensory perception [43]. The generally weak correlations highlight that these methodologies tap into different dimensions of sweetness perception. Explicit measures reflect conscious evaluations influenced by personal biases, social desirability, and limited introspective access [49]. In contrast, implicit measures via fNIRS capture subconscious neural processes and physiological responses that participants may not be fully aware of or able to articulate [12]. This divergence underscores the complexity of taste perception, involving both conscious and unconscious components.
Furthermore, the consistency analyses demonstrated alignment between explicit and implicit measures at the model level. A positive correlation was found between the probability of correct classification (POC) and sweetness intensity across both manual segmentation and unsupervised clustering models. This indicates that higher concentrations of sweetness are more easily decoded, which is consistent with previous research. Studies have shown that an increased taste stimulus concentration leads to increased neural response amplitude, which supports the idea that higher concentrations of stimuli are more readily processed and perceived [50,51]. Similarly, a negative correlation between the POC and affective value suggests that positive emotions are more readily decoded than negative emotions, aligning with our results and those of prior studies indicating that positive affective responses elicit more consistent and distinguishable neural patterns [52,53]. The high composite similarity index between clustering results indicates strong alignment between explicit and implicit data in categorizing affective responses. These findings emphasize that while implicit and explicit measures capture different aspects of sweetness perception, their complementarity enhances our overall understanding of how sweetness is processed and evaluated.
4.3. Implications for Future Research
While this study provides valuable insights, several limitations should be considered.
The relatively small and homogeneous sample may not fully represent the general population. Additionally, the sucrose concentrations and sample size were influenced by prior studies. This exploratory study aimed to validate the use of fNIRS for measuring sensory and affective responses, but future research will expand the sample size, include a more diverse population, and explore a broader range of sucrose concentrations for enhanced generalizability. The limited depth penetration of fNIRS may have impeded the detection of neural activations in deeper brain regions. Moreover, the moderate decoding accuracy for sweetness intensity highlights the challenges in classifying sweetness levels using fNIRS data alone. Future studies could improve decoding accuracy by integrating advanced systems with higher spatial resolution and combining fNIRS with other neuroimaging techniques like EEG or fMRI for more comprehensive data.
In addition, while the results of this study were based on a homogeneous sample, external validation using independent datasets is crucial to confirm the robustness and generalizability of our findings. Future research will apply these methods to independent datasets and perform cross-validation to test the broader applicability of our methodology across different populations and experimental conditions.
To address these limitations, future research could consider expanding the sample size and diversity by recruiting a larger, more varied participant pool to enhance generalizability. Improving the fNIRS methodology through the use of advanced systems with higher spatial resolution and better depth penetration, implementing sophisticated preprocessing methods to reduce artifacts and noise, and integrating fNIRS with other neuroimaging techniques like EEG or fMRI for complementary data could enhance data quality. Enhancing decoding accuracy is another crucial area for future work. Employing advanced machine learning algorithms and developing individualized decoding models may improve classification performance, allowing for more precise interpretation of neural responses to sweetness.
Practical applications of this research include developing products that optimize sweetness levels while considering health implications, and studying taste perception in clinical populations to inform interventions and therapies. By addressing these limitations and pursuing these future directions, researchers can enhance the understanding of sweetness perception and the utility of fNIRS technology in sensory neuroscience. An integrated approach combining methodological applications, diverse participant samples, and multidisciplinary perspectives will contribute to more effective strategies for studying and influencing taste perception.
5. Conclusions
In this study, the sweetness perception was investigated by using both explicit self-report measurement and implicit fNIRS measurement. The results reveal distinct activation patterns in brain regions associated with sweetness intensity and affective value, particularly noting heightened responses with increasing sucrose concentrations. Multivariate decoding accurately identifies sweetness intensity and affective value, highlighting its potential as a reliable tool for objective taste assessment. Moreover, the findings underscore the complementary nature of implicit and explicit measurement techniques in capturing different aspects of taste perception. While implicit measures provide finer insights into neural responses and physiological indicators, explicit measures offer subjective evaluations and personal preferences. The consistency analysis further corroborates the complementary relationship between these measurement methods, emphasizing the importance of considering both in understanding subjective experiences like sweet taste perception comprehensively. Overall, this research advances our understanding of the neural underpinnings of sweet taste perception and highlights the potential of fNIRS technology as an objective tool for taste assessment. By elucidating the complex interplay between neural responses and subjective evaluations, this study contributes to the broader field of sensory neuroscience and offers valuable insights for future research in taste perception.
Supplementary Materials
The following supporting information can be downloaded at: https://www.mdpi.com/article/10.3390/chemosensors13020036/s1, Figure S1: Overview of the taste solution delivery apparatus setup; Figure S2: Hardware configuration of the taste solution delivery apparatus; Figure S3: Software control panel of the tasty apparatus; explanation of the modified Beer–Lambert Law (MBLL); mathematical definitions and calculations of features; Figure S4: Correlation coefficients between explicit and implicit measures of sweetness intensity across various features; Figure S5: Correlation coefficients between explicit and implicit measures of affective value across various features.
Author Contributions
Conceptualization, J.M. and Z.W.; methodology, J.M., S.L. and Z.W.; software, J.M.; validation, J.M.; formal analysis, J.M.; investigation, S.L.; resources, Z.W. and Y.S.; data curation, J.M.; writing—original draft preparation, J.M.; writing—review and editing, S.L., Z.W. and Y.S.; visualization, J.M.; supervision, Z.W. and Y.S.; project administration, Z.W.; funding acquisition, Z.W. and Y.S. All authors have read and agreed to the published version of the manuscript.
Funding
This research was funded by the National Natural Science Foundation of China [grant number 31972200].
Institutional Review Board Statement
Not applicable.
Informed Consent Statement
All procedures performed in this study involving human participants were in accordance with the Medical Ethics Committee in the School of Medicine of Zhejiang University, and with the 1964 Helsinki declaration and its later amendments or comparable ethical standards. Informed consent was obtained from all participants included in the study. Each participant was informed about the nature of the study and the use of functional near-infrared spectroscopy (fNIRS) technology in the non-invasive monitoring of brain activity. All collected data were confidentially handled and securely stored according to the guidelines provided by the ethics committee.
Data Availability Statement
Data are available from the authors upon reasonable request.
Acknowledgments
We would like to thank Jinyang Zhang and Haonan Lin for their assistance with data collection and analysis, which contributed to the completion of this research.
Conflicts of Interest
The authors declare no conflicts of interest.
References
- Grunert, K.G.; Seo, H.-S.; Fang, D.; Hogan, V.J.; Nayga, R.M., Jr. Sustainability Information, Taste Perception and Willingness to Pay: The Case of Bird-Friendly Coffee. Food Qual. Prefer. 2024, 115, 105124. [Google Scholar] [CrossRef]
- Yeung, A.W.K.; Goto, T.K.; Leung, W.K. Affective Value, Intensity and Quality of Liquid Tastants/Food Discernment in the Human Brain: An Activation Likelihood Estimation Meta-Analysis. NeuroImage 2018, 169, 189–199. [Google Scholar] [CrossRef]
- Habara, M.; Horiguchi, T. Impact of Coffee Roasting and Grind Size on Acidity and Bitterness: Sensory Evaluation Using Electronic Tongue. Chemosensors 2024, 12, 196. [Google Scholar] [CrossRef]
- Coricelli, C.; Foroni, F.; Osimo, S.A.; Rumiati, R.I. Implicit and Explicit Evaluations of Foods: The Natural and Transformed Dimension. Food Qual. Prefer. 2019, 73, 143–153. [Google Scholar] [CrossRef]
- Galler, M.; Grendstad, Å.R.; Ares, G.; Varela, P. Capturing Food-Elicited Emotions: Facial Decoding of Children’s Implicit and Explicit Responses to Tasted Samples. Food Qual. Prefer. 2022, 99, 104551. [Google Scholar] [CrossRef]
- Kytö, E.; Bult, H.; Aarts, E.; Wegman, J.; Ruijschop, R.M.A.J.; Mustonen, S. Comparison of Explicit vs. Implicit Measurements in Predicting Food Purchases. Food Qual. Prefer. 2019, 78, 103733. [Google Scholar] [CrossRef]
- Weerawarna, N.R.P.M.; Godfrey, A.J.R.; Loudon, M.; Foster, M.; Hort, J. Comparing Traditional Check-All-That-Apply (CATA) and Implicit Response Time Go/No-Go Approaches for Profiling Consumer Emotional Response When Tasting Food. Food Qual. Prefer. 2023, 112, 105027. [Google Scholar] [CrossRef]
- de Wijk, R.A.; Noldus, L.P.J.J. Using Implicit Rather than Explicit Measures of Emotions. Food Qual. Prefer. 2021, 92, 104125. [Google Scholar] [CrossRef]
- Niedziela, M.M.; Ambroze, K. The Future of Consumer Neuroscience in Food Research. Food Qual. Prefer. 2021, 92, 104124. [Google Scholar] [CrossRef]
- Chikazoe, J.; Lee, D.H.; Kriegeskorte, N.; Anderson, A.K. Distinct Representations of Basic Taste Qualities in Human Gustatory Cortex. Nat. Commun. 2019, 10, 1048. [Google Scholar] [CrossRef]
- Crouzet, S.M.; Busch, N.A.; Ohla, K. Taste Quality Decoding Parallels Taste Sensations. Curr. Biol. 2015, 25, 890–896. [Google Scholar] [CrossRef] [PubMed]
- Zhao, Q.; Ye, Z.; Deng, Y.; Chen, J.; Chen, J.; Liu, D.; Ye, X.; Cheng, H. An Advance in Novel Intelligent Sensory Technologies: From an Implicit-tracking Perspective of Food Perception. Compr. Rev. Food Sci. Food Saf. 2024, 23, e13327. [Google Scholar] [CrossRef]
- Funane, T.; Kiguchi, M.; Atsumori, H.; Sato, H.; Kubota, K.; Koizumi, H. Synchronous Activity of Two People’s Prefrontal Cortices during a Cooperative Task Measured by Simultaneous near-Infrared Spectroscopy. J. Biomed. Opt. 2011, 16, 077011. [Google Scholar] [CrossRef] [PubMed]
- Cui, X.; Bryant, D.M.; Reiss, A.L. NIRS-Based Hyperscanning Reveals Increased Interpersonal Coherence in Superior Frontal Cortex during Cooperation. NeuroImage 2012, 59, 2430–2437. [Google Scholar] [CrossRef]
- Scholkmann, F.; Kleiser, S.; Metz, A.J.; Zimmermann, R.; Mata Pavia, J.; Wolf, U.; Wolf, M. A Review on Continuous Wave Functional Near-Infrared Spectroscopy and Imaging Instrumentation and Methodology. NeuroImage 2014, 85, 6–27. [Google Scholar] [CrossRef] [PubMed]
- Zeng, T.; Peru, D.; Maloney, V.P.; Najafizadeh, L. Cortical Activity Changes as Related to Oral Irritation-an fNIRS Study. In Proceedings of the 2017 39th Annual International Conference of the IEEE Engineering in Medicine and Biology Society (EMBC), Seogwipo, Repbulic of Korea, 11–15 July 2017; pp. 2558–2561. [Google Scholar]
- Chapman, J.; Elbourne, A.; Truong, V.K.; Newman, L.; Gangadoo, S.; Rajapaksha Pathirannahalage, P.; Cheeseman, S.; Cozzolino, D. Sensomics-From Conventional to Functional NIR Spectroscopy-Shining Light over the Aroma and Taste of Foods. Trends Food Sci. Technol. 2019, 91, 274–281. [Google Scholar] [CrossRef]
- Laves, K.; Mehlhose, C.; Risius, A. Sensory Measurements of Taste: Aiming to Visualize Sensory Differences in Taste Perception by Consumers—An Experiential fNIRS Approach. J. Int. Food Agribus. Mark. 2023, 35, 582–602. [Google Scholar] [CrossRef]
- Meyerding, S.G.H.; He, X.; Bauer, A. Neuronal Correlates of Basic Taste Perception and Hedonic Evaluation Using Functional Near-Infrared Spectroscopy (fNIRS). Appl. Food Res. 2024, 4, 100477. [Google Scholar] [CrossRef]
- Minematsu, Y.; Ueji, K.; Yamamoto, T. Activity of Frontal Pole Cortex Reflecting Hedonic Tone of Food and Drink: fNIRS Study in Humans. Sci. Rep. 2018, 8, 16197. [Google Scholar] [CrossRef] [PubMed]
- Yeung, A.W.K.; Goto, T.K.; Leung, W.K. Basic Taste Processing Recruits Bilateral Anteroventral and Middle Dorsal Insulae: An Activation Likelihood Estimation Meta-analysis of fMRI Studies. Brain Behav. 2017, 7, e00655. [Google Scholar] [CrossRef] [PubMed]
- Avery, J.A.; Liu, A.G.; Ingeholm, J.E.; Riddell, C.D.; Gotts, S.J.; Martin, A. Taste Quality Representation in the Human Brain. J. Neurosci. 2020, 40, 1042–1052. [Google Scholar] [CrossRef] [PubMed]
- Ye, Z.; Ai, T.; Wu, X.; Onodera, T.; Ikezaki, H.; Toko, K. Elucidation of Response Mechanism of a Potentiometric Sweetness Sensor with a Lipid/Polymer Membrane for Uncharged Sweeteners. Chemosensors 2022, 10, 166. [Google Scholar] [CrossRef]
- Da Costa Arca, V.; Peres, A.M.; Machado, A.A.S.C.; Bona, E.; Dias, L.G. Sugars’ Quantifications Using a Potentiometric Electronic Tongue with Cross-Selective Sensors: Influence of an Ionic Background. Chemosensors 2019, 7, 43. [Google Scholar] [CrossRef]
- Veldhuizen, M.G.; Albrecht, J.; Zelano, C.; Boesveldt, S.; Breslin, P.; Lundström, J.N. Identification of Human Gustatory Cortex by Activation Likelihood Estimation. Hum. Brain Mapp. 2011, 32, 2256–2266. [Google Scholar] [CrossRef] [PubMed]
- Dans, P.W.; Foglia, S.D.; Nelson, A.J. Data Processing in Functional Near-Infrared Spectroscopy (fNIRS) Motor Control Research. Brain Sci. 2021, 11, 606. [Google Scholar] [CrossRef] [PubMed]
- Yücel, M.A.; Selb, J.; Cooper, R.J.; Boas, D.A. Targeted Principle Component Analysis: A New Motion Artifact Correction Approach for near-Infrared Spectroscopy. J. Innov. Opt. Health Sci. 2014, 07, 1350066. [Google Scholar] [CrossRef]
- Biscaglia, F.; Caroppo, A.; Prontera, C.T.; Sciurti, E.; Signore, M.A.; Kuznetsova, I.; Leone, A.; Siciliano, P.; Francioso, L. A Comparison between Different Machine Learning Approaches Combined with Anodic Stripping Voltammetry for Copper Ions and pH Detection in Cell Culture Media. Chemosensors 2023, 11, 61. [Google Scholar] [CrossRef]
- Chang, C.-C.; Lin, C.-J. LIBSVM: A Library for Support Vector Machines. ACM Trans. Intell. Syst. Technol 2011, 2, 1–27. [Google Scholar] [CrossRef]
- Liu, J.; Kuang, J.; Zhang, Y.; Chen, Y.; Liu, S.; Li, Y.; Qiao, L.; Wei, Z.; Jiang, S.; Meng, J. Research Progress of Taste Biosensors in Simulating Taste Transduction Mechanism. Chemosensors 2024, 12, 189. [Google Scholar] [CrossRef]
- Li, J.; Streletskaya, N.A.; Gómez, M.I. Does Taste Sensitivity Matter? The Effect of Coffee Sensory Tasting Information and Taste Sensitivity on Consumer Preferences. Food Qual. Prefer. 2019, 71, 447–451. [Google Scholar] [CrossRef]
- Prescott, J. Multisensory Processes in Flavour Perception and Their Influence on Food Choice. Curr. Opin. Food Sci. 2015, 3, 47–52. [Google Scholar] [CrossRef]
- Spinelli, S.; Pierguidi, L.; Gavazzi, G.; Dinnella, C.; De Toffoli, A.; Prescott, J.; Monteleone, E. Skin Conductance Responses to Oral Stimuli: The Role of Taste Quality and Intensity, and Personality Traits. Food Qual. Prefer. 2023, 109, 104917. [Google Scholar] [CrossRef]
- Fuster, J.M.; Alexander, G.E. Neuron Activity Related to Short-Term Memory. Sci. New Ser. 1971, 173, 652–654. [Google Scholar] [CrossRef] [PubMed]
- Petrides, M. Frontal Lobes and Behaviour. Curr. Opin. Neurobiol. 1994, 4, 207–211. [Google Scholar] [CrossRef]
- Duncan, J.; Owen, A.M. Common Regions of the Human Frontal Lobe Recruited by Diverse Cognitive Demands. Trends Neurosci. 2000, 23, 475–483. [Google Scholar] [CrossRef] [PubMed]
- Rowe, J.B.; Toni, I.; Josephs, O.; Frackowiak, R.S.J.; Passingham, R.E. The Prefrontal Cortex: Response Selection or Maintenance Within Working Memory? Science 2000, 288, 1656–1660. [Google Scholar] [CrossRef] [PubMed]
- Goldman-Rakic, P.S. Architecture of the Prefrontal Cortex and the Central Executive. Ann. N. Y. Acad. Sci. 1995, 769, 71–84. [Google Scholar] [CrossRef]
- Kringelbach, M.L. Activation of the Human Orbitofrontal Cortex to a Liquid Food Stimulus Is Correlated with Its Subjective Pleasantness. Cereb. Cortex 2003, 13, 1064–1071. [Google Scholar] [CrossRef]
- Zhu, R.; Feng, C.; Zhang, S.; Mai, X.; Liu, C. Differentiating Guilt and Shame in an Interpersonal Context with Univariate Activation and Multivariate Pattern Analyses. NeuroImage 2019, 186, 476–486. [Google Scholar] [CrossRef]
- Emberson, L.L.; Zinszer, B.D.; Raizada, R.D.S.; Aslin, R.N. Decoding the Infant Mind: Multivariate Pattern Analysis (MVPA) Using fNIRS. PLoS ONE 2017, 12, e0172500. [Google Scholar] [CrossRef]
- Norman, K.A.; Polyn, S.M.; Detre, G.J.; Haxby, J.V. Beyond Mind-Reading: Multi-Voxel Pattern Analysis of fMRI Data. Trends Cogn. Sci. 2006, 10, 424–430. [Google Scholar] [CrossRef] [PubMed]
- Hinojosa-Aguayo, I.; Garcia-Burgos, D.; Catena, A.; González, F. Implicit and Explicit Measures of the Sensory and Hedonic Analysis of Beer: The Role of Tasting Expertise. Food Res. Int. 2022, 152, 110873. [Google Scholar] [CrossRef] [PubMed]
- Brouwer, A.-M.; Hogervorst, M.A.; Van Erp, J.B.F.; Grootjen, M.; Van Dam, E.; Zandstra, E.H. Measuring Cooking Experience Implicitly and Explicitly: Physiology, Facial Expression and Subjective Ratings. Food Qual. Prefer. 2019, 78, 103726. [Google Scholar] [CrossRef]
- Cerf-Ducastel, B.; Haase, L.; Murphy, C. Effect of Magnitude Estimation of Pleasantness and Intensity on fMRI Activation to Taste. Chemosens. Percept. 2012, 5, 100–109. [Google Scholar] [CrossRef]
- Lagast, S.; Gellynck, X.; Schouteten, J.J.; De Herdt, V.; De Steur, H. Consumers’ Emotions Elicited by Food: A Systematic Review of Explicit and Implicit Methods. Trends Food Sci. Technol. 2017, 69, 172–189. [Google Scholar] [CrossRef]
- Mehta, A.; Sharma, C.; Kanala, M.; Thakur, M.; Harrison, R.; Torrico, D.D. Self-Reported Emotions and Facial Expressions on Consumer Acceptability: A Study Using Energy Drinks. Foods 2021, 10, 330. [Google Scholar] [CrossRef]
- Danner, L.; Haindl, S.; Joechl, M.; Duerrschmid, K. Facial Expressions and Autonomous Nervous System Responses Elicited by Tasting Different Juices. Food Res. Int. 2014, 64, 81–90. [Google Scholar] [CrossRef] [PubMed]
- Meyerding, S.G.H.; Mehlhose, C.M. Can Neuromarketing Add Value to the Traditional Marketing Research? An Exemplary Experiment with Functional near-Infrared Spectroscopy (fNIRS). J. Bus. Res. 2020, 107, 172–185. [Google Scholar] [CrossRef]
- Palmer, R.K.; Servant, G. (Eds.) The Pharmacology of Taste; Handbook of Experimental Pharmacology; Springer International Publishing: Cham, Switzerland, 2022; Volume 275, ISBN 978-3-031-06449-4. [Google Scholar]
- Wu, A.; Dvoryanchikov, G.; Pereira, E.; Chaudhari, N.; Roper, S.D. Breadth of Tuning in Taste Afferent Neurons Varies with Stimulus Strength. Nat. Commun. 2015, 6, 8171. [Google Scholar] [CrossRef]
- Li, J.; Zhang, Z.; He, H. Hierarchical Convolutional Neural Networks for EEG-Based Emotion Recognition. Cogn. Comput. 2018, 10, 368–380. [Google Scholar] [CrossRef]
- Zheng, W.-L.; Zhu, J.-Y.; Lu, B.-L. Identifying Stable Patterns over Time for Emotion Recognition from EEG. IEEE Trans. Affect. Comput. 2019, 10, 417–429. [Google Scholar] [CrossRef]


Disclaimer/Publisher’s Note: The statements, opinions and data contained in all publications are solely those of the individual author(s) and contributor(s) and not of MDPI and/or the editor(s). MDPI and/or the editor(s) disclaim responsibility for any injury to people or property resulting from any ideas, methods, instructions or products referred to in the content. |
© 2025 by the authors. Licensee MDPI, Basel, Switzerland. This article is an open access article distributed under the terms and conditions of the Creative Commons Attribution (CC BY) license (https://creativecommons.org/licenses/by/4.0/).