Abstract
As industrial waste gas, nitrogen dioxide (NO2) is a serious hazard to air pollution and human health, and there is a pressing demand for developing high-performance NO2 gas sensors. Tin disulfide (SnS2), a representative two-dimensional metal sulfide characterized by a significant specific surface area, a suitable electron band gap, and an easily tunable layered structure, shows a broad application prospect in gas sensing applications. Nevertheless, SnS2-based gas sensors suffer from poor sensitivity, which seriously hinders their application in room temperature gas sensing. In this study, Ag/SnS2 heterojunction nanomaterials were synthesized by an in situ reduction approach. The findings reveals that the gas-sensitive response of the Ag/SnS2 nanocomposites at room temperature under visible light irradiation can achieve 10.5 to 1 ppm NO2, with a detection limit as low as 200 ppb, which realizes the room-temperature detection of Sub-ppm NO2. Meanwhile, the sensor exhibits good selectivity, reproducibility (cyclic stability > 95%). The improved gas sensitivity of the Ag/SnS2 sensor can be due to the synergistic effect of the carrier separation at the Ag/SnS2 Schottky junction and the localized surface plasmon resonance (LSPR) of Ag nanoparticles. The LSPR effect significantly enhances light absorption and surface-active site density, facilitating trace NO2 detection at room temperature. This study provides the foundation for the subsequent development of room temperature layered metal sulfide gas sensors.
1. Introduction
Nitrogen dioxide (NO2), a noxious and hazardous gas, is prevalent in the environment, mainly stemming from the burning of fossil fuels, like oil, natural gas, and coal, as well as from industrial emissions [1,2]. The 2018 World Health Organization report identified NO2 pollution as a significant threat to human health. When the human body inhales NO2, the gas chemically reacts with tracheal tissue fluid, resulting in damage and corrosion of surface cells [3]. According to the American Industrial Hygiene Association, the safety threshold for long-term human exposure (LTEV) to NO2 is 3 ppm and the short-term exposure threshold (STEV) is 5 ppm [4]. Prolonged exposure to NO2 can strongly irritate the eyes, nose, throat and other parts of the human body, with symptoms such as headaches and pulmonary edema [5,6]. In the environment, excess NO2 can undergo chemical reactions with atmospheric water and oxygen to generate nitric acid, forming nitric acid rain. This acidic precipitation not only erodes soil and damages plant growth but also causes irreversible damage to buildings [7]. Furthermore, the concentration of NO2 in human respiratory gases can be analyzed to assist in the of intestinal and pulmonary diseases. Therefore, the accurate detection and monitoring of NO2 concentrations is of critical importance for public health and environmental preservation.
The predominant NO2 sensors commercially are traditional resistive gas sensors utilizing metal oxide semiconductors as the gas sensitive material. Metal oxide semiconductors typically require operation at temperature exceeding 200 °C [8,9,10]. Prolonged exposure to such high temperature may induce thermal growth of oxide grains, compromising the sensor’s durability. In addition, operating at high temperatures will elevate the sensor’s energy consumption, challenging its integration into portable devices like smart bracelets and mobile devices [11]. Consequently, developing novel gas-sensitive materials capable of detecting NO2 at low or even room temperature has become a critical research focus in advancing NO2 sensor technology. Compared with metal oxide semiconductors, layered metal sulfides typically exhibit effective gas sensing capabilities at lower temperatures, making them promising candidates for NO2 detection at low temperature [8,11,12]. Tin disulfide (SnS2), a typical metal sulfide, exhibits a distinctive two-dimensional layered structure that confers a substantial specific surface area, providing more active sites for the adsorption of NO2 gas molecules. Compare with metal oxides, SnS2 has a larger lattice spacing of 0.59 nm, allowing gas molecules to adsorb and desorb on the surface and inside active lattice sites [13,14]. Furthermore, SnS2 exhibits higher carrier mobility, which can effectively mitigate charge accumulation during the gas-sensing process, enhancing the response of the sensor [15]. Previous studies have shown the potential of SnS2 in low-temperature NO2 detection. But pristine two-dimensional SnS2-based gas sensors still face certain challenges, including high baseline resistance, and inadequate sensitivity at low temperatures, potentially constraining their practical utility in gas sensing applications [16]. Numerous strategies have been explored to improve the NO2 sensing capabilities of SnS2 gas sensors, including morphological tuning, heterojunction construction, and heteroatom doping [17,18,19,20,21]. Most of the approaches focus on enhancing the performance of SnS2-based gas sensors by augmenting active sites through surface regulation.
Research demonstrates that noble metal sensitization has emerged an effective method to enhance gas sensing capabilities [22,23]. Noble metals exhibit superior catalytic properties and conductivity, which markedly improve the conductivity of gas-sensitive materials and reduce sensors’ baseline resistance. Furthermore, noble metals can induce a localized surface plasmon resonance (LSPR) effect under light excitation, and boost light absorption of sensitive materials. This effect facilitates redox reactions between gas molecules and sensitive materials, lowers the working temperature of sensors, and improves gas sensitive performance [24]. In our previous study, Au/SnS2 nanoflowers enhanced the gas sensitivity to 8 ppm NO2 at 100 °C by 1.5 times compared to the unmodified SnS2 [25]. Wang et al. achieved a 1.8-fole increase in gas sensitivity to 2 ppm NO2 at 100 °C by depositing Pt nanoparticles on SnS2 microsphere via an in situ reduction method [26]. Similarly, Guo et al. synthesized Pt/SnS2 nanoflowers using a hydrothermal method, which lowered the optimal operating temperature by 40 °C and improved the response to 30 ppm n-butanol by 3.4 times compared to pure SnS2 [27]. The results indicate that while noble metal modification can enhance the response of gas -sensitive materials, it still relies on high operating temperature, limiting its applicability for room temperature detection.
Recently, photoexcitation, as an alternative to thermal excitation, has become a feasible way to improve the operating characteristics of gas-sensitive materials at room temperature [16,28]. By irradiating the sensitive materials with light of a specific wavelength, photo-generated carriers alter the semiconductor surface’s electronic properties, thereby optimizing the gas sensitivity [29,30]. Hu et al. demonstrated that compared with pure SnS2 nanosheets, the prepared Au/SnS2 nanosheets improved the selectivity of sensors by 130% and exhibited good repeatability under 420 nm light-assisted conditions [31]. Compared to Pt, Au, and Pd, Ag offers the benefits of lower cost and notable improvement of photoelectric performance, making it a common choice for modifying sensitive materials [32,33,34,35]. In photocatalysis, the surface plasmon resonance effect of Ag is more closely aligned with the optical absorption characteristics of SnS2 within a specific wavelength range, effectively expanding the optical response range and promoting the efficient separation and movement of photoinduced charge carriers [24]. Therefore, the synergistic effect of Ag nanoparticle modification and photoexcitation is expected to be a feasible strategy for the NO2 detection of SnS2 nanomaterials at room temperature.
In this work, Ag/SnS2 nanosheets were successfully synthesized via the in situ reduction method. A room-temperature, visible light-assisted Ag/SnS2 gas sensor was developed by combining the electron and chemical properties of Ag with LSPR effect of metal nanoparticles. The fabricated sensor exhibits remarkable sensitivity down to 1 ppm NO2, with a substantially lower baseline resistance compared to pure SnS2. It achieves a response of 10.5 to 1 ppm NO2 and has a detection limit of 200 ppb. The sensor also demonstrates excellent selectivity and long-term stability. Furthermore, the mechanisms of electronic and chemical sensitization, and the LSPR effects of Ag nanoparticles under visible light illumination were discussed in detail.
2. Materials and Methods
2.1. Materials
All chemical reagents were analytical grade without further purification. Thiourea, tin tetrachloride, silver nitrate, trisodium lemon and acetone were purchased from Sinopharm Chemical Reagent Co., Shanghai, China. Ammonia, formaldehyde and benzene were obtained from Aladdin Reagent Co., Shanghai, China. Xylene was provided by Shanghai Lingfeng Chemical Reagent Co., Shanghai, China. NO2 gas was acquired from Changzhou Huayang Gas Co., Ltd., Changzhou, China.
2.1.1. Synthesis
SnS2 nanosheets were produced using a hydrothermal route, as detailed in our previous work [36]. A precursor solution was prepared by dissolving SnCl4·5H2O and thiourea in a 1:3 molar ratio in 30 mL of deionized water under vigorous stirring. The precursor solution was then subjected to a 16 h hydrothermal treatment at 180 °C in a 50 mL reactor. The resulting product was subsequently washed with deionized water and ethanol to eliminate contaminants, followed by vacuum drying at 60 °C for 12 h to yield yellow SnS2 powder.
The synthesis of Ag/SnS2 composite material was carried out as follows. 200 mg of pre-synthesized SnS2 was dispersed in 80 mL of deionized water and sonicated to achieve a homogeneous yellow suspension. To the suspension, 6 mL of 0.1 mol/L AgNO2 solution was gradually introduced under continuous stirring for 30 min, forming a pale-yellow solution. Subsequently, 2 mL of 0.01 mol/L trisodium citrate solution was introduced in a dropwise manner, followed by stirring for an additional 10 min. The mixture was then transferred to a 60 °C water bath and stirred for 20 min. Upon completion, the composite material was washed alternately with deionized water and ethanol, and vacuum-dried at 60 °C for 12 h to obtain the Ag/SnS2 powder. The samples were named Ag/SnS2-1, Ag/SnS2-2, Ag/SnS2-3, and Ag/SnS2-4, corresponding to the addition of 2 mL, 6 mL, 12 mL, and 18 mL of AgNO2 solution, respectively. Figure 1 illustrates the synthetic procedure.
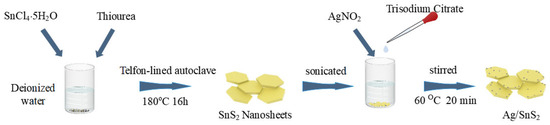
Figure 1.
Illustration of the production process for Ag/SnS2 nanosheets.
2.1.2. Material Characteristics
The crystallinity and phase formation of the samples were examined using Cu Kα radiation in the 10–70° range with a Philips Xpert X-ray diffractometer (XRD) (Malvern Panalytical, Almelo, The Netherlands). For microstructural analysis, Feisirion 200 field emission scanning electron microscope (FSEM) (Thermo Fisher Scientific, Eindhoven, The Netherlands) and FEI Tecnai G2 F20 transmission electron microscope (TEM) (Thermo Fisher Scientific) were utilized to investigate the sample morphologies and elemental distributions. Surface electronic states and chemical compositions were investigated via X-ray photoelectron spectroscopy (XPS, AXIS-ULTRA spectrometer, Al Kα radiation). The binding energies of all elements were calibrated using the C1s peak at approximately 284.8 eV. Furthermore, the absorption spectrum was recorded with a Shimadzu UV-2600 spectrophotometer (Shimadzu Corporation, Kyoto, Japa).
2.2. Sensor Fabrication
The sensor featured an Al2O3 substrate with an effective area of 2.0 cm × 1.0 cm, provided by Changzhou Xintu Technology Co., Ltd. (Changzhou, China). The interdigital electrodes (IDEs) consisted of 8 pairs of Au electrodes with an 10 μm interspacing gap. To activate the sensor, 10 mg of the as-prepared material was uniformly dispersed in 0.5 mL of ethanol to achieve a homogeneous mixture. Subsequently, 20 μL of the dispersion solution was drop-coated onto the sensor’s center, creating a sensitive film on the interdigital electrodes. Lastly, the fabricated sensor was transferred to a drying oven for overnight drying at 60 °C to solidify the sensitive material.
2.3. Sensor Measurement and Testing Methodology
Gas sensing performances were assessed using a self-assembled dynamic test system. A digital multimeter (Keysight 3445A, Keysight Technologies, Santa Rosa, CA, USA) in a two-wire configuration measured the sensor’s dynamic resistance. Throughout the testing procedure, the sensor operated under photo-excitation at room temperature, maintaining a constant LED lamp distance of 0.5 cm above the sensor. The LED light sources emitted wavelengths of red (620 nm), yellow (590 nm), green (530 nm) and blue (460 nm), with light intensity measurements conducted using a photometer. The response of a gas sensor is defined in the following manner:
where represents the baseline resistance in air, and denotes the steady-state resistance in the target gas, respectively.
The response time and recovery time were calculated as the duration needed for the sensor’s resistance to achieve 90% of the total change in resistance.
Throughout the long-term stability evaluation, the same sensor was used and stored in ambient air to closely simulate real-world operating conditions. No pre-treatment or regeneration was performed prior to each measurement cycle. The gas-sensing performance was measured periodically to systematically assess the sensor’s stability and reliability over extended use.
3. Results
3.1. Structural and Morphological Characterization
X-ray diffraction (XRD) analysis, depicted in Figure 2, was employed to investigate the crystal structure and composition of the sensitive material. The XRD spectrum reveals distinct diffraction peaks at 15.1°, 28.2°, 32.2°, and 49.9°, which correspond to the (001), (100), (101), and (110) crystal planes of SnS2 (JCPDS: 23-0677), respectively. The spectra of Ag/SnS2 samples reveal no discernible Ag-related peaks apart from the diffraction peak corresponding to pure SnS2. It could be ascribed to the low Ag concentration and the limited diffraction intensity present in the samples under investigation. Figure 2b shows a slight shift in the diffraction peak at 15.1° in Ag/SnS2 samples compared with pure SnS2. As the Ag doping level increases, the peak gradually shifts toward lower angles, indicating lattice expansion of the SnS2 crystal. This expansion may result from local tensile stress induced by Ag doping or from interstitial incorporation of Ag atoms into the SnS2 lattice [33]. It suggests the possible formation of a metal–semiconductor Schottky heterojunction between Ag and SnS2. Notably, the XRD spectrum does not exhibit any discernible impurity peaks, confirming the absence of extraneous impurities in the synthesized sample.
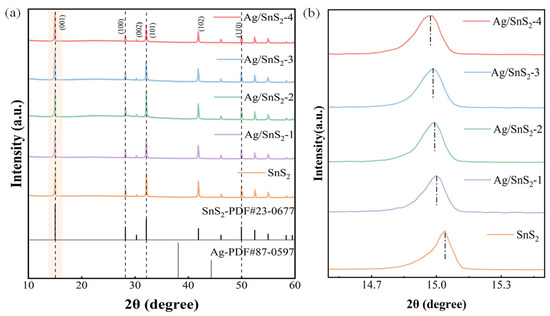
Figure 2.
(a) XRD patterns of pure SnS2 and Ag/SnS2 composites (Ag/SnS2-1, Ag/SnS2-2, Ag/SnS2-3 and Ag/SnS2-4), (b) the corresponding enlarged view of the (001) diffraction peak region for each sample.
The surface morphologies of the as-prepared SnS2 and Ag/SnS2-2 were characterized by SEM and TEM measurement in Figure 3 and Figure 4. Figure 3a presents the SEM image of the synthesized SnS2, revealing a nanosheet structure with a characteristic size of approximately 1 μm. Figure 3b shows the morphology of SnS2 after surface modification with Ag nanoparticles. The micrograph indicates that the overall morphology remains largely unchanged following the surface functionalization, retaining its nanoflake structure. TEM was employed to characterize the internal electronic structures of as-synthesized SnS2 and Ag/SnS2 composites. As depicted in Figure 4a,b, the SnS2 material displays a distinct layered morphology, aligning with SEM findings. High-resolution TEM images of SnS2 (Figure 4c) reveals lattice fringes of 0.18 nm and 0.32 nm, which correspond, respectively, to (110) and (100) planes of SnS2 (JCPDS No.22-0951). Figure 4d–f are TEM and HRTEM images of Ag/SnS2 composite. Figure 4d illustrates that the modification of Ag does not alter the morphology of SnS2, with the Ag/SnS2 composite remains the nanosheets nanostructure. In Figure 4e, it is evident reveals that Ag nanoparticles preferentially nucleate and grow at the edges of SnS2 nanosheets. It may be ascribed to the presence of high-energy defects along the edges of the SnS2 nanosheets, which serve as preferential nucleation sites for the Ag nanoparticles. Figure 4f further illustrates that the Ag nanoparticles (highlighted by yellow circles) have an average size of around 3 nm and a lattice spacing of 0.238 nm, corresponding to the (111) crystal plane of Ag. The EDS spectrum of the Ag/SnS2 heterostructure (Figure 4g,h) confirms the presence of Sn, S, and Ag elements, with the Ag weight percentage estimated to be around 2.79%. Additionally, the atomic ratio of S to Sn is determined to be 1.60:1.
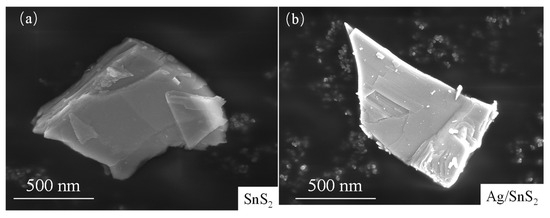
Figure 3.
SEM images of (a) SnS2 and (b) Ag/SnS2-2 composite.
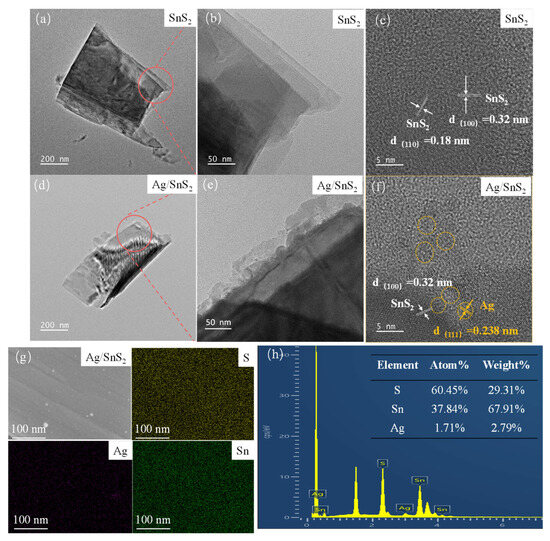
Figure 4.
TEM and HRTEM images of (a–c) SnS2, and (d–f) Ag/SnS2-2 heterojunction samples. (g,h) energy-dispersive X-ray spectroscopy mappings of the Ag/SnS2-2 sample.
X-ray photoelectron spectroscopy (XPS) was employed to investigate the chemical composition and elemental states of the SnS2 and Ag/SnS2-2 heterostructure. The C1s peak at 284.8 eV served as a reference for peak calibration. The high-resolution spectrum of Sn 3d in Figure 5a exhibits distinct peaks at 486.5 and 495 eV, corresponding to Sn 3d3/2 and Sn 3d5/2 states of Sn4+, respectively [25,37]. Notably, with the modification of Ag, the two characteristic peaks undergo a noticeable shift towards the high binding energies. This shift is indicative of changes in the chemical environment of tin ions, possibly attributed to the integration of Ag into the SnS2 lattice. Furthermore, the high-resolution S 2p spectrum in Figure 5b reveals peaks at 163.14 eV (S 2p1/2) and 161.91 eV (S 2p3/2), which also experience a shift towards the lower energies upon Ag doping [38]. This phenomenon suggests a modification in the electronic structure of sulfur ions, likely influenced by the presence of Ag within the SnS2 [39]. The XPS peaks corresponding to tin (Sn) and sulfur (S) suggest that the modification of Ag nanoparticles changes the binding energies of Sn and S. This modification induces surface detects, thereby promoting the formation of sulfur vacancies. Figure 5c presents the high-resolution Ag 3d spectrum, revealing prominent peaks at 368.1 eV and 374.1 eV, which are attributed to the binding energies of Ag 3d3/2 and Ag 3d5/2, respectively [33,40]. The observed 6.0 eV energy splitting between these peaks is characteristic of metallic Ag, indicating the successful incorporation of Ag species within the Ag/SnS2-2 composites [41].
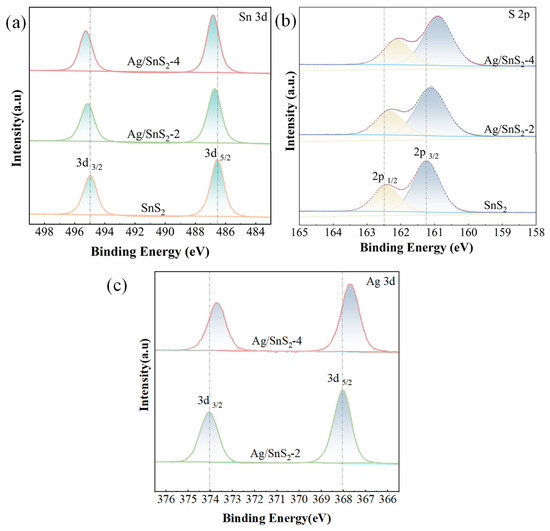
Figure 5.
XPS spectra of (a) Sn 3d, (b) S 2p and (c) Ag 3d for SnS2, Ag/SnS2 samples (Ag/SnS2-2 and Ag/SnS2-4).
The optical properties of SnS2 and Ag/SnS2 were investigated through UV-vis spectroscopy. For comparative analysis, the absorption spectra of both SnS2 and Ag/SnS2 were normalized, as depicted in Figure 6a. As shown in the set of Figure 6a, the pure SnS2 sample exhibits a broad absorption range from 400 nm to 700 nm in the visible light spectrum. Benefiting from the local surface plasmon resonance (LSPR) of the noble metal Ag, the Ag/SnS2 sample exhibits enhanced light absorption across nearly the entire visible spectrum, with peak enhancement around 530 nm. The band gaps (Eg) of the samples were determined using the Tauc method, and the corresponding Tauc plots are presented in Figure 6b. As shown, the band gaps of SnS2 and Ag/SnS2 were 2.38 eV and 2.28 eV, respectively. The band gap of SnS2 decreased after surface modification with the noble metal Ag, which can be attributed to the strong electronic interaction between Ag nanoparticles and SnS2 nanosheets (known as strong metal–support interaction) [42]. The narrower bandgap of the Ag/SnS2 composite facilitates the generation of a greater number of photo-induced charge carriers under illumination [43]. Efficient light absorption is essential for enhancing the gas-sensing capabilities of sensor devices, suggesting that the gas response of the Ag/SnS2 composite can be effectively modulated under photoexcitation.
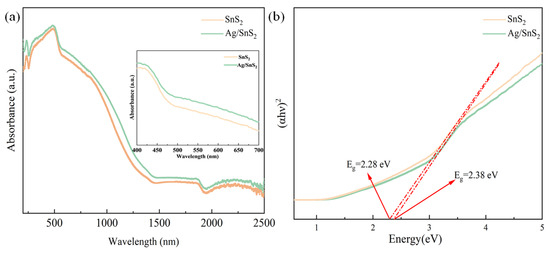
Figure 6.
(a) UV-vis spectra, and (b) Tauc plots of the SnS2, Ag/SnS2 heterojunction samples.
3.2. Gas Sensing Performances
The influence of Ag nanoparticle doping concentration on the NO2 gas-sensing performance of Ag/SnS2 sensors was investigated. Figure 7a,b present the gas response curves and dynamic resistance curves of Ag-doped Ag/SnS2 gas sensors exposed to 1 ppm NO2 under green light illumination at ambient temperature. Figure 7a demonstrates that Ag/SnS2-x gas sensors exhibit enhanced NO2 sensing responses compared to pure SnS2 sensors. The gas-sensing response initially increased with the AgNO3 content, reaching a maximum response at an AgNO3 addition of 6 mL, which identifies Ag/SnS2-2 as the optimal sensor. The sensor exhibits an response of 10.5 to 1 ppm NO2, with its response time and recovery time being 135 s and 267 s, respectively. However, further increases in AgNO3 content led to a decline in gas-sensing performance. The gas response of Ag/SnS2-4 is lower than that of the pristine SnS2 sensor. This reduction can be attributed to the fact that noble metal Ag itself lacks intrinsic gas-sensing activity. With increasing Ag loading, excessive Ag nanoparticles tend to agglomerate on the SnS2 surface, occupying and reducing the number of active adsorption sites available for gas molecules. Furthermore, an excessive amount of Ag may modify the band structure and surface charge distribution of the composite, thereby weakening the synergistic contributions from electronic sensitization and the LSPR effect. The gas-sensing response of the Ag/SnS2-2 sensor to 1 ppm NO2 was 2.3 times greater than that of the pure SnS2 sensor. Subsequent gas-sensing tests were conducted using the Ag/SnS2-2 gas sensor. As shown in Figure 7b, the baseline resistance of the Ag/SnS2 sensor decreased with increasing AgNO3 content. Compared to the pure SnS2 sensor, the baseline resistance of the Ag/SnS2-2 sensor decreased by an order of magnitude. The work function difference between Ag and SnS2 facilitates significant electron transfer, altering the electronic properties of SnS2 and lowering the sensor’s initial resistance. The resistance curves reveal that both pure SnS2 and Ag-doped SnS2-X sensing materials exhibit a marked increase in resistance upon exposure to 1 ppm NO2, followed by a decrease when exposed to air. This behavior confirms that the samples retain n-type semiconductor properties even after doping with Ag nanoparticles.
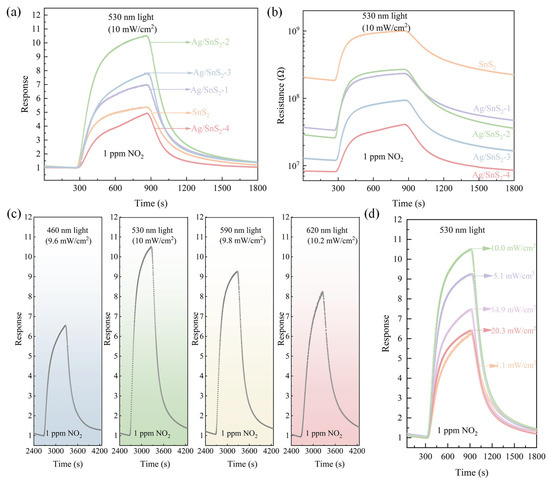
Figure 7.
(a) Response and (b) Dynamic resistance curves of the SnS2 and Ag/SnS2 nanocomposites (Ag/SnS2-1, Ag/SnS2-2, Ag/SnS2-3 and Ag/SnS2-4) to 1 ppm NO2 under green light excitation at room temperature, (c) Dynamic response curves of Ag/SnS2-2 gas sensor to 1 ppm NO2 under light illumination with various light wavelengths, and (d) Response curves of Ag/SnS2-2 gas sensor to 1 ppm NO2 under green light excitation with varying optical power at room temperature.
UV-vis analysis indicates that SnS2 and Ag/SnS2 effectively absorb visible light. The gas-sensing performance of the Ag/SnS2-2 sensor for 1 ppm NO2 was investigated under various visible light conditions, as shown in Figure 7c. The Ag/SnS2 gas sensor exhibited the highest response to 1 ppm NO2 under 530 nm light illumination, which may be attributed to its strongest light absorption at this wavelength. In contrast, under dark conditions, the sensor showed a significantly higher initial resistance and baseline drift. Its response to 1 ppm NO2 was only 3.5, markedly lower than that under visible light excitation, and the recovery process was substantially prolonged, preventing complete recovery (Figure S1). These results indicate that visible light illumination can effectively enhance the room-temperature gas-sensing performance of the Ag/SnS2 sensor toward low-concentration NO2. Light intensity significantly influences the gas-sensing performance of sensors. To determine the optimal optical power, the response of the Ag/SnS2 gas sensor to 1 ppm NO2 was examined at varying optical powers of 530 nm, as illustrated in Figure 7d. It reveals that the sensor’s response initially increases and subsequently decreases with rising optical power. The maximum response at an optical power of 10 mW/cm2 is attributed to the synergistic contribution of photoexcited nonequilibrium carriers and localized surface plasmon resonance (LSPR) on Ag nanoparticles, which facilitate adsorption and desorption of gas molecules (O2, NO2) in different ways. At low light intensities, gas adsorption onto the sensitive material dominates the gas-sensing reaction, thereby enhancing the sensor’s response. As the light intensity increases, the desorption process becomes the predominant factor in the gas-sensing reaction, leading to a decrease in the sensor’s response. In subsequent experiments, a light source with a wavelength of 530 nm and an intensity of 10 mW/cm2 was identified as optimal light source for the Ag/SnS2 sensor.
Figure 8a,b present the gas sensing properties of the Ag/SnS2-2 sensor to NO2 concentrations ranging from 200 ppb to 1 ppm under 530 nm light excitation at room temperature. Upon exposure to 0.2 ppm NO2, the sensor exhibits an obvious change in resistance, achieving a response value of approximately 2.0, suggesting that the sensor exhibits a practical detection limit of 200 ppb (Figure S2). Figure 8b shows the sensor response increases proportionally with NO2 concentration in the range of 0.2–1 ppm, with values of 2.1, 3.1, 4.5, 6.7, 5.4, 6.7, 7.8, 8.7, 8.9, and 10.2. This demonstrates a linear correlation between the Ag/SnS2 sensor’s response and NO2 concentration, described by the equation:
Here, y denotes the device response, and x represents the NO2 concentration (ppm).


Figure 8.
(a) Dynamic sensing response curve and (b) Linear fit of the response of the Ag/SnS2-2 sensor exposed to 0.2–1 ppm NO2 under 530 nm light excitation at room temperature, (c) Response curve of the Ag/SnS2-2 sensor for 10 cycles to 1 ppm NO2 under 530 nm light excitation at RT, (d) Selectivity of Ag/SnS2-2 sensor to 1 ppm NO2 and other gas at 10 ppm, and (e) Long-term stability of Ag/SnS2-2 sensor toward 1 ppm NO2 at RT for 90 days.
With the correlation coefficient R2 of 0.98832 (Inset of Figure 8b), the sensor indicates a better linearity at low NO2 concentration. The theoretical detection limit is estimated to be 23 ppb by the least-squares method, indicating it has great application potential in trace gas detection [44].
Figure 8c shows the sensor’s gas sensing properties to 1 ppm NO2 over 10-cycles gas test under 530 nm light excitation at room temperature. The consistent sensor response across all 10 cycles indicates the Ag/SnS2 sensor possesses outstanding repeatability for NO2 detection at ambient conditions. Selectivity, a crucial performance indicator for gas sensor performance, was evaluated for the Ag/SnS2-2 gas sensor under 530 nm light excitation with various gases, as shown in Figure 8d. The potential interfering gases included Cl2, O3, ethanol (C2H5OH), acetone (CH3COCH3), ammonia (NH3), benzene (C6H6), formaldehyde (CH2O) and methanol (CH3OH). It can be observed that the sensor’s response to NO2 was markedly higher than to other gases at room temperature, which is due to SnS2’s unique surface affinity for NO2 molecules. The findings indicate the sensor’s potential for efficient room-temperature detection of NO2. To assess the long-term stability of the Ag/SnS2-2 sensor, a 3-month gas sensitivity test was conducted, as depicted in Figure 8e. The results indicated an 18% decrease in response value over the testing period, likely attributed to the gradual oxidation of Ag particles on the SnS2 surface forming Ag2O, which diminished the sensor’s gas sensitivity performance. Nevertheless, the Ag/SnS2 composite remains an attractive gas-sensitive material for the development of room-temperature NO2 sensors, exhibiting favorable characteristics such as high sensitivity, repeatability, and selectivity. A comparison of the gas-sensing performance of SnS2-based sensors reported in the recent literature is presented in Table 1. This comparison suggests that Ag/SnS2-based sensors can effectively detect NO2 gas at room temperature under the influence of visible light illumination.

Table 1.
Companion NO2 sensing properties of the Ag/SnS2 sensor with other SnS2-based gas sensors in the literature.
3.3. Sensing Mechanism
As a typical n-type semiconductor metal sulfide, the sensing mechanism of the SnS2-based gas sensor is intricately linked to the electron interaction between the target gas and the material surface during the sensing process [19,48,49]. When exposed to air, oxygen molecules adsorb on the surface of the material’s surface, capturing electrons in its conduction band to create chemisorbed oxygen () (≤100 °C). It results in a reduction in the free electron concentration on the material’s surface, leading to a substantial increase in sensor resistance. The specific redox reaction process can be represented as follows [50]:
When exposed to the oxidizing gas NO2, as illustrated in Equation (6), NO2 gas molecules capture electrons from the SnS2 conduction band. It results in a reduction in the majority carrier (electron) concentration of SnS2, a decrease in conductivity, and an increase in resistance [25].
Even introducing the Ag modification, the sensor retains an n-type response to NO2, indicating that the gas sensitivity is still attributed to SnS2. Due to the disparity in work function between Ag and SnS2, electron transfer occurs between the metal Ag and the SnS2 sensitive material. As the lower work function of SnS2 (4.4 eV) compared to that of Ag (4.74 eV), electrons move from SnS2 to Ag until their Fermi levels align, establishing a Schottky barrier at the interface (Figure 9a,b) [34]. When exposed to NO2 gas, the gas-sensitive material adsorbs NO2 gas molecules, resulting in an increased potential barrier width at the interface, and amplifying the resistance change in the sensor [13,51]. Additionally, due to the spillover effect and catalysis sensitization of noble metals, the incorporation of Ag nanoparticles effectively increases the concentration of surface-active sites [22]. This enhancement promotes the adsorption of gas molecules, thereby further improving the gas-sensing performance of the device [33,34,39].
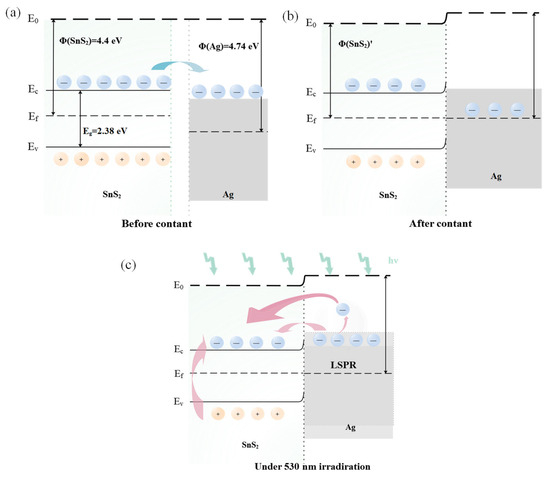
Figure 9.
Energy band diagram of (a) SnS2 before contact with Ag, (b) Ag/SnS2, and (c) Ag/SnS2 under 530 nm light illumination.
The NO2 sensing mechanism of the Ag/SnS2 heterojunction in both dark and under light excitation is illustrated in Figure 10. In the dark, oxygen molecules extract electrons from SnS2, adsorbing on its surface as oxygen ions (). These oxygen ions occupy numerous active sites on the gas materials’ surface (Equation (5)). Upon excitation with visible light at 530 nm wavelengths (photoelectron energy ≈ 2.34 eV > Eg = 2.28 eV), a large number of photogenerated electron-hole pairs are generated within the Ag/SnS2 (Equation (7)) [28]. Due to the surface cleaning effect of the photogenerated holes (), interact with the adsorbed oxygen ions (), facilitating the desorption of the oxygen (Equation (8)). This process decreases the amount of adsorbed oxygen on the surface, increasing the number of active sites and enhancing the sensor’s response to NO2 [16]. On the other hand, the localized surface plasmon resonance (LSPR) effect of Ag nanoparticles enhances the visible light absorption of SnS2, increasing photogenerated carrier concentration. Simultaneously, hot electrons () produced by LSPR excitation are transferred to the surface of SnS2, further elevating electron concentration (Figure 9c) [52]. Both hot electrons () and photogenerated electrons () directly interact with NO2 gas molecules, as depicted in Equations (3) and (4), thereby enhancing the Ag/SnS2 gas-sensing performance [24].
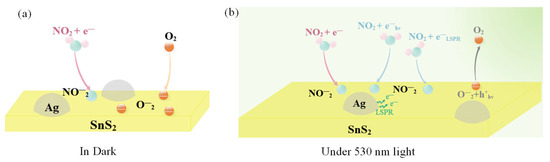
Figure 10.
Schematic illustration of the NO2 gas-sensing mechanism of the Ag/SnS2 nanocomposite (a) in dark and (b) under 530 nm light illumination.
4. Conclusions
The present study reports the successful synthesis of Ag-doped SnS2 nanomaterials via an in situ reduction method. The gas-sensing performance of Ag/SnS2-based sensors towards NO2 was systematically investigated under the combined influence of visible light excitation and the incorporation of noble metal doping. The gas-sensitive response of Ag/SnS2 composites was significantly influenced by the Ag doping concentration and the optical wavelength. At a Ag content of 2.79% by weight, the Ag/SnS2 nanocomposite exhibited the highest gas-sensitive response to 1 ppm NO2 under 530 nm illumination at room temperature, with a response 2.3 times greater than that of the pure material. Furthermore, the sensor demonstrated a detection limit as low as 200 ppb, indicating its ability to detect sub-ppm levels of NO2 at room temperature. The Ag/SnS2 sensor exhibited an 18% decrease in response after a three-month stability test, likely due to the oxidation of Ag nanoparticles in air. Despite this decline, the sensor maintains excellent repeatability, linearity, and high selectivity towards various interfering gases, suggesting its suitability for detecting low concentrations of NO2 at room temperature. The Ag/SnS2 sensor’s superior sensing performance at room temperature is ascribed to the synergistic effects of visible light excitation, noble metal sensitization, and the localized surface plasmon resonance (LSPR) effect. The visible light-assisted Ag/SnS2 gas sensor presented in this study provides a novel technological approach and material solution for the efficient detection of sub-ppm NO2 gas at room temperature.
Supplementary Materials
The following supporting information can be downloaded at: https://www.mdpi.com/article/10.3390/chemosensors13100368/s1, Figure S1. (a) Dynamic resistance curve and (b) Response curve of the Ag/SnS2-2 nanocomposites to 1 ppm NO2 in dark at room temperature. Figure S2. Dynamic resistance curves of the Ag/SnS2-2 nanocomposites to 200 ppb NO2 under green light excitation at room temperature.
Author Contributions
Conceptualization, D.G.; methodology, D.G.; software, D.G.; validation, D.G. and W.L.; formal analysis, D.G.; investigation, J.D.; resources, D.G.; data curation, J.D.; writing—original draft preparation, D.G. and W.L.; writing—review and editing, D.G. and W.L.; visualization, D.G. and W.L.; supervision, X.L. and W.L.; project administration, D.G. and W.L.; funding acquisition, D.G. and W.L. All authors have read and agreed to the published version of the manuscript.
Funding
This work was supported by the Natural Science Foundation of Jiangsu Province (Grant No. BK20220620), the startup Foundation for Introducing Talent of Nanjing University of Information Science and Technology (Grant No. 2023r020).
Institutional Review Board Statement
Not applicable.
Informed Consent Statement
Not applicable.
Data Availability Statement
Data are contained within the article and Supplementary Materials.
Conflicts of Interest
The authors declare no conflicts of interest.
References
- Paraschiv, S.; Barbuta-Misu, N.; Paraschiv, S.L. Influence of NO2, NO and Meteorological Conditions on the Tropospheric O3 Concentration at an Industrial Station. Energy Rep. 2020, 6, 231–236. [Google Scholar] [CrossRef]
- Yuan, Z.; Zhao, Q.; Duan, Z.; Xie, C.; Duan, X.; Li, S.; Ye, Z.; Jiang, Y.; Tai, H. Ag2Te Nanowires for Humidity-Resistant Trace-Level NO2 Detection at Room Temperature. Sens. Actuators B Chem. 2022, 363, 131790. [Google Scholar] [CrossRef]
- Gamon, L.F.; Wille, U. Oxidative Damage of Biomolecules by the Environmental Pollutants NO2• and NO3•. Acc. Chem. Res. 2016, 49, 2136–2145. [Google Scholar] [CrossRef] [PubMed]
- Ambient (Outdoor) Air Pollution. Available online: https://www.who.int/news-room/fact-sheets/detail/ambient-(outdoor)-air-quality-and-health (accessed on 17 July 2025).
- Zheng, X.; Orellano, P.; Lin, H.; Jiang, M.; Guan, W. Short-Term Exposure to Ozone, Nitrogen Dioxide, and Sulphur Dioxide and Emergency Department Visits and Hospital Admissions Due to Asthma: A Systematic Review and Meta-Analysis. Environ. Int. 2021, 150, 106435. [Google Scholar] [CrossRef] [PubMed]
- Kasdagli, M.I.; Orellano, P.; Velasco, R.P.; Samoli, E. Long-term exposure to nitrogen dioxide and ozone and mortality: Update of the WHO air quality guidelines systematic review and meta-analysis. Int. J. Public Health 2024, 69, 1607676. [Google Scholar] [CrossRef]
- Rahimi, N.R.; Azhdarpoor, A.; Fouladi-Fard, R. Exposure to Tropospheric Ozone and NO2 in the Ambient Air of Tehran Metropolis: Spatiotemporal Distribution and Inhalation Health Risk Assessment. Phys. Chem. Earth Parts ABC 2024, 136, 103777. [Google Scholar] [CrossRef]
- Duan, X.; Jiang, Y.; Liu, B.; Duan, Z.; Zhang, Y.; Yuan, Z.; Tai, H. Enhancing the Carbon Dioxide Sensing Performance of LaFeO3 by Co Doping. Sens. Actuators B Chem. 2024, 402, 135136. [Google Scholar] [CrossRef]
- Tang, J.-F.; Fang, C.-C.; Hsu, C.-L. Enhanced Organic Gas Sensor Based on Cerium- and Au-Doped ZnO Nanowires via Low Temperature One-Pot Synthesis. Appl. Surf. Sci. 2023, 613, 156094. [Google Scholar] [CrossRef]
- Najafi, P.; Ghaemi, A. Chemiresistor Gas Sensors: Design, Challenges, and Strategies: A Comprehensive Review. Chem. Eng. J. 2024, 498, 154999. [Google Scholar] [CrossRef]
- Jang, Y.-W.; Jo, J.-W.; Park, S.K.; Kim, J. Room-Temperature Gas Sensors Based on Low-Dimensional Nanomaterials. J. Mater. Chem. C 2024, 12, 18609–18627. [Google Scholar] [CrossRef]
- Wu, R.; Hao, J.; Wang, Y. Recent Advances in Engineering of 2D Layered Metal Chalcogenides for Resistive-Type Gas Sensor. Small 2024, 20, 2404821. [Google Scholar] [CrossRef]
- Guo, J.; Wang, C.; Chang, X.; Zheng, W.; Zhang, J.; Liu, X. Low-Power Optoelectronic NO2 Sensors by Constructing ZnS/SnS2 Heterojunctions. ACS Appl. Electron. Mater. 2025, 7, 3552–3560. [Google Scholar] [CrossRef]
- Mishra, R.K.; Choi, H.J.; Ryu, J.W.; Choi, G.J.; Kumar, V.; Kumar, P.; Singh, J.; Kumar, S.; Gwag, J.S. Recent Progress in Gas Sensing Based on 2D SnS2 and Its Heterostructure Platforms: A Review. Sens. Actuators Phys. 2024, 365, 114860. [Google Scholar] [CrossRef]
- Zhan, S.; Zheng, L.; Xiao, Y.; Zhao, L.-D. Phonon and Carrier Transport Properties in Low-Cost and Environmentally Friendly SnS2: A Promising Thermoelectric Material. Chem. Mater. 2020, 32, 10348–10356. [Google Scholar] [CrossRef]
- Deb, S.; Mondal, A.; Ashok Kumar Reddy, Y. Review on Development of Metal-Oxide and 2-D Material Based Gas Sensors under Light-Activation. Curr. Opin. Solid State Mater. Sci. 2024, 30, 101160. [Google Scholar] [CrossRef]
- Chen, G.-X.; Xie, Z.-M.; Qu, W.-L.; Wang, D.-D.; Zhang, Q.; Zhang, J.-M. First-Principles Study of NO2 Adsorption on Noble Metals Doped SnS2/SnSe2 Heterostructure. Comput. Theor. Chem. 2025, 1245, 115099. [Google Scholar] [CrossRef]
- Lei, Z.; Lin, M.; Zhou, Y.; Huang, C.; Chen, J.; Mao, H.; Cao, J.; Ouyang, X. Glucose-modulated defect-enriched Sv-SnS2 sensor for rapid detection of NH3 at room temperature. J. Alloys Compd. 2025, 1026, 180379. [Google Scholar] [CrossRef]
- Wu, H.; Wang, X.; Chen, Y.; Wang, X. Enhanced Triethylamine-Sensing Characteristics of SnS2/LaFeO3 Composite. Chemosensors 2025, 13, 228. [Google Scholar] [CrossRef]
- Zhang, Y.; Li, Y.; Jiang, Y.; Duan, Z.; Yuan, Z.; Liu, B.; Huang, Q.; Zhao, Q.; Yang, Y.; Tai, H. Synergistic Effect of Charge Transfer and Interlayer Swelling in V2CTx/SnS2 Driving Ultrafast and Highly Sensitive NO2 Detection at Room Temperature. Sens. Actuators B Chem. 2024, 411, 135788. [Google Scholar] [CrossRef]
- Yang, H.; Li, X.; Wu, Q.; Su, H.; Ma, C.; Wang, X.; Xie, C.; Zeng, D. Synergetic Effect of Highly Active Ce Sites and Interlayer Engineering Induced by Ce Doping of SnS2 to Enhance Gas Sensing of NO2. Sens. Actuators B Chem. 2023, 376, 133033. [Google Scholar] [CrossRef]
- Zhu, L.-Y.; Ou, L.-X.; Mao, L.-W.; Wu, X.-Y.; Liu, Y.-P.; Lu, H.-L. Advances in Noble Metal-Decorated Metal Oxide Nanomaterials for Chemiresistive Gas Sensors: Overview. Nano-Micro Lett. 2023, 15, 89. [Google Scholar] [CrossRef]
- Huang, H.; Pan, Z.; Wang, J.; Wang, T.; Yang, W.; Yu, H.; Li, F.; Dong, X.; Yang, Y. Ag nanoparticles sensitized ZnO/MoS2 composites to detect ppb-level NO2 and automobile exhaust gas. Sens. Actuators B Chem. 2025, 433, 137569. [Google Scholar] [CrossRef]
- Sun, Z.; Cao, J.; Wang, S.; Zhang, Z.; Li, J.; Xu, X.; Wang, Y.; Ye, Z.; Zhang, H. LSPR Effect Enabled Ag-TiO2 Nanotube Arrays for High Sensitivity and Selectivity Detection of Acetone under Visible Light. J. Alloys Compd. 2024, 1003, 175533. [Google Scholar] [CrossRef]
- Gu, D.; Liu, W.; Wang, J.; Yu, J.; Zhang, J.; Huang, B.; Rumyantseva, M.N.; Li, X. Au Functionalized SnS2 Nanosheets Based Chemiresistive NO2 Sensors. Chemosensors 2022, 10, 165. [Google Scholar] [CrossRef]
- Wang, C.; Zhang, B.; Zhang, B.; Zhang, Z.; Chen, M.; Zhang, S.; Bala, H.; Zhang, Z. Pt-Modified Nanosheet-Assembled SnS2 Hollow Microspheres for Low Temperature NO2 Sensors. Sens. Actuators B Chem. 2024, 417, 136118. [Google Scholar] [CrossRef]
- Guo, W.; Luo, X.; Zhang, H. SnS2 Microflowers Loaded with Pt Nanoparticles with Electron Sensitization Enhanced N-Butanol Gas Sensitivity at Low Operating Temperature. Inorg. Chem. Commun. 2024, 163, 112348. [Google Scholar] [CrossRef]
- Ganesh Moorthy, S.; Bouvet, M. Effects of Visible Light on Gas Sensors: From Inorganic Resistors to Molecular Material-Based Heterojunctions. Sensors 2024, 24, 1571. [Google Scholar] [CrossRef]
- Lee, D.H.; Yoo, H. Recent Advances in Photo−Activated Chemical Sensors. Sensors 2022, 22, 9228. [Google Scholar] [CrossRef]
- Nasriddinov, A.; Zairov, R.; Rumyantseva, M. Light-Activated Semiconductor Gas Sensors: Pathways to Improve Sensitivity and Reduce Energy Consumption. Front. Chem. 2025, 13, 1538217. [Google Scholar] [CrossRef]
- Hu, J.; Zhang, J.; Liu, X.; Zhang, H.; Xue, X.-X.; Zhang, Y. Highly Selective NO2 Sensor Based on Au/SnS2 Nano-Heterostructures via Visible-Light Modulation. Appl. Surf. Sci. 2023, 623, 157093. [Google Scholar] [CrossRef]
- Qiu, P.; Qin, Y.; Wang, X. S-Vacancies and Ag Nanoparticles in SnS2 Nanoflakes for Ethanol Sensing: A Combined Experimental and Theoretical Investigation. ACS Appl. Nano Mater. 2022, 5, 10839–10847. [Google Scholar] [CrossRef]
- Yang, H.; Du, Z.; Yang, Y.; Li, X.; Wu, Q.; Tang, J.; Wang, X.; Zeng, D. Ag Intercalated SnS2 with S Vacancy and Expanded Interlayer for Enhancing NO2 Sensing. Sens. Actuators B Chem. 2023, 393, 134140. [Google Scholar] [CrossRef]
- Zhang, B.; Zhang, Z.; Wang, C.; Zhang, B.; Zhang, S.; Luo, N.; Bala, H.; Wang, Y. Ag-Modified SnS2/SnO2 Nanoheterojunctions for Low-Temperature NO2 Sensing. ACS Appl. Nano Mater. 2024, 7, 28457–28465. [Google Scholar] [CrossRef]
- Wang, S.; Shi, X.; Fang, N.; Ma, H.; Wang, J. Dual Effects of Ag Doping and S Vacancies on H2 Detection Using SnS2-Based Photo-Induced Gas Sensor at Room Temperature. Materials 2025, 18, 2687. [Google Scholar] [CrossRef]
- Gu, D.; Chen, J.; Liu, W. Visible-Light Modulated Nanostructured SnS/SnS2 Heterojunctions for Room Temperature Ppb-Level NO2 Gas Sensor. ACS Appl. Nano Mater. 2025, 8, 14342–14353. [Google Scholar] [CrossRef]
- Zhang, M.; Li, Z.; Tang, T.; Ou, R.; Zhang, B.Y.; Ma, Q.; Cheng, Y.F.; Liang, Y.; Zhuang, J.H.; Zhang, W.J.; et al. Plasmonic Au-Enabled Photo enhanced Room Temperature NO2 Sensing of 2D SnS2-Heterostructure via Single-Step Mechanochemical Synthesis. J. Alloys Compd. 2025, 1010, 177562. [Google Scholar] [CrossRef]
- Meng, L.; Wang, S.; Cao, F.; Tian, W.; Long, R.; Li, L. Doping-Induced Amorphization, Vacancy, and Gradient Energy Band in SnS2 Nanosheet Arrays for Improved Photoelectrochemical Water Splitting. Angew. Chem. Int. Ed. 2019, 58, 6761–6765. [Google Scholar] [CrossRef]
- Yang, H.; Du, Z.; Yang, Y.; Wu, Q.; Ma, C.; Su, H.; Wang, X.; Zeng, D. Ce–Ag Active Bimetallic Pairs in Two-Dimensional SnS2 for Enhancing NO2 Sensing. ACS Sens. 2024, 9, 283–291. [Google Scholar] [CrossRef]
- Cui, J.; Hu, C.; Yang, Y.; Wu, Y.; Yang, L.; Wang, Y.; Liu, Y.; Jiang, Z. Facile Fabrication of Carbonaceous Nanospheres Loaded with Silver Nanoparticles as Antibacterial Materials. J. Mater. Chem. 2012, 22, 8121–8126. [Google Scholar] [CrossRef]
- Yang, J.; Sun, L.; Hui, S.; Zhang, P.; Li, J.; Wang, D.; Wang, X.; Jiang, S. Ag Functionalized SnS2 with Enhanced Photothermal Activity for Safe and Efficient Wound Disinfection. Biomater. Sci. 2021, 9, 4728–4736. [Google Scholar] [CrossRef]
- Liu, J. Advanced Electron Microscopy of Metal–Support Interactions in Supported Metal Catalysts. ChemCatChem 2011, 3, 934–948. [Google Scholar] [CrossRef]
- Liu, D.; Tang, Z.; Zhang, Z. Visible Light Assisted Room-Temperature NO2 Gas Sensor Based on Hollow SnO2@SnS2 Nanostructures. Sens. Actuators B Chem. 2020, 324, 128754. [Google Scholar] [CrossRef]
- Liu, W.; Gu, D.; Li, X. AuPt Bimetal-Functionalized SnSe2 Microflower-Based Sensors for Detecting Sub-Ppm NO2 at Low Temperatures. ACS Appl. Mater. Interfaces 2021, 13, 20336–20348. [Google Scholar] [CrossRef] [PubMed]
- Huang, Y.; Jiao, W.; Chu, Z.; Wang, S.; Chen, L.; Nie, X.; Wang, R.; He, X. High Sensitivity, Humidity-Independent, Flexible NO2 and NH3 Gas Sensors Based on SnS2 Hybrid Functional Graphene Ink. ACS Appl. Mater. Interfaces 2020, 12, 997–1004. [Google Scholar] [CrossRef]
- Wu, R.; Yan, K.; Zhao, J.; Cai, Z.; Jian, S.; Qiu, L. 2D/2D SnS2/SnSe2 van Der Waals Heterostructure for Highly Sensitive Room-Temperature NO2 Sensor: Key Role of Interface Contact. Chem. Eng. J. 2023, 466, 143369. [Google Scholar] [CrossRef]
- Zhou, J.; Xue, K.; Liu, Y.; Liang, T.; Zhang, P.; Zhang, X.; Dai, Z. Highly Sensitive NO2 Response and Abnormal P-N Sensing Transition with Ultrathin Mo-Doped SnS2 Nanosheets. Chem. Eng. J. 2021, 420, 127572. [Google Scholar] [CrossRef]
- Yang, W.; Gan, L.; Li, H.; Zhai, T. Two-Dimensional Layered Nanomaterials for Gas-Sensing Applications. Inorg. Chem. Front. 2016, 3, 433–451. [Google Scholar] [CrossRef]
- Zhang, Q.; Ma, S.; Zhang, R.; Zhu, K.; Tie, Y.; Pei, S. Optimization NH3 Sensing Performance Manifested by Gas Sensor Based on Pr-SnS2/ZnS Hierarchical Nanoflowers. J. Alloys Compd. 2019, 807, 151650. [Google Scholar] [CrossRef]
- Sun, Q.; Li, Y.; Hao, J.; Zheng, S.; Zhang, T.; Wang, T.; Wu, R.; Fang, H.; Wang, Y. Increased Active Sites and Charge Transfer in the SnS2/TiO2 Heterostructure for Visible-Light-Assisted NO2 Sensing. ACS Appl. Mater. Interfaces 2021, 13, 54152–54161. [Google Scholar] [CrossRef]
- Kim, Y.; Park, B. Photo-Persistent Effect-Induced Energy Band Bending at the TiO2/Ag Nanoparticle Surface Plasmonic Interface. Mater. Lett. 2022, 316, 132001. [Google Scholar] [CrossRef]
- Sun, Y.; Hu, J.; Zhang, Y. Visible Light Assisted Trace Gaseous NO2 Sensor with Anti-Humidity Ability via LSPR Enhancement Effect. Sens. Actuators B Chem. 2022, 367, 132032. [Google Scholar] [CrossRef]


Disclaimer/Publisher’s Note: The statements, opinions and data contained in all publications are solely those of the individual author(s) and contributor(s) and not of MDPI and/or the editor(s). MDPI and/or the editor(s) disclaim responsibility for any injury to people or property resulting from any ideas, methods, instructions or products referred to in the content. |
© 2025 by the authors. Licensee MDPI, Basel, Switzerland. This article is an open access article distributed under the terms and conditions of the Creative Commons Attribution (CC BY) license (https://creativecommons.org/licenses/by/4.0/).