Abstract
The synergistic combination of bismuth and its compounds with the exceptional properties of single-walled carbon nanotubes (SWCNT) was investigated as a sensing platform for the sensitive detection of gallic acid and as a standard for the determination of total phenol. Four bismuth-based electrodes were used for this purpose: SWCNT with bismuth (SWCNT/Bi) or bismuth (III) oxide (SWCNT/Bi2O3) and bismuth or bismuth (III) oxide electrodeposited on a glassy carbon electrode (ELF/Bi and ELF/Bi2O3), which were morphologically characterized by scanning electron microscopy. Cyclic voltammetry in phosphate electrolyte at different pH values revealed that the SWCNT/Bi2O3 electrode exhibited optimal performance for the analytical determination of gallic acid at pH 3. Surface-active carbon nanotubes facilitate the adsorption and accumulation of gallic acid, while the addition of Bi2O3 improves electron transfer, resulting in a synergistic enhancement of the oxidation signal. Square-wave voltammetry with SWCNT/Bi2O3 electrodes also provided reliable and accurate results and proved to be suitable for the quantitative determination of gallic acid with wide linearity (0.2–80 µM) and sensitivities of 12.5, 2.35, and 0.385 µA µmol−1 dm3 for low, medium, and high concentration ranges, respectively. The limit of detection was 0.06 µmol dm−3. Finally, the electrode was successfully applied for gallic acid determination in various seeds.
1. Introduction
Over the last decade, the scientific community has shown significant interest in the development of non-toxic and environmentally friendly electrodes that can replace the traditional mercury-based or disposable electrodes [1,2]. In this sense, electrodes modified with bismuth or its compounds have shown exceptional potential for electroanalytical applications as they are low toxicity, form a homogeneous film on various substrates, and can operate in a wide potential range. Bismuth electrodes and their use for electroanalytical purposes have been known for more than 25 years. The world has recognized bismuth as a new “green” material that is an alternative to mercury electrodes of various types and applications. Currently, there are several groups of scientists worldwide working exclusively on bismuth and its compounds and on the modification of electrodes for the production of sensors for various applications. Švancara and colleagues have provided a comprehensive and detailed insight into the possibilities of using bismuth film electrodes and other Bi-based electrodes for electroanalytical purposes in two reviews [3,4]. These reviews trace the development of bismuth-based electrodes, highlighting key milestones, properties, and their advantages over mercury in stripping analysis. Numerous literature examples, including the authors’ work and summary tables are provided. Combining bismuth with materials such as carbon nanotubes enhances surface area, electron transfer, and detection limits [5,6].
Electroanalytical applications remain the most prominent field, with heavy metal detection via stripping voltammetry dominating the literature. Between 500 and 1000 scientific papers have been published to date, nearly half focusing on heavy metals. Bismuth is valued for its low toxicity and its ability to form alloys with Pb, Cd, Sn, and Zn, enabling sensitive determinations in drinking water, seawater, and river samples [7,8]. In stripping analysis, bismuth films are co-deposited with the target analytes, allowing clear signal separation and achieving sensitivities in the parts-per-billion range. Screen-printed electrodes (SPEs) modified with bismuth serve as effective mercury-free alternatives for polarography [9], immunoassays [10], and environmental monitoring [11,12]. Increasingly, bismuth electrodes are also being used for organic molecules, including amino acids [13,14,15], folic acid [16], phenols, pesticides, and pharmaceuticals [7,17,18]. Bi2O3-modified electrodes, often in combination with carbon nanomaterials, significantly enhance redox kinetics and detection limits, as demonstrated in applications such as paracetamol determination [19] and biosensing for glucose [20] by immobilizing enzymes.
Catalytic applications include electrocatalytic CO2 reduction to formate using Bi nanosheets, ultrathin Bi2O3 layers, defective Bi nanotubes, and doped Bi2O3 nanofibers [21,22,23,24]. Bi2O3-based photocatalysts have also been developed for the efficient degradation of organic pollutants under environmental conditions [25,26]. In rechargeable metal-ion batteries, Bi2O3 acts as a versatile electrode material that can store monovalent, divalent, and trivalent ions. The ultrathin nanosheets produced by hydrothermal synthesis exhibit high specific capacity, fast electron transfer, and a long cycle life. In vanadium redox flow batteries, in situ electrodeposited Bi nanoparticles on graphite improve the kinetics and stability [27]. The supercapacitor applications are emerging, with bismuth/reduced graphene oxide composites and related materials showing potential as high-capacity anodes for supercapacitors and magnesium-ion batteries [28,29]. In fundamental electrochemistry, bismuth-based electrodes are employed to study oxide formation, voltage thresholds, and redox mechanisms, making them valuable in both research and educational contexts. Recent advances in morphology control and functionalization have further improved performance. The use of complexing agents, conductive polymers, metal–organic frameworks (MOFs), and covalent–organic frameworks (COFs) can produce highly ordered, sensitive, and durable films [30]. Surfactants and complexing additives influence the deposition kinetics, yielding dendritic, nanoparticle, nanorod, or flower-like morphologies. Low-temperature electrodeposition from alkaline bismuth tartrate solutions produces stable nanocrystalline Bi2O3 films with favorable electrochemical characteristics [31].
Electrodeposited metals shaped into flower-like or petal structures repeatedly demonstrate improved performance across applications such as electrocatalysis [32], energy storage [33], sensing [34], surface protection, and photocatalysis, primarily due to their high surface area, hierarchical porosity, and efficient charge/mass transfer [35].
Although bismuth-based electrodes have only recently been developed, they are already being used in environmental monitoring, pharmaceutical analysis, catalysis and energy storage. New microsensors and multi-electrode systems enable ultrasensitive, low-cost detection comparable to advanced methods while allowing species identification. Advances in material modification, nanostructuring, and hybrid constructions are expected to further enhance their impact in electrochemistry. In this context, electrochemical analytical methods are becoming increasingly important due to their speed, high sensitivity, low cost, the possibility of miniaturization, and ease of in situ application. Bismuth electrodes are effectively used for the determination of various organic and inorganic analytes, including phenolic acids, where the oxidation of the phenol group occurs at relatively low potentials, allowing selective determination even in the presence of interfering substances [36,37,38]. In a recent study, an α-Bi2O3 MPs/PDA–RGO sensor was developed for the selective detection of trichlorophenol, achieving an LOD of 0.0042 µM. However, this work targets a chlorinated phenolic compound rather than phenolic acids [39]. In the 2024–2025 timeframe, there appears to be no electrochemical sensor specifically designed for phenolic acids using Bi2O3 or SWCNT/Bi2O3. Our work addresses this niche, introducing the first such sensor and offering enhanced analytical performance, broader applicability, and detailed mechanistic insight.
In this research work, special emphasis is placed on the comparison of four types of electrodes: electrodeposited bismuth-film electrode (ELF/Bi), electrodeposited Bi2O3-film electrode (ELF/Bi2O3), bismuth single-wall carbon nanotube electrode (SWCNT/Bi), and Bi2O3 single-wall carbon nanotube electrode (SWCNT/Bi2O3). The micro/nano structure of the bismuth film is not just cosmetic—it controls surface area, adsorption capacity, catalytic activity, electron transfer, and hydrogen evolution, all of which can significantly enhance the electrochemical response for certain analytes. A particularly important contribution to the improvement of electrochemical sensors is the use of CNTs which enables better dispersion of the analytes, higher measurement sensitivity, excellent electrical conductivity and functionalization capability due to their large surface area. The aim is to investigate their efficiency in the electrochemical determination of gallic acid (3,4,5-trihydroxybenzoic acid) with regard to analytical parameters such as sensitivity, selectivity, detection limit, repeatability, and stability. Phenols were chosen as model analytes due to their importance in water quality monitoring and pharmaceutical relevance but also as an electrochemical challenge.
2. Materials and Methods
All chemicals used were of analytical grade and were prepared with redistilled water. All chemicals and reagents used in the synthesis of the materials and the electrochemical experiments were of analytical grade. A 0.1 mol dm−3 phosphate electrolyte solution (PBS) was prepared by mixing appropriate volumes of dibasic and monobasic sodium phosphate. The dibasic sodium phosphate solution (disodium hydrogen phosphate heptahydrate, Na2HPO4 × 7H2O, Kemika d.d., Zagreb, Croatia) was prepared by dissolving 26.8067 g of the salt in 1 L of redistilled water, yielding a 0.1 mol dm−3 solution. Similarly, the monobasic sodium phosphate solution (sodium dihydrogen phosphate monohydrate, NaH2PO4 × H2O, Kemika d.d., Zagreb, Croatia) was prepared by dissolving 13.6985 g of the salt in 1 L of redistilled water to obtain a 0.1 mol dm−3 solution. PBS solutions with different pH values were prepared by adjusting the solution with 0.1 mol dm−3 sodium hydroxide or 0.1 mol dm−3 phosphoric acid (both from Kemika d.d., Zagreb, Croatia) to achieve the desired pH value. The pH of each solution was measured using a digital pH meter (Mettler Toledo FiveEasy, Columbus, OH, USA).
A 0.05 mol dm−3 stock solution of gallic acid (GA, Sigma-Aldrich. St. Louis, MI, USA) was pre-pared fresh daily by dissolving 0.8506 g of GA in 100 mL of redistilled water. All measurements were conducted in solutions previously purged with nitrogen to eliminate dissolved oxygen.
Suspension preparation for drop-cast electrodes: A suspension for drop casting was prepared by dispersing 5 mg of single-walled carbon nanotubes (SWCNTs; diameter ~0.8 nm, w(C) ≥ 93%, Sigma-Aldrich) and 1 mg of Bi or Bi2O3 powder (99.999% trace metal base, Sigma-Aldrich, St. Louis, MI, USA) in 10 mL of dimethylformamide (DMF, Sigma-Aldrich, St. Louis, MI, USA). The mixture was sonicated for 24 h in an ultrasonic bath (Bandelin Sonorex SUPER RK 103 H). Before each drop casting, the suspension was sonicated for an additional 2 h to ensure complete dispersion.
Solutions for electrodeposition of bismuth: bismuth (III) nitrate pentahydrate, (p.a. Bi(NO3)3 × 5H2O, Kemika d.d., Zagreb, Croatia), concentration 0.001 mol dm−3, Ethylenediaminetetraacetic acid, (EDTA, 99.995%, Sigma Aldrich) concentration 0.001 mol dm−3.
Solutions for electrodeposition of bismuth (III) oxide: bismuth (III) nitrate pentahydrate, (p.a. Bi(NO3)3 × 5H2O, Kemika d.d., Zagreb, Croatia), concentration 0.001 mol dm−3, sodium hydroxide (NaOH p.a., Kemika d.d., Zagreb, Croatia), concentration 0.001 mol dm−3.
2.1. Preparation of Electrodes
Prior to modification, a glassy carbon (GC rod, K-type, Sigradur, Germany) electrode with a geometric surface area 0.0314 cm2 was mechanically prepared with fine sand paper (up to 3000 grit) and alumina (1 and 0.05 µm), washed and purified in an ultrasonic bath in redistilled water and ethanol, electrochemically activated in nitric acid (0.5 moldm−3, 20 cycles from −1.0 V to 1.0 V, with a scan rate 100 mVs−1), rinsed in water, and dried with N2. The electrodes were prepared as follows:
- SWCNT—GC: a GC electrode was modified with 15 µL of a drop-cast suspension of SWCNTs (c = 0.5 mg mL−1 in DMF) and dried at 50 °C for 30 min.
- SWCNT/Bi—GC: a GC electrode was modified with 15 µL of a drop-cast suspension containing SWCNTs and Bi.
- SWCNT/Bi2O3—GC: a GC electrode was modified with 15 µL of a drop-cast suspension containing SWCNTs and Bi2O3.
- ELF/Bi—GC: bismuth was electrodeposited on a GC electrode from a solution containing 0.001 mol dm−3 Bi(III) with 0.001 mol dm−3 EDTA as precursor at −0.9 V for 600 s.
- ELF/Bi2O3—GC: Bi2O3 was electrodeposited on a GC electrode at 0.4 V for 600 s from a solution containing 0.001 mol dm−3 Bi(III) in 0.1 mol dm−3 NaOH.
2.2. Real Sample Preparation
The samples selected for the determination of gallic acid were sunflower, linseed, sesame, and chia seeds. All seeds were ground to a size <1 mm. A total of 2 g of the seeds were weighed, poured with 200 mL of distilled water, and transferred to a flask in a microwave reactor, flexiWAVE Milestone, Milestone Inc., Shelton, CT, USA. The parameters for the microwave extraction were optimized according to the procedure described in the paper [40] and selected as follows: 2 min preheating up to a temperature of 100 °C. Microwave extraction was performed for 10 min at 600 W microwave power. The prepared extract of sunflower, linseed, sesame, and chia seeds was filtered and analyzed by spectrophotometric and voltammetric methods.
2.3. Scanning Electron Microscopy for Evaluation of Electrodeposited Film Electrodes
Scanning electron microscopy (SEM)—The surface morphology of the electrodeposited film electrodes was characterized using high-resolution SEM. The analysis was performed with a JEOL JSM-7610F Plus scanning electron microscope, Tokyo, Japan.
2.4. Electrochemical Methods for Preparation and Behavior of Electrodes
All electrochemical experiments were performed with potentiostat in a standard three-electrode cell with a volume of 100 mL. Potentiostat: Autolab PGSTAT 302N, Aurora, CO, USA, with data acquisition and processing software, GPES 4.9 Software (Eco Chemie, Eco Utrecht, The Netherlands) connected to a personal computer. Electrode: Ag/AgCl reference and a coiled platinum wire auxiliary electrode.
2.4.1. Chronoamperometry
Chronoamperometry (CA) was used for preparation of two electrodes: ELF/Bi and ELF/Bi2O3. ELF/Bi—bismuth was electrodeposited from 0.001 mol dm−3 Bi(NO3)3 in an acetate buffer solution, pH 4.5, with the addition of 0.001 mol dm−3 EDTA as a complexing reagent at a potential of −900 mV for 600 s. ELF/Bi2O3-bismuth (III) oxide was electrodeposited from 0.001 mol dm−3 Bi(NO3)3 in 0.1 mol dm−3 NaOH solution at a potential of 400 mV for 600 s. The prepared films were numerically analyzed by Sharifker–Hills models to establish type of nucleation end kinetic parameters.
2.4.2. Cyclic Voltammetry
Cyclic voltammetry (CV) was used for electrochemical characterization of the electrodes in a wide potential range, from −1.0 V to +1.0 V vs. Ag|AgCl. Cyclic voltammograms were recorded to determine the application range of the prepared electrodes at different pH values and to investigate the electrochemical response of gallic acid, to obtain information about the mechanism of GA oxidation. The procedure of all measurements included an equilibration time of 60 s at the potential E = 0.0 V, then in the cathodic direction and back to zero potential and in the anodic direction and back to E = 0.0 V. The influence of pH was investigated in phosphate electrolyte solutions at pH 3, 5, 7, and 9. At a chosen pH 3, different scan rates and concentrations of GA are analyzed at all electrodes to evaluate the reaction and oxidation mechanism of GA. After evaluation of the results, the best electrode is optimized for analytical purposes.
2.4.3. Square Wave Voltammetry for Application in Analytical Purpose
Square wave voltammetry (SWV) also includes several steps. Firstly, optimization of parameters of SWV with regard to the GA oxidation reaction; secondly, the evaluation of method and the accuracy, as well as the real sample analysis. This impulse technique ensures high sensitivity and selectivity by properly optimizing the parameters. The following parameters were selected: accumulation (adsorption) potential Ead = −0.2 V; accumulation time tad = 90 s, of which 30 s without stirring to reach a steady state; frequency, f = 20 Hz; amplitude, ΔEp = 100 mV; and step potential, ΔEs = 10 mV. After the adsorption time, a voltammogram was recorded from the initial potential of −0.2 V in the anodic direction up to 0.9 V. The measured responses are shown as voltammograms corrected for the value of the base current.
2.4.4. Spectrophotometric Measurements
A Cary 4000 UV-VIS spectrophotometer (Agilent Technologies, Santa Clara, CA, USA) was used for the spectrophotometric measurements. Prepared extract of sunflower, linseed, sesame, and chia seeds were diluted so that the results could be read from calibration curves. All determinations were performed in triplicate.
Total phenols were determined using the standard Folin–Ciocalteu (FC) spectrophotometric method with a specific reagent. The Folin–Ciocalteu reagent, a mixture of phosphotungstic and phosphomolybdic acids, reacts with the phenolic compounds in the presence of an alkaline medium, and the color intensity is measured after 2 h. The absorbance measured at 765 nm was converted to the phenol concentration using a mathematical relationship determined with gallic acid solutions of known concentration.
The FRAP (ferric reducing/antioxidant power) method was used to determine the reducing power of the extracts. The reducing power or antioxidant activity is measured at 593 nm after 4- and 10-min addition of the standard reagent, TPTZ (ferric-tripyridyltriazine, Fe3+-TPTZ), in an acidic medium. In reaction with the reducing agent from the sample, the reagent reduces the Fe3+-TPTZ complex to intensely blue ferrous-tripyridyltriazine (Fe2+-TPTZ). The results of the reducing activity of the samples are expressed in µM Fe2+ equivalents [41].
3. Results
3.1. Scaning Electron Microscopy
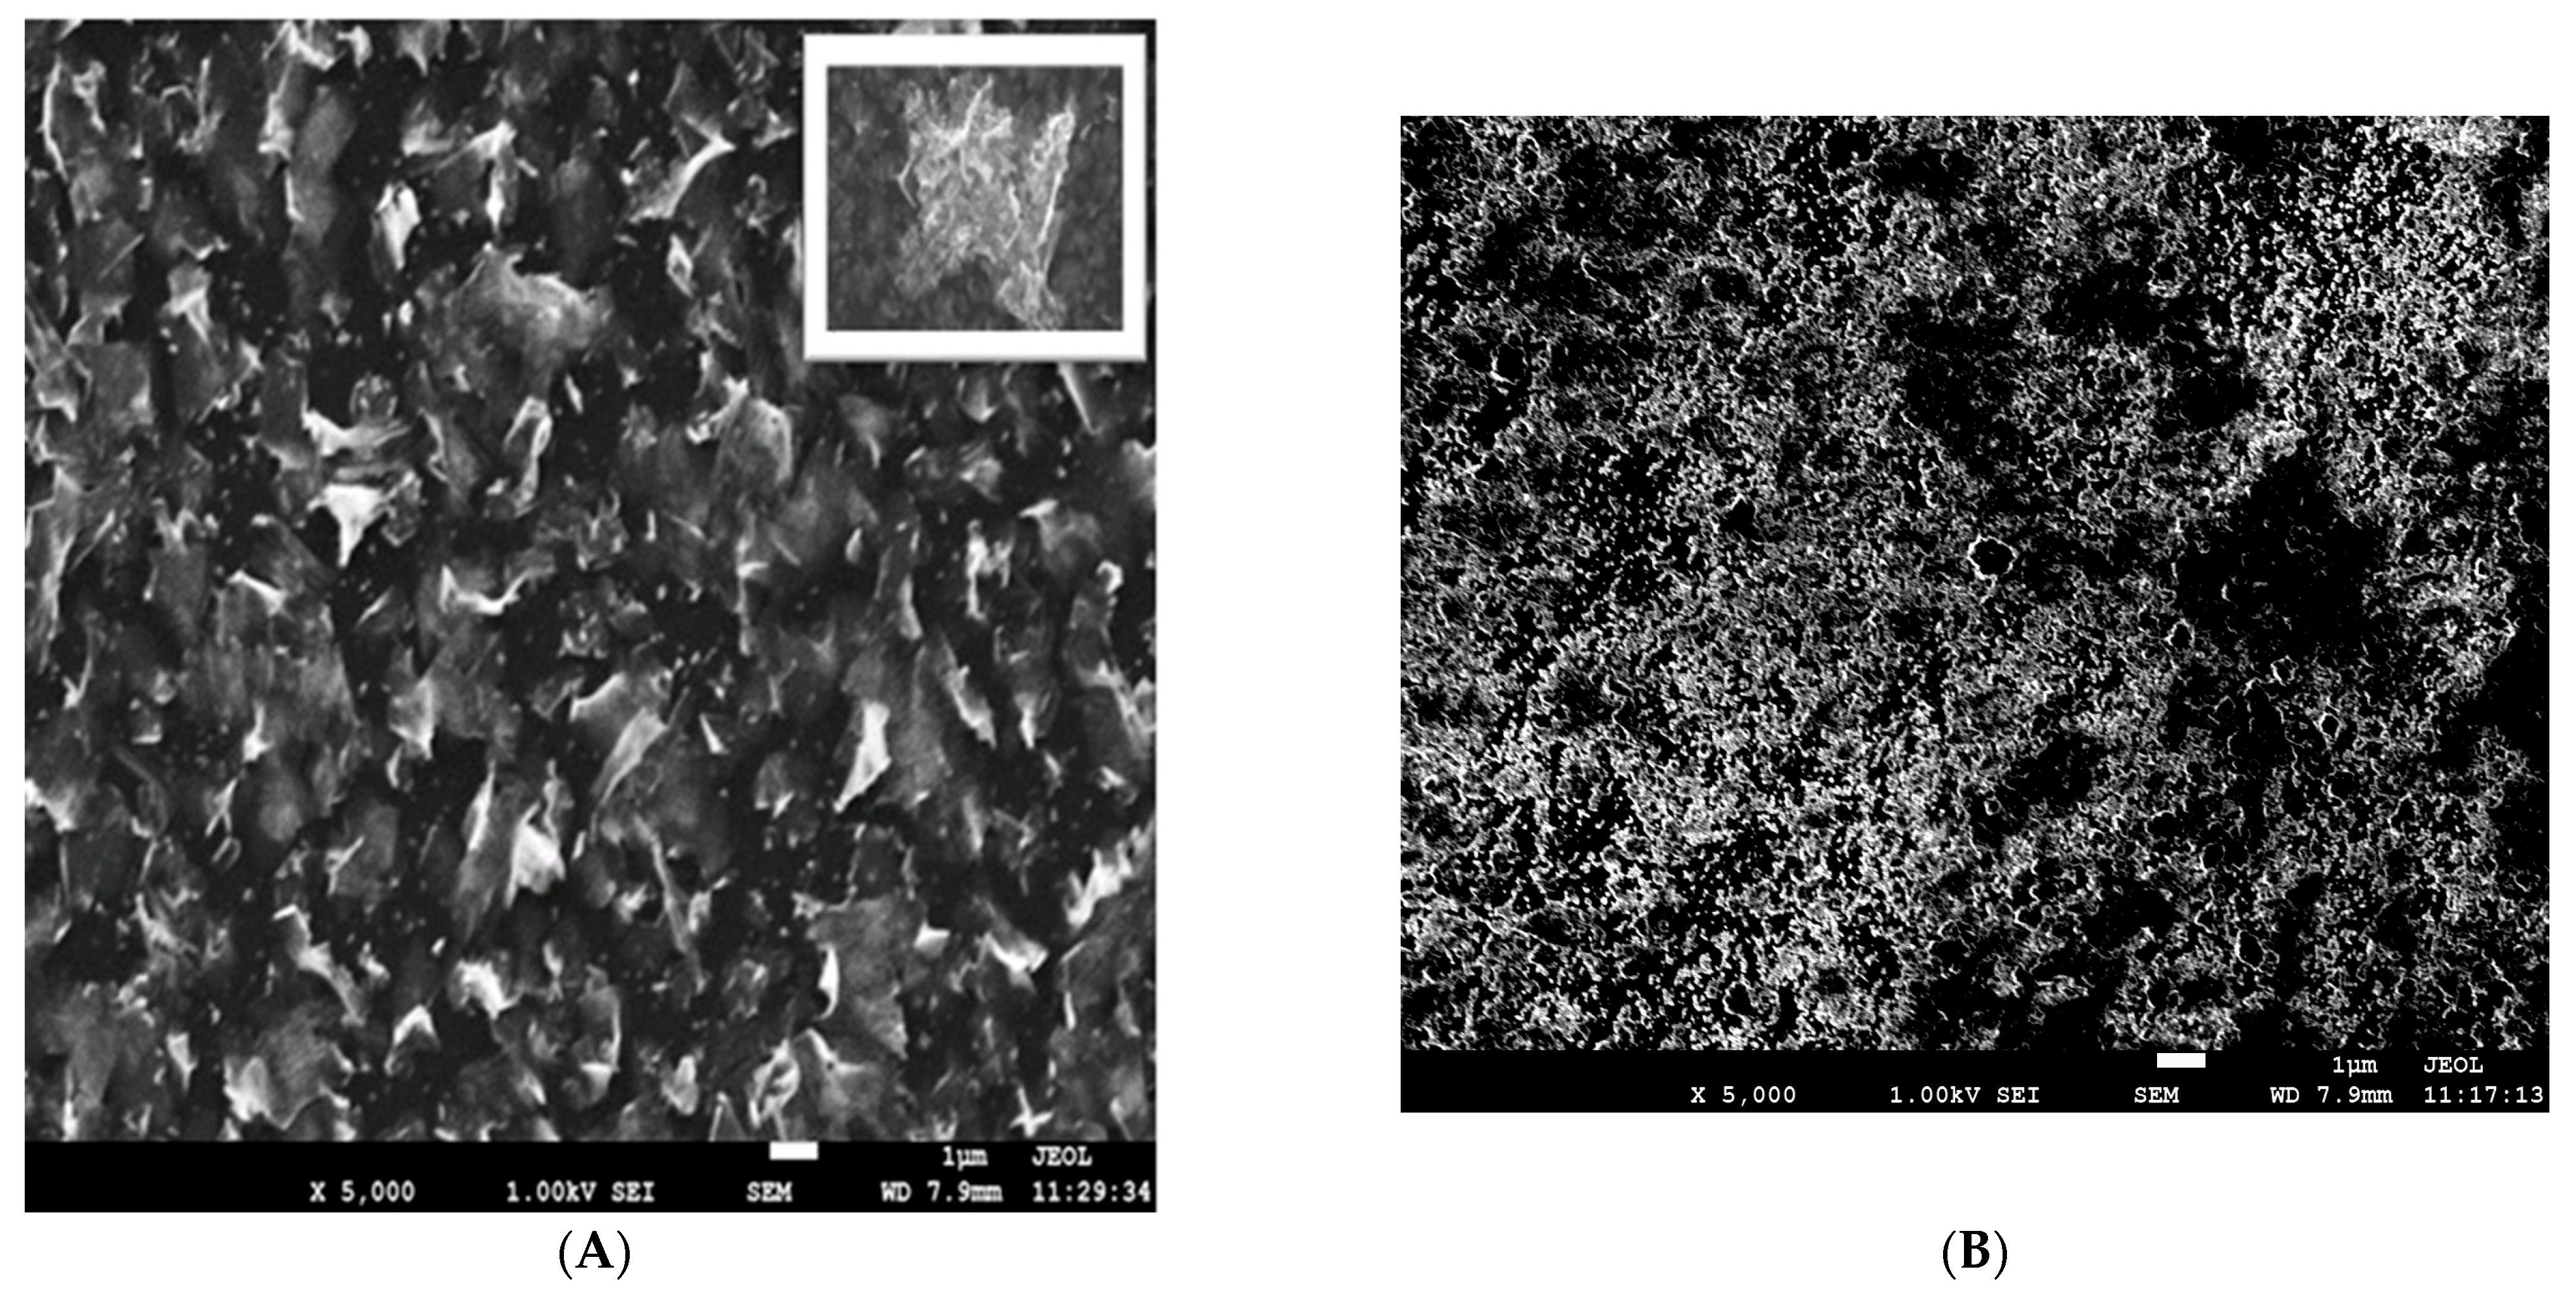
The surface of the electrodeposited ELF/Bi and ELF/Bi2O3 electrodes was characterized using a scanning electron microscope (SEM), and Figure 1 shows SEM images obtained using the upper secondary electron detector in the lens (SEI mode). From the SEM images shown in Figure 1A, it can be observed that the flower petal-like Bi nanostructures exhibit an obviously non-planar and complex surface morphology. They contain various, mostly isolated and irregular morphological low-dimensional forms, mostly randomly deposited petals with dimensions of 1–5 µm in length with thicknesses in the microscopic range.
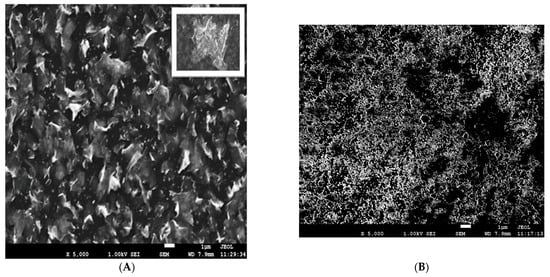
Figure 1.
SEM images of (A)—Bi film electrode (ELF/Bi) and (B)—Bi2O3 film electrode (ELF/Bi2O3).
Also, by examining the entire surface, the appearance of larger diameter dendrites (~10 µm) shown in the section of Figure 1A was observed, which suggest multiple nucleation processes. It can be said that a uniform film with good morphological characteristics was obtained. Thanks to the unique advantages of this morphology (flower-like) and the high density of active sites, the ELF/Bi electrode can be a good new candidate for the next generation of intelligent materials for electroanalytical purposes. Figure 1B on the right presents an overview of a Bi2O3 thin film and shows a fairly uniform distribution of bismuth (III) oxide deposited on the GC electrode. There is a homogeneous morphology, but with cracks in the material. Further research showed that the adhesive properties of the film prepared in this way are poor. The EDS analysis for both modifications confirms the target elements on the surface. According to the EDS results, the mass fraction of Bi on ELF/Bi electrode is 99.90%, while the rest is 0.1 percent carbon. This result speaks in favor of good surface coverage. In the case of the Bi2O3 film, the carbon content is 27%, which confirms cracks in the formed film and poor surface coverage.
3.2. Chronoamperometry
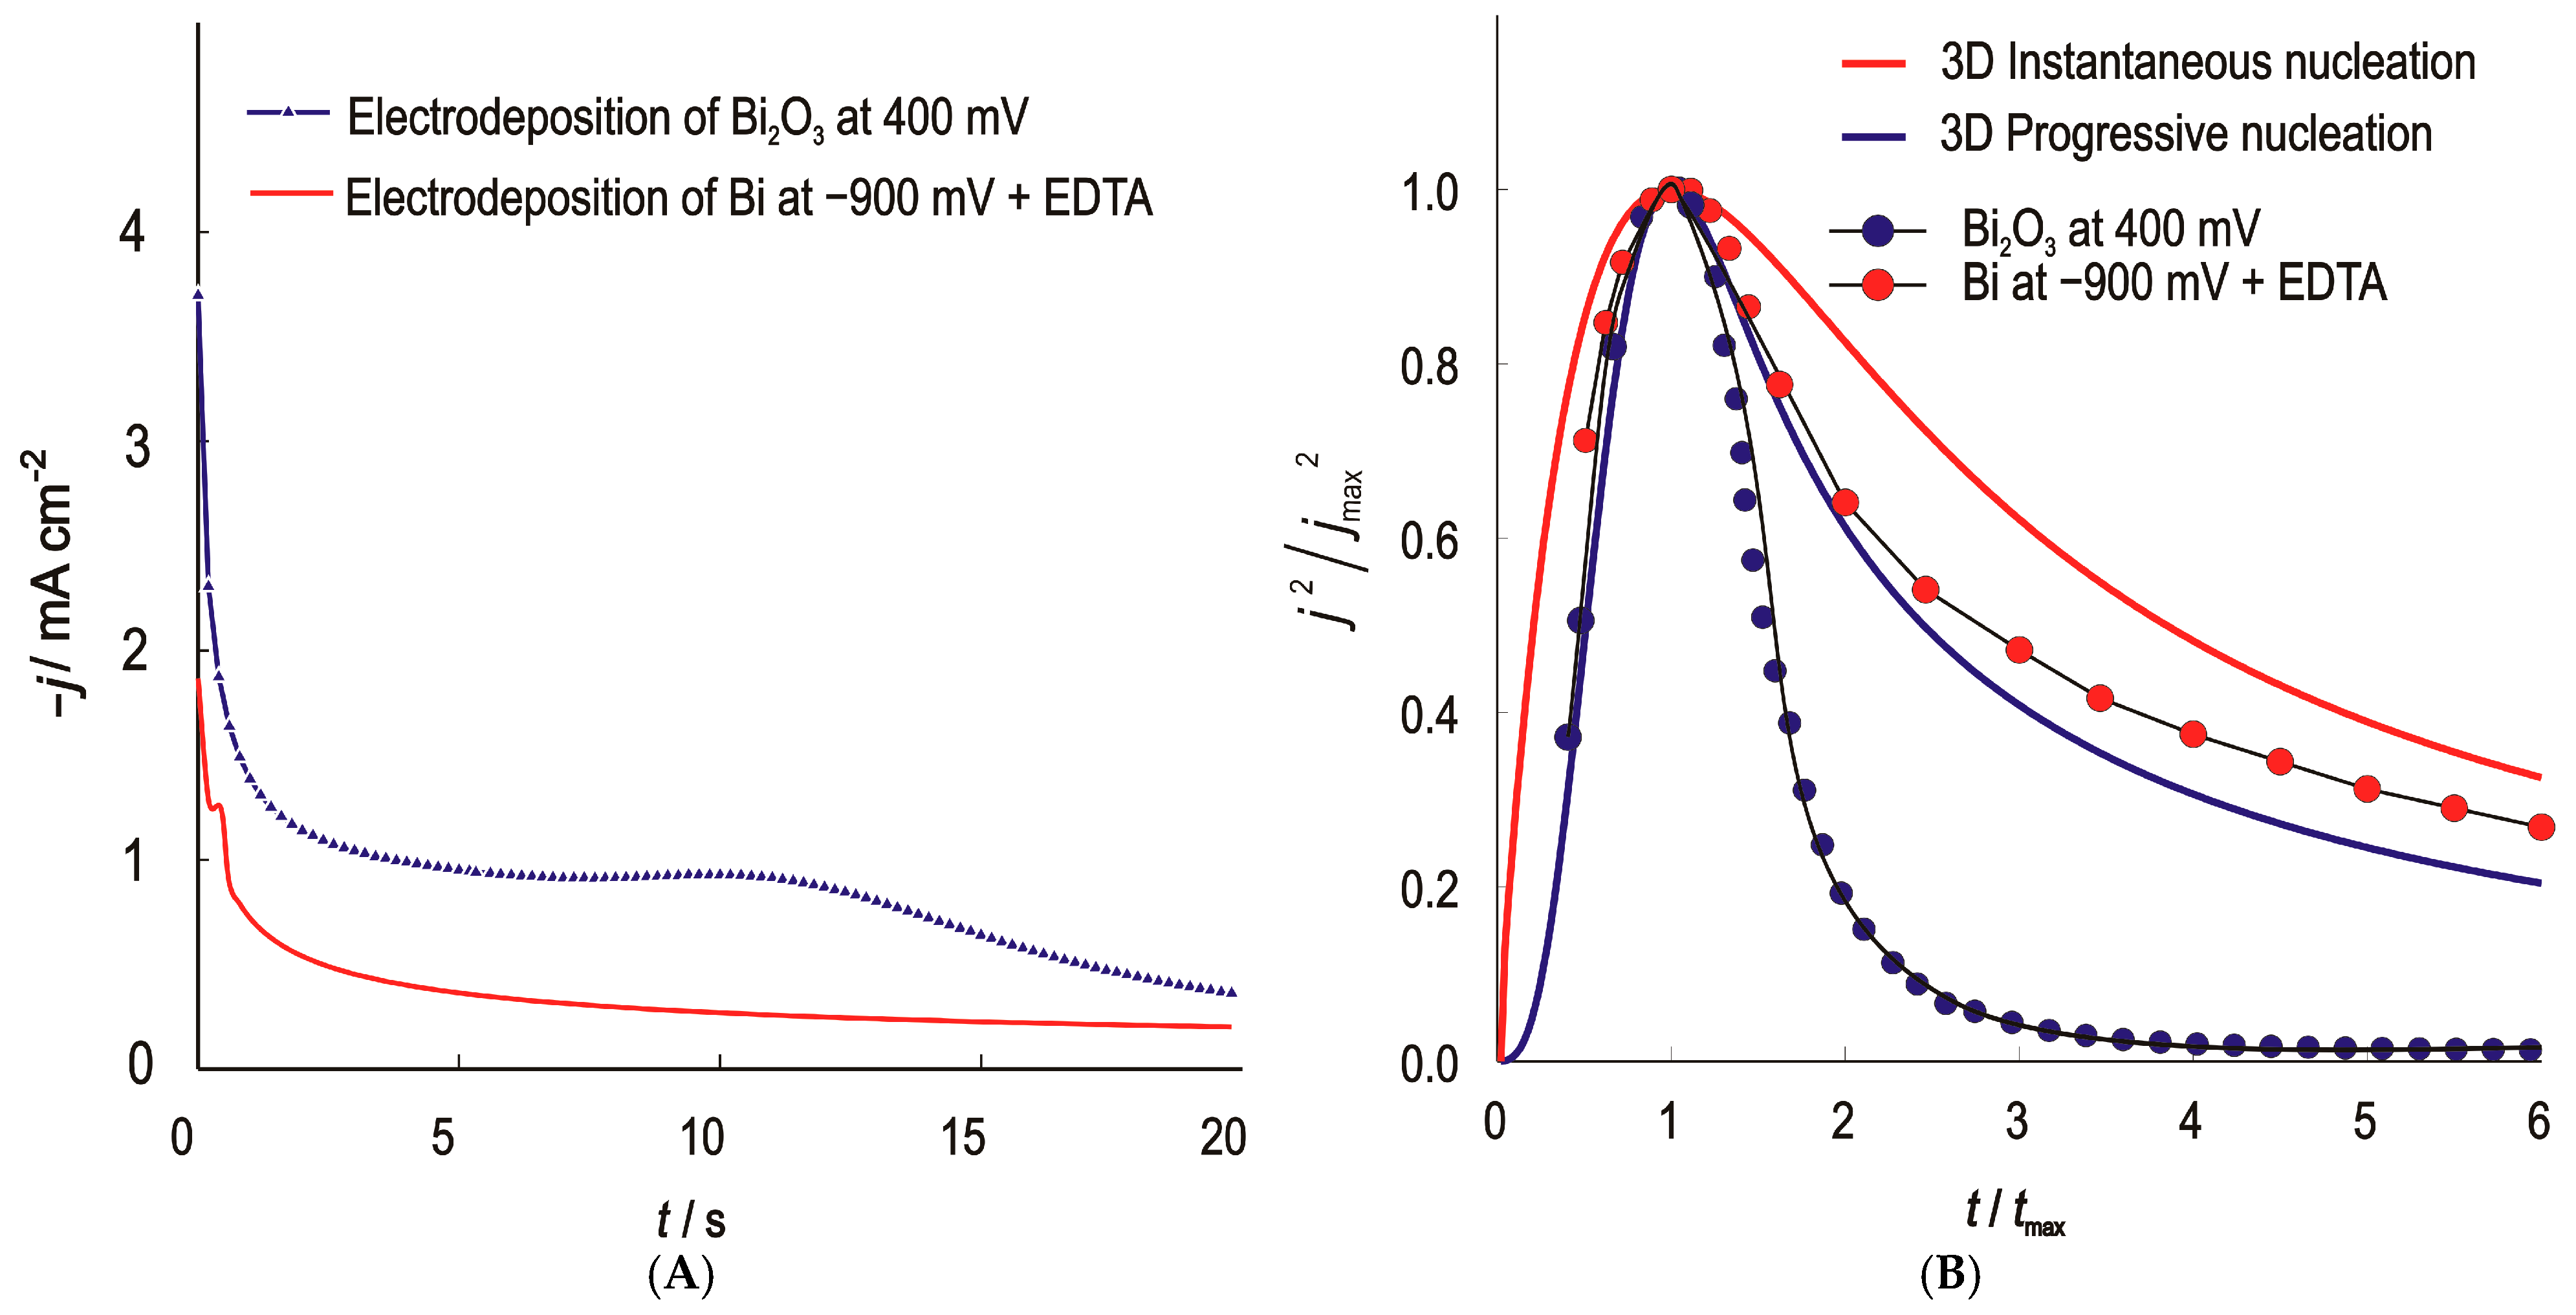
The initial stage of Bi and Bi2O3 electrodeposition was studied using the potentiostatic pulse technique—chronoamperometric method. The experimental procedure is taken from a previously analyzed and evaluated work. Bismuth bound in a metal-complex ionic form negatively shifts the reduction potential, improves the uniformity and prevents the formation of insoluble precipitates such as bismuth (III) hydroxides by stabilizing the metal ions in the solution and by preventing the reduction of Bi from the unfavourable bismuth form, BiO− [13]. The recorded potentiostatic transients of bismuth and bismuth (III) oxide and their normalized curves are shown in Figure 2.
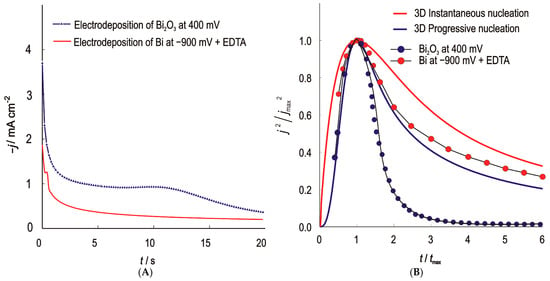
Figure 2.
(A)—Current–time (potentiostatic) transients for the nucleation and growth of Bi and Bi2O3 on the GC; (B)—Normalized potentiostatic transients, symbols are experimental values and the lines represent theoretical curves for the 3D instantaneous (red line) and progressive (blue line) type of nucleation and growth under diffusion control.
Comparison of the shape of the experimental curves with the theoretical curves shows that the nucleation and growth model for bismuth follows the Scharifker–Hills model for progressive nucleation and 3D growth. The nuclei form continuously over time and start to grow as soon as they are formed. The overlapping of diffusion zones, which is characteristic of progressive nucleation, leads to the appearance of dendrites with a larger diameter, which is confirmed by SEM analysis. The number of nuclei calculated from the current peak values for ELF/Bi was 847,255 per unit area. The nucleation and growth of Bi2O3 follow the same pattern only for a short time. The number of nuclei calculated according to the model for ELF/Bi2O3 and determined from the current peak values was 257,271 per unit area. The reported nuclei densities were obtained by fitting the Scharifker–Hills (SH) model to the initial stages of chronoamperometric transients. These calculations were based on the assumption of diffusion-limited growth. The calculated nuclei densities are moderately sensitive to the assumed diffusion coefficient: a ±20% change in the diffusion coefficient leads to a ±10–12% variation N0. This is consistent with the SH model [42].
The purpose of including chronoamperometry was to evaluate the stability and charge transfer behaviour of the film electrode. The results show the efficient electron transport and reproducibility of the film electrode, indicating a possible good analytical performance. The methodology proposed in the work leads to films with good numerical properties according to the nucleation model, and replicated films yield very similar growth and nucleation models and very similar numerical properties. Notwithstanding the results obtained, ELF/Bi2O3 does not fulfill the criteria required for analytical performance in terms of adhesion.
3.3. Cyclic Voltammetry
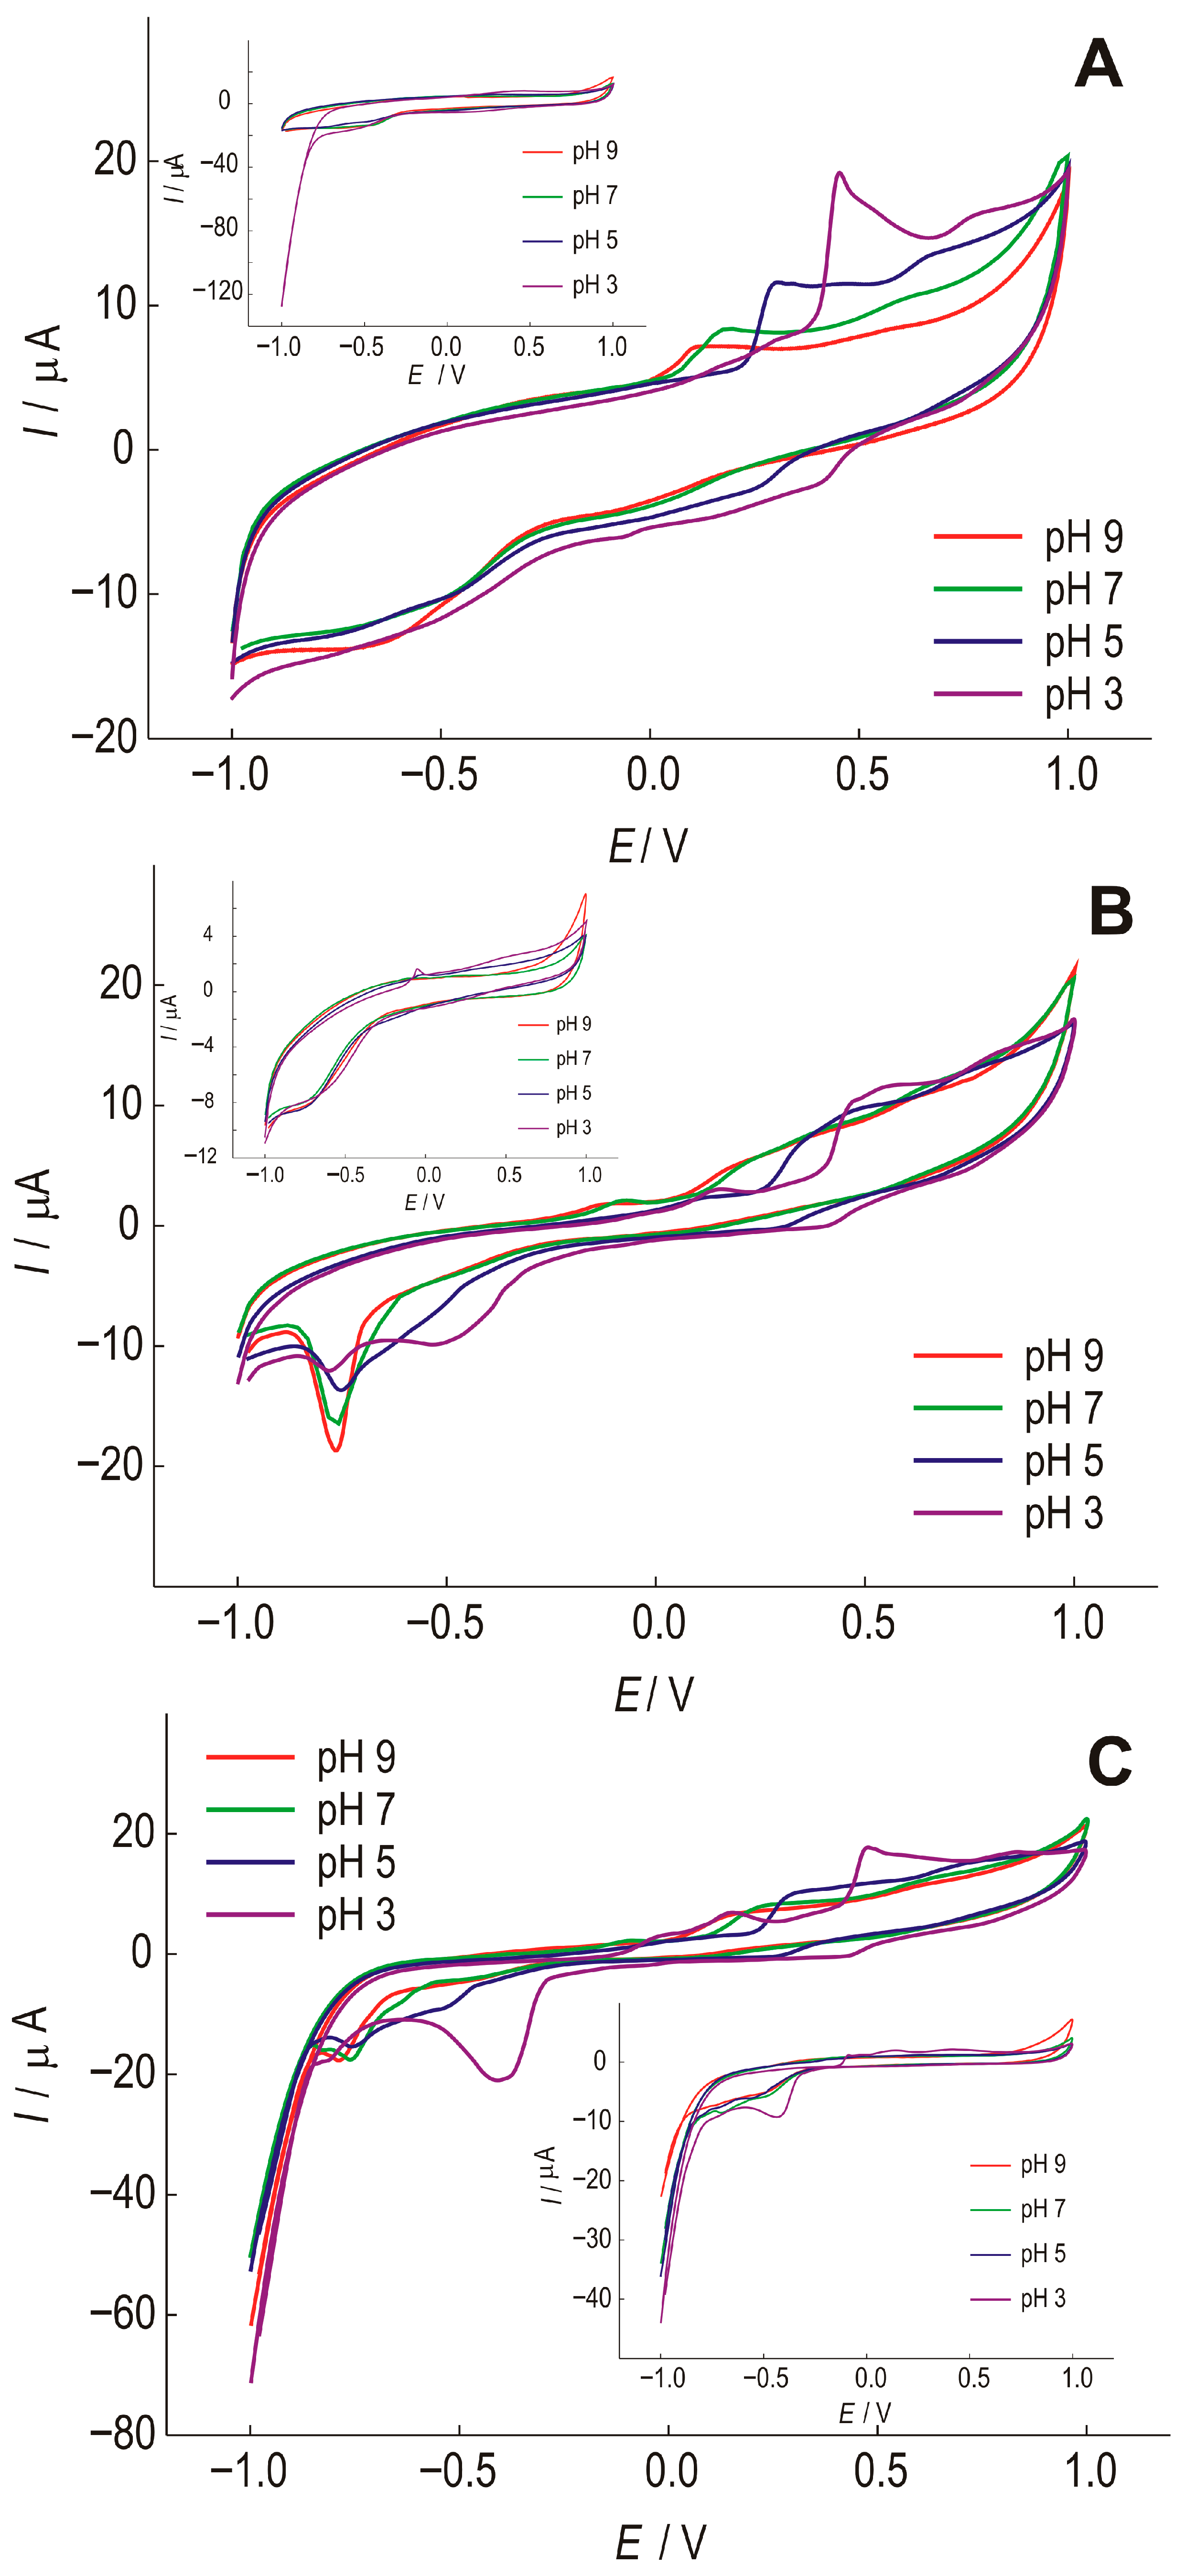
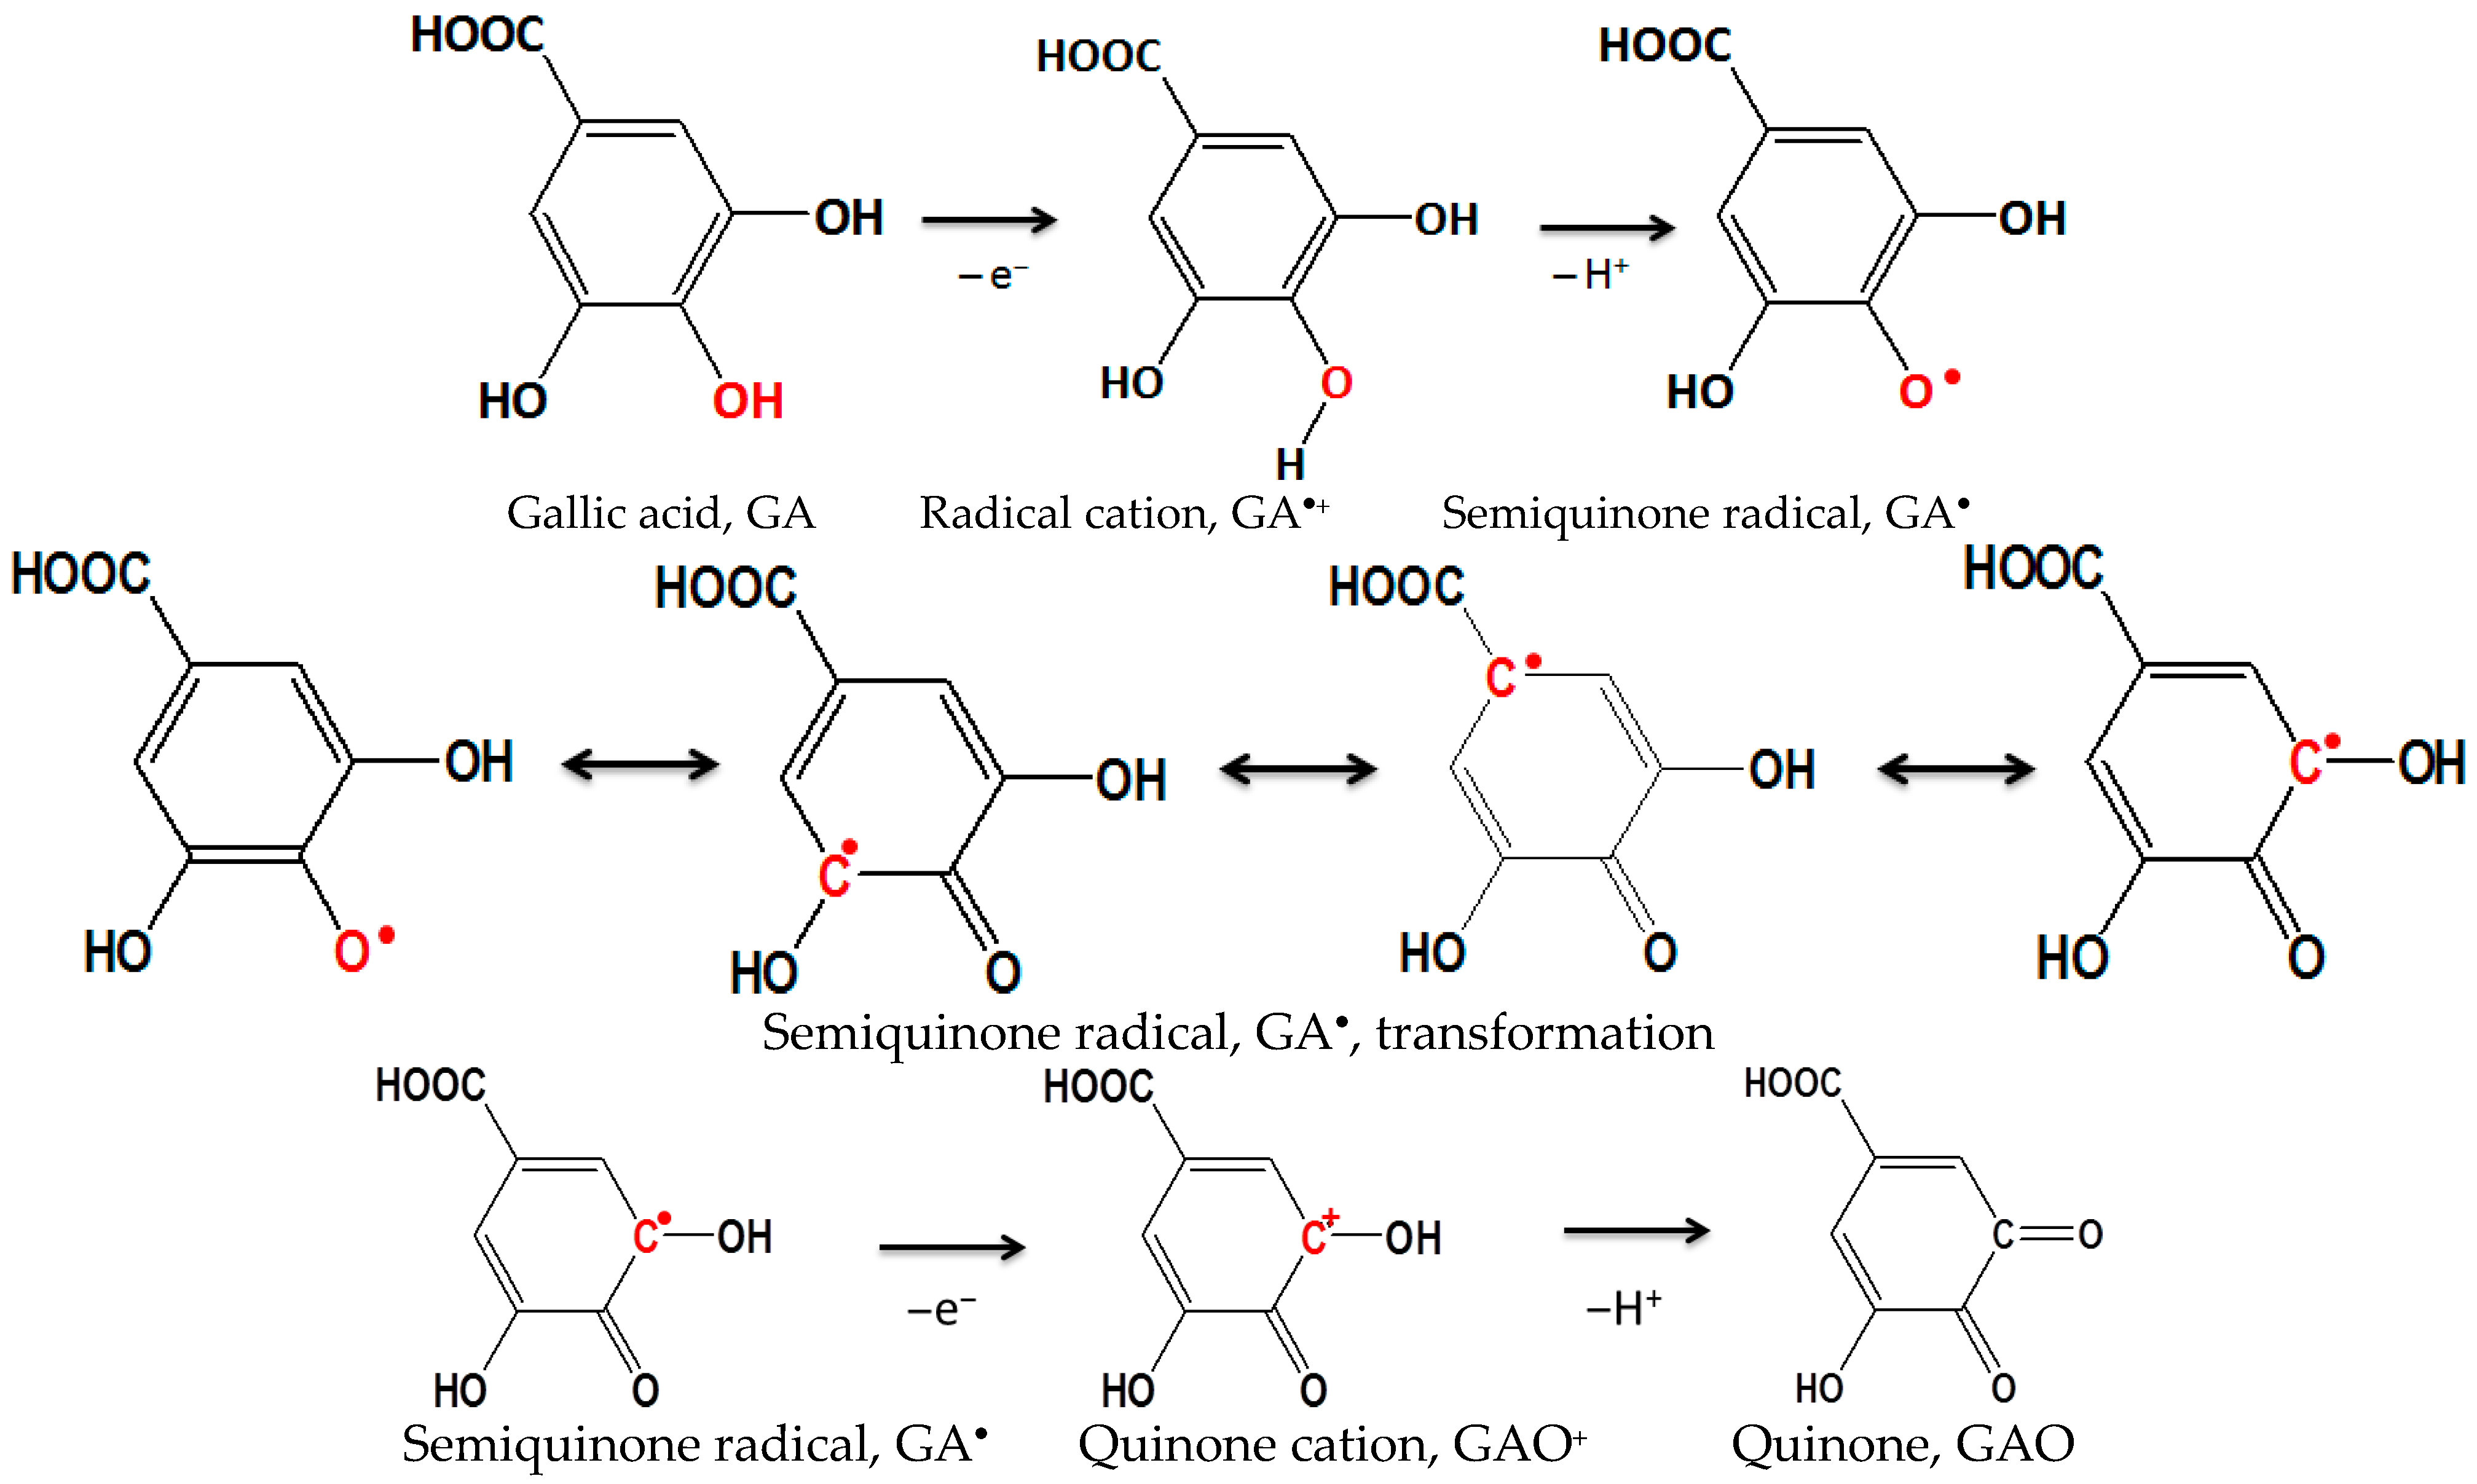
To optimize the pH value of a suitable phosphate buffer, SWCNT electrodes were tested. Figure 3 shows unmodified (SWCNT) and modified SWCNT/Bi and SWCNT/Bi2O3 electrodes at different pH values. The preliminary testing of the electrodes was carried out in the presence of gallic acid. The oxidation process of gallic acid, in which a semiquinone radical and a quinone are formed, is shown in Figure 4 [43].
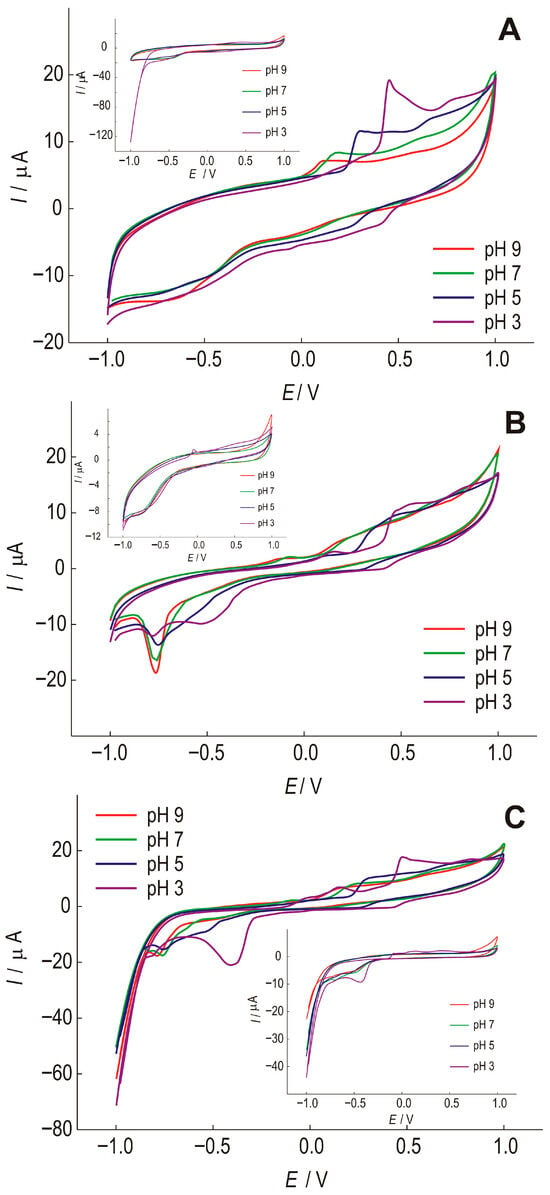
Figure 3.
Cyclic voltammograms of (A)—SWCNT; (B)—SWCNT/Bi and (C)—SWCNT/Bi2O3 at different pH of the phosphate electrolyte, with the addition of 1 × 10⁻⁴ mol dm−3 of gallic acid, recorded at a scan rate of 25 mV s−1. Insets: response of the corresponding electrodes in the absence of the analyte.
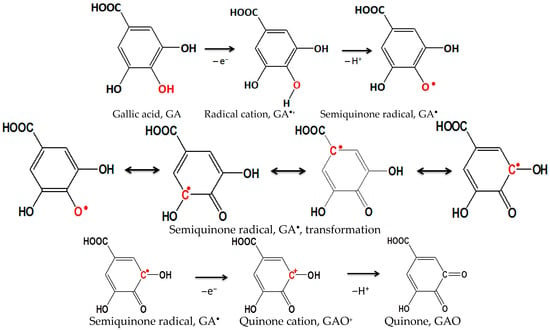
Figure 4.
Schematic representation of the oxidation process of gallic acid with the formation of semiquinone radical and quinone.
The stability of the proposed modifications with the addition of SWCNTs was also investigated by cyclic voltammetry and it was found that the oxidation and reduction mechanism with the addition of Bi or Bi2O3 is quite complex and consists of several steps, while the reaction products remain “trapped” inside the nanotubes. The two anodic peaks produced by the oxidation process of gallic acid have been characterized in the literature as the formation of a semiquinone radical for the first peak, which then oxidizes to a quinone in the second peak [44,45].
The SWCNT electrode (Figure 3A) shows that the current peak of gallic acid oxidation shifts in the cathodic direction with increasing pH by 466 mV, 285 mV, 150 mV, and 87 mV, respectively. The second step of gallic acid oxidation becomes visible with decreasing pH, at 756 mV for pH 3, and 645 mV for pH 5. At lower pH values, a current peak that could be attributed to the reduction of gallic acid can be observed at a potential of 426 mV for pH 3 and 266 mV for pH 5, but with a much lower intensity compared to the oxidation current peak, indicating a quasi-reversible reaction. At pH above 5, no reduction reaction of gallic acid is observed, indicating an irreversible reaction. The oxidation and reduction current peaks of gallic acid are most pronounced at pH 3.
When Bi is present in the film (Figure 3B), a series of reactions can be observed that are not seen in the electrode without gallic acid. The SWCNT/Bi electrode also shows that with increasing pH, the current peak of gallic acid oxidation is shifted in the cathodic direction, to 465 mV, 417 mV, 245 mV, and 172 mV. The second stage of gallic acid oxidation becomes visible with decreasing pH value; at pH 3 it is at a value of 831 mV and at pH 5 at a value of 746 mV. The anodic currents are smaller than for the electrode without Bi, and the current peaks are weakly pronounced. The oxidation reactions are most pronounced at pH 3, where the oxidation reaction is followed by a quasi-reversible reduction reaction. At lower pH values, a current peak that could be attributed to the reduction of gallic acid can be observed at a potential of 416 mV for pH 3 and 315 mV for pH 5, but with a much lower intensity compared to the oxidation current peak, indicating a quasi-reversible reaction. At pH above 5, the reduction reaction of gallic acid is not observed, indicating an irreversible reaction. It is certainly important to point out the occurrence of pronounced reduction current peaks for all pH values at a potential of about −750m V. These current peaks are well defined at pH 9 and can be attributed to the reduction of bismuth, which is more pronounced in the presence of gallic acid.
The SWCNT/Bi2O3 electrode (Figure 3C) also shows that increasing pH shifts the current peak of gallic acid oxidation in the cathodic direction, by 446 mV, 295 mV, 222 mV, and 150 mV, respectively. The second stage of gallic acid oxidation becomes visible with decreasing pH, at 808 mV for pH 3, and 709 mV for pH 5. The anodic currents are slightly higher than for the electrode without Bi2O3 addition, and the current peaks at lower pH values are well defined. The oxidation reactions are most pronounced at pH 3, where the oxidation reaction is followed by a quasi-reversible reduction reaction. At lower pH values, a current peak that could be attributed to the reduction of gallic acid is observed at a potential of 406 mV for pH 3 and 245 mV for pH 5, but with a much lower intensity compared to the oxidation current peak, indicating a quasi-reversible reaction. At pH above 5, no reduction reaction of gallic acid is observed, indicating an irreversible reaction. As with the Bi-doped electrode, reduction current peaks are observed at all pH values at a potential of about −800 mV, again due to bismuth reduction, which is stronger in the presence of gallic acid.
After comparing all the results obtained, it was found that the highest affinity of all modifications to the selected analytes was observed at pH 3.
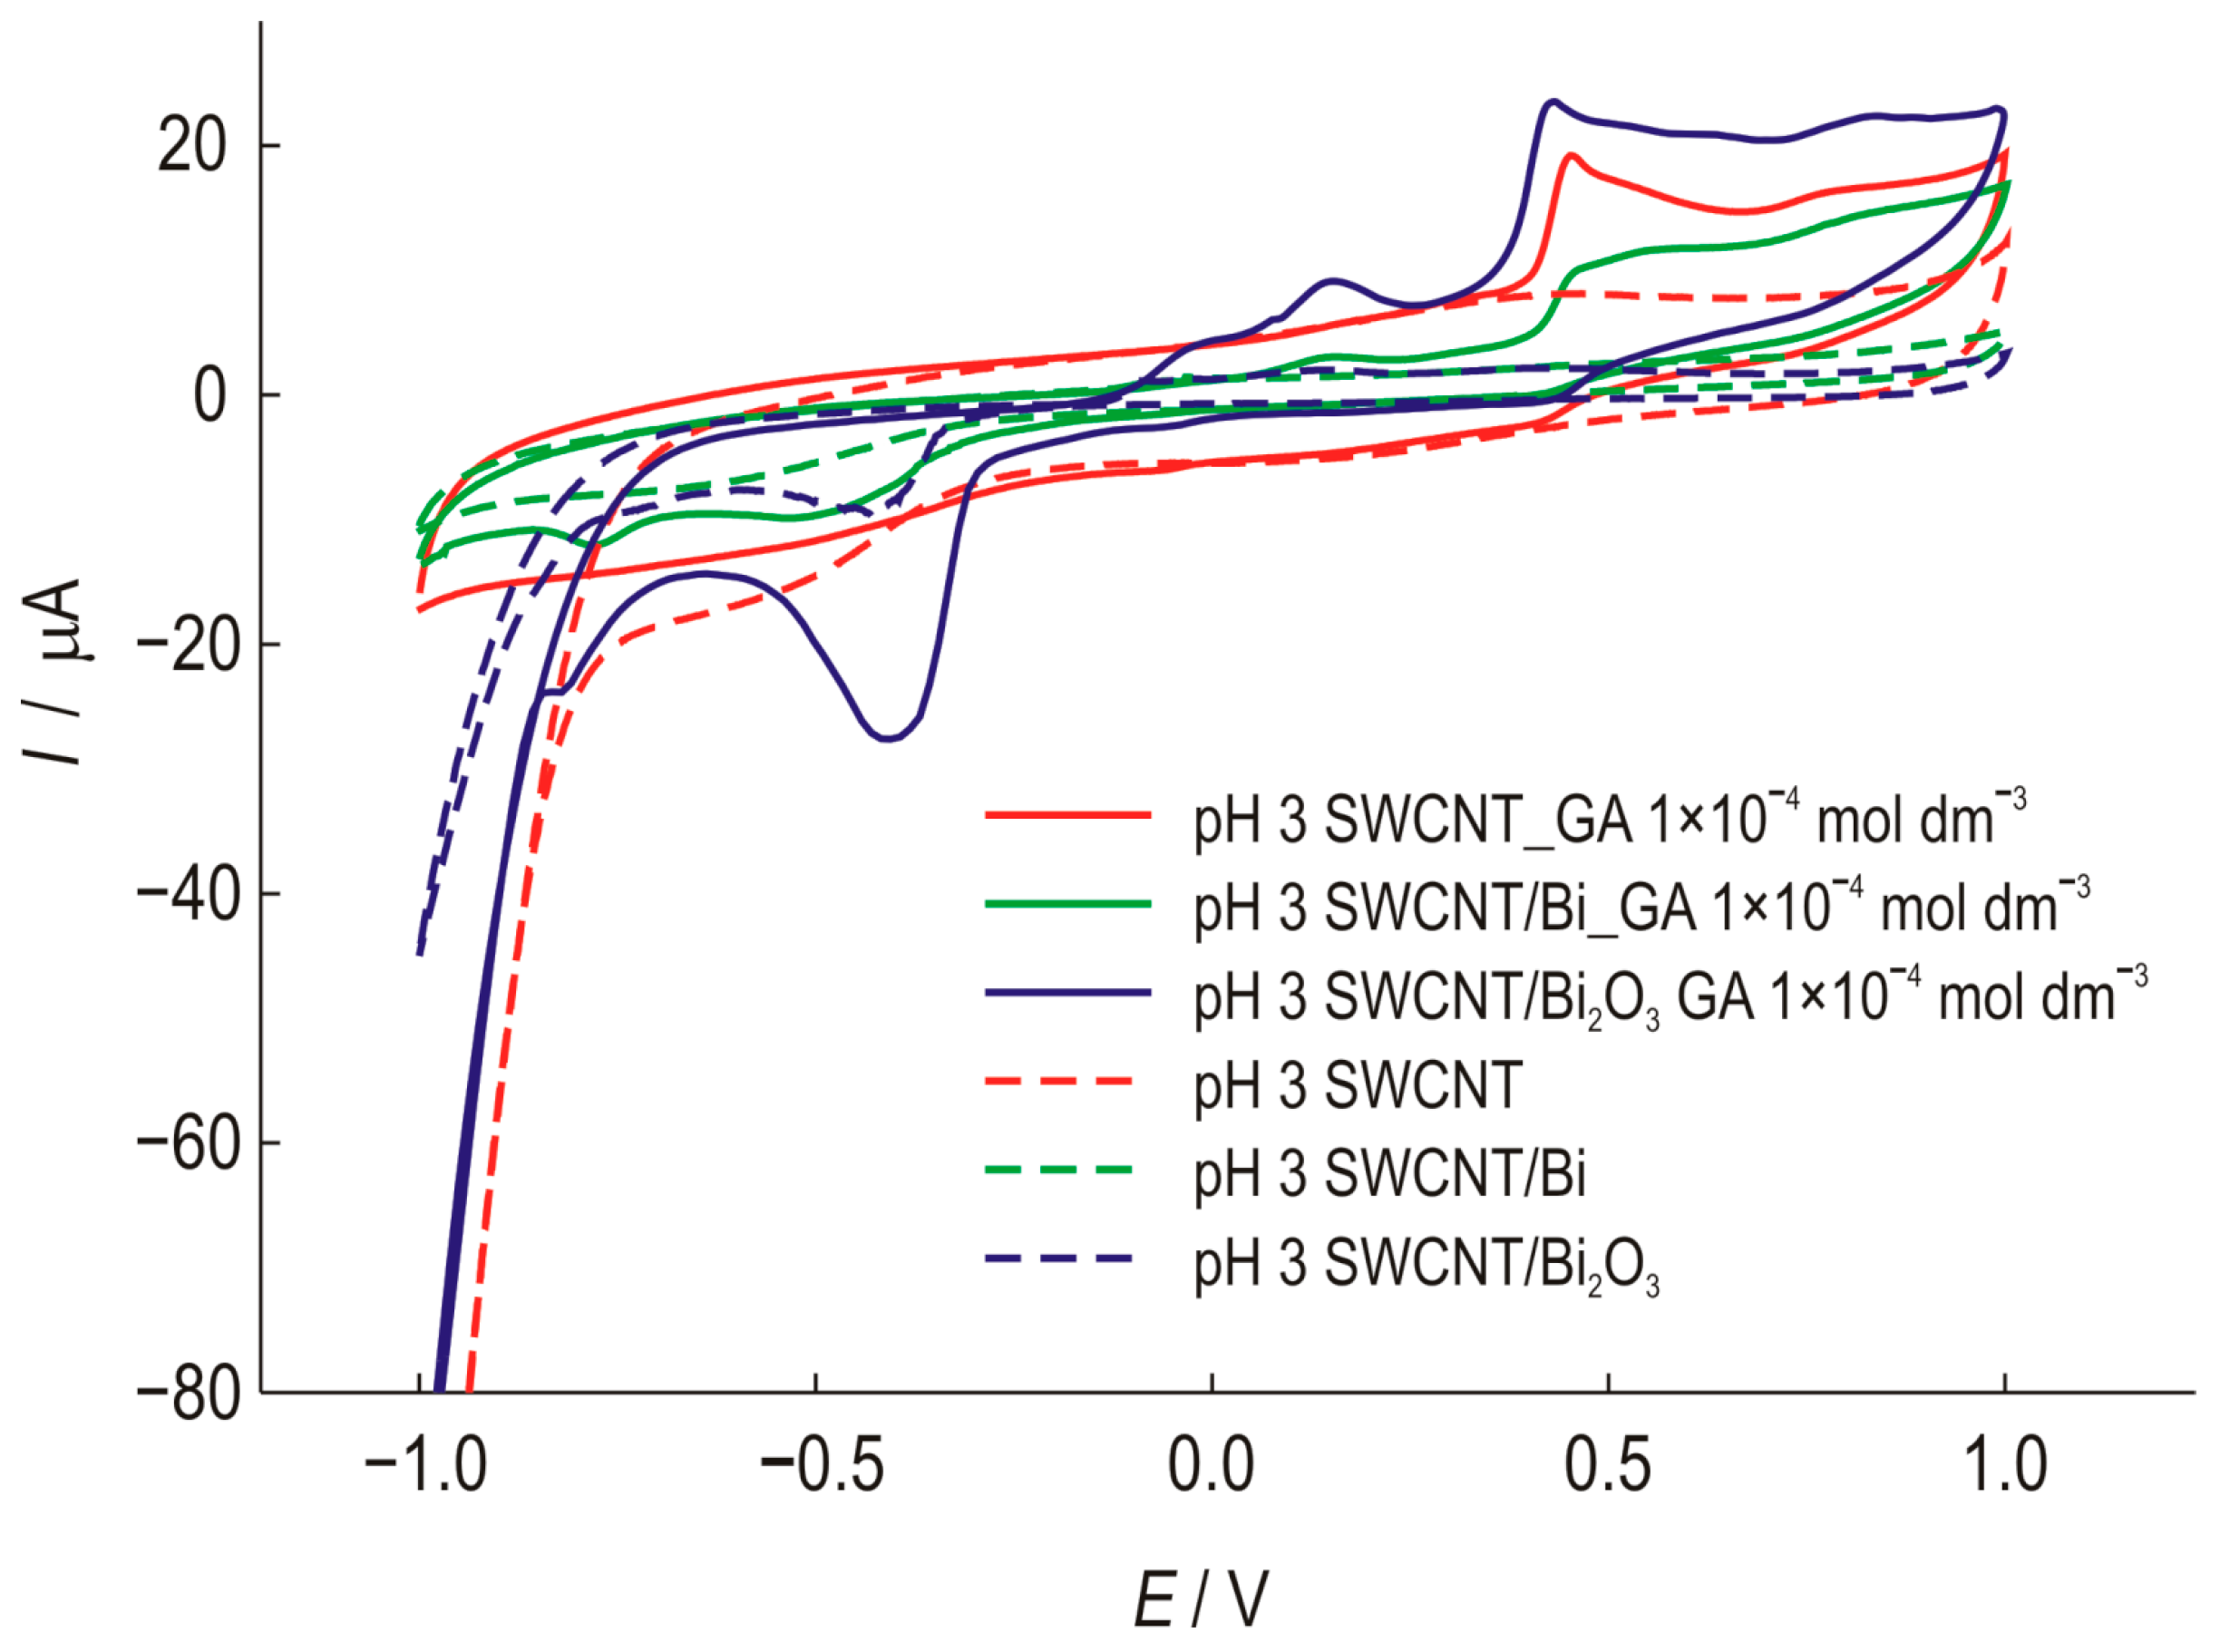
Figure 5 shows the cyclic voltammograms of three modified electrodes. The shift in the oxidation potential in the cathodic direction by approximately 20 mV also indicates the possible catalytic effect of this modification. By combining the properties of carbon nanotubes and Bi2O3, a higher sensitivity to gallic acid was achieved.
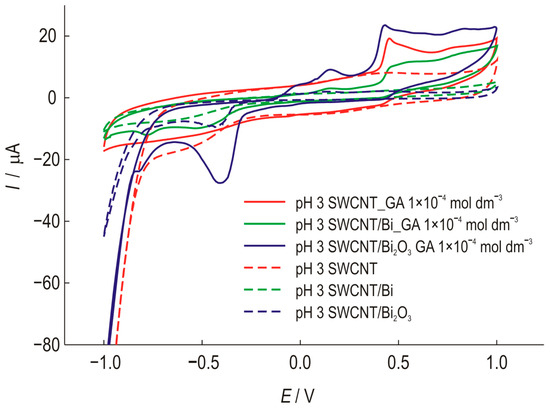
Figure 5.
Cyclic voltammograms of SWCNT electrodes, unmodified and modified with Bi or Bi2O3, recorded in the presence (1 × 10⁻⁴ mol dm−3) and absence of GA at a scan rate of 25 mV s−1, pH 3.
The adhesion properties o the ELF/Bi2O3 film electrode proved to be very poor and the Bi2O3 film changed significantly. After 10 cycles in a phosphate buffer solution at a wide range of potentials, washing and drying, the structural integrity of the surface was disturbed and the electrode became unusable for further measurements.
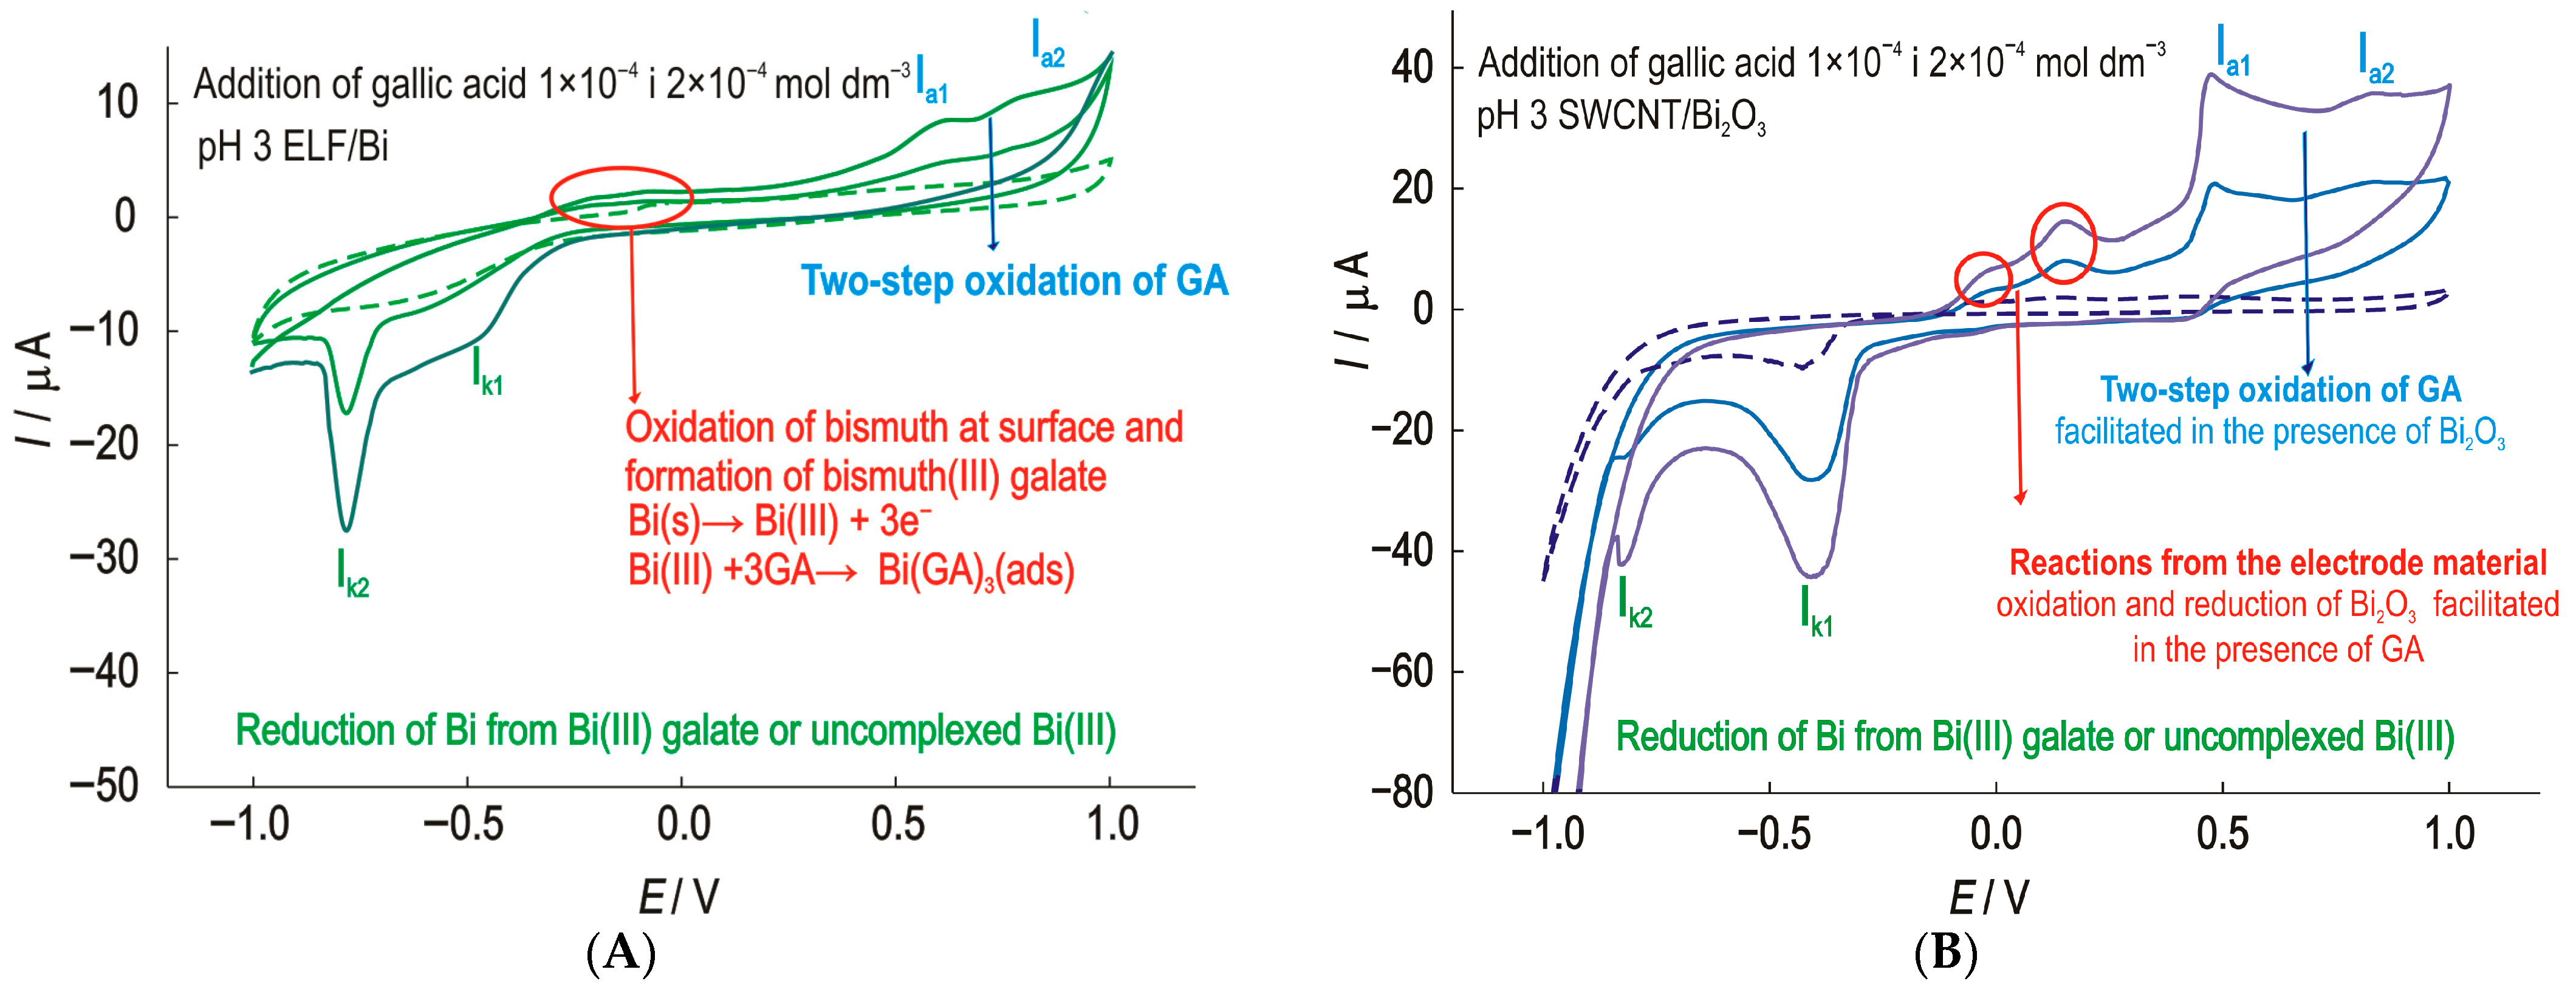
The behavior of the prepared ELF/Bi electrode in phosphate electrolyte with the addition of GA results in the voltammograms shown in Figure 6A. Cyclic voltammograms at the ELF/Bi electrode in phosphate electrolyte at pH 3 show an increase in the anodic peak currents at a potential of about −150 mV with an increase in the GA concentration. In this potential range, the formation of a surface film of bismuth (III) complexes in the form of gallate is possible. The interaction between Bi (III) and gallic acid is a well-documented phenomenon, particularly due to the ability of gallic acid to act as a chelating ligand. This interaction is the basis for the formation of bismuth (III) subgallate, a complex salt with pharmaceutical and chemical significance [46]. Two cathodic current peaks can be observed. The cathodic current peak Ik1 at a potential of −500 mV. A second very well defined cathodic peak Ik2 at a potential of −750 mV is most likely the result of the reduction of bismuth to elemental bismuth.
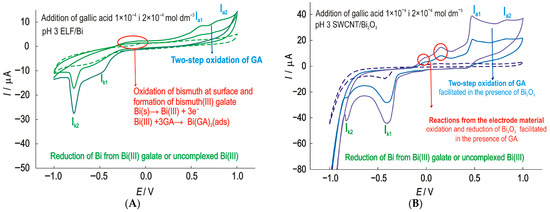
Figure 6.
Cyclic voltammograms of the (A)—ELF/Bi and (B)—SWCNT/Bi2O3 electrode with the successive addition of GA with scan rate 25 mV s−1.
Several conclusions can be drawn from the comparison of the results for the ELF/Bi, SWCNT/Bi and SWCNT/Bi2O3 electrodes. The addition of EDTA not only promotes a uniform thin film but also improves the adhesion properties of the film. The SWCNT/Bi2O3 electrode shows the best result towards GA. An increase in gallic acid concentration (Figure 6B) is accompanied by an increase in peak currents at all observed potentials. Such a modification can be successfully used to determine the gallic acid concentration.
3.4. Square Wave Voltammetry
For electroanalytical purposes and according to results from cyclic voltammetry, SWCNT modified with Bi2O3 was chosen. The SWCNT/Bi2O3 modified electrode exhibited the highest response to gallic acid, owing to the synergistic effect of Bi2O3 catalytic sites and SWCNT-enhanced surface area and electron transfer.
For all optimization parameters concentration of GA in the electrolyte was 1 × 10⁻⁵ mol dm−3. In electroanalysis based on adsorptive voltammetry, the accumulation potential (Eaq) and its accumulation time (taq) are decisive factors for high sensitivity. The influence of both parameters was investigated. During the accumulation time of 30 to 300 s, the current response increased and reached an almost steady state after 90 s. The change in the slope after 90 s and the formation of a plateau after 180 s indicate the saturation of the adsorption sites present in the material. The accumulation time at a lower concentration of gallic acid (1 × 10⁻⁶ mol dm−3) shows the same initial trend, with the difference that a plateau is formed after 240 s. This phenomenon is attributed to the progressive and rapid occupation of the analyte accumulation sites at the working electrode. The change in the deposition potential was investigated from 200 mV. The peak currents increased slowly as the deposition potential moved in the cathodic direction, reaching a maximum at −200 mV and then increased significantly after −400 mV, leading to a broadening and distortion of the shape of the voltammograms. For quantitative oxidation of GA ions, the accumulation should therefore take place at a potential of −200 mV. In addition, the SWCSV method was established by observing the influence of the applied frequency (f), the potential increment (ΔEs), and the pulse height (ΔEp) on the anodic peak currents (Iap). For all analyzed values of ΔEs, an increase in frequency up to 20 Hz leads to an increase in Iap. At frequencies above 20 Hz, the current peaks decrease, which is due to kinetic limitation. Ip has a practically linear variation with ΔEp for values below 80 mV. All SWV measurements were performed with the following experimental parameters: taq = 60 + 30 s, Eaq = −200 mV, f = 20 Hz, ΔEs = 10 mV and ΔEp = 100 mV.
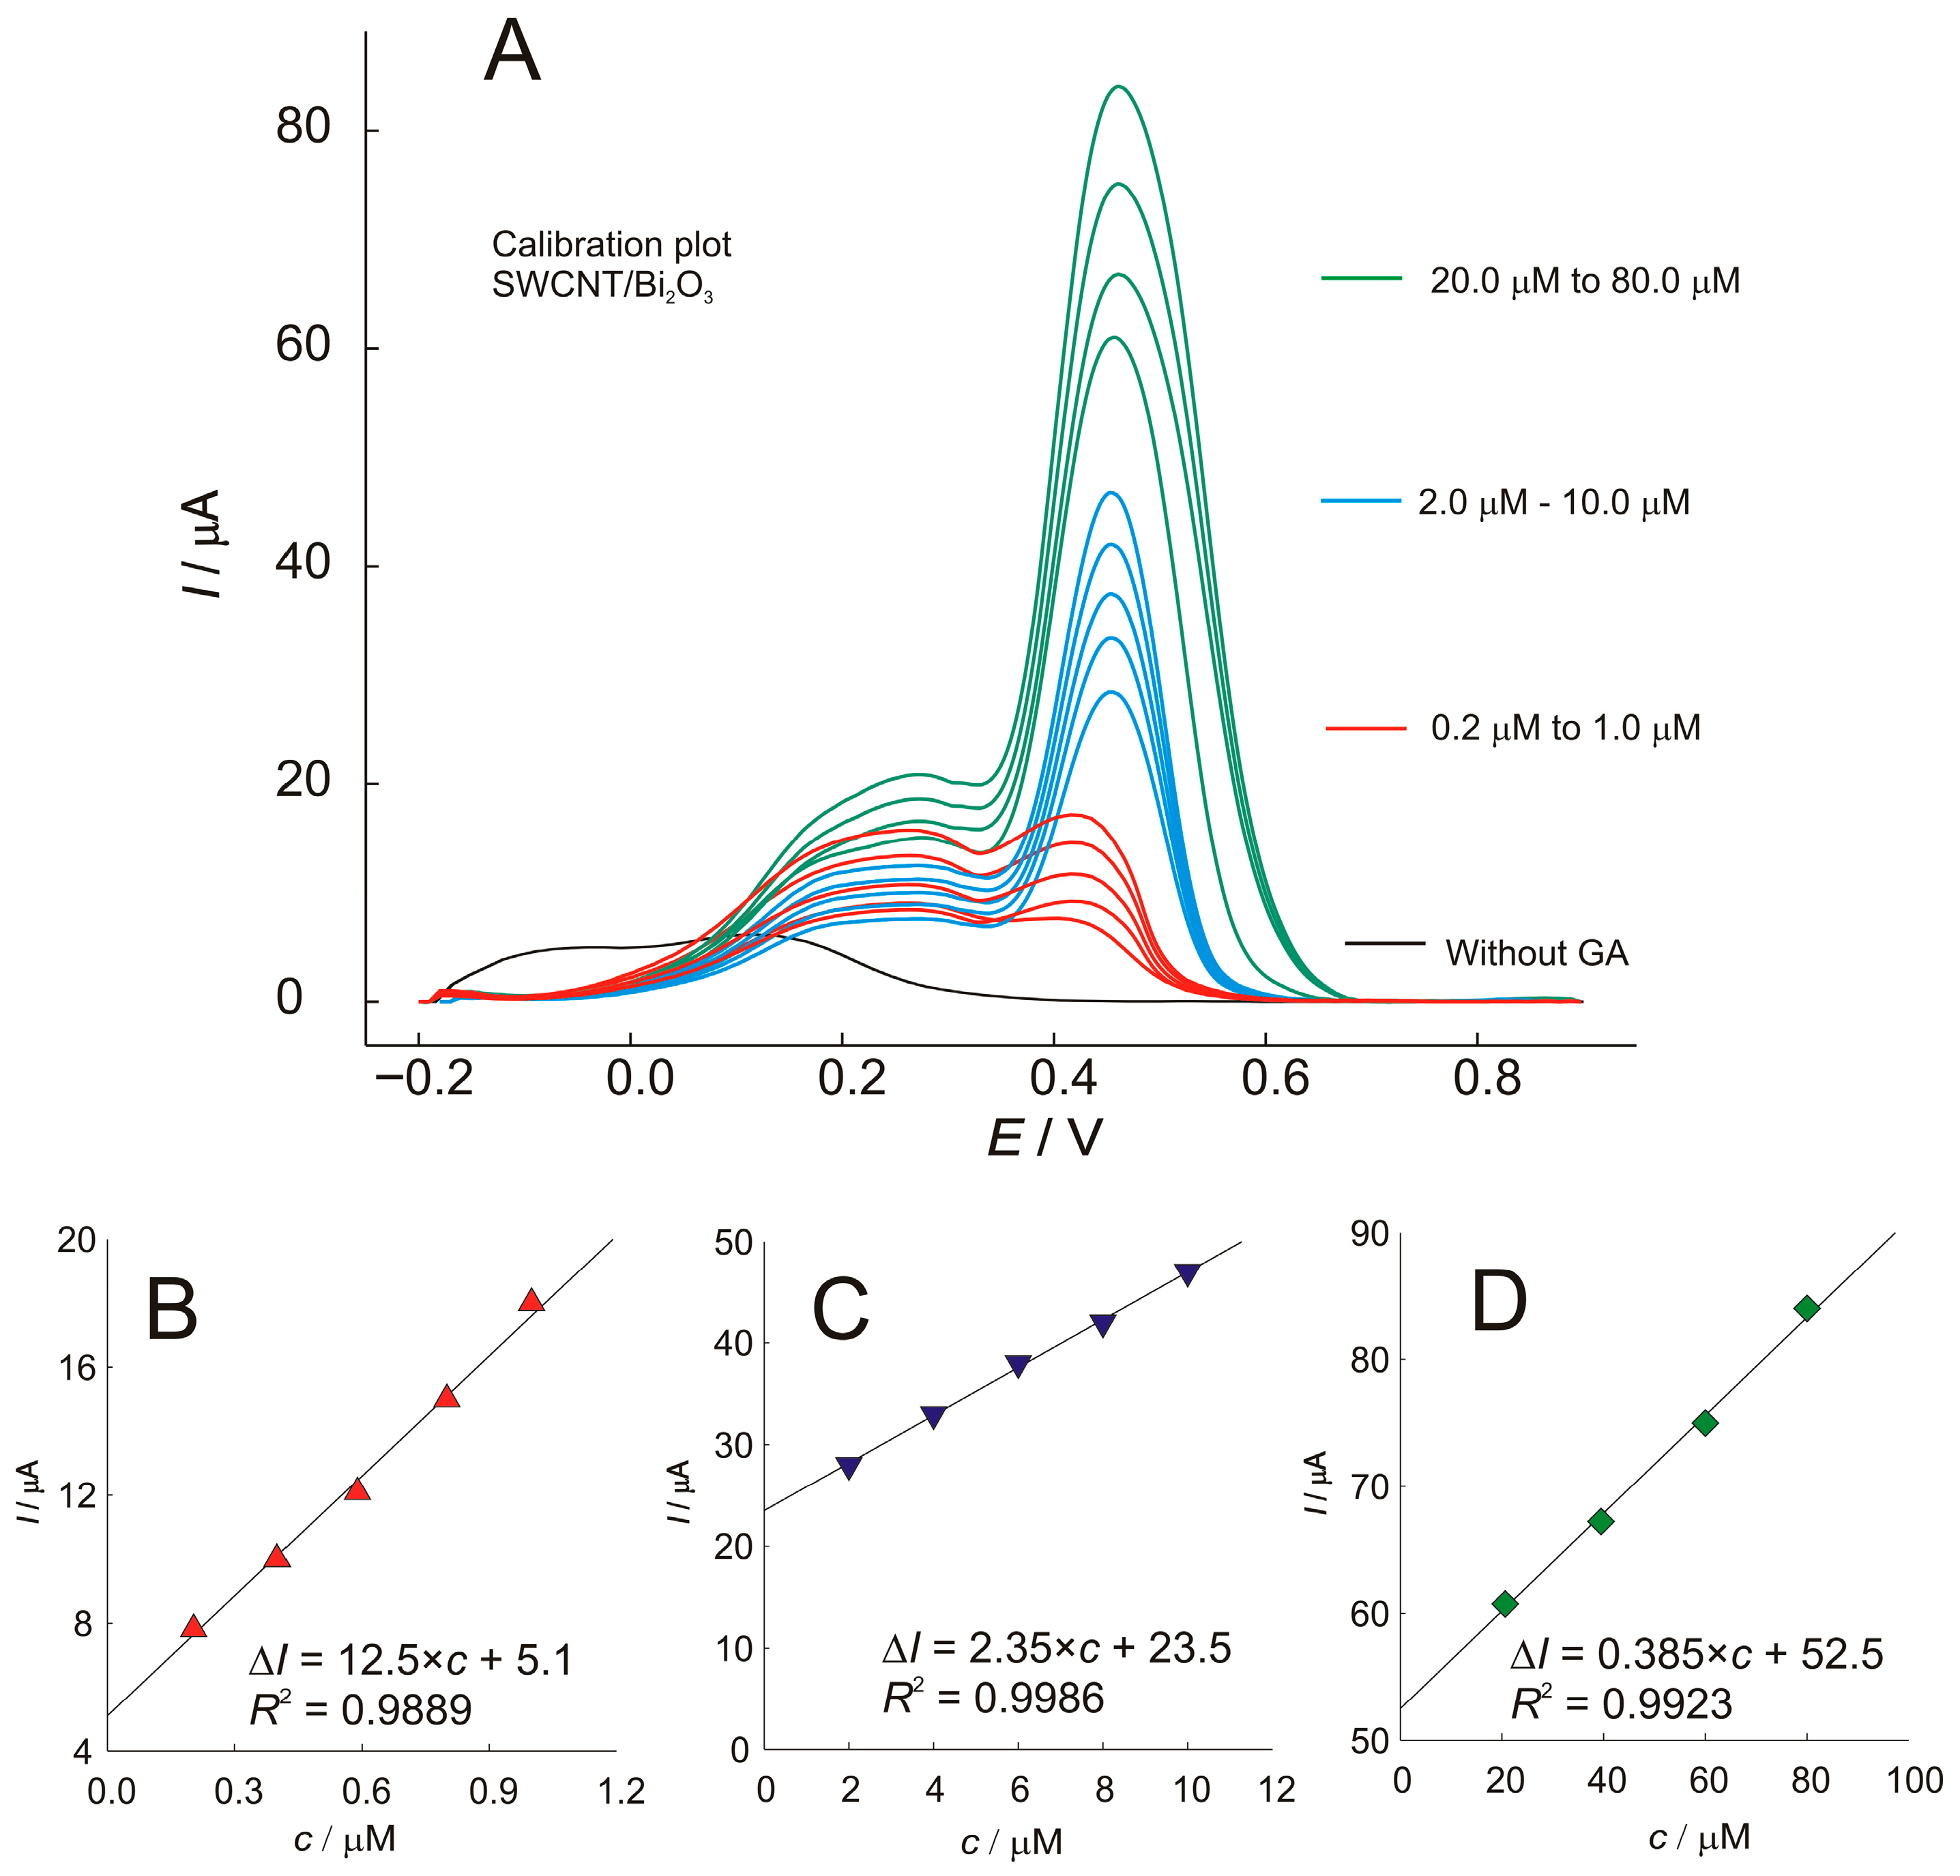
Using the optimized conditions, the linearity of the proposed method was evaluated in a wide concentration range and shown in Figure 7. As can be seen, the SWV technique provides a broad cathodic current signal around 250 mV, that does not follow the linear trend of the concentration, indicating a change in the oxidation mechanism as a function of concentration. The second oxidation peak at 430–470 mV was used to generate calibration plots over three concentration ranges. Each concentration range has a different sensitivity and a different calibration equation. The proposed protocol, using the SWCNT/Bi2O3 sensor, provided wide linearity with sensitivities of 12.5, 2.35, and 0.385 µA µmol−1 dm3 for the low, middle, and high concentration ranges, respectively. The limit of detection (LOD) was calculated according to the IUPAC recommendation, with equation LOD = 3σ/S, where σ is the standard deviation of the blank (n = 3) and S is the slope of the calibration curve obtained from standard solutions of the analyte. The LOD was estimated to be 0.06 μmol dm−3.
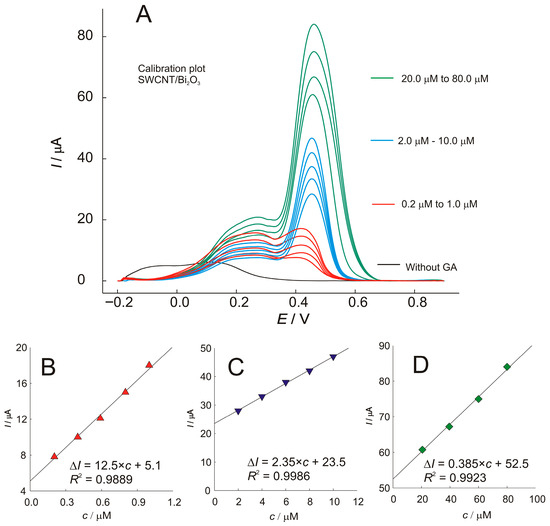
Figure 7.
(A)—SWV voltammograms of different concentrations of gallic acid (GA) recorded at the SWCNT/Bi2O3 electrode, and the corresponding calibration plots with regression equations showing the effect of concentration on peak current: (B)—for concentration 0.2 to 1.0 mol dm−3; (C)—2.0 to 10.0 mol dm−3; (D)—20.0 to 80.0 mol dm−3.
The reproducibility, repeatability, and stability of the electrode are examined in a phosphate solution, pH 3, with constant concentration of 1 × 10⁻⁶ mol dm−3, for five consecutive measurements. The intra-electrode precision (%RSD) was calculated to be 1.5%. The inter-device precision (%RSD) was calculated less than 10.0% for all three concentration ranges, indicating adequate manufacturing reproducibility. The sensitivity of the prepared film is unique for each modified electrode. For this reason, the standard addition method is used to analyze the real samples. The stability of the proposed sensor was evaluated for the same electrode over five days. After each measurement cycle, the electrode was rinsed in redistilled water and an SWV voltammogram was recorded. The procedure was repeated until the electrode responded without a gallic acid current peak. The electrode was then dried in a nitrogen and stored until the next day. On the second and third day, a decrease in the analytical signal (peak current) of approximately 8.5% and 12.8% was observed for each day with linearity maintained, indicating that the prepared sensor had sufficient stability for three days of use. After 4 days, a loss of stability of the sensor was observed, resulting in a decrease in performance.
3.5. Interference Study
The anodic SWV peak of 1 × 10⁻⁶ mol dm−3 GA was analyzed in the presence of the usual interfering substances at up to 100-fold higher concentrations. Carbonate, chloride, and cations of the I- and II-PTE group had no influence on the peak current. Some investigated vitamins, which are usually present in the real sample but are not phenols (vitamins A, B3, B9), interfere less than 5% with the proposed optimized methods when they are present in 10-fold higher concentrations.
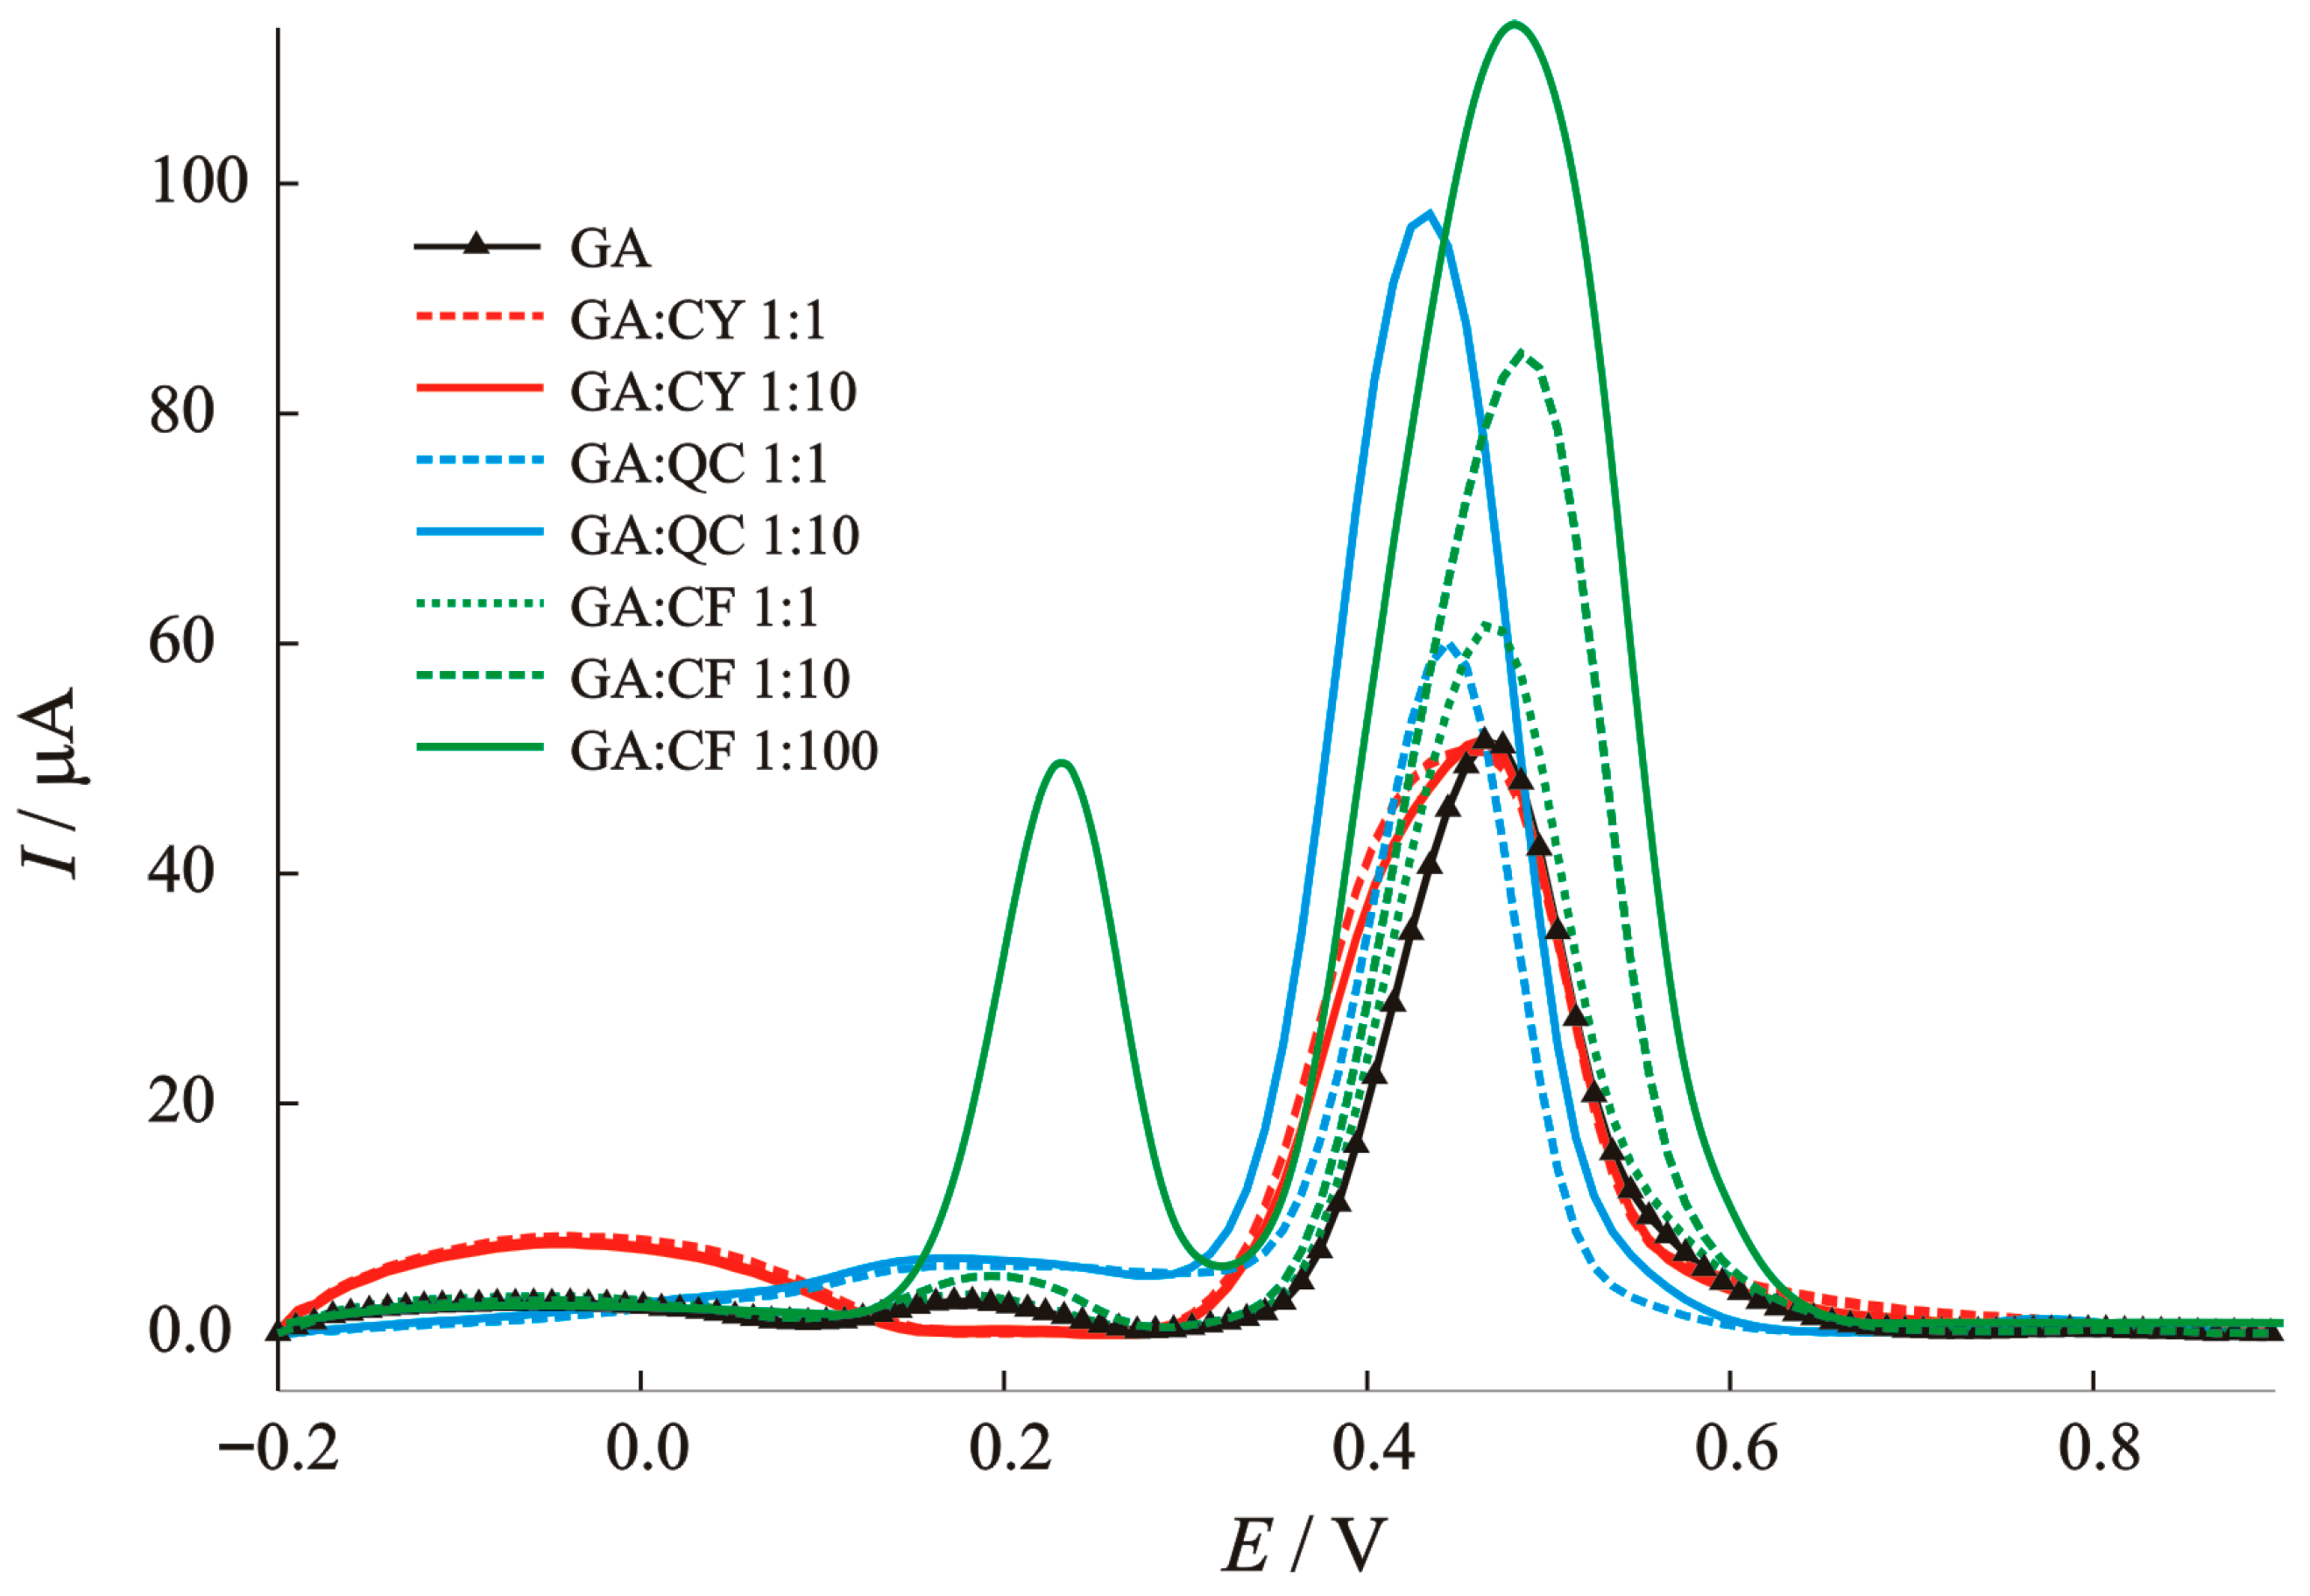
The interfering non-phenolic and phenolic acids that can coexist with GA in real samples, such as cysteine as a sulphur-containing amino acid, caffeic acid as part of rosmarinic acid and quercetin as the main bioflavonoid and pigment in plant samples, were analyzed in detail. To better understand the mechanism of the interference effects, the voltammograms in this manuscript are shown in Figure 8. It can be seen that cysteine (CY) shows an oxidation reaction at a potential of −50 mV, which is not surprising, since Bi (III) can interact strongly with thiol-containing compounds. The peak belonging to GA oxidation is disturbed and the shape changed, without changing the current value. The first step of the oxidation reaction of caffeic acid occurs at 200 mV and the second step occurs together with gallic acid and affects ~13% of the main oxidation peak of 0.35 V at 10-fold higher concentrations. Quercetin as a basic bioflavonoid has a negligible effect on the current peak at 200 mV and an effect ~10% on the main oxidation peak of 0.35 V when the concentration is 10-fold higher. Each voltammogram of a real sample can provide information about other types of potential antioxidant species with specific oxidation potentials.
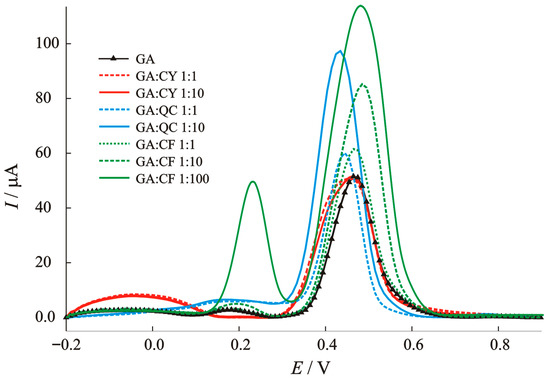
Figure 8.
Baseline-corrected SWV voltammograms for the interference study: effect of caffeic acid (CA), cysteine (CY), and quercetin (QC) on the anodic peak current of gallic acid (GA).
To conclude, caffeic acid, cysteine and quercetin show a significant increase in the peak current of gallic acid. The structurally similar phenols, such as chlorogenic acid, may oxidize in a similar potential range (430–470 mV) as our target analyte, possibly leading to overlapping peaks. Optimized parameters may help minimize such overlap. So, the hypothesis often found in the literature that “unmodified electrodes and the application of voltammetric methods do not have sufficient selectivity for a particular species, but have great potential for the determination of total phenolic compounds in real samples” can also be applied here. Most of the simple modified electrodes (with the exception of enzymatic biosensors) do not have sufficient selectivity but can thus quickly provide information on mechanisms and species that may be present in real samples. By carefully analyzing voltammograms of real samples, other bioactive species can be selectively found and determined. Economic aspects, the environmentally friendly method, the low detection limit, the wide range of applications, and the speed continue to place these methods at the center of today’s modern analytical trends.
3.6. Spectrophotometic Study
Determination of total phenols—Total phenols are determined by the Folin–Ciocalteu method. The mathematical expression (Equation (1)) is obtained as relation between the concentration and the absorbance of a known concentration of gallic acid, as a standard, according to the calibration equation:
where Υ represents the mass concentration in mg dm−3 of the gallic acid, and the result is expressed as an equivalent, mg GAE/L. The results table and the corresponding calibration curve are included in Supplement Materials as Table S1 and Figure S1.
A = 0.00111 × Υ + 0.0742 (R2 = 0.99848)
Determination of antioxidant activity by FRAP method—FRAP (Ferric reducing/antioxidant power). The mathematical expression describing the relationship between Fe2+ concentration and absorbance is given as a calibration equation (Equation (2)) and the results are expressed in µM Fe2+ equivalents. The results table and the corresponding calibration curve are included in Supplement Materials as Table S2 and Figure S2. From the calibration curve the antioxidant activity in the extracts is estimated according to the following calibration equation:
A = 0.00065 × c − 0.0097 (R2 = 0.9990)
These proposed calibration equations were used to analyze sunflower, flax, sesame, and chia seed extracts, and the results are presented in Table 1 as concentration relative to the standard.

Table 1.
Total phenolic content and antioxidant activity of samples obtained by spectrophotometric methods and concentration of gallic acid obtained by square wave voltammetry.
According to the literature, here is a summary of the phenolic acids and phenolic compounds found in the aqueous extracts of the seeds. Sesame seeds contain mainly gallic, protocatechuic, 4-hydroxybenzoic, and chlorogenic acid, and some quantities of p-coumaric, ferulic, caffeic, rosmarinic acids, sesamol, sesamin, and sesamolin [47]. Sunflower seeds contain mainly caffeic acid (~8 mg/100 g), plus chlorogenic, p-coumaric, ferulic, vanillic, sinapic acids, quercetin, and rutin, which are commonly reported in the seed profiles [48]. Linen seeds contain p-coumaric, vanillic, sinapic, and ferulic acids (often as glycoside esters), and secoisolariciresinol diglucoside (SDG)—a major lignan in linen [49]. Chia seeds contain caffeic, chlorogenic, rosmarinic, gallic, cinnamic acids, quercetin, myricetin, kaempferol, and daidzein (an isoflavone) [50].
3.7. Real Sample Analisys—Voltametric and Spectrophotometric
The aqueous extract solutions are analyzed using the proposed electroanalytical and spectrophotometric methods. For electroanalytical method, the samples were filtered and 1.0 mL of the extract was added directly to the electrolyte. The gallic acid concentration in the extracts was determined using the standard addition method with a gallic acid standard solution of known concentration. For spectrophotometric analysis we perform the FC and FRAP method. The mean value of the concentration of the unknown sample was determined on the basis of three consecutive measurements. All results, voltammetric and spectrophotometric, for the plant seed samples are shown in Table 1. The comparison of the results for the extracts of the real samples shows that the results obtained with the voltammetric method are in agreement with the FC method, with an error of 5–12% depending on the concentration of total phenols. The extract from sunflower seeds has the highest value of total phenols and antioxidant activity. The slightly higher total phenol content detected with the SWV compared to the Folin–Ciocalteu assay may be attributed to the broader range of electroactive species detected within the applied potential window, including co-oxidisable phenols and antioxidants that may not fully react with the Folin reagent. In addition, the higher sensitivity and direct detection of oxidation currents in the SWV may lead to slightly higher gallic acid equivalent values than with the colorimetric method.
The antioxidant activity detected by FRAP follows the increase in total phenols obtained by FC method. The obtained results suggest that the phenols contribute to the antioxidant activity of the samples and show the agreement between the quantification of the phenols and the evaluation of the antioxidant activity.
3.8. Correlation Between Voltammetric and Spectrophotometric Methods
According to the results obtained and the analysis summarized in Table 1, we can conclude that modern voltammetric methods allow a large number of samples to be analyzed in a short time with sensitive, cheap, and easy-to-use equipment. Voltammetric methods can be effectively used for the determination of total phenolic compounds due to the electroactive nature of phenols, which are easily oxidized at the electrode surface. Phenolic compounds are electrochemically oxidized at certain potentials. By applying a voltage sweep and measuring the resulting current, the phenolic content can be detected and quantified based on the peak current (related to the concentration) and the peak potential (related to the type of phenolic and other bioactive compound) [51]. Some limitations of spectrophotometric methods can be overcome with voltammetric methods, such as lower sensitivity compared to voltammetry, interference from sample color/turbidity, the sometimes-required reagent preparation, and often-required extraction steps. Limitations of voltammetric methods, such as electrode fouling due to phenol polymerization or matrix effect, can be overcome by carefully performed measurements, appropriate modifications, and optimization of the method.
The SWV method, validated by the SP method for total phenols, gives a correlation coefficient of 0.9301, which was obtained by dividing the column’s total phenol content according to the FC method and gallic acid content according to the SWV method from Table 1. The result is constant and confirms the possibility of using this method for the determination of total phenols. In contrast, the correlation coefficient as a comparison between the antioxidant activity according to the FRAP method and the gallic acid content according to the SWV method, also from Table 1, does not show a constant value either for shorter or longer periods of time, which indicates a major influence of other non-phenolic compounds that cannot be detected with this electrochemical method.
The aim of further research into the application of electrochemical methods is to further develop and validate the proposed method and to emphasize its simplicity, sensitivity, reliability, and speed. Today’s devices for potentiometric measurements are of practical size, and the sample preparation itself is very simple and fast. Such a method would certainly be suitable for analysis in industry.
4. Conclusions
Four different types of bismuth-based electrodes have been produced: SWCNT with bismuth (SWCNT/Bi) or bismuth (III) oxide (SWCNT/Bi2O3) and bismuth or bismuth (III) oxide electrodeposited on a glassy carbon electrode (ELF/Bi and ELF/Bi2O3). A significant dependence of the electrochemical behavior of gallic acid on the modified electrodes with respect to pH was observed.
Surface-active carbon nanotubes facilitate the adsorption and accumulation of gallic acid and significantly enhance its oxidation signal. The addition of Bi2O3 to the carbon nanotubes further improves the electron transfer for the oxidation reactions of gallic acid. SWCNT/Bi2O3 proved to be the most optimal system for the determination of gallic acid.
The SWV of gallic acid with SWCNT/Bi2O3 electrode provided reliable and accurate results and proved to be suitable for the quantitative determination of gallic acid. Proposed protocol, using the SWCNT/Bi2O3 sensor, provided wide linearity, with sensitivity of 12.5, 2.35, and 0.385 µA µmol−1 dm3 for the low, middle, and high concentration ranges, respectively. The LOD was estimated to be 0.06 μmol dm−3.
The aqueous extract solutions are analyzed using the proposed electroanalytical and spectrophotometric methods. A very high correlation was obtained between the content of phenolic compounds determined by the SWV and SP methods, especially for samples in which GA is the main phenol. Both methods show the highest concentration of gallic acid in sunflower seeds (SP: 154.1 and SWV: 173.51 mg GAE/L).
The results of this work can significantly contribute to the development of a new method for the determination of gallic acid as one of the most important polyphenols, which also represents an advance in the development of voltammetric methods for the determination of the total phenolic content and antioxidant activity of various compounds.
Supplementary Materials
The following supporting information can be downloaded: https://www.mdpi.com/article/10.3390/chemosensors13100369/s1, Table S1: Absorbance values for constructing a measurement curve for Folin-Ciocalteu method, for standard, gallic; Figure S1: Calibration curve for Folin-Ciocalteu method, for standard, gallic acid; Table S2. Absorbance values for constructing a measurement curve for FRAP, for standard solutions Fe2+; Figure S2. Calibration curve for FRAP, for standard solutions Fe2+.
Author Contributions
Conceptualization, methodology, software, validation, formal analysis, and investigation, all authors; resources, data curation, N.V., J.V., and I.Š.R.; writing, N.V., writing—review and editing, all authors; visualization, N.V.; supervision, I.Š.R.; project administration, J.D.; funding acquisition, all authors. All authors have read and agreed to the published version of the manuscript.
Funding
This research received no external funding.
Institutional Review Board Statement
Not applicable.
Informed Consent Statement
Not applicable.
Data Availability Statement
The data presented in this study are available within the content of this article.
Acknowledgments
We are thankful for the scientific research equipment financed by the EU grant, “Functional integration of the University of Split, PMF-ST, PFST and KTF-ST through the development of the scientific and research infrastructure” (KK.01.1.1.02.0018)—(Scanning electron microscope (JEOL JSM-7610F Plus) and UV-VIS-NIR spectrometer Agilent Cary 4000 UV-VIS).
Conflicts of Interest
The authors declare no conflicts of interest.
Abbreviations
The following abbreviations are used in this manuscript:
| GC, GCE | Glassy carbon, Glassy carbon electrode |
| SWCNT | Single wall carbon nanotube electrode |
| SWCNT/Bi | Bismuth-single wall carbon nanotube electrode |
| SWCNT/Bi2O3 | Bismuth (III) oxide-single wall carbon nanotube electrode |
| ELF/Bi | Electrodeposited bismuth-film electrode |
| ELF/Bi2O3 | Electrodeposited Bi2O3-film electrode |
| SEM | Scanning Electron Microscopy |
| CV | Cyclic voltammetry |
| CA | Chronoamperommetry |
| SWV | Square Wave Voltammetry |
| GA | Gallic acid |
References
- Mohamed, H.M. Screen–printed disposable electrodes: Pharmaceutical applications and recent developments. TrAC Trends Anal. Chem. 2016, 82, 1–11. [Google Scholar] [CrossRef]
- Ahamed, A.; Ge, L.; Zhao, K.; Veksha, A.; Bobacka, J.; Lisak, G. Environmental footprint of voltammetric sensors based on screen–printed electrodes: An assessment towards “green” sensor manufacturing. Chemosphere 2021, 278, 130462. [Google Scholar] [CrossRef]
- Švancara, I.; Prior, C.; Hočevar, S.B.; Wang, J. A Decade with Bismuth Based Electrode in Electroanalysis. Electroanalysis 2010, 22, 1405–1420. [Google Scholar] [CrossRef]
- Švancara, I.; Vytřas, K. Electroanalysis with Bismuth Electrodes: State of the Art and Future Prospects. Chemické Listy. 2006, 100, 90–113. Available online: http://www.chemicke–listy.cz/ojs3/index.php/chemicke–listy/article/view/1949 (accessed on 24 June 2025).
- Krivić, D.; Vladislavić, N.; Buljac, M.; Škugor Rončević, I.; Buzuk, M. An insight into the thin-layer diffusion phenomena within a porous electrode: Gallic acid at a single-walled carbon nanotubes-modified electrode. J. Electroanal. Chem. 2022, 907, 4013–4018. [Google Scholar] [CrossRef]
- Dugeč, J.; Škugor Rončević, I.; Vladislavić, N.; Radić, J.; Buljac, M.; Buzuk, M. The Interpretation of Carbon Nanotubes’ Electrochemistry: Electrocatalysis and Mass Transport Regime in the Apparent Promotion of Electron Transfer. Biosensors 2025, 15, 89. [Google Scholar] [CrossRef]
- Brycht, M.; Burnat, B.; Skrzypek, S. Advanced Electrode Materials Dedicated for Electroanalysis. Materials 2024, 17, 3762. [Google Scholar] [CrossRef]
- Xhanari, K.; Finšgar, M. Recent advances in the modification of electrodes for trace metal analysis: A review. Analyst 2023, 148, 5805–5821. [Google Scholar] [CrossRef]
- Švancara, I.; Mikysek, T.; Sýs, M. Polarography with non–mercury electrodes: A review. Electrochem. Sci. Adv. 2023, 3, e2100205. [Google Scholar] [CrossRef]
- Sýs, M.; Metelka, R.; Korecká, L.; Pokorná, H.; Švancara, I. Comparison of various bismuth film electrodes in simultaneous electrochemical detection of heavy metals for application in quantum dot–linked immunoassays. Monatsh. Chem. 2017, 148, 505–510. [Google Scholar] [CrossRef]
- Zhao, G.; Sedki, M.; Ma, S.; Villarreal, C.; Mulchandani, A.; Jassby, D. Bismuth Subcarbonate Decorated Reduced Graphene Oxide Nanocomposite for the Sensitive Stripping Voltammetry Analysis of Pb(II) and Cd(II) in Water. Sensors 2020, 20, 6085. [Google Scholar] [CrossRef]
- Xing, H.; Zhang, X.; Zhai, S.; Mu, W.; Li, C.; Han, X. Screen–printed electrode containing bismuth/graphene oxide hybrid for simultaneous detection of cadmium and lead ions. J. Electroanal. Chem. 2024, 961, 118222. [Google Scholar] [CrossRef]
- Vladislavić, N.; Buzuk, M.; Brinić, S.; Buljac, M.; Bralić, M. Morphological characterization of ex situ prepared bismuth film electrodes and their application in electroanalytical determination of the biomolecules. J. Solid State Electrochem. 2016, 20, 2241–2250. [Google Scholar] [CrossRef]
- Zhang, Z.; Li, M.; Zhai, L.; Wu, J.; Li, L. Photoelectrochemical sensing of glutathione using bismuth vanadate (BiVO4) decorated with polyaniline (PANI) and cadmium sulfide (CdS). Anal. Methods. 2023, 15, 969–978. [Google Scholar] [CrossRef]
- Moulaee, K.; Neri, G. Electrochemical Amino Acid Sensing: A Review on Challenges and Achievements. Biosensors 2021, 11, 502. [Google Scholar] [CrossRef]
- Vladislavić, N.; Buzuk, M.; Buljac, M.; Kožuh, S.; Bralić, M.; Brinić, S. Sensitive Electrochemical Determination of Folic Acid Using ex–situ Prepared Bismuth Film Electrodes. Croat. Chem. Acta 2017, 90, 231–239. [Google Scholar] [CrossRef]
- Özyurt, V.H.; Avcı, O.; Tepeli–Büyüksünetci, Y.; Anık, Ü. Bismuth film based electrochemical hydroxymethylfurfural sensor. Eur. Food Res. Technol. 2023, 249, 1563–1574. [Google Scholar] [CrossRef]
- Guzsvány, V.; Papp, Z.; Zbiljić, J.; Vajdle, O.; Rodić, M. Bismuth Modified Carbon–Based Electrodes for the Determination of Selected Neonicotinoid Insecticides. Molecules 2011, 16, 4451–4466. [Google Scholar] [CrossRef] [PubMed]
- Chipeture, A.T.; Apath, D.; Moyo, M.; Shumba, M. Multiwalled carbon nanotubes decorated with bismuth (III) oxide for electrochemical detection of antipyretic and analgesic drug paracetamol in biological samples. J. Anal. Sci. Technol. 2019, 10, 22. [Google Scholar] [CrossRef]
- Đurđića, S.; Vukojević, V.; Vlahović, F.; Ognjanović, M.; Švorc, Ľ.; Kalcher, K.; Mutić, J.; Stanković, D.M. Application of bismuth (III) oxide decorated graphene nanoribbons for enzymatic glucose biosensing. J. Electroanal. Chem. 2019, 850, 113400. [Google Scholar] [CrossRef]
- Wu, K.; Yang, P.; Fan, S.; Wu, Y.; Ma, J.; Yang, L.; Zhu, H.; Ma, X.; Gao, H.; Chen, W.; et al. Formation of bismuth nanosheets on copper foam coupled with nanobubble technology for enhanced electrocatalytic CO2 reduction. J. Mater. Chem. A 2024, 12, 33972–33983. [Google Scholar] [CrossRef]
- Meng, F.L.; Zhang, Q.; Liu, K.H.; Zhang, X.B. Integrated Bismuth Oxide Ultrathin Nanosheets/Carbon Foam Electrode for Highly Selective and Energy-Efficient Electrocatalytic Conversion of CO2 to HCOOH. Chem. Eur. J. 2019, 26, 4013–4018. [Google Scholar] [CrossRef]
- Luo, Y.; Chen, J.; Han, N.; Li, Y. Bismuth–Catalyzed Electrochemical Carbon Dioxide Reduction to Formic Acid: Material Innovation and Reactor Design. Acc. Mater. Res. 2025, 6, 462–472. [Google Scholar] [CrossRef]
- Wang, X.; Mahbub, M.A.A.; Das, D.; Schuhmann, W. Design of Bismuth-Based Electrocatalysts for Carbon Dioxide Electroreduction. ChemCatChem 2024, 16, e202400601. [Google Scholar] [CrossRef]
- Siddiqa, A.; Akhter, T.; Faheem, M.; Razzaque, S.; Mahmood, A.; Al–Masry, W.; Nadeem, S.; Hassan, S.U.; Yang, H.; Park, C.H. Bismuth–Rich Co/Ni Bimetallic Metal–Organic Frameworks as Photocatalysts toward Efficient Removal of Organic Contaminants under Environmental Conditions. Micromachines 2023, 14, 899. [Google Scholar] [CrossRef]
- Perumal, S.; Lee, W.; Atchudan, R. A review on bismuth–based materials for the removal of organic and inorganic pollutants. Chemosphere 2022, 306, 135521. [Google Scholar] [CrossRef]
- Li, B.; Gu, M.; Nie, Z.; Shao, Y.; Luo, Q.; Wei, X.; Li, X.; Xiao, J.; Wang, C.; Sprenkle, V.; et al. Bismuth Nanoparticle Decorating Graphite Felt as a High–Performance Electrode for an All–Vanadium Redox Flow Battery. Nano Lett. 2013, 13, 1330–1335. [Google Scholar] [CrossRef]
- Yetiman, S.; Peçenek, H.; Kılıç Dokan, F.; Sanduvaç, S.; Serdar Onses, M.; Yılmaz, E.; Sahmetlioglu, E. Unlocking the Potential of Bismuth–Based Materials in Supercapacitor Technology: A Comprehensive Review. ChemElectroChem 2024, 11, e202300819. [Google Scholar] [CrossRef]
- Penki, T.R.; Valurouthu, G.; Shivakumara, S.; Sethuraman, V.A.; Munichandraiah, N. In–situ Synthesis of Bismuth/Reduced Graphene Oxide Nanocomposites as High Capacity Anode Materials for Mg–ion Battery. New J. Chem. 2018, 42, 5996–6004. [Google Scholar] [CrossRef]
- Naylor, A.J.; Koukharenko, E.; Nandhakumar, I.S.; White, N.M. Surfactant–mediated electrodeposition of bismuthtelluride films and its effect on microstructural properties. Langmuir 2012, 5, 8296–8299. [Google Scholar] [CrossRef]
- Bohannan, E.W.; Jaynes, C.C.; Shumsky, M.G.; Barton, J.K.; Switzer, J.A. Low–temperature electrodeposition of the high–temperature cubic polymorphof bismuth (III) oxide. Solid State Ionics 2000, 131, 97–107. [Google Scholar] [CrossRef]
- Premlatha, S.; Sivasakthi, P.; Ramesh Bapu, G.N.K. Electrodeposition of a 3D hierarchical porous flower-like cobalt–MWCNT nanocomposite electrode for non-enzymatic glucose sensing. RSC Adv. 2015, 5, 74374–74380. [Google Scholar] [CrossRef]
- Lee, S.J.; Jang, H.; Lee, D.N. Recent advances in nanoflowers: Compositional and structural diversification for potential applications. Nanoscale Adv. 2023, 5, 5165–5213. [Google Scholar] [CrossRef]
- Yuan, C.; Li, H.; Xie, L.; Wang, F.; Deng, H.; Chang, F.; Sun, Y. Flower-like NiO nanostructures synthesized by electrodeposition method for efficient detection of toluene gas. RSC Adv. 2015, 5, 92128–92133. [Google Scholar] [CrossRef]
- Zhao, B.A.; Cai, W.F.; Pu, K.B.; Bai, J.R.; Gao, J.Y.; Wang, Y.H. Electrochemical deposition of flower-like nanostructured silver particles with a PVA modified carbon cloth cathode. RSC Adv. 2022, 12, 21793–21800. [Google Scholar] [CrossRef]
- Falahi, S.; Falahi, S.; Zarejousheghani, M.; Ehrlich, H.; Joseph, Y.; Rahimi, P. Electrochemical Sensing of Gallic Acid in Beverages Using a 3D Bio-Nanocomposite Based on Carbon Nanotubes/Spongin-Atacamite. Biosensors 2023, 13, 262. [Google Scholar] [CrossRef]
- Madhusudhana, G.; Manasa, G.; Bhakta, A.K.; Mekhalif, Z.; Mascarenhas, R.J. Bismuth-Nanoparticles Decorated Multi-Wall-Carbon-Nanotubes Cast-Coated on Carbon Paste Electrode: An Electrochemical Sensor for Sensitive Determination of Gallic Acid at Neutral pH. Mater. Sci. Energy Technol. 2020, 3, 174–182. [Google Scholar] [CrossRef]
- Knežević, S.; Ognjanović, M.; Dojčinović, B.; Antić, B.; Vranješ-Đurić, S.; Manojlović, D.; Stanković, D.M. Sensing Platform Based on Carbon Paste Electrode Modified with Bismuth Oxide Nanoparticles and SWCNT for Submicromolar Quantification of Honokiol. Food Anal. Methods 2022, 15, 856–867. [Google Scholar] [CrossRef]
- Selvi, S.V.; Krishnapandi, A.; Damastuti, R.; Prasannan, A.; Liang, S.T.; Hong, P.D.; Kim, S.C. Effectively Reinforced α-Bi2O3 MPs/PDA-RGO Sensor for Selective Modality Sensing of a Hazardous Phenolic Compound. J. Agric. Food Chem. 2023, 27, 20563–20574. [Google Scholar] [CrossRef]
- Škugor Rončević, I.; Buzuk, M.; Dugeč, J.; Franjić, T.; Vladislavić, N. Modeling of Microwave Extraction of Total Phenols and Antioxidant Activity of Rosemary (Rosmarinus Officinalis L.). Croat. Chem. Acta 2025, 98, 1–9. [Google Scholar] [CrossRef]
- Škugor Rončević, I.; Skroza, D.; Vrca, I.; Kondža, A.M.; Vladislavić, N. Development and Optimization of Electrochemical Method for Determination of Vitamin C. Chemosensors 2022, 10, 283. [Google Scholar] [CrossRef]
- Pise, M.; Muduli, M.; Chatterjee, A.; Kashyap, B.P.; Singh, R.N.; Tatiparti, S.S.V. Instantaneous-Progressive nucleation and growth of palladium during electrodeposition. Results Surf. Interfaces 2022, 6, 100044. [Google Scholar] [CrossRef]
- Chikere, C.O.; Hobben, E.; Faisal, N.H.; Kong-Thoo-Lin, P.; Fernandez, C. Electroanalytical determination of gallic acid in red and white wine samples using cobalt oxide nanoparticles-modified carbon-paste electrodes. Microchem. J. 2021, 160, 105668. [Google Scholar] [CrossRef]
- Souza, L.P.; Calegari, F.; Zarbin, A.J.G.; Marcolino-Júnior, L.H.; Bergamini, M.F. Voltammetric Determination of the Antioxidant Capacity in Wine Samples Using a Carbon Nanotube Modified Electrode. J. Agric. Food Chem. 2011, 59, 7620–7625. [Google Scholar] [CrossRef]
- Tashkhourian, J.; Nami-Ana, S.F. A sensitive electrochemical sensor for determination of gallic acid based on SiO2 nanoparticle modified carbon paste electrode. Mat. Sci. Eng. C 2015, 52, 103–110. Available online: http://linkinghub.elsevier.com/retrieve/pii/S092849311500199X (accessed on 15 June 2025). [CrossRef]
- Vasić, M.; Šljukić, B.; Wildgoose, G.G.; Compton, R.G. Adsorption of bismuth ions on graphite chemically modified with gallic acid. Phys. Chem. Chem. Phys. 2012, 14, 10027–10031. [Google Scholar] [CrossRef]
- Esmaeilzadeh Kenari, R.; Razavi, R. Phenolic profile and antioxidant activity of free/bound phenolic compounds of sesame and properties of encapsulated nanoparticles in different wall materials. Food Sci. Nutr. 2022, 9, 525–535. [Google Scholar] [CrossRef]
- Özcan, M.M.; Yılmaz, F.G.; Uslu, N.; Kulluk, D.A.; Dursun, N.; Yılmaz, H. Determination of bioactive compounds, phenolic contents, fatty acid and biogenic element profiles of the seeds of sunflower (Helianthus annuus L.) genotypes. Food Humanit. 2024, 2, 100222. [Google Scholar] [CrossRef]
- Żuk, M.; Kulma, A.; Dymińska, L.; Szołtysek, K.; Prescha, A.; Hanuza, J.; Szopa, J. Flavonoid engineering of flax potentiate its biotechnological application. BMC Biotechnol. 2011, 11, 10. [Google Scholar] [CrossRef]
- Balakrishnan, G.; Garg, S.; Ramesh, B.; Rajendran, E.G.M.G.; Rathnakumar, K.A. Comprehensive Review of Phenolic Compounds in Chia Seeds and Their Applications in the Food Industry. Plant Foods Hum. Nutr. 2025, 80, 1–10. [Google Scholar] [CrossRef]
- Šeruga, M.; Novak, I.; Jakobek, L. Determination of polyphenols content and antioxidant activity of some red wines by differential pulse voltammetry, HPLC and spectrophotometric methods. Food Chem. 2011, 124, 1208–1216. [Google Scholar] [CrossRef]
Disclaimer/Publisher’s Note: The statements, opinions and data contained in all publications are solely those of the individual author(s) and contributor(s) and not of MDPI and/or the editor(s). MDPI and/or the editor(s) disclaim responsibility for any injury to people or property resulting from any ideas, methods, instructions or products referred to in the content. |
© 2025 by the authors. Licensee MDPI, Basel, Switzerland. This article is an open access article distributed under the terms and conditions of the Creative Commons Attribution (CC BY) license (https://creativecommons.org/licenses/by/4.0/).

