Abstract
Surface-enhanced Raman scattering (SERS) is highly dependent on the adsorption of target molecules onto metallic surfaces, such as colloidal metallic nanoparticles. The selection of suitable substrates is crucial for optimizing SERS performance. Herein, we investigated the dependence of two pesticide SERS signals, thiabendazole (TBZ) and carbendazim (MBC), on both Ag nanoparticles (reduced by hydroxylamine—AgH or citrate—AgCT) and the aggregation conditions induced by adding different salts (NaCl, KCl or KNO3). In addition to SERS experiments, in order to assess the induced aggregation of the Ag nanoparticles, UV-Vis absorption spectroscopy, dynamic light scattering (DLS) and zeta potential were employed. For AgH, the use of salts did not yield the greatest effect in the presence of TBZ, as only with the pesticide was it possible to achieve the highest aggregation and greater intensity of the SERS signal. In contrast, with the MBC pesticide, the KNO3 salt promoted the greatest aggregation state and was crucial for obtaining the most amplified SERS signal. The thicker coating layer of AgCT prevented the adsorption of both pesticides on the surface of the nanoparticles, which was achievable using salts containing Cl− ions. Additionally, to obtain the SERS signal of MBC with AgCT, besides the presence of chlorinated salts, other adjustments were necessary, such as changing both the pH of the medium (from pH 5.8 to pH 8, for which MBC is in its neutral form) and the laser lines (from 785 to 514.5 nm). These findings demonstrated that although the pesticide molecules belong to the same chemical functional group, their detection was strongly influenced by the surface of the silver nanoparticles and the salts added. This highlights the specific nuances in detection depending on the method of Ag synthesis and the nature of the aggregating agents used.
1. Introduction
Pesticides are extensively applied in several crops, and their persistence in residues of food and ground water has become a risk to health and the environment. These pesticides are applied frequently, becoming saturated in soil and crops. Their frequent application leads to accumulation in soil and crops. Due to their high toxicity and slow degradation [1], it is crucial to monitor and determine the presence of these compounds in soil, food and water samples [2]. Among a wide range of products, the fungicides belonging to benzimidazole groups, such as thiabendazole (TBZ) and carbendazim (MBC), present high-efficiency, broad-spectrum and systemic properties, i.e., they are absorbed and transported to all parts of the plant [3]. Surface-enhanced Raman scattering (SERS) is a technique that conciliates the ability to recognize compounds with sensibility in low concentrations, up to the limit of single molecule detection [4,5]. Signal amplification in SERS primarily arises from both electromagnetic and chemical mechanisms. In the electromagnetic mechanism, the analyte benefits from the near-electrical field of the nanostructure, while the chemical mechanism entails a charge transfer between the analyte and the nanostructure [6]. Among the array of SERS substrates available, colloidal nanoparticles hold prominence, owing to their ease of synthesis, cost-effectiveness and versatility in terms of functionalization and morphology tuning. Further, colloidal AgNPs were selected for this work due to their well-known advantages as SERS substrates, including their strong plasmonic activity, ease of preparation and tunable size and shape [7]. These properties make AgNPs particularly suitable for enhancing Raman signals of analytes like pesticides, which often require high sensitivity for detection at trace levels. Additionally, AgNPs exhibit versatility in interacting with analytes through both electromagnetic and chemical enhancement mechanisms, allowing us to study adsorption phenomena and analyte–surface interactions in detail. Their use also aligns with the goal of optimizing SERS conditions for real-world applications, where scalability and reproducibility are essential.
The efficacy of SERS experiments depends on proximity and affinity between analyte and nanoparticle, emphasizing the critical significance of the chemical properties of the nanoparticle surface. In this regard, a variety of synthesis routes have been developed, resulting in distinct chemical surface properties [8]. Although variations in the growth of colloidal nanoparticles can be observed with different anionic precursors of silver (such as Ag2SO4, AgClO4 or AgNO3) [9], relevant differences can be accessed from the choice of reduction agent. For instance, hydroxylamine hydrochloride, trisodium citrate dihydrate and sodium borohydride have been employed as reduction agents, resulting in differing chemical surface properties of the nanoparticles [10]. The adsorption process is a key point in achieving the SERS effect involving colloidal nanoparticles, as it necessitates the interaction of the analyte with nanoparticles that exhibit an affinity for the chemical surface. This interaction can be facilitated by electrostatic forces or chemical bonds [11,12]. In SERS experiments using colloidal nanoparticles, the use of salts to promote the colloidal aggregation is common. This practice enhances the formation of regions with maximal electric field enhancement, often referred to as “hot-spots”, increasing the SERS signal. Several salts are employed for this purpose, including monovalent, divalent and trivalent cations [13,14]. It has been observed that divalent and trivalent salts induce nanoparticle aggregation at lower concentrations compared to monovalent salts. Notably, Khrushchev et al. [15] report a synergistic effect between divalent cations in the presence of chloride ions to produce higher SERS intensity. Their study demonstrates that chloride ions facilitate the adsorption of malachite green onto the nanoparticle surface, while divalent salts promote more effective colloidal aggregation. In fact, chloride ions are frequently utilized in SERS experiments involving colloidal nanoparticles due to their capacity to “activate” the colloid [10]. However, there is not a consensus regarding the optimal methodology for achieving substantial signal amplification through the combined use of reduction agents (impacting nanoparticle chemical surface) and salts (influencing nanoparticle aggregation). In this study, we investigate the influence of nanoparticle chemical surface properties and the use of the salts NaCl, KCl and KNO3 in SERS experiments involving two pesticides, thiabendazole (TBZ) and carbendazim (MBC). To this end, we have selected two commonly used spherical silver nanoparticles: those reduced using hydroxylamine (referred to as AgH) and those reduced using citrate (referred to as AgCT). Our experiments encompass Raman scattering and UV-Vis extinction spectroscopy techniques, as well as complementary assessments involving dynamic light scattering (DLS) and zeta potential measurements.
2. Materials and Methods
The chemicals TBZ and MBC (Figure 1), hydrochloride hydroxylamine, sodium hydroxide, trisodium citrate trihydrate, NaCl, KCl and KNO3 were of analytical grade and purchased from Sigma-Aldrich (St. Louis, MO, USA). The Milli-Q system provided ultrapure water (18 MΩ.cm resistivity and pH 5.6). TBZ and MBC were dissolved in ethanol stock solutions (1.0 × 10⁻³ mol/L). All experiments with the obtained colloids were performed in an aqueous medium. The stock solutions were prepared in ethanol due to the low solubility of the pesticides in water (less than 10⁻3 mol/L). During measurements, only 1% ethanol was used in the colloids.
Figure 1.
Molecular structures of the pesticides TBZ and MBC.
2.1. AgH and AgCT Synthesis
The protocol for the AgH synthesis was similar to that described by Leopold and Lendl [16]. Briefly, it was prepared as a solution containing 15.4 mg of silver nitrate in 10 mL of ultrapure water. Using an Erlenmeyer flask, 90 mL of ultrapure water, 300 μL of 1.0 mol/L NaOH solution and 10.4 mg of hydroxylamine hydrochloride were added and stirred. A volume of 10 mL of silver nitrate solution (1.0 × 10⁻² mol/L) was added drop-wise to the solution. After the silver nitrate addition, the solution changed the color from transparent to a green-grey aspect, confirming the formation of nanostructures.
The AgCT was prepared using the method described by Adianez Garcia-Leis et al. [17] based on the previously described Lee and Meisel method [18] and here summarized. An amount of 8.5 mg of silver nitrate was added into 50 mL of ultrapure water and placed in a heating device (under reflux). After the boiling process, 1 mL of citrate solution (1% w/v) was added to the nanoparticle formation and maintained for 1 h.
2.2. SERS, UV-Vis, DLS and Zeta Potential Measurements
SERS measurements were performed in a micro-Raman spectrograph Renishaw in-Via model, equipped with a CCD camera. The spectra were recorded using the laser line at 785 nm and diffraction grating with 1200 L/mm or laser line at 514.5 nm and diffraction grating with 1800 L/mm. In both setups, 10 s of integration time and 1 accumulation were applied. The laser power was adjusted accordingly to avoid saturation, and offset correction was applied in the spectra. SERS measurements were performed as follows: 960 μL of the different colloids (AgH or AgCT) was added in a cuvette, and afterwards 40 μL of the salt solution (NaCl, KCl or KNO3, 0.5 mol/L) was added and shaken. The Raman spectra of AgH and AgCT were obtained and are shown in Figure S1. Furthermore, a qualitative identification of the pesticides TBZ and MBC was performed by acquiring Raman spectra of the pesticide powders (Figure S2A,B). Then, 10 μL of the mixture was removed, and then 10 μL of TBZ or MBC in ethanol solution (1.0 × 10⁻³ mol/L) was added. This resulted in 1000 μL of suspension, with a final concentration of 1.0 × 10⁻⁵ mol/L for TBZ or MBC and 2.0 × 10⁻² mol/L of salt (NaCl, KCl or KNO3). The Raman Enhancement Factor (EF) [19] used to quantify the increase in Raman signal intensity on an enhanced surface was determined following the Equation (1)
where ISERS is the Raman intensity measured under SERS conditions, Mads is the number of molecules on the SERS surface contributing to the signal, IRaman is the Raman intensity measured under standard conditions and Nbulk is the number of molecules in the sample contributing to the Raman signal. For this purpose, calculations were performed by comparing the SERS intensity divided by the number of molecules present in the SERS sample, with the Raman intensity (for 10−3 mol/L ethanol solutions of pesticides) divided by the number of molecules present in the Raman sample. The measurements were performed under the same experimental conditions (laser power and accumulation) or by applying the necessary conversions. Equation (1) illustrates how this calculation was performed.
For UV-Vis, DLS and zeta potential measurements, 1 mL of the sample described above was diluted in 2 mL of ultrapure water. The extinction spectra were carried out in a Varian UV-Vis spectrophotometer, model Cary50, in a spectral range between 190 and 1100 nm. The colloidal dispersions were further characterized by DLS and zeta potential at 23 °C using a Malvern Zetasizer Nano ZS90 (Malvern, Worcestershire, UK). Size measurements were performed using a scattered angle of 90◦, and the data were reported as Z-average (per intensity and volume). The voltage for zeta potential was adjusted automatically by the software.
3. Results and Discussion
3.1. SERS of TBZ and MBC Using AgH and Salts
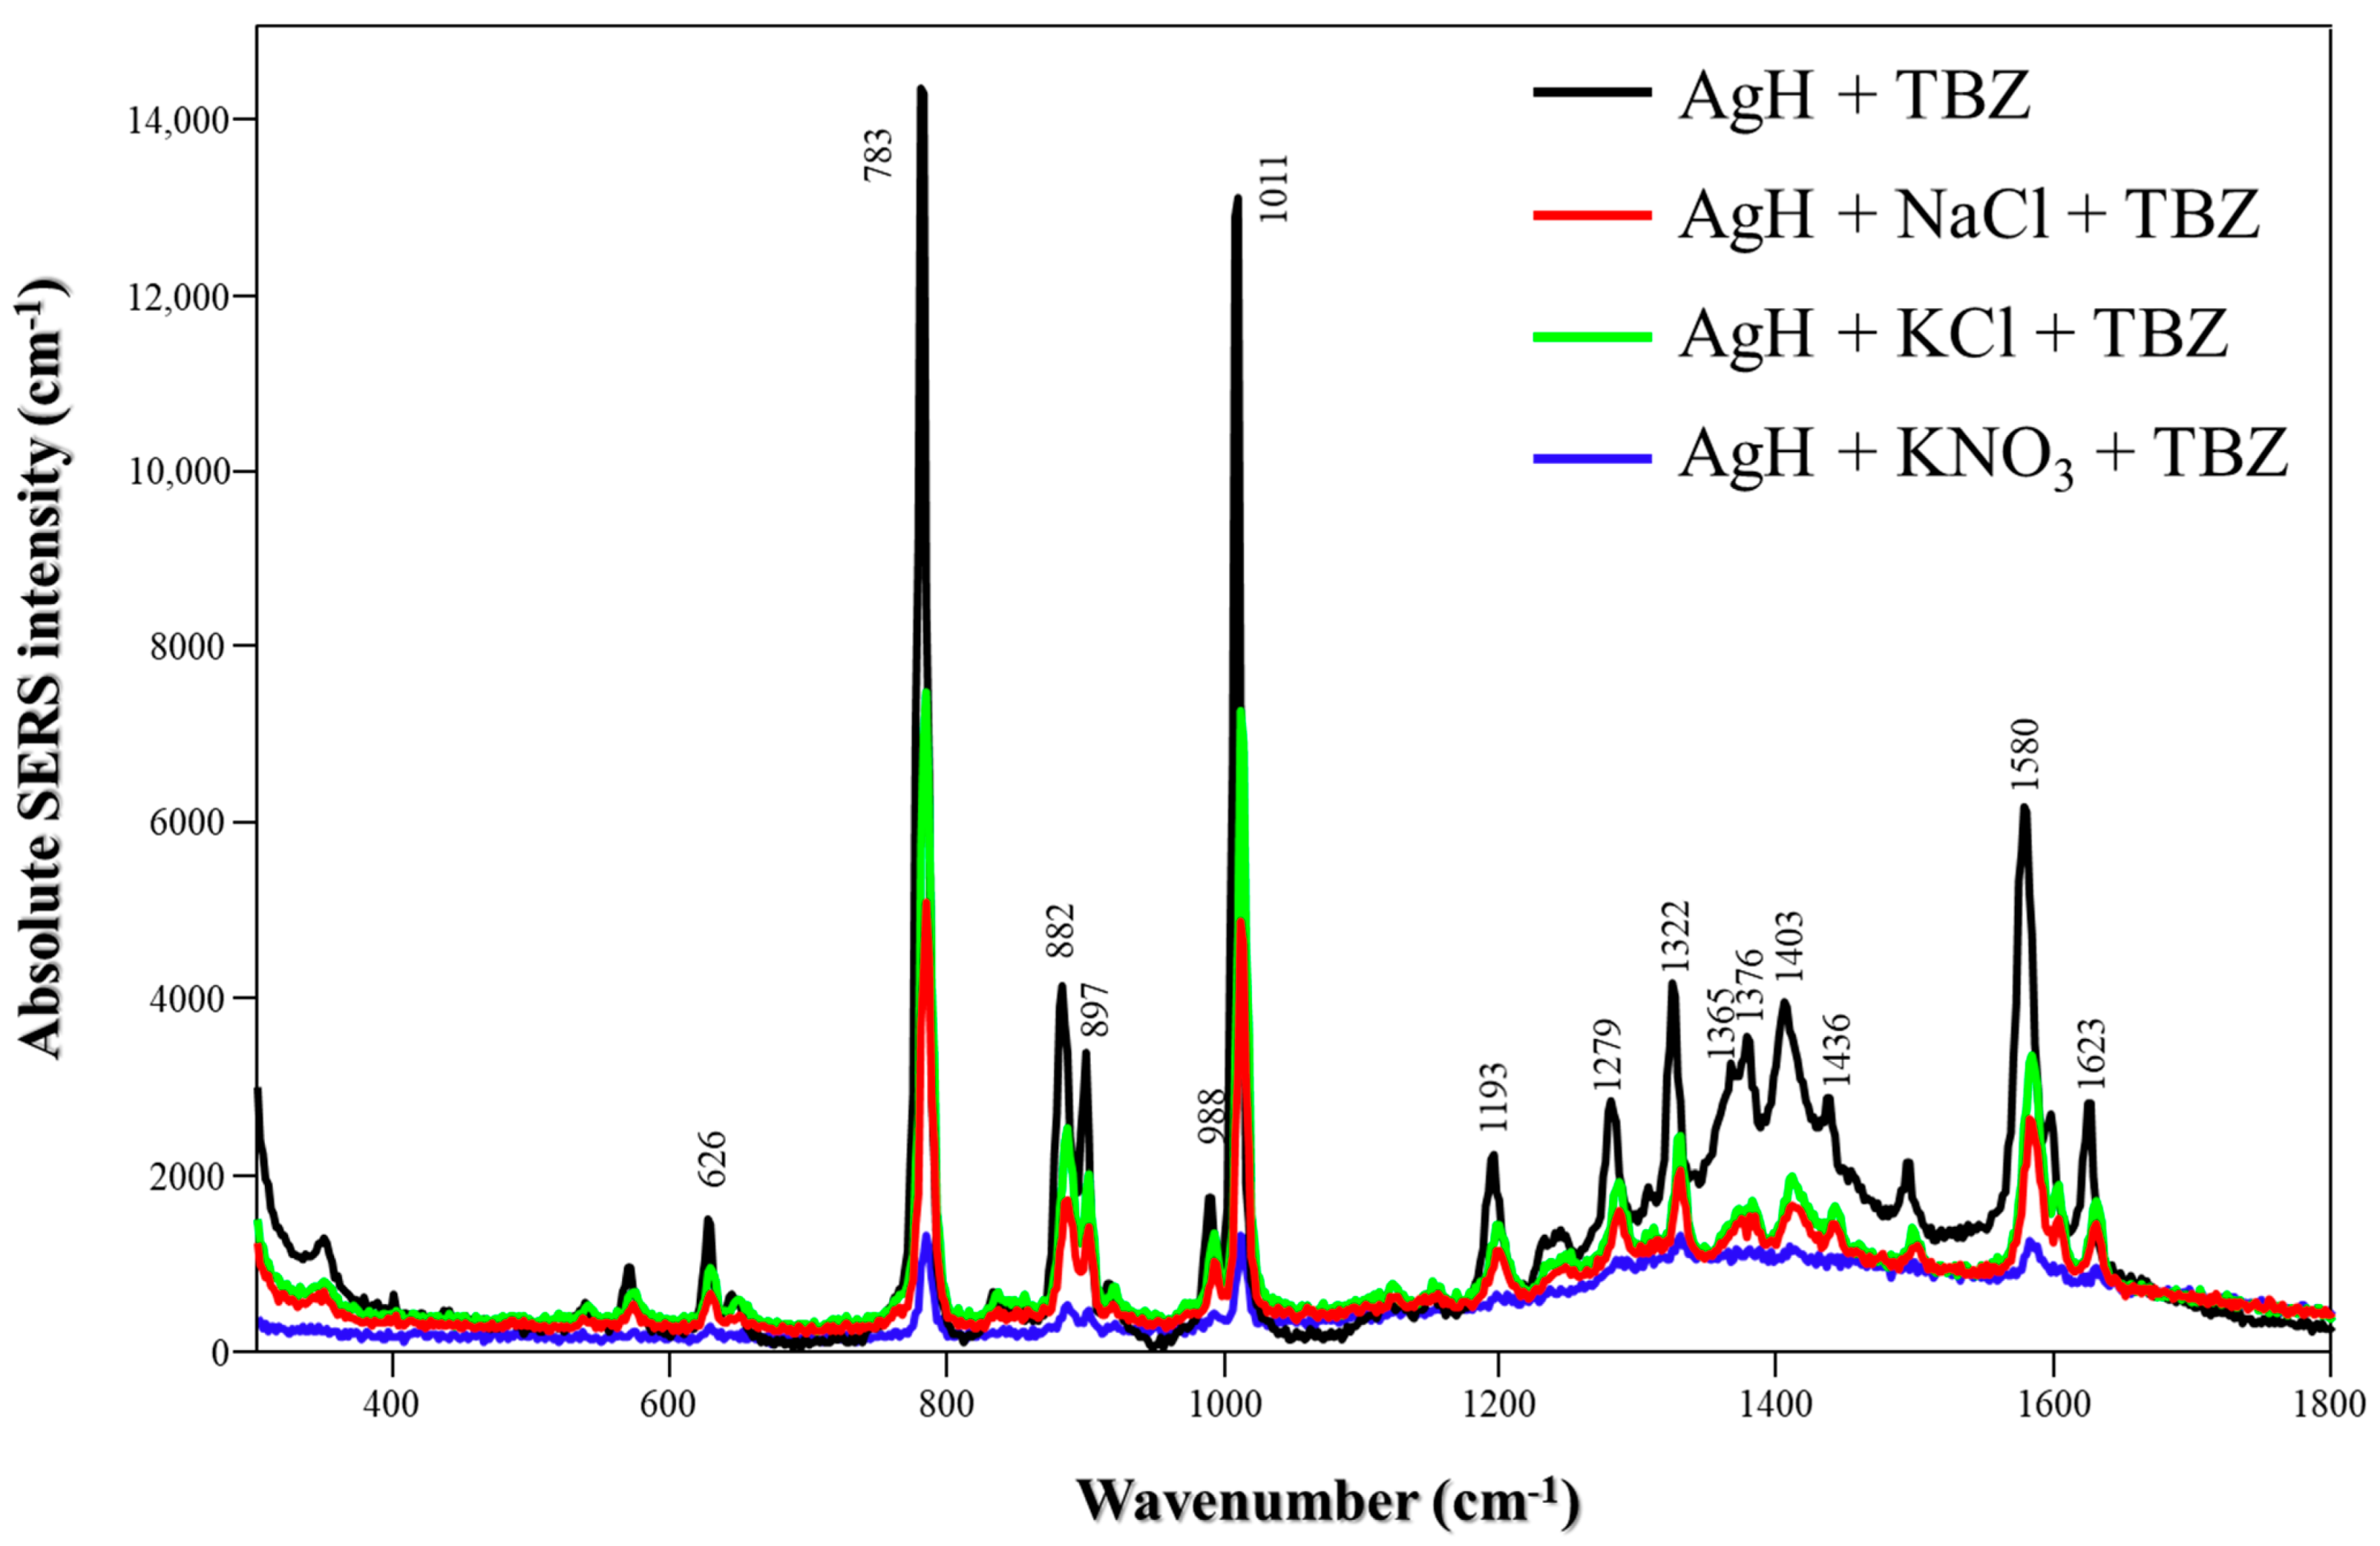
Figure 2 illustrates the absolute SERS spectra of TBZ in the presence of either neat AgH NPs or AgH colloids and salts. The profile spectra are similar to each other and consist of two main peaks at 783 and 1011 cm−1, which are assigned to C-S stretching and C-N stretching, respectively [20]. Also, the peaks at 882 and 897 cm−1 are thiazole features, including the C-S stretching mode and in-plane deformation of the ring [21] at 1580 and 1623 cm−1, assigned to C-C stretching of the benzimidazole moiety [22].

Figure 2.
Absolute TBZ SERS spectra with different salts (NaCl, KCl or KNO3) using AgH NPs at pH 5.8. Laser: 785 nm.
The significant differences were evident in the intensities of the spectra. The highest enhanced signals were achieved using AgH NPs without salts. With the addition of salts, comparable signal intensities could be obtained in the AgH + TBZ + NaCl/KCl systems. Conversely, incorporating KNO3 resulted in the lowest SERS intensity. Overall, the enhancement was strongly correlated with the nanoparticle aggregation level. Although the amplification signal varied depending on the type of salt used (due to its aggregation tendency), no new peaks or changes in the relative peak intensities were observed. Thus, for AgH synthesis, the presence of salts does not significantly affect the adsorption of TBZ onto the nanoparticle surface, in which the S atom of TBZ plays a crucial role in interacting with the Ag surface, as previously demonstrated by Oliveira et al. [23].
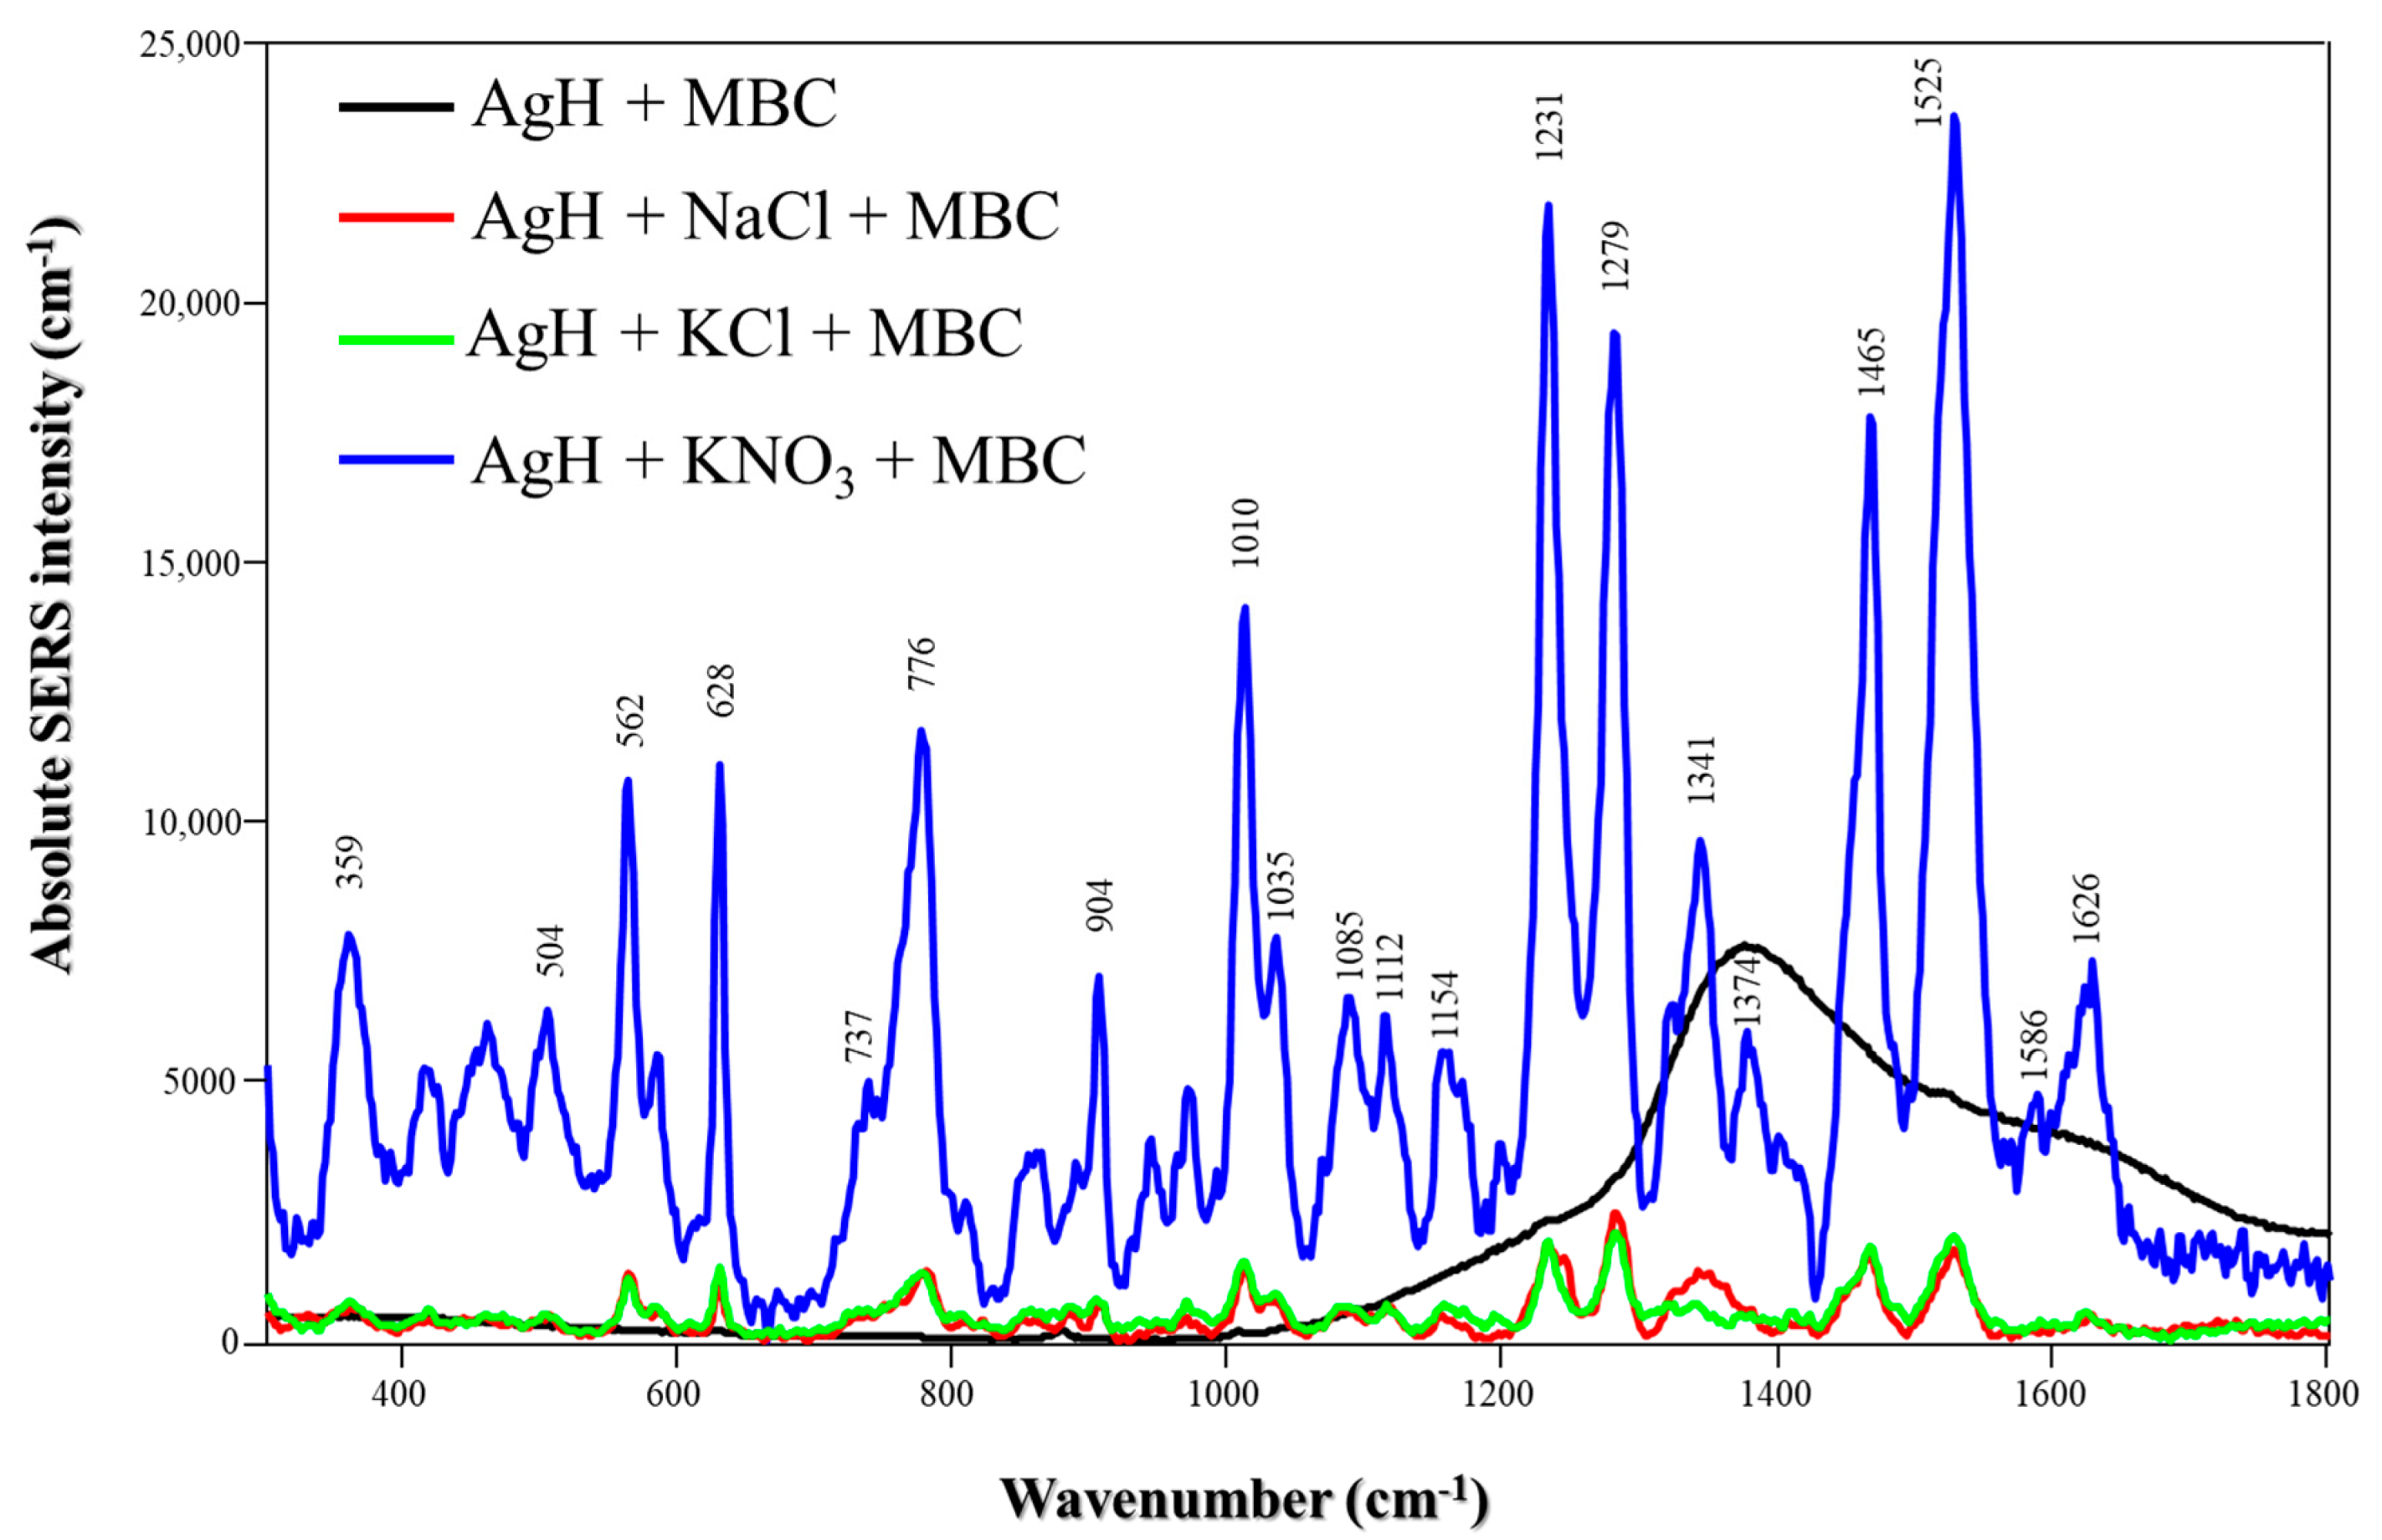
The absolute MBC SERS spectra obtained using AgH and different salts are presented in Figure 3. In contrast to TBZ, MBC does not exhibit characteristic Raman peaks on AgH NPs in the absence of salts. This is probably due to its lower affinity for the NP surface. Using KNO3, the most intense peaks appearing at 1231, 1279, 1465 and 1525 cm−1 are assigned to N-H bending (amine moiety), N-H bending (imidazole moiety), N-H bending (amine moiety) + C-H bending (metyl) and N-H bending (amine moiety), respectively [24]. Also, the less intense peaks at 562, 628 and 1010 cm−1 are attributed to N-H bending (imidazole moiety) + C-H bending (benzene ring), C-C bending (benzene ring) and C-N bending (imidazole moiety) + C-C bending (benzene ring) + C-O-CH3 stretching [24], which is approximately four times higher compared to nanoparticles in the presence of NaCl or KCl. This indicates that KNO3 is the most suitable salt for designing SERS sensors for MBC detection. The influence of salts on the detection of TBZ and MBC was also analyzed using EF calculations (Table S1), which confirmed the same amplification trends observed in the Raman spectra.

Figure 3.
Absolute MBC SERS spectra with different salts (NaCl, KCl or KNO3) using AgH NPs at pH 5.8. Laser: 785 nm.
The influence of salts on Ag nanoparticles was also investigated. Raman spectra of AgH were recorded both with and without NaCl, KCl and KNO3, as shown in Figure S3A. The peak at 240 cm−1, corresponding to Ag-Cl [25,26,27] stretching, was observed in both the neat AgH spectra (due to the chloride ions present from synthesis) and in the presence of all the salts. Furthermore, in the SERS spectra of both TBZ and MBC using AgH (Figure S3B,C), no peak shifts associated with Ag-Cl were observed, regardless of the salt used.
3.2. AgH Aggregation in the Presence of Salts, TBZ and MBC
Figure S4A presents the UV-Vis spectra of AgH nanoparticles added to TBZ in the absence and presence of the salts NaCl, KCl and KNO3. The localized surface plasmon (LSP) peak intensity was centered at 430 nm, typical of the spectra found in the literature [16], ccorresponding to isolated Ag nanoparticles. With the addition of NaCl, KCl or KNO3 to AgH dispersion, the LSP peak decreased, and the extinction intensity at higher wavelengths slightly increased (700–1100 nm), independent of the salt added. Such an effect indicates the formation of small aggregates induced by the salt, without precipitation. The instability of the Ag nanoparticles and precipitation due to colloidal coagulation (bigger aggregates) was observed by Futamata et al. [28] only after the addition of concentrations higher than 50 mM of salt. Under our conditions, the colloid aggregation indicated by the UV-Vis extinction was caused by the addition of NaCl, KCl or KNO3 salts (20 mM) maintaining the colloidal stability.
Complementarily, the formation of aggregates was studied by DLS and zeta potential techniques. AgH dispersion presents two populations with intensities around 10 and 70 nm (Figure S4B), and, according to volume measurements (Figure S5), the hydrodynamic diameter is predominantly around 10 nm. Also, the polydispersity index was 0.301 (Table 1), which is typical from this synthesis, with predominantly spherical nanoparticles [29]. Likewise, verified by UV-Vis spectra, the size distribution confirmed that the presence of the salts does not promote pronounced aggregation (especially in comparison with the aggregation induced by TBZ and MBC pesticides, presented in Figure 2 and Figure 3), with the two populations remaining at 10 and 90 nm. Only slight changes were observed, such as a decrease in the intensity, displacement and enlargement of the distribution band, marked by arrows in Figure S4B. Also, the zeta potential values were not disturbed in the presence of salts, maintaining values between −36 and −38 mV (Table 1).

Table 1.
Polydispersity index and zeta potential of AgH samples at pH 5.8.
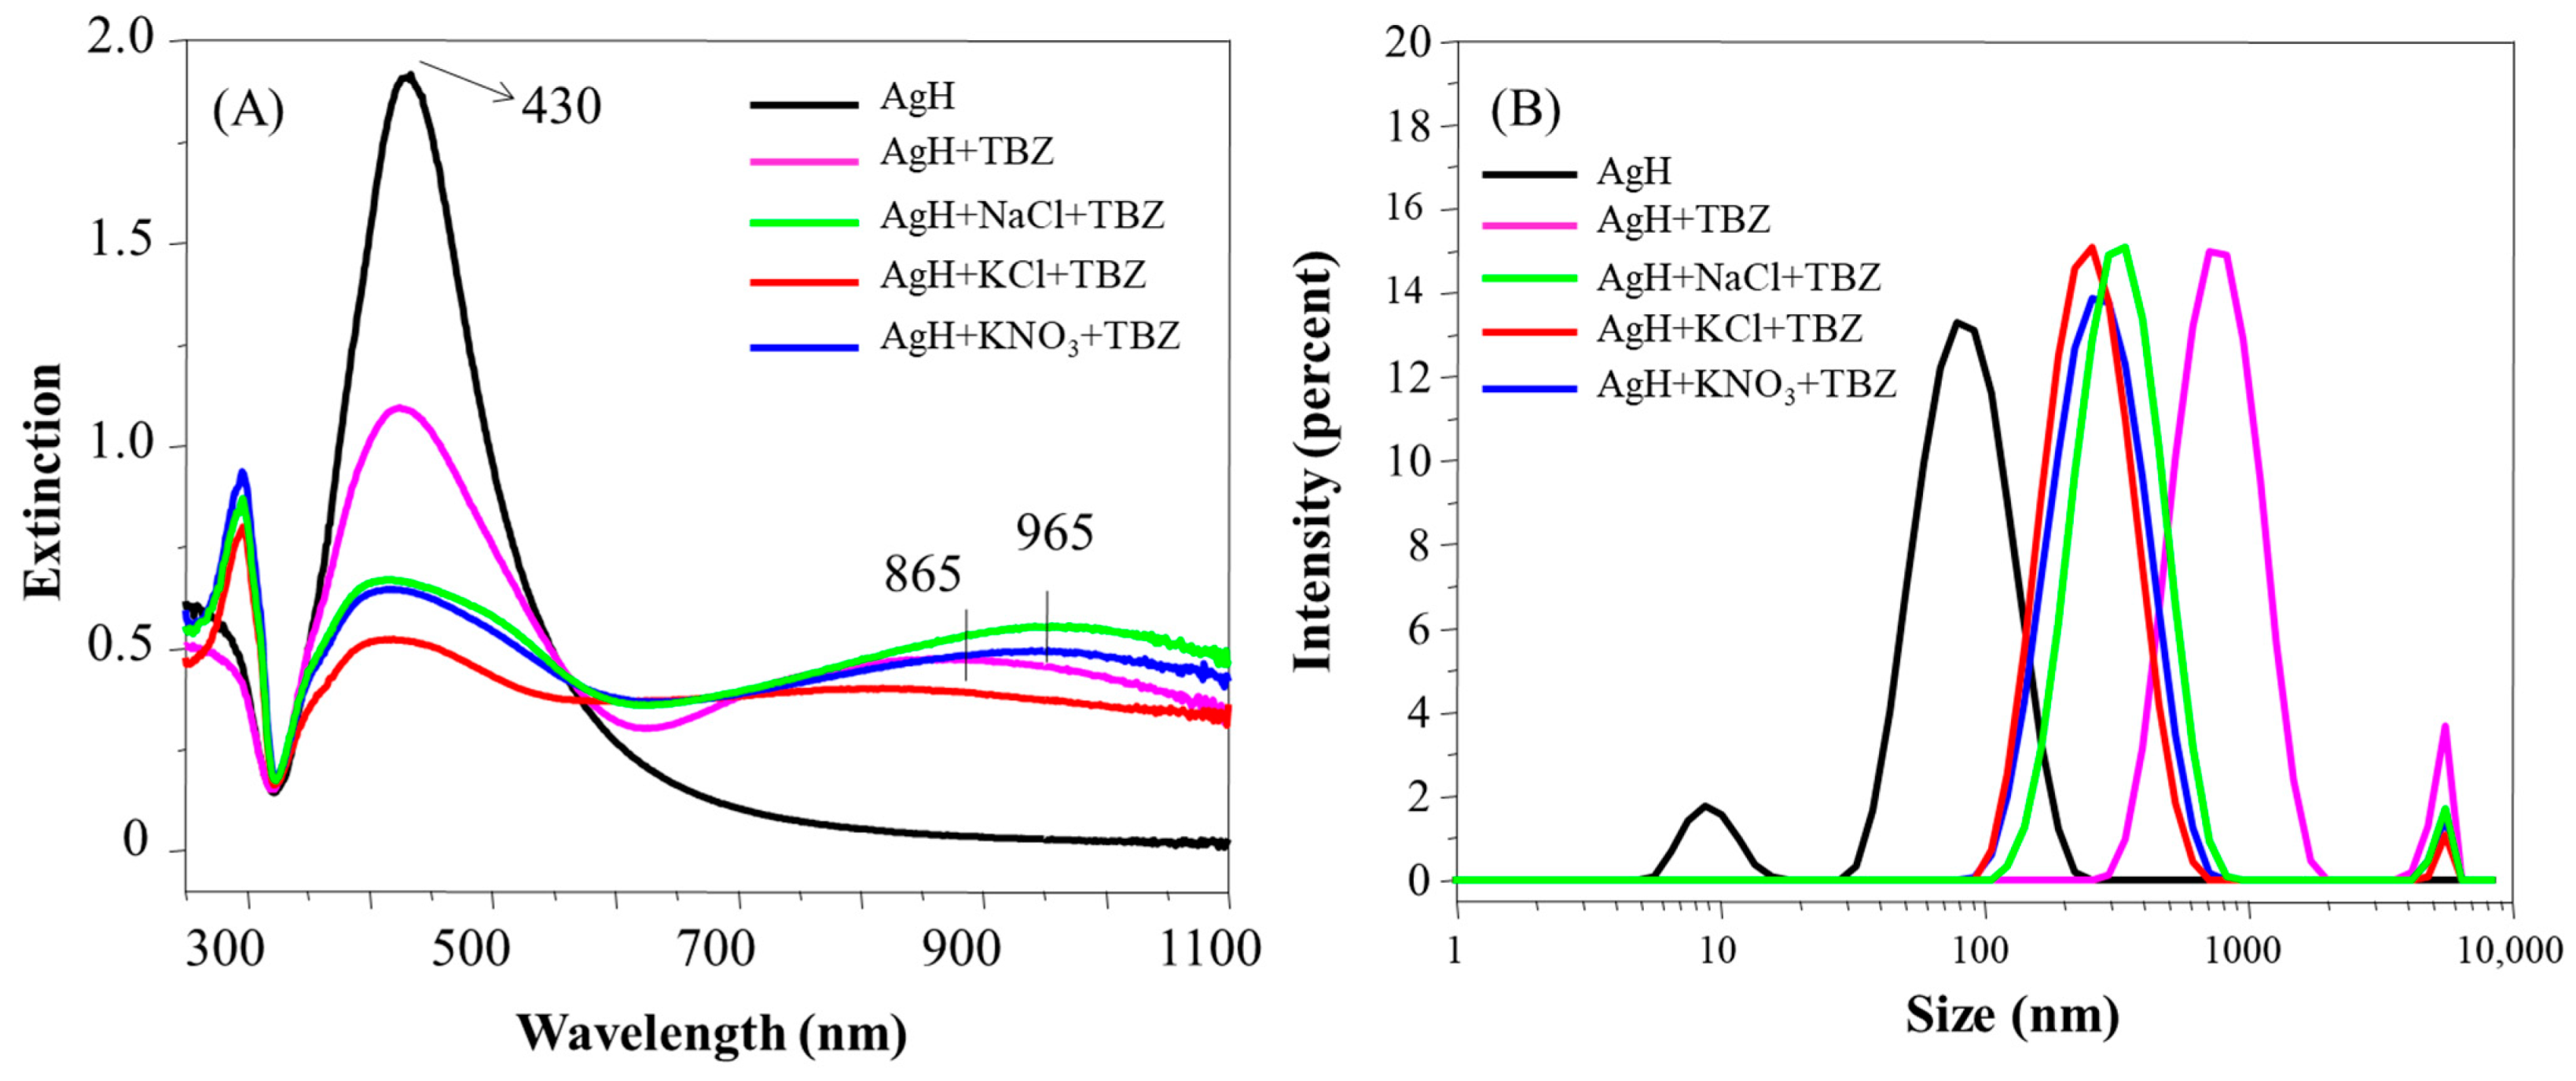
Figure 4A presents the UV-Vis extinction spectra of AgH nanoparticles added to TBZ in the absence and presence of the salts NaCl, KCl and KNO3. The LSP intensity decreased and shifted from 430 nm to 424 nm. Additionally, the joint addition (TBZ + salts) further shifted the LSP band to smaller wavelengths (424 nm). A new band appeared at higher wavelengths (700–1100 nm), attributed to the higher affinity of TBZ to the nanoparticle surface [23], forming coupled LSP of AgH. The formation of AgH + TBZ aggregates was more sensitive to the presence of KCl compared to NaCl and KNO3, following the aggregation tendency of the Hofmeister series. It is also important to stress that, in the presence of the salts, a band emerges at 295 nm, coincident with the band of the neat TBZ solution [30], associated with the TBZ species not adsorbed onto the nanoparticle surface.
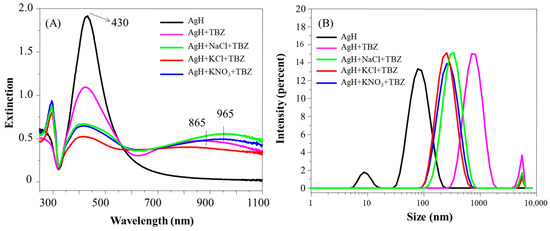
Figure 4.
Extinction spectra (A) and hydrodynamic diameter distribution (B) of AgH with TBZ in the presence and in the absence of the salts NaCl, KCl or KNO3. pH 5.8.
The size distribution of AgH in the presence of either TBZ or TBZ + salts is given in Figure 4B. TBZ was responsible for the disappearance of the population of nanoparticles at 10 nm, indicating the absence of isolated nanoparticles in the AgH + TBZ and AgH + TBZ + salts systems. The larger aggregation was induced after TBZ addition, in either the absence or presence of the salts, which, in some way, seems to modulate the colloidal aggregation. When only TBZ was present, large aggregates were formed (diameter ~1000 nm), while with salts (NaCl, KCl or KNO3), the most were around 300 nm (Figure S4B). The decrease of aggregate size promoted by the presence of salt on the dispersion may be a result of the ion solvation by the dipoles of the TBZ molecules and the reason for the UV band at 295 nm to have emerged (with free TBZ not adsorbed onto the nanoparticle surface). The efficient aggregation of nanoparticles in the presence of TBZ leads to a zeta potential increase from −36 mV of AgH to 13 mV of AgH + TBZ (Table 1). The positive zeta potential values in the presence of TBZ are also maintained when the salts are added. The colloidal stability depends on nanoparticle size and zeta potential, being stable at <−20 mV or >20 mV [31,32]. In our case, the adsorption of TBZ increases the zeta potential, inducing the aggregation.
The changes to the AgH nanoparticle plasmons vary depending on the type of salts added. The KCl salt was responsible for the higher decrease in AgH aggregation, followed by NaCl and KNO3, with the spectra practically overlapping. The different effects can be discussed according to the relation between the Hofmeister series and colloidal particle aggregation [33,34,35]. Basically, the Hofmeister series is a sequence of ions used to explain various scientific phenomena occurring in the presence of salts. In this context, charged particles remain stable or aggregated depending on the salt present in the medium. The typical sequence for colloidal stability [34] is CO32− < SO42− < H2PO4− F− < Cl− < Br− < I− < NO3− < ClO4− < SCN− for anions and N(CH3)4+ < NH4+ < Cs+ < Rb+ < K+ < Na+ < H+ < Ca2+ < Mg2+ for cations. Ordinarily, the negatively charged particles follow the Hofmeister series directly [33]. Further, the cations (counterions) are relevant for negatively charged particles, whereas the anions are relevant for positively charged particles [36]. Therefore, considering the ions used here, it is expected that the KCl salt causes the higher instability of the Ag colloid, promoting the more effective aggregation in the colloids, probably by the influence of K+ ions in the negatively charged AgH.
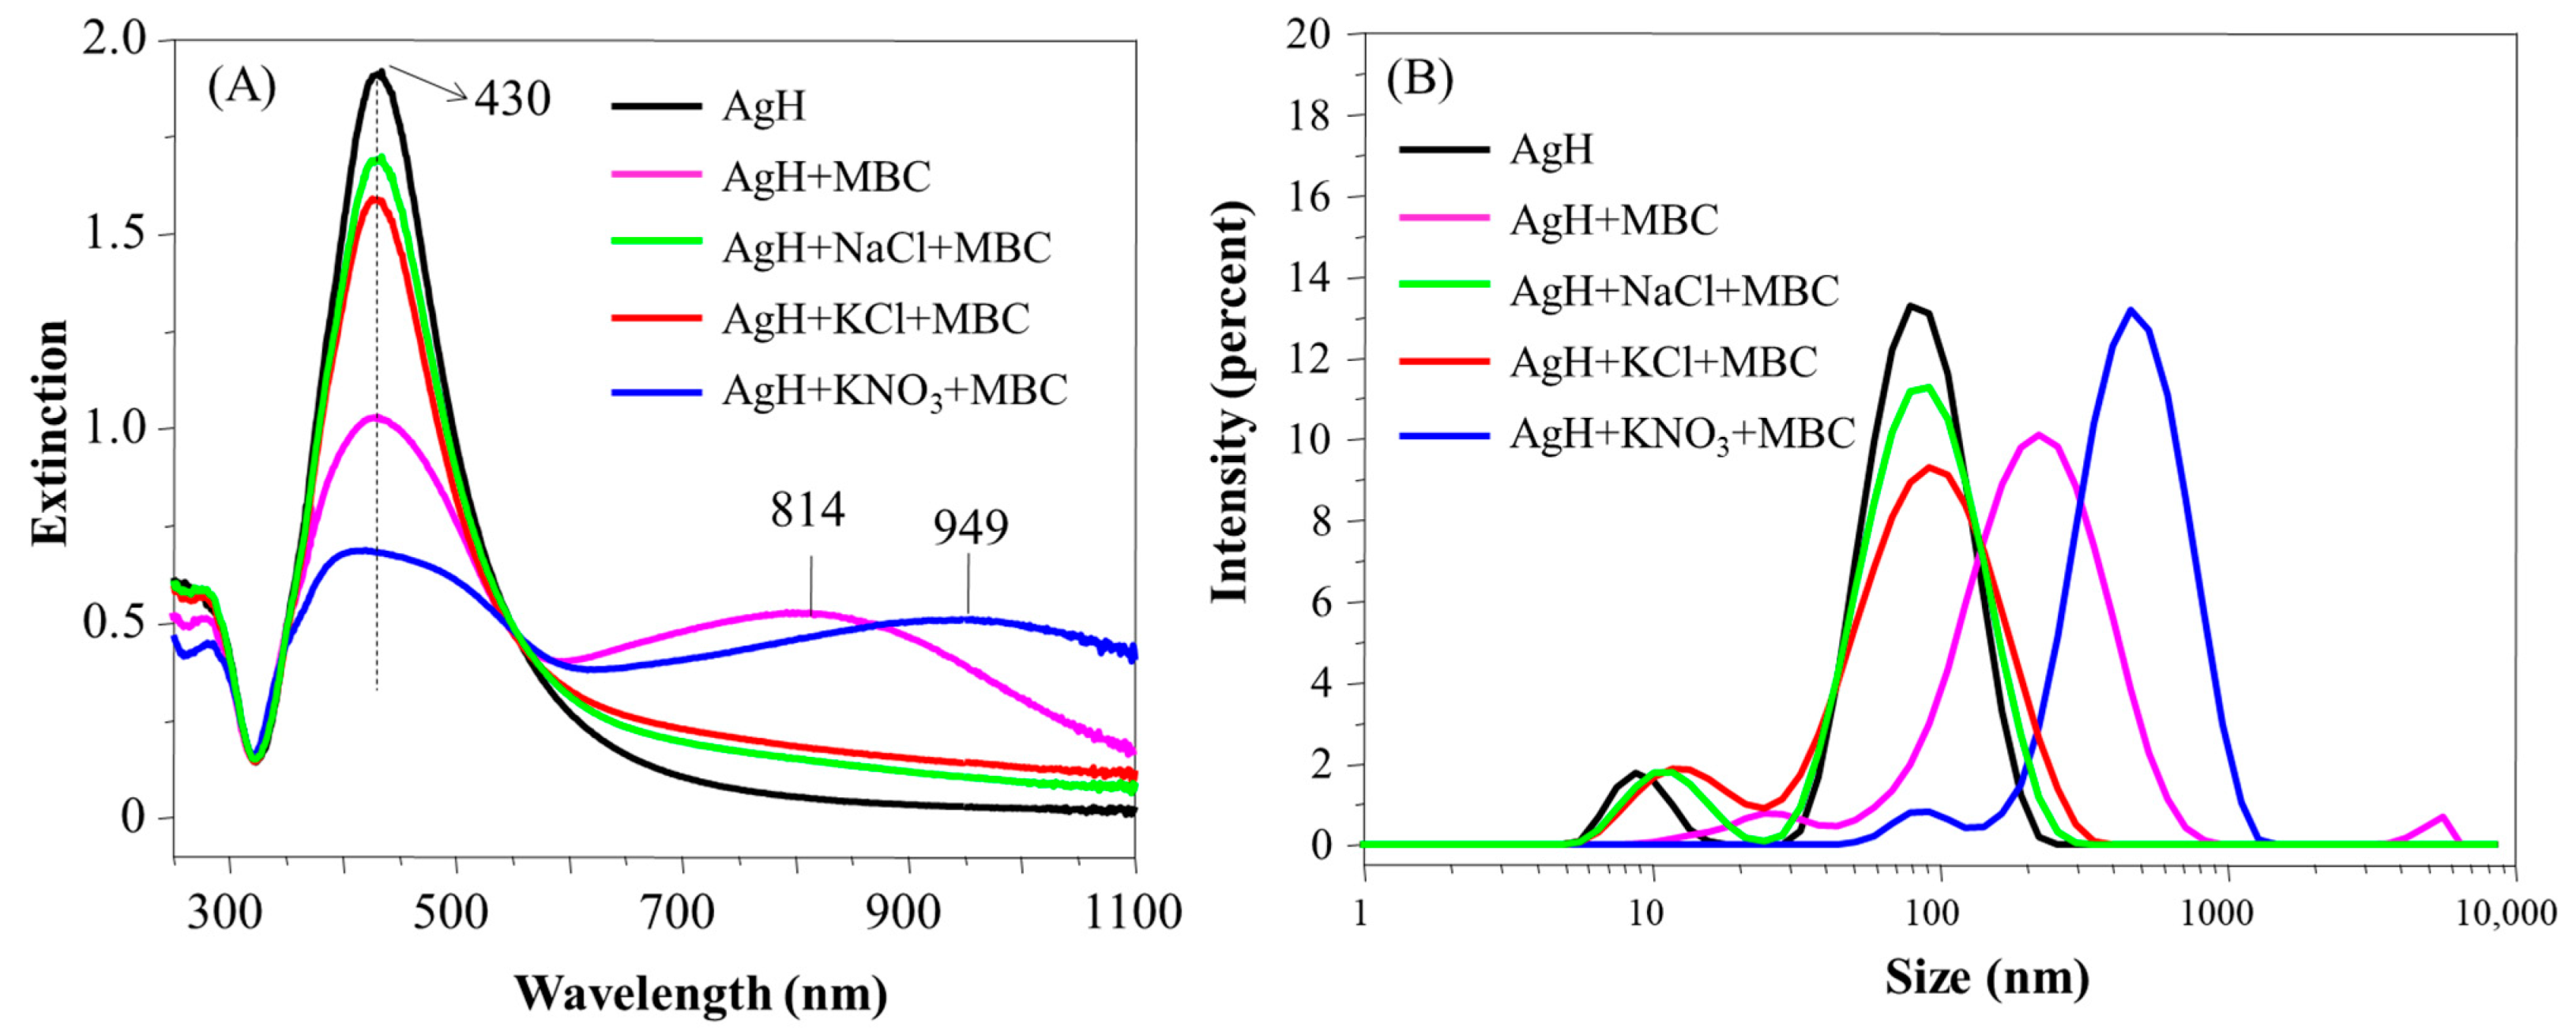
The presence of MBC on AgH colloidal dispersion induced similar TBZ effects in the UV-Vis spectra (Figure 5A), with the decrease of the LSP band and appearance of a new band at 700–1100 nm being more expressive in the AgH + MBC + KNO3 system, which was able to promote the appearance of the LSP band at 405 nm (in addition to 430 nm). Indeed, even the spectral alterations on AgH + MBC (without salt) were more pronounced than when either NaCl or KCl were added to the colloid. The band below 300 nm related to the MBC not adsorbed was not observed [37,38], indicating the poor solvation capability of MBC molecules. By excluding the ionic species studied (as a result of the absence of effects with NaCl and KCl), it can be inferred that the ion NO3−, in conjunction with MBC, promoted the greatest nanoparticle aggregation. López-León et al. [34] stidied the colloidal stability of negative and positive nanoparticles of several ions, including Cl− and NO3−. The authors inferred that the NO3− ions can accumulate more efficiently onto the negative nanoparticle surface that the Cl− ions, attributing such phenomena to the action of dispersion forces at the particle–water interface. In our case, with the accumulation of the NO3− anions near the negative AgH surface, the charge density also increases, which would provide a greater adsorption of the MBC dipoles on the surface of the nanoparticles. The AgH + MCB + KNO3 system favored the formation of the higher aggregates, around 800 nm (Figure 5B), and was also accompanied by a zeta potential increase related to the MBC adsorption onto the nanoparticle surface and increased instability (Table 1).
Figure 5.
Extinction spectra (A) and hydrodynamic diameter distribution (B) of AgH with MBC in the presence and in the absence of the salts NaCl, KCl or KNO3. pH 5.8.
3.3. SERS of TBZ and MBC Using AgCT and Salts
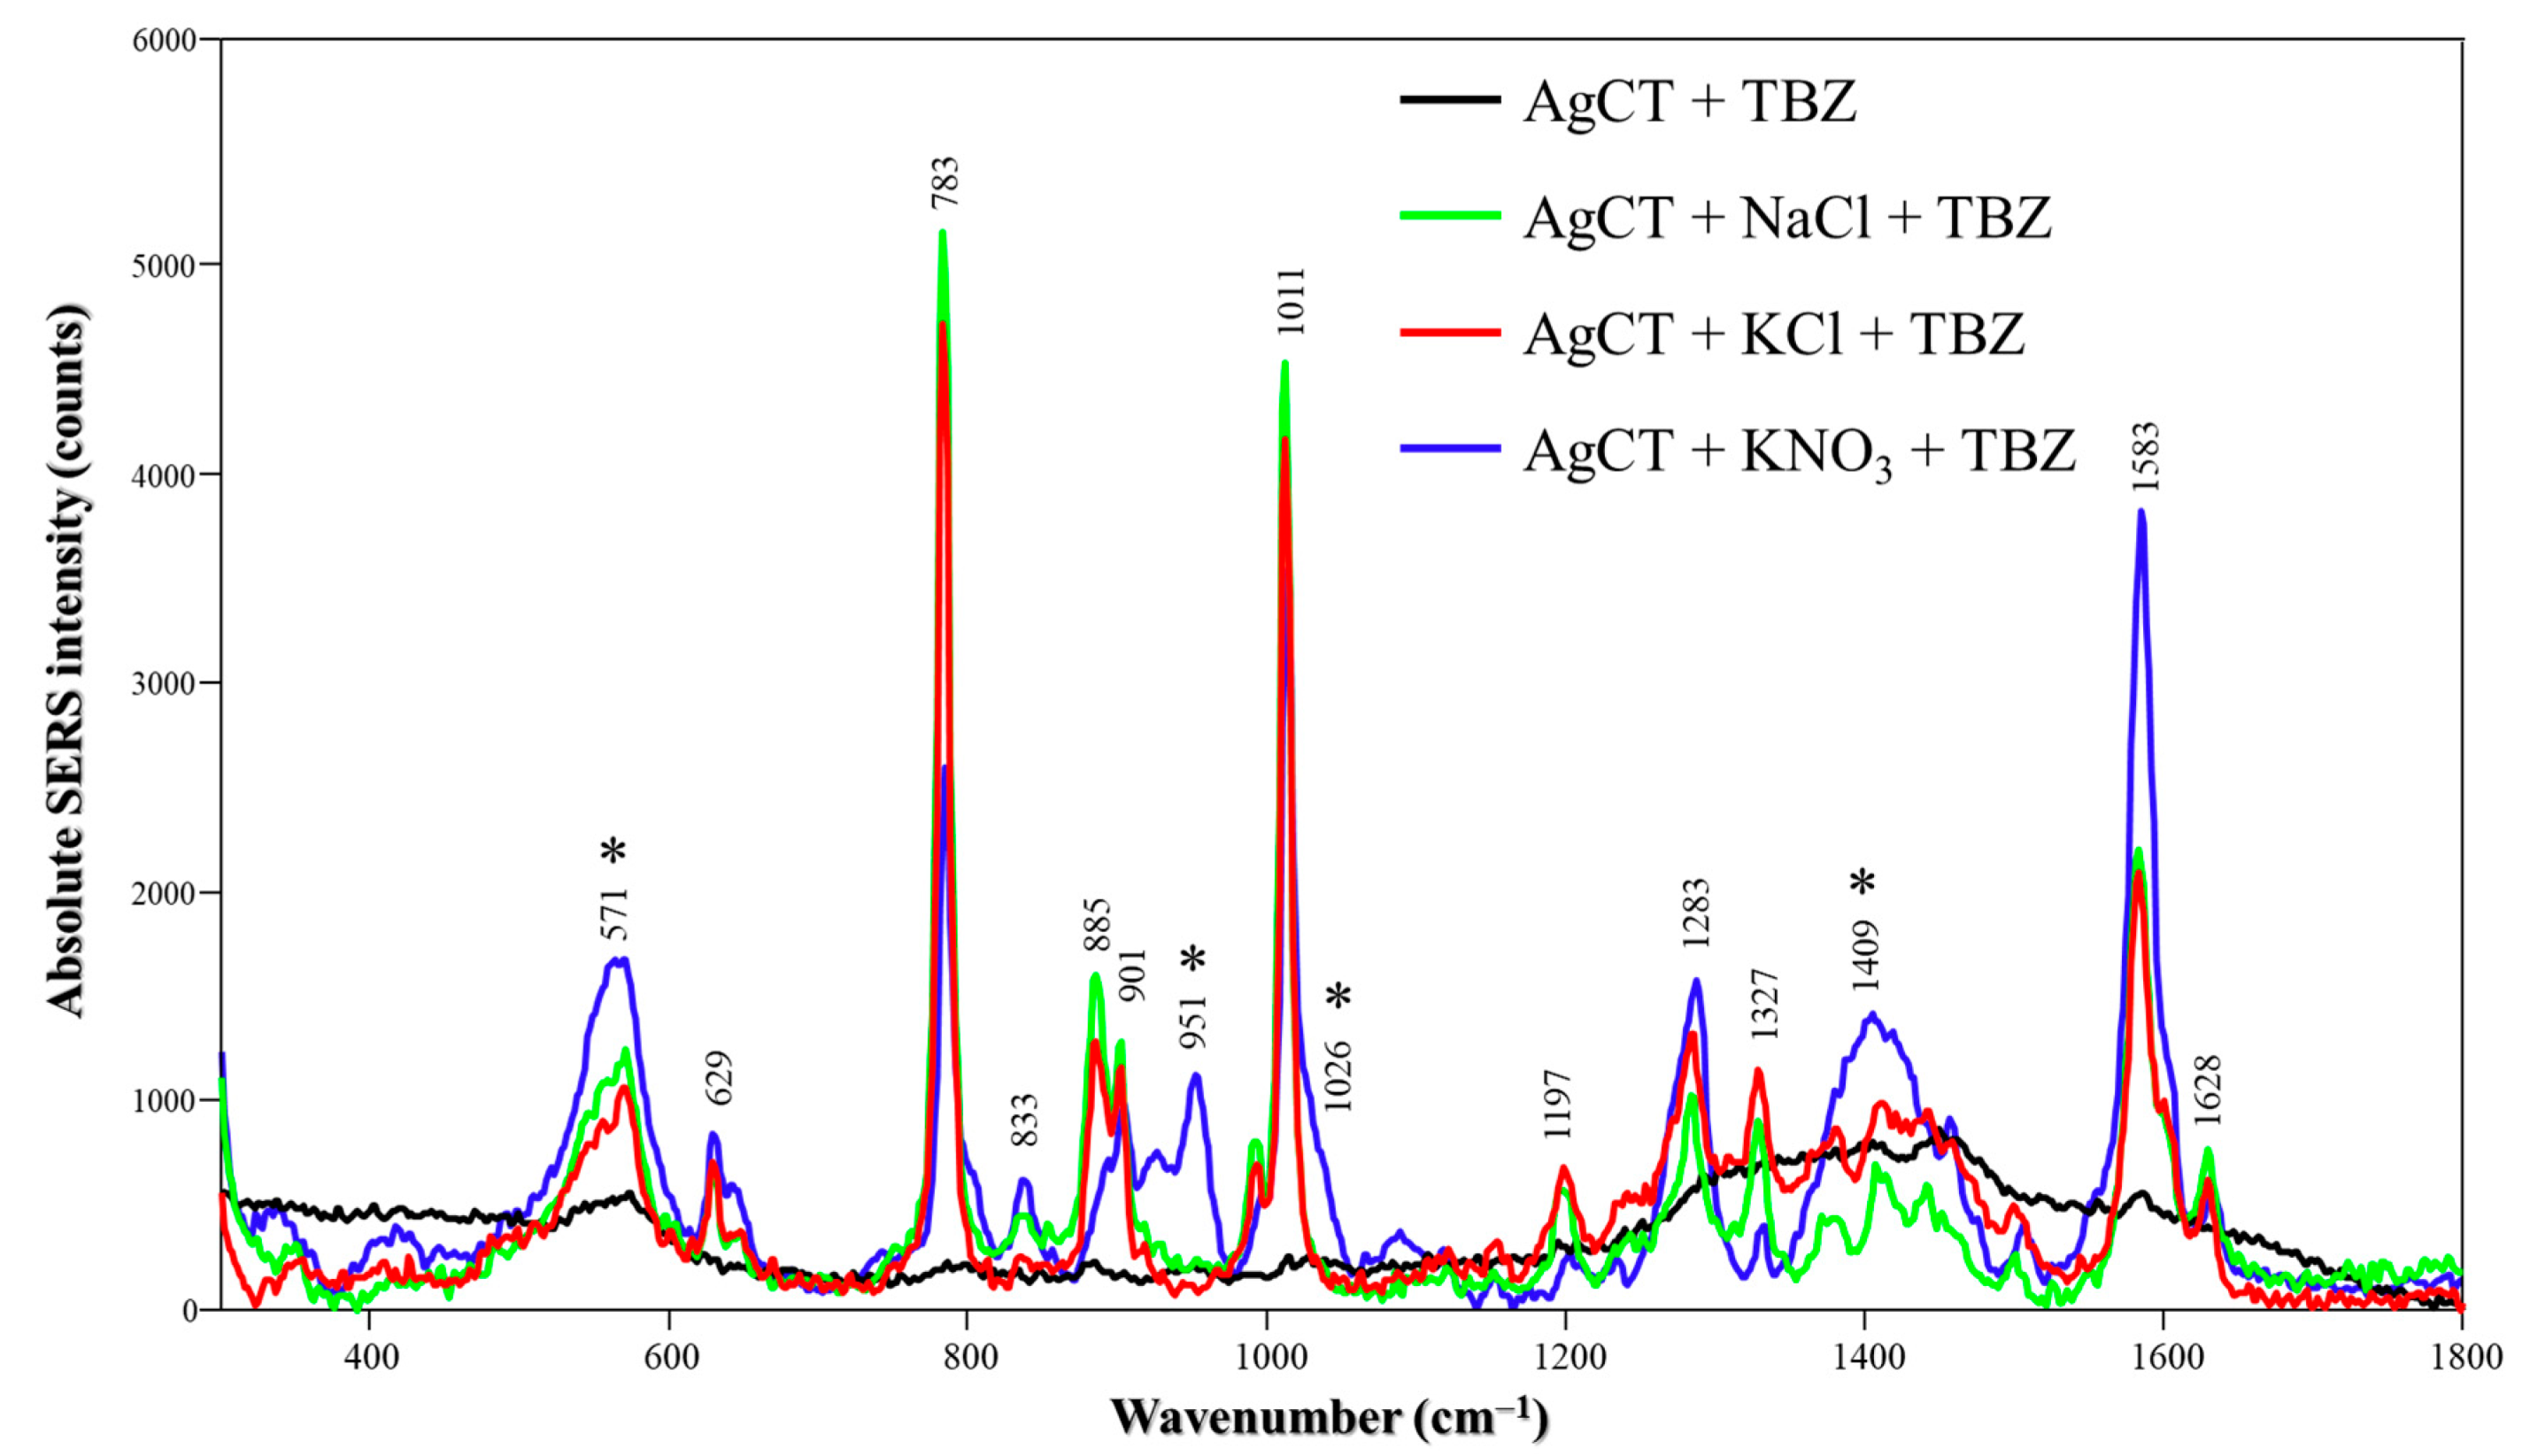
The SERS spectra of TBZ on AgCT NPs are shown in Figure 6. A SERS signal was observed only in the presence of salts. The SERS spectrum displayed a similar spectral profile and peak attributions as observed with AgH; however, some variations were noted depending on the specific salt used. While the peaks seen for TBZ in AgCT/NaCl or KCl are similar to those seen on AgH nanoparticles, the TBZ SERS spectrum under AgCT/KNO3 conditions displays features at 571, 952, 1026 and 1409 cm−1 (marked with asterisks) and also presents the spectra containing only AgCT in presence of KNO3 (Figure S6). The bands are assigned to citrate ions [39] and may indicate that both TBZ and citrate ions adsorb onto the nanoparticle surface when KNO3 is used to activate the system. In contrast, the citrate signal is entirely absent with NaCl or KCl, suggesting that chloride ions are able to replace citrate from the surface. Additionally, the SERS intensity, and consequently the signal-to-noise ratio, using NaCl and KCl salts was higher than with KNO3 as a consequence of the replacement of citrate by chloride ions and the promotion of ionic interactions with positively charged groups in TBZ.

Figure 6.
Absolute TBZ SERS spectra in the absence and presence of different salts (NaCl, KCl or KNO3) using AgCT NPs at pH 5.8. Laser: 785 nm. The asterisks indicate peaks that coincide with the AgCT spectrum exclusively in the presence of KNO3.
For MBC detection using AgCT, the presence of salts in the colloid was not sufficient to obtain a suitable SERS signal (Figure S7), indicating a low affinity of MBC for the AgCT nanoparticle surface. To explore whether other experimental parameters can induce the detection of MBC using AgCT, the laser line at 514.5 nm was employed. In addition, taking advantage our prior findings on the study of the MBC SERS pH range [24], which indicate that the SERS species correspond to the neutral MBC, experiments at pH 8 (neutral form of MBC) were conducted. The change in laser line from 785 to 514.5 nm itself had no impact on the appearance of the SERS signal from the MBC, as demonstrated in Figure S8. The peaks observed from the 1250 to 1750 cm−1 region of the spectra are attributed to by-products or an oxide layer formed during the synthesis [40].
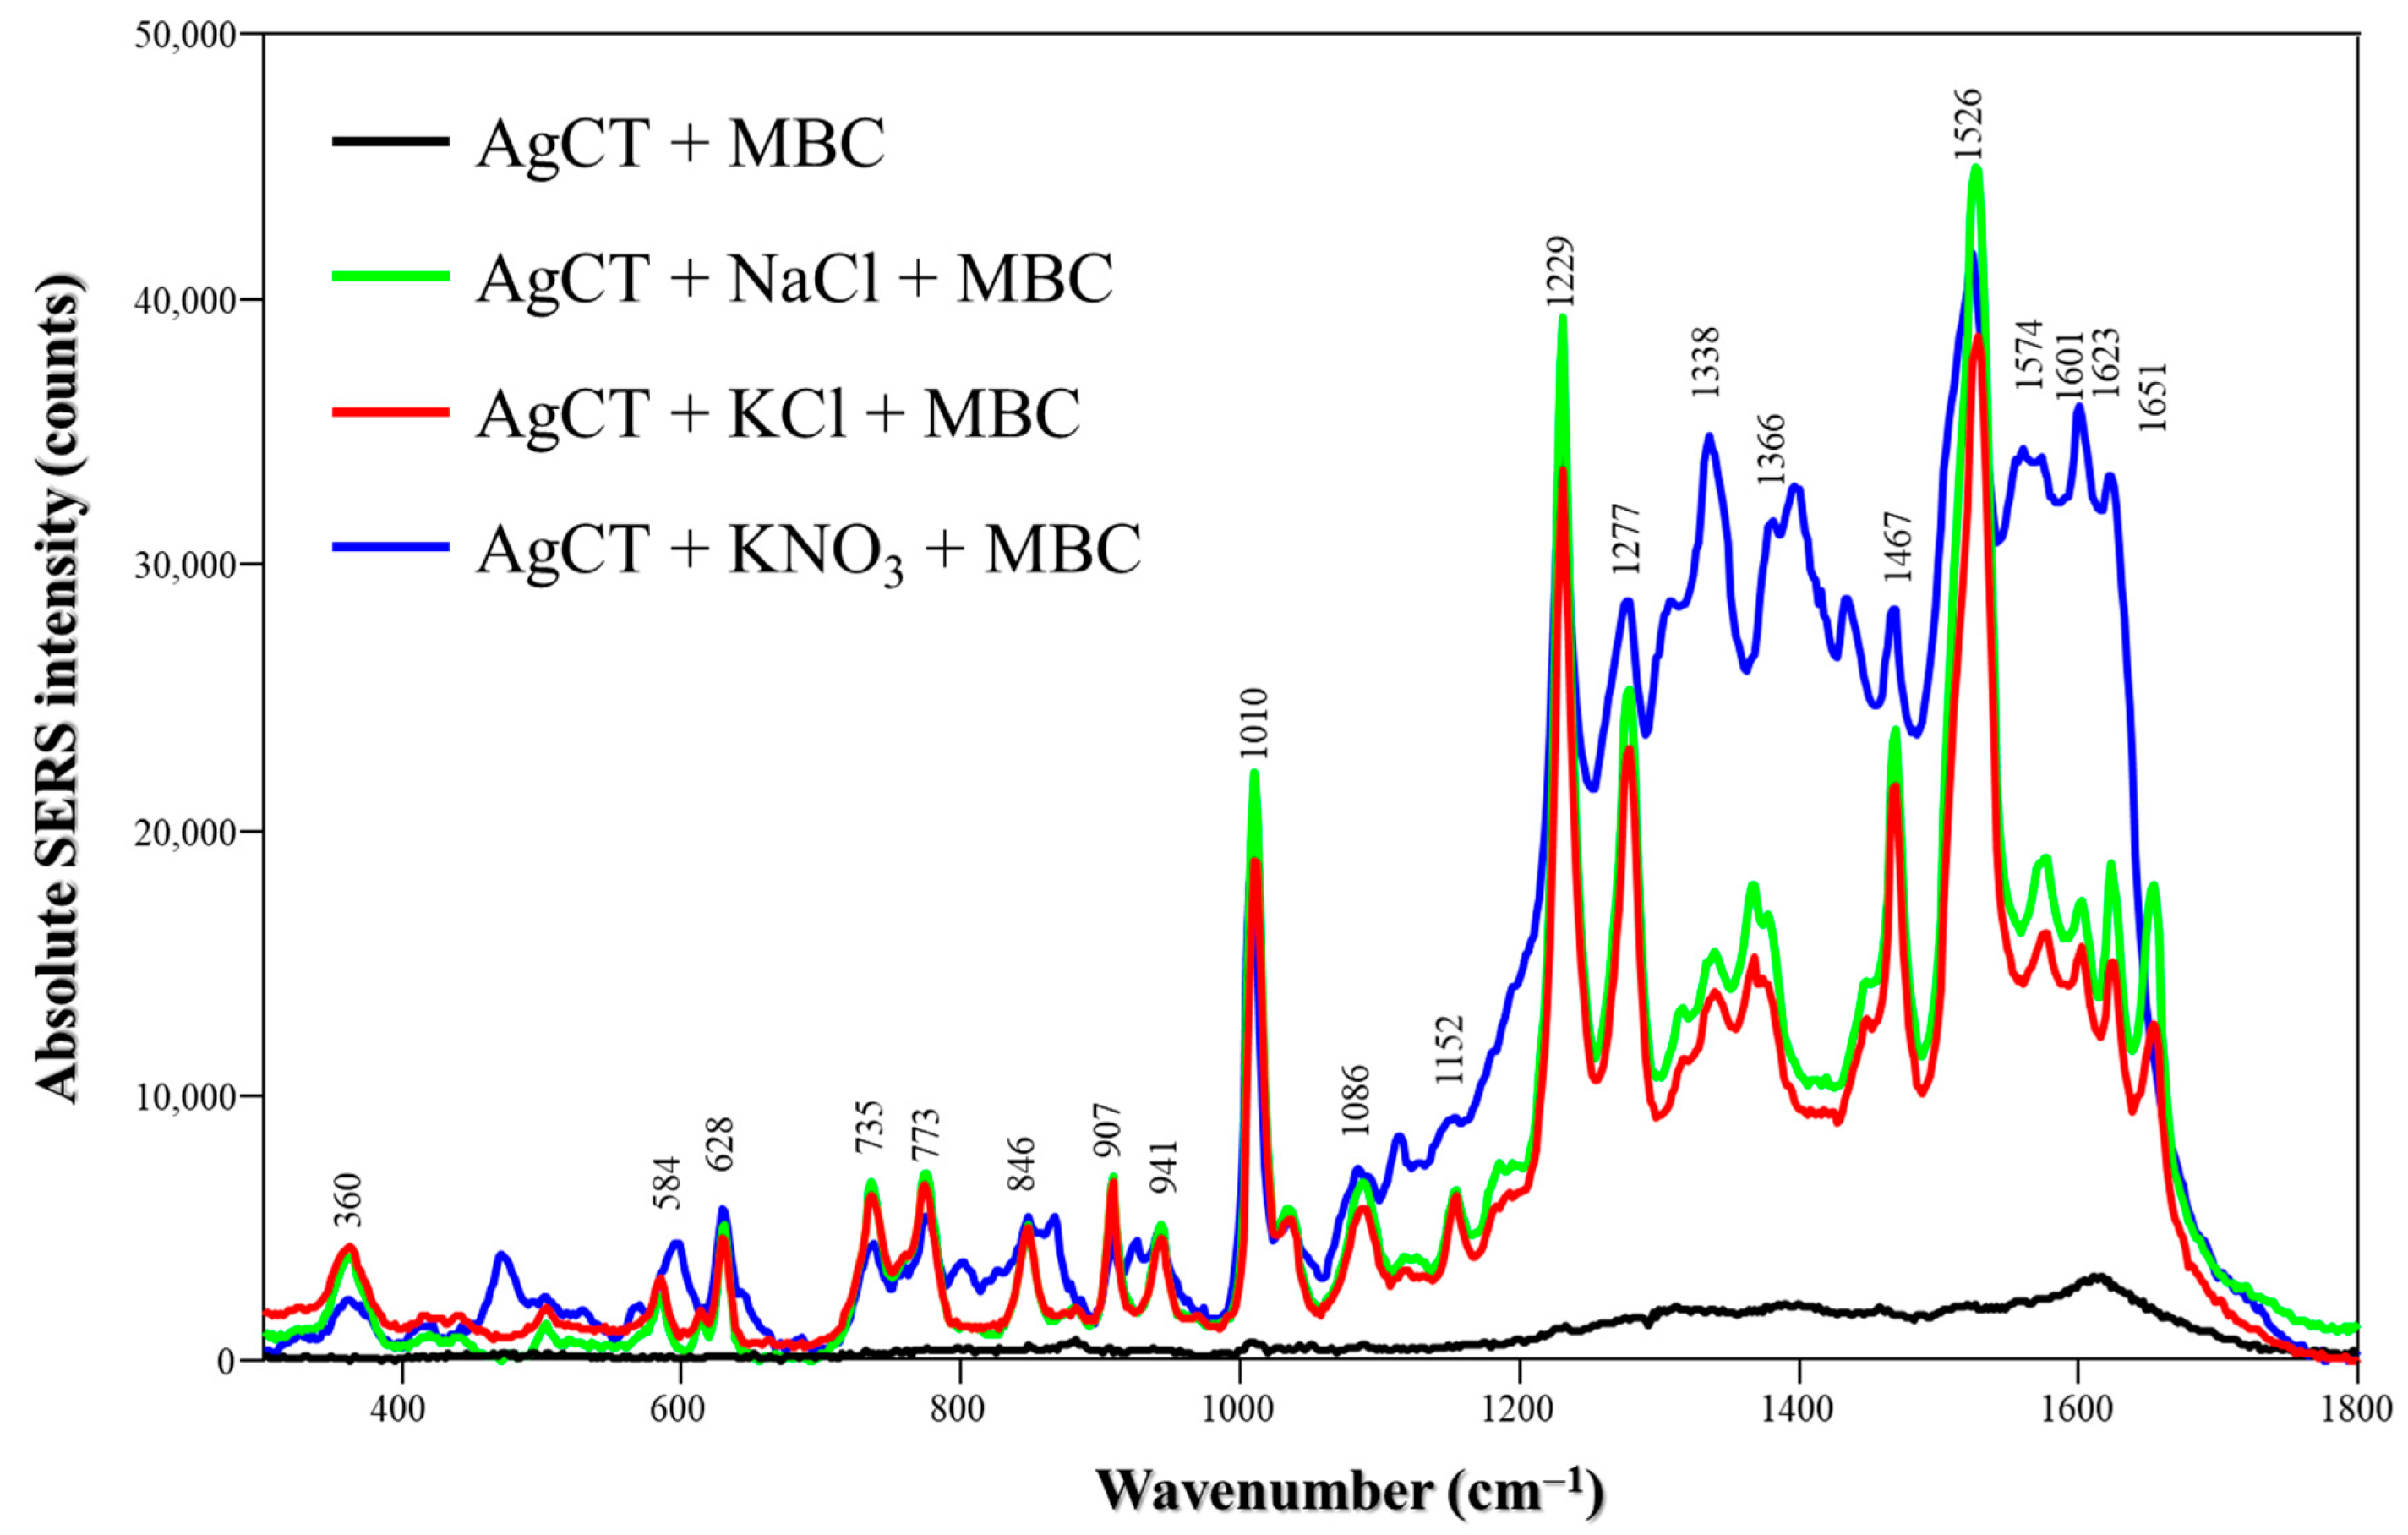
Lastly, MBC SERS spectra using AgCT were obtained by changing the medium to pH 8 and using the laser line at 514.5 nm (Figure 7). The spectra are dominated by vibrations from amidic groups (N-H deformation at 1229, 1467 and 1526 cm−1) or imidazolic groups (N-H deformation at 1277 cm−1 and C-N deformation at 1010 cm−1); MBC presents pKa1 = 4.5 and pKa2 = 10.6, and the molecules are at neutral form at pH 8 [38]. We previously published findings on the affinity of MBC for silver surfaces using AgH as the SERS substrate, focusing on its behavior in different pH environments [24]. Our results indicated that neutral and negatively charged molecules produce a significant SERS signal, with the spectra predominantly reflecting neutral molecules adsorbed onto the nanoparticle surface through the imidazole moiety. It is plausible to hypothesize that in a higher pH medium, molecular solubility increases, promoting adsorption. For the synthesis of AgCT, the EF calculations (Table S1) demonstrated that the effect of salts on the detection of TBZ and MBC corresponded with the amplification observed in the Raman spectra.

Figure 7.
Absolute MBC SERS spectra in the absence and presence of different salts (NaCl, KCl or KNO3) using AgCT NPs at pH 8. Laser: 514.5 nm.
In the low-frequency region of the AgCT spectra, as shown in Figure S9A, no peaks were observed in the absence of salts. However, in the presence of NaCl or KCl, peaks at 240 and 234 cm−1 appear, which are assigned to Ag-Cl stretching vibrations [25,26,27]. In contrast, KNO3 does not seem to displace the citrate ions from the nanoparticle surface, as evidenced by the appearance of a peak at 228 cm−1 in the presence of the salt, which is attributed to Ag-O stretching from the citrate adsorbed layer [41]. Since this peak is absent in the AgCT spectra without salt, we suggest that the signal may arise from possible nanoparticle aggregation in the presence of KNO3. Additionally, the chloride ions from NaCl or KCl are adsorbed onto the nanoparticle surface, replacing the citrate ions previously adsorbed. This finding is consistent with the strong affinity between chloride ions and silver and further supported by XPS measurements [11,42], showing the replacement of previously adsorbed ions by chloride ions.
The addition of TBZ to AgCT nanoparticles in the presence of both NaCl and KCl did not alter the bands associated with Ag-Cl stretching vibrations. These results suggest that chloride ions remain on the surface even after TBZ adsorption. However, the introduction of KNO3 (Figure S9B) led to the appearance of a peak at 220 cm−1, attributed to Ag-NH4 [43]. Moreover, KNO3 seems to influence the adsorption of TBZ onto the surface of AgCT nanoparticles. Although the interaction primarily occurs via the S atom, the benzimidazole group (containing the nitrogen group) remains in close proximity to the surface. This finding was further confirmed by the increased peak intensities at 1283 and 1583 cm−1 in the presence of KNO3 (Figure 6). These peaks correspond to C-C stretching in the benzimidazole moiety of TBZ, also indicating closer proximity of the benzimidazole moiety to the nanoparticle surface.
For MBC using AgCT and chloride salts (Figure S9C), the peak appearing at 223 cm−1 is assigned to AgCl—NH, being the Ag nanoparticle surface bonded to the imidazolic MBC group, as reported previously by our group [24]. In contrast, in the presence of KNO3, the band that emerged at 212 cm−1 is likely associated with the vibration of Ag–O [44], due to the higher proximity of the MBC amide group to the Ag nanoparticle surface. This can also be confirmed by the increased intensity of the band at 1338 cm⁻1 and the appearance of a new band at 1601 cm−1, both attributed to the NH bending of the amide group.
3.4. AgCT Aggregation in the Presence of Salts, TBZ and MBC
The aggregation behavior of the AgCT in the presence of the pesticides containing or not containing the salts NaCl, KCl or KNO3 was also studied via UV-Vis spectra, DLS and zeta potential. Figure S10A shows the UV-Vis extinction spectra of the AgCT nanoparticles, classical for the LSP band of citrate-silver nanoparticles in the range of 300–600 nm and with the maximum of the extinction band centered at 430 nm. The spectral changes caused by the addition of the salts in the AgCT were even smaller than those observed for the AgH colloid. Indeed, the citrate promotes a higher stabilization of the Ag colloid compared to other reductants [45]. The citrate ion layer on the nanoparticles is thicker, which makes it more repellent, impeding further aggregation [46] and, consequently, the achievement of the SERS signal for pesticides in the absence of salts. The minimal effects verified in the UV-Vis spectra of the AgCT nanoparticles in the presence of salts were not enough to cause any variation in both size distribution and zeta potential values of the nanoparticles (Figure S10B and Table 2, respectively). This makes it evident that the ion specificity (Hofmeister effects) towards AgCT does not play a determining role in aggregation.
Table 2.
Polydispersity index and zeta potential of AgCT samples at pH 5.8.
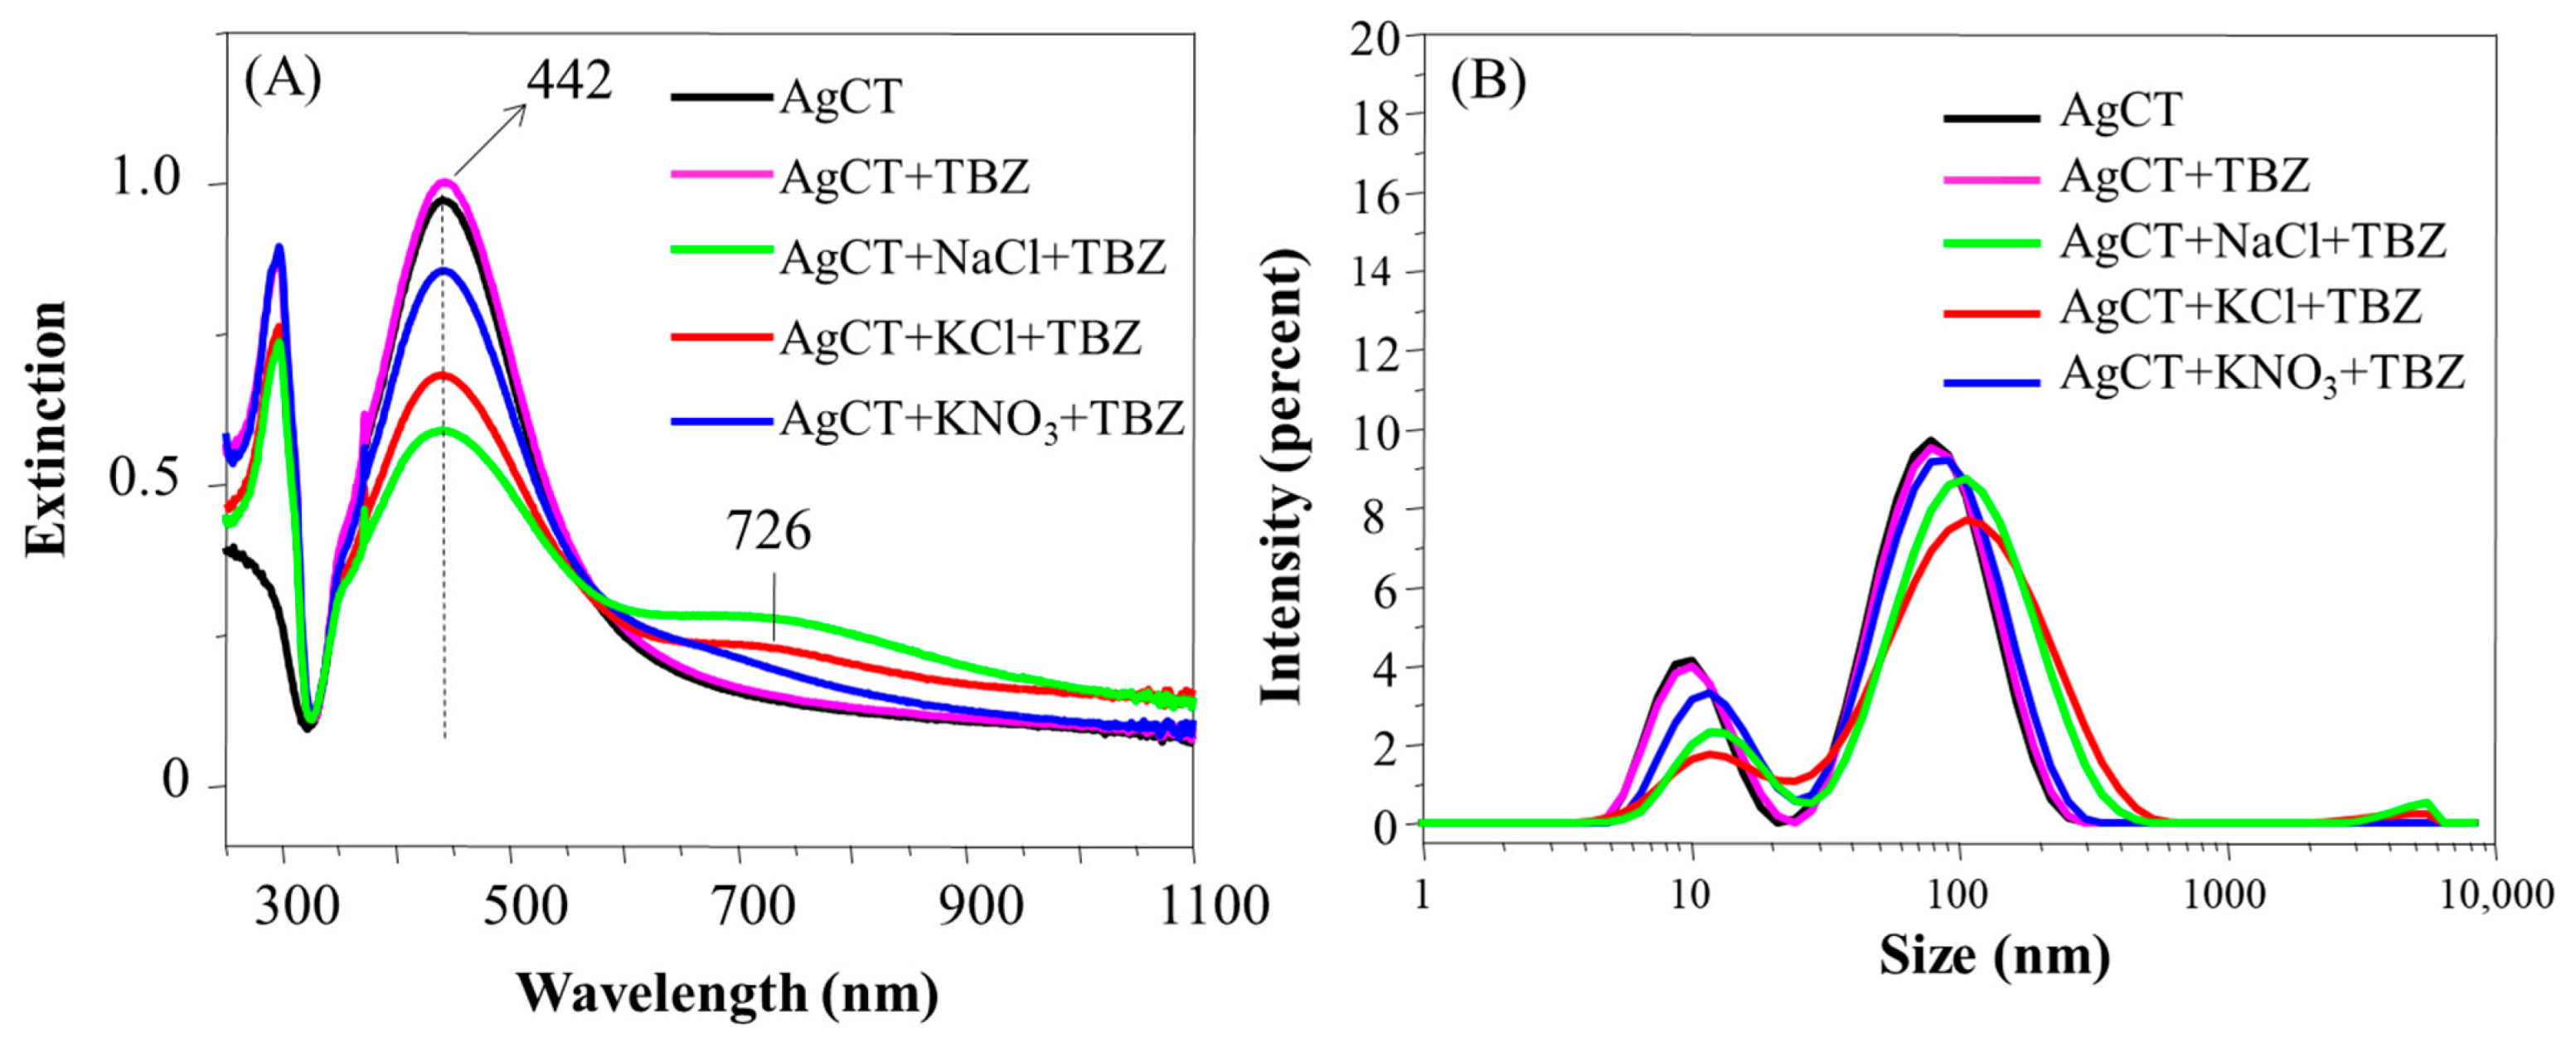
The presence of TBZ was also not capable of inducing the aggregation of AgCT nanoparticles (Figure 8A). The higher decrease of the LSP peak and the formation of a prominent extinction band at 726 nm in the presence of NaCl and KCl make evident the larger destabilizing effects of the Cl− ion compared with NO3− in the nanoparticles covered with citrate ions. Such a tendency was also verified in the size distribution profile and the zeta potential (Figure 8B and Table 2). In systems containing NaCl and KCl salts, a subtle displacement of the size distribution peak occurred alongside a decrease in zeta potential values. Despite the differences observed in UV-Vis spectra according to the salt used, it was possible to observe in the spectra the band at 294 nm belonging to the TBZ not adsorbed onto the surface of the AgCT, which was also probably due the ion solvation by the TBZ molecules.
Figure 8.
Extinction spectra (A) and hydrodynamic diameter distribution (B) of AgCT with TBZ in the presence and in the absence of the salts NaCl, KCl, KNO3. pH 5.8.
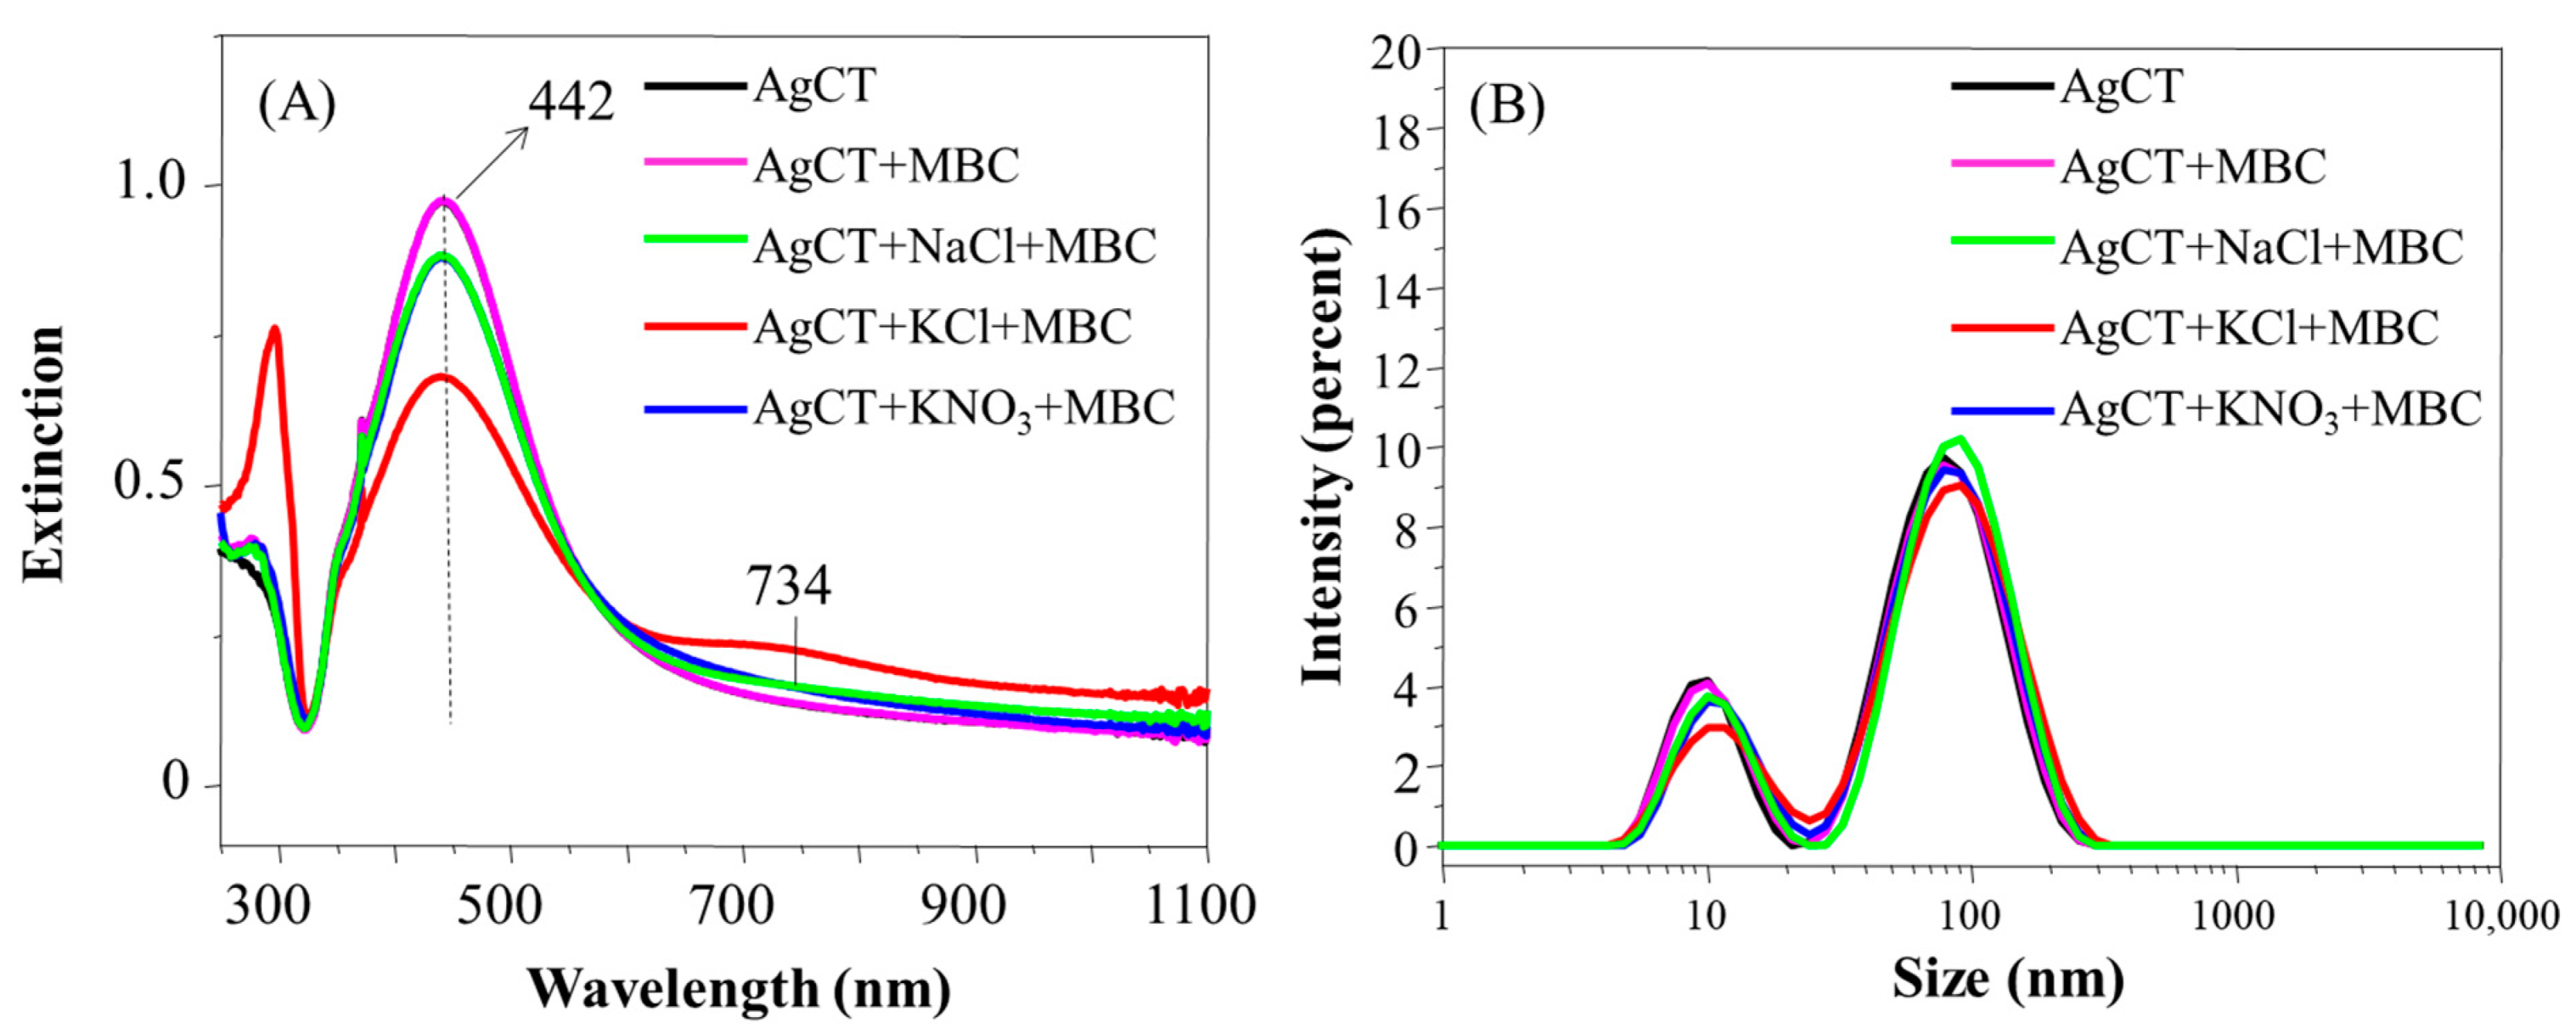
The AgCT UV-Vis spectra in the presence of MBC and salts are presented in Figure 9A. The aggregation was modest compared to the AgCT/TBZ + salts system, as evidenced by the absence of variations in the DLS results (Figure 9B) and zeta potential values (Table 2). This reveals the high colloidal stability of AgCT, even in the presence of the pesticide MBC and salts. It is interesting to highlight the more prominent UV spectral change of the system AgCT + MBC containing KCl, following the tendency of the system with only AgCT.
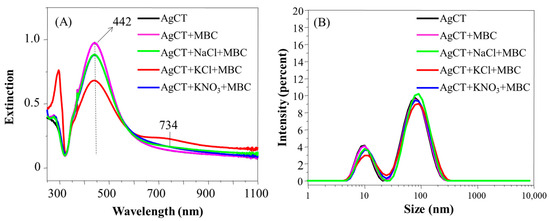
Figure 9.
Extinction spectra (A) and hydrodynamic diameter distribution (B) of AgCT with MBC in the presence and in the absence of the salts NaCl, KCl or KNO3. pH 5.8.
4. Conclusions
This study has demonstrated the fundamental role of both the type of Ag synthesis and salts in the aggregation of nanoparticles, with direct consequences for the SERS signal of pesticides and detection quality. The difference in the coatings of the AgH or AgCT synthesis and the salts used caused differences in the aggregation of nanoparticles and, consequently, in the adsorption of pesticides on the surfaces of nanoparticles and the detection of pesticides via SERS. For TBZ, due its high affinity with the AgH surface, the system without salts proved essential for achieving the highest aggregation and greater SERS signal intensity. In the case of the MBC pesticide, the KNO3 salt played a pivotal role in promoting a more significant aggregation state, crucial for obtaining the most amplified SERS signal. The thicker coating of AgCT hindered the adsorption of both pesticides onto the nanoparticle surface. The process was facilitated only after the addition of chloride salts NaCl and KCl. The incorporation of salts in the AgCT was not enough to obtain the SERS signal of MBC; additional modifications, such as altering laser parameters and adjusting the medium’s pH, were required. The salts did not interfere with the way TBZ and MBC adsorb on the surface of AgH nanoparticles. Conversely, in the case of AgCT, the KNO3 salt played a significant role in altering the adsorption of both pesticides on the Ag NP surface. The UV-Vis absorption spectroscopy, DLS and zeta potential were used simultaneously to determine the aggregation features of each nanoparticle synthesis (AgH or AgCT) and the presence of the salts NaCl, KCl and KNO3. The difference in the spacing of the coatings of the AgH or AgCT synthesis caused differences in the aggregation of nanoparticles and, consequently, in the adsorption of pesticides on the surfaces of nanoparticles and the detection of pesticides via SERS. Regarding the salts used, for AgH, although KCl emerged as the most effective aggregator among the salts employed, such a pattern was not maintained in the presence of pesticides. In summary, our findings underscore that the effectiveness of SERS experiments is influenced not only by the synthesis of the nanoparticles and the inclusion of aggregating agents like salts but also by the intrinsic nature of the molecule being targeted for signal amplification.
Supplementary Materials
The following supporting information can be downloaded at https://www.mdpi.com/article/10.3390/chemosensors13010013/s1: Figure S1: Raman spectra of AgH and AgCT in absence of both salts and TBZ and MBC, using the lasers 514 and 785; Figure S2: Raman spectra of (A) TBZ and (B) MBC in powder, using the lasers 514 and 785; Figure S3: SERS spectra at low frequency of (A) only AgH, (B) AgH+ TBZ and (C) AgH + MBC in the presence and absence of salts. Laser: 785 nm. pH 5.8; Figure S4: Extinction spectra (A) and hydrodynamic diameter distribution (B) of AgH in the presence and in the absence of the salts NaCl, KCl or KNO3. pH 5.8; Figure S5: Hydrodynamic diameter distribution in volume of AgH with TBZ in the presence and in the absence of the salts NaCl, KCl or KNO3. pH 5.8; Figure S6: AgCT SERS spectra in the presence of KNO3 using AgCT NPs at pH 5.8 Laser: 514.5 nm; Figure S7: Absolute MBC SERS spectra in the absence and presence of different salts (NaCl, KCl or KNO3) using AgCT NPs at pH 5.6. Laser: 785 nm; Figure S8: MBC SERS spectra using AgCT and different salts (NaCl, KCl or KNO3) at pH 5.8. Laser line 514.5 nm; Figure S9: SERS spectra at low frequency of (A) only AgCT, (B) AgCT + TBZ and (C) AgCT + MBC in the presence and absence of salts. pH 5.8; Figure S10: Extinction spectra (A) and hydrodynamic diameter distribution (B) of AgCT in the presence and in the absence of the salts NaCl, KCl or KNO3. pH 5.8; Table S1: Enhancement Factor of AgH and AgCT samples.
Author Contributions
Conceptualization, L.N.F.; methodology, M.J.d.S.O., G.C.M.R. and R.J.G.R.; formal analysis, M.J.d.S.O., G.C.M.R., R.J.G.R. and L.N.F.; writing—original draft preparation, M.J.d.S.O., G.C.M.R. and R.J.G.R.; writing—review and editing, L.N.F., C.J.L.C. and S.S.-C.; supervision, L.N.F., C.J.L.C. and S.S.-C.; project administration, C.J.L.C.; funding acquisition, C.J.L.C. All authors have read and agreed to the published version of the manuscript.
Funding
This research was funded by FAPESP grant numbers 2018/22214-6, 2020/15185-0, 2023/18367-0 and 2020/05423-0; CNPq grant numbers 306501/2022-8, 313211/2023-0, 443098/2023-9 and 405087/2021-7; FAPESC grant number 2023TR001507; CAPES, INCT/INEO, Ministerio de Ciencia, Innovación y Universidades y FSE+ grant numbers PID2020-113900RB-I00 and PID2023-146214OB-I00.
Institutional Review Board Statement
Not applicable.
Informed Consent Statement
Not applicable.
Data Availability Statement
Raw data are available upon request.
Acknowledgments
The authors gratefully acknowledge the support of the projects mentioned in the Funding Section above for this research.
Conflicts of Interest
The authors declare no conflicts of interest.
References
- Long, Z.; Wang, X.; Wang, Y.; Dai, H.; Li, C.; Xue, Y.; Deng, Y.; Zhang, H.; Yu, Y.; Fang, H. Characterization of a Novel Carbendazim-Degrading Strain Rhodococcus sp. CX-1 Revealed by Genome and Transcriptome Analyses. Sci. Total Environ. 2021, 754, 142137. [Google Scholar] [CrossRef]
- Wang, M.; Zhu, W.; Zhao, L.; Jin, J.; Song, Y.; Liu, M. Simultaneous Detection of Thiabendazole and Carbendazim in Foods Based on Two-Color Upconversion and Magnetic Separation Nanoparticles Fluorescence Immunoassay. Eur. Food Res. Technol. 2022, 248, 85–94. [Google Scholar] [CrossRef]
- Zhu, Y.; Zhang, Y.; Liu, N.; Ren, W.; Hou, Y.; Duan, Y.; Song, X.; Zhou, M. The Dis1/Stu2/XMAP215 Family Gene FgStu2 Is Involved in Vegetative Growth, Morphology, Sexual and Asexual Reproduction, Pathogenicity and DON Production of Fusarium Graminearum. Front. Microbiol. 2020, 11, 545015. [Google Scholar] [CrossRef] [PubMed]
- Constantino, C.J.L.; Lemma, T.; Antunes, P.A.; Aroca, R. Single-Molecule Detection Using Surface-Enhanced Resonance Raman Scattering and Langmuir−Blodgett Monolayers. Anal. Chem. 2001, 73, 3674–3678. [Google Scholar] [CrossRef] [PubMed]
- Le Ru, E.C.; Etchegoin, P.G. Single-Molecule Surface-Enhanced Raman Spectroscopy. Annu. Rev. Phys. Chem. 2012, 63, 65–87. [Google Scholar] [CrossRef]
- Lombardi, J.R. The Theory of Surface-Enhanced Raman Scattering on Semiconductor Nanoparticles; toward the Optimization of SERS Sensors. Faraday Discuss. 2017, 205, 105–120. [Google Scholar] [CrossRef]
- Mahanty, S.; Majumder, S.; Paul, R.; Boroujerdi, R.; Valsami-Jones, E.; Laforsch, C. A Review on Nanomaterial-Based SERS Substrates for Sustainable Agriculture. Sci. Total Environ. 2024, 950, 174252. [Google Scholar] [CrossRef] [PubMed]
- Dong, X.; Gu, H.; Kang, J.; Yuan, X.; Wu, J. Comparative Study of Surface-Enhanced Raman Scattering Activities of Three Kinds of Silver Colloids When Adding Anions as Aggregating Agents. Colloids Surf. A Physicochem. Eng. Asp. 2010, 368, 142–147. [Google Scholar] [CrossRef]
- De, S.; Pal, A.; Jana, N.R.; Pal, T. Anion Effect in Linear Silver Nanoparticle Aggregation as Evidenced by Efficient Fluorescence Quenching and SERS Enhancement. J. Photochem. Photobiol. A Chem. 2000, 131, 111–123. [Google Scholar] [CrossRef]
- Izquierdo-Lorenzo, I.; Alda, I.; Sanchez-Cortes, S.; Garcia-Ramos, J.V. Adsorption and Detection of Sport Doping Drugs on Metallic Plasmonic Nanoparticles of Different Morphology. Langmuir 2012, 28, 8891–8901. [Google Scholar] [CrossRef] [PubMed]
- Futamata, M.; Maruyama, Y. Electromagnetic and Chemical Interaction between Ag Nanoparticles and Adsorbed Rhodamine Molecules in Surface-Enhanced Raman Scattering. Anal. Bioanal. Chem. 2007, 388, 89–102. [Google Scholar] [CrossRef] [PubMed]
- Futamata, M.; Yu, Y.; Yajima, T. Elucidation of Electrostatic Interaction between Cationic Dyes and Ag Nanoparticles Generating Enormous SERS Enhancement in Aqueous Solution. J. Phys. Chem. C 2011, 115, 5271–5279. [Google Scholar] [CrossRef]
- Mostowtt, T.; Munoz, J.; McCord, B. An Evaluation of Monovalent, Divalent, and Trivalent Cations as Aggregating Agents for Surface Enhanced Raman Spectroscopy (SERS) Analysis of Synthetic Cannabinoids. Analyst 2019, 144, 6404–6414. [Google Scholar] [CrossRef]
- Burns, C.; Spendel, W.; Puckett, S.; Pacey, G. Solution Ionic Strength Effect on Gold Nanoparticle Solution Color Transition. Talanta 2006, 69, 873–876. [Google Scholar] [CrossRef] [PubMed]
- Khrushchev, A.Y.; Akmaev, E.R.; Gulyaeva, A.Y.; Zavialov, A.; Sidorenko, A.I.; Bondarenko, V.O.; Lvovskiy, A.I. Ion-Induced Agglomeration of Ag NPs for Quantitative Determination of Trace Malachite Green in Natural Water by SERS. Vib. Spectrosc. 2022, 120, 103360. [Google Scholar] [CrossRef]
- Leopold, N.; Lendl, B. A New Method for Fast Preparation of Highly Surface-Enhanced Raman Scattering (SERS) Active Silver Colloids at Room Temperature by Reduction of Silver Nitrate with Hydroxylamine Hydrochloride. J. Phys. Chem. B 2003, 107, 5723–5727. [Google Scholar] [CrossRef]
- Garcia-Leis, A.; Rivera-Arreba, I.; Sanchez-Cortes, S. Morphological Tuning of Plasmonic Silver Nanostars by Controlling the Nanoparticle Growth Mechanism: Application in the SERS Detection of the Amyloid Marker Congo Red. Colloids Surf. A Physicochem. Eng. Asp. 2017, 535, 49–60. [Google Scholar] [CrossRef]
- Lee, P.C.; Meisel, D. Adsorption and Surface-Enhanced Raman of Dyes on Silver and Gold Sols. J. Phys. Chem. 1982, 86, 3391–3395. [Google Scholar] [CrossRef]
- Orendorff, C.J.; Gole, A.; Sau, T.K.; Murphy, C.J. Surface-Enhanced Raman Spectroscopy of Self-Assembled Monolayers: Sandwich Architecture and Nanoparticle Shape Dependence. Anal. Chem. 2005, 77, 3261–3266. [Google Scholar] [CrossRef]
- Brezestean, I.A.; Tosa, N.; Falamas, A.; Cuibus, D.; Muntean, C.M.; Bende, A.; Cozar, B.; Berghian-Grosan, C.; Farcău, C. Silver Nanoparticle Films Obtained by Convective Self-Assembly for Surface-Enhanced Raman Spectroscopy Analyses of the Pesticides Thiabendazole and Endosulfan. Front. Chem. 2022, 10, 915337. [Google Scholar] [CrossRef] [PubMed]
- Muniz-Miranda, M. SERS Investigation on Five-Membered Heterocyclic Compounds: Isoxazole, Oxazole and Thiazole. Vib. Spectrosc. 1999, 19, 227–232. [Google Scholar] [CrossRef]
- Müller, C.; David, L.; Chiş, V.; Pînzaru, S.C. Detection of Thiabendazole Applied on Citrus Fruits and Bananas Using Surface Enhanced Raman Scattering. Food Chem. 2014, 145, 814–820. [Google Scholar] [CrossRef] [PubMed]
- Oliveira, M.J.S.; Rubira, R.J.G.; Furini, L.N.; Batagin-Neto, A.; Constantino, C.J.L. Detection of Thiabendazole Fungicide/Parasiticide by SERS: Quantitative Analysis and Adsorption Mechanism. Appl. Surf. Sci. 2020, 517, 145786. [Google Scholar] [CrossRef]
- Furini, L.N.; Constantino, C.J.L.; Sanchez-Cortes, S.; Otero, J.C.; López-Tocón, I. Adsorption of Carbendazim Pesticide on Plasmonic Nanoparticles Studied by Surface-Enhanced Raman Scattering. J. Colloid Interface Sci. 2016, 465, 183–189. [Google Scholar] [CrossRef] [PubMed]
- Roldán, M.L.; Corrado, G.; Francioso, O.; Sanchez-Cortes, S. Interaction of Soil Humic Acids with Herbicide Paraquat Analyzed by Surface-Enhanced Raman Scattering and Fluorescence Spectroscopy on Silver Plasmonic Nanoparticles. Anal. Chim. Acta 2011, 699, 87–95. [Google Scholar] [CrossRef]
- Guerrini, L.; Garcia-Ramos, J.V.; Domingo, C.; Sanchez-Cortes, S. Nanosensors Based on Viologen Functionalized Silver Nanoparticles: Few Molecules Surface-Enhanced Raman Spectroscopy Detection of Polycyclic Aromatic Hydrocarbons in Interparticle Hot Spots. Anal. Chem. 2009, 81, 1418–1425. [Google Scholar] [CrossRef]
- Khlebtsov, B.N.; Khanadeev, V.A.; Panfilova, E.V.; Bratashov, D.N.; Khlebtsov, N.G. Gold Nanoisland Films as Reproducible SERS Substrates for Highly Sensitive Detection of Fungicides. ACS Appl. Mater. Interfaces 2015, 7, 6518–6529. [Google Scholar] [CrossRef] [PubMed]
- Futamata, M.; Yu, Y.-Y.; Yanatori, T.; Kokubun, T. Closely Adjacent Ag Nanoparticles Formed by Cationic Dyes in Solution Generating Enormous SERS Enhancement. J. Phys. Chem. C 2010, 114, 7502–7508. [Google Scholar] [CrossRef]
- Bhattacharjee, S. DLS and Zeta Potential—What They Are and What They Are Not? J. Control. Release 2016, 235, 337–351. [Google Scholar] [CrossRef] [PubMed]
- Chen, Q.; Zuo, J.; He, X.; Mo, X.; Tong, P.; Zhang, L. Enhanced Fluorescence of Terbium with Thiabendazole and Application in Determining Trace Amounts of Terbium and Thiabendazole. Talanta 2017, 162, 540–546. [Google Scholar] [CrossRef] [PubMed]
- Aroca, R. Surface-Enhanced Vibrational Spectroscopy; John Wiley & Sons, Ltd.: Chichester, UK, 2006; ISBN 9780470035641. [Google Scholar]
- Aroca, R.F.; Vallete, M.C.; Ramos, J.V.G.; Sanchez Cortés, S.; Sanchez Gil, J.A.; Sevilla, P. Amplificacion Plasmonica de Espectros Raman y de Fluorescencia, SERS y SEF Sobre Nanoestructuras Metálicas; CSIC: Madrid, Spain, 2014. [Google Scholar]
- Oncsik, T.; Trefalt, G.; Borkovec, M.; Szilagyi, I. Specific Ion Effects on Particle Aggregation Induced by Monovalent Salts within the Hofmeister Series. Langmuir 2015, 31, 3799–3807. [Google Scholar] [CrossRef] [PubMed]
- López-León, T.; Santander-Ortega, M.J.; Ortega-Vinuesa, J.L.; Bastos-González, D. Hofmeister Effects in Colloidal Systems: Influence of the Surface Nature. J. Phys. Chem. C 2008, 112, 16060–16069. [Google Scholar] [CrossRef]
- Merk, V.; Rehbock, C.; Becker, F.; Hagemann, U.; Nienhaus, H.; Barcikowski, S. In Situ Non-DLVO Stabilization of Surfactant-Free, Plasmonic Gold Nanoparticles: Effect of Hofmeister’s Anions. Langmuir 2014, 30, 4213–4222. [Google Scholar] [CrossRef]
- López-León, T.; Ortega-Vinuesa, J.L.; Bastos-González, D. Ion-Specific Aggregation of Hydrophobic Particles. ChemPhysChem 2012, 13, 2382–2391. [Google Scholar] [CrossRef] [PubMed]
- Furini, L.N.; Sanchez-Cortes, S.; López-Tocón, I.; Otero, J.C.; Aroca, R.F.; Constantino, C.J.L. Detection and Quantitative Analysis of Carbendazim Herbicide on Ag Nanoparticles via Surface-Enhanced Raman Scattering. J. Raman Spectrosc. 2015, 46, 1095–1101. [Google Scholar] [CrossRef]
- Mazellier, P.; Leroy, É.; Legube, B. Photochemical Behavior of the Fungicide Carbendazim in Dilute Aqueous Solution. J. Photochem. Photobiol. A Chem. 2002, 153, 221–227. [Google Scholar] [CrossRef]
- Munro, C.H.; Smith, W.E.; Garner, M.; Clarkson, J.; White, P.C. Characterization of the Surface of a Citrate-Reduced Colloid Optimized for Use as a Substrate for Surface-Enhanced Resonance Raman Scattering. Langmuir 1995, 11, 3712–3720. [Google Scholar] [CrossRef]
- Alvarez-Puebla, R.A.; Arceo, E.; Goulet, P.J.G.; Garrido, J.J.; Aroca, R.F. Role of Nanoparticle Surface Charge in Surface-Enhanced Raman Scattering. J. Phys. Chem. B 2005, 109, 3787–3792. [Google Scholar] [CrossRef]
- Lu, Z.; Gu, Y.; Yang, J.; Li, Z.; Ruan, W.; Xu, W.; Zhao, C.; Zhao, B. SERS-Active Ag Substrate from the Photo-Active Decomposition of Electrodeposited Divalent Silver Oxide. Vib. Spectrosc. 2008, 47, 99–104. [Google Scholar] [CrossRef]
- Futamata, M.; Maruyama, Y. LSP Spectral Changes Correlating with SERS Activation and Quenching for R6G on Immobilized Ag Nanoparticles. Appl. Phys. B 2008, 93, 117–130. [Google Scholar] [CrossRef]
- Rubira, R.J.G.; Furini, L.N.; Constantino, C.J.L.; Sanchez-Cortes, S. SERS Detection of Prometryn Herbicide Based on Its Optimized Adsorption on Ag Nanoparticles. Vib. Spectrosc. 2021, 114, 103245. [Google Scholar] [CrossRef]
- Waterhouse, G.I.N.; Bowmaker, G.A.; Metson, J.B. Oxygen Chemisorption on an Electrolytic Silver Catalyst: A Combined TPD and Raman Spectroscopic Study. Appl. Surf. Sci. 2003, 214, 36–51. [Google Scholar] [CrossRef]
- Rivas, L.; Sanchez-Cortes, S.; García-Ramos, J.V.; Morcillo, G. Growth of Silver Colloidal Particles Obtained by Citrate Reduction to Increase the Raman Enhancement Factor. Langmuir 2001, 17, 574–577. [Google Scholar] [CrossRef]
- Pillai, Z.S.; Kamat, P.V. What Factors Control the Size and Shape of Silver Nanoparticles in the Citrate Ion Reduction Method? J. Phys. Chem. B 2004, 108, 945–951. [Google Scholar] [CrossRef]

Disclaimer/Publisher’s Note: The statements, opinions and data contained in all publications are solely those of the individual author(s) and contributor(s) and not of MDPI and/or the editor(s). MDPI and/or the editor(s) disclaim responsibility for any injury to people or property resulting from any ideas, methods, instructions or products referred to in the content. |
© 2025 by the authors. Licensee MDPI, Basel, Switzerland. This article is an open access article distributed under the terms and conditions of the Creative Commons Attribution (CC BY) license (https://creativecommons.org/licenses/by/4.0/).