Influence of Sample Preparation on SERS Signal

 , , ,
, , ,  and
and 
Abstract
1. Introduction
2. Materials and Methods
2.1. Reagents
2.2. Ag Colloid Synthesis
2.3. MBC Stock Solution Preparation
2.4. MBC in Ag Colloid Sample Preparation
2.4.1. In the Absence of Potassium Nitrate
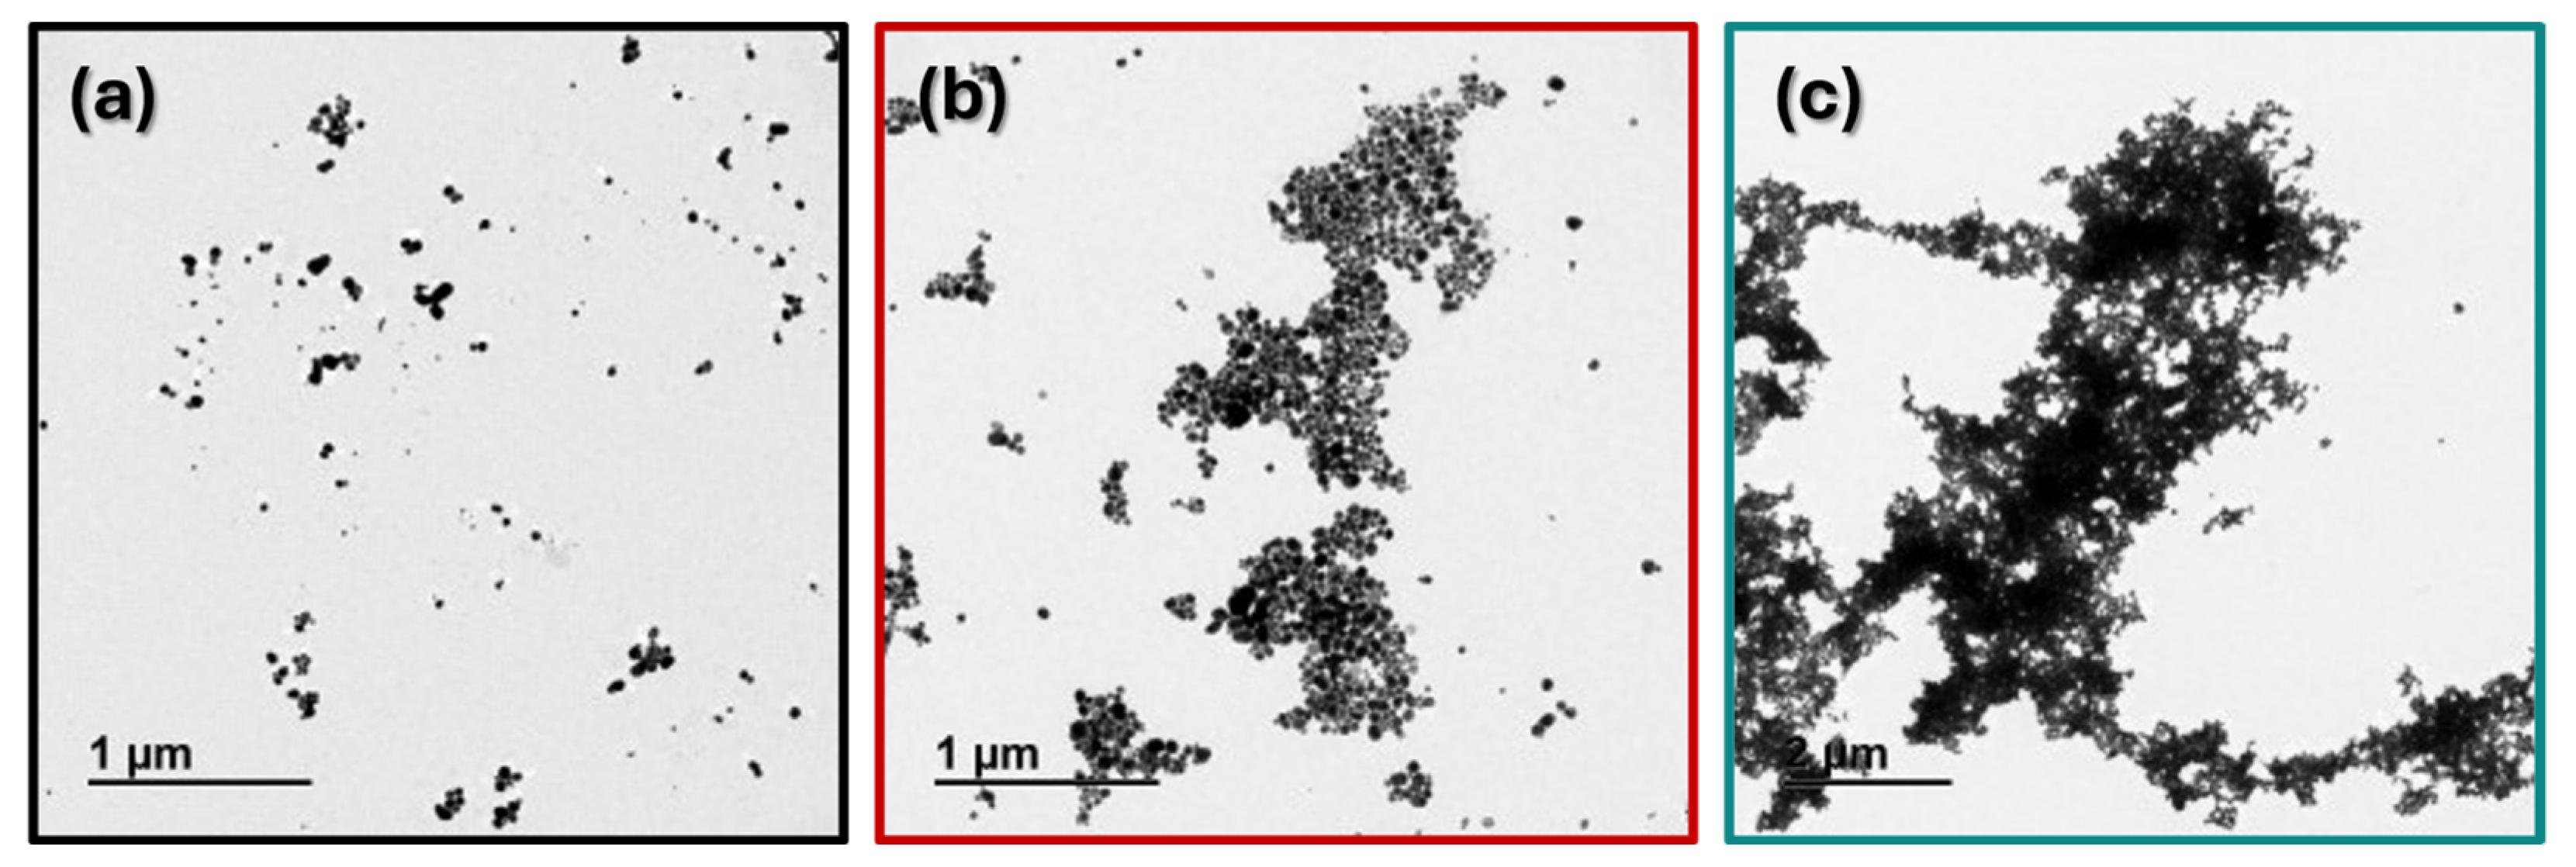
- TEM: The colloidal dispersion was dried on a grid following the same conditions of SERS measurements for the Ag colloid in the absence of MBC and in the presence of MBC with final concentrations of 1.0 × 10⁻⁶ mol/L, 1.6 × 10⁻⁶ mol/L, 4.0 × 10⁻⁶ mol/L, 9.7 × 10⁻⁶ mol/L, and 2.4 × 10⁻⁵ mol/L.
2.4.2. In the Presence of Potassium Nitrate: Without Ag Colloid Dilution
- SERS: 100 µL of a 0.5 mol/L solution of potassium nitrate (KNO3) was added to 2500 µL of the Ag colloid. Then, 100 µL of the total volume of the colloidal dispersion was removed and MBC was added following Table S1.
2.4.3. In the Presence of Potassium Nitrate: With Ag Colloid Dilution
- UV-Vis extinction, DLS, zeta potential, and SERS: 2000 µL of ultrapure water, 500 µL of Ag colloid, and 100 µL of 0.5 mol/L solution of KNO3 were mixed following two different orders:
- Dilution before aggregation: ultrapure water was added to the Ag colloid before the addition of salt.
- Aggregation before dilution: salt was added to the Ag colloid before ultrapure water.
2.5. Measurement Acquisition
2.5.1. UV-Vis Extinction
- In the absence of potassium nitrate—The measurements were performed in a spectrophotometer UV-Vis-NIR Shimadzu 3600 (Shimadzu, Kyoto, JAP) equipped with a photomultiplier tube (PMT—photomultiplier tube) for the UV-Vis region, and InGaAs and PbS detectors for near-infrared (NIR—near infrared).
- In the presence of potassium nitrate: with Ag colloid dilution—Varian spectrophotometer, model Cary 50 (Varian, Palo Alto, CA, USA), utilizing quartz cuvettes with a 10 mm optical path.
2.5.2. Raman and SERS
- In the absence of potassium nitrate—Portable spectrometer Raman Virsa (Renishaw, Wotton-under-Edge, UK) with a 785 nm laser. A 50× objective long focal lens and an integration time of 10 s were employed.
- In the presence of potassium nitrate: with and without Ag colloid dilution—Renishaw in-Via micro-Raman spectrograph (Renishaw, Wotton-under-Edge, ENG) equipped with a CCD detector and a 1200 l/mm diffraction grating for the 785 nm laser. An exposure time of 10 s and 10% power were used for the 50× objective long focal lens (Leica Germany, Wetzlar, GER; numerical aperture 0.5—model 566036).
- The spectra were collected from a sample droplet, with the laser beam focused on the liquid-air interface. The laser power measured for the 785 nm laser line was 330 mW, and 80 mW after the 50× lens (in-Via) and 50 mW (Virsa).
2.5.3. DLS and Zeta Potential:
- In the absence of potassium nitrate and in the presence of potassium nitrate: with Ag colloid dilution—Zetasizer Nano ZS90 (Malvern).
2.5.4. TEM Images:
- In the absence of potassium nitrate, they were obtained at the Universidad Complutense de Madrid (Madrid, ES), using JEM 1400 Plus (JEOL, Tokyo, JAP) equipment with acceleration voltage from 40 to 120 kV at intervals of 33 V. The TEM mode presents a resolution of 0.38 nm between points and 0.2 nm between lines, with magnification ranging from 50× to 12,105×. The camera has a focal length of 15 to 350 cm in AS DIFF and from 4 to 80 cm in HD DIFF, and the electron cannon is of the thermionic type with a LaB6 filament.
3. Results
3.1. In the Absence of Potassium Nitrate
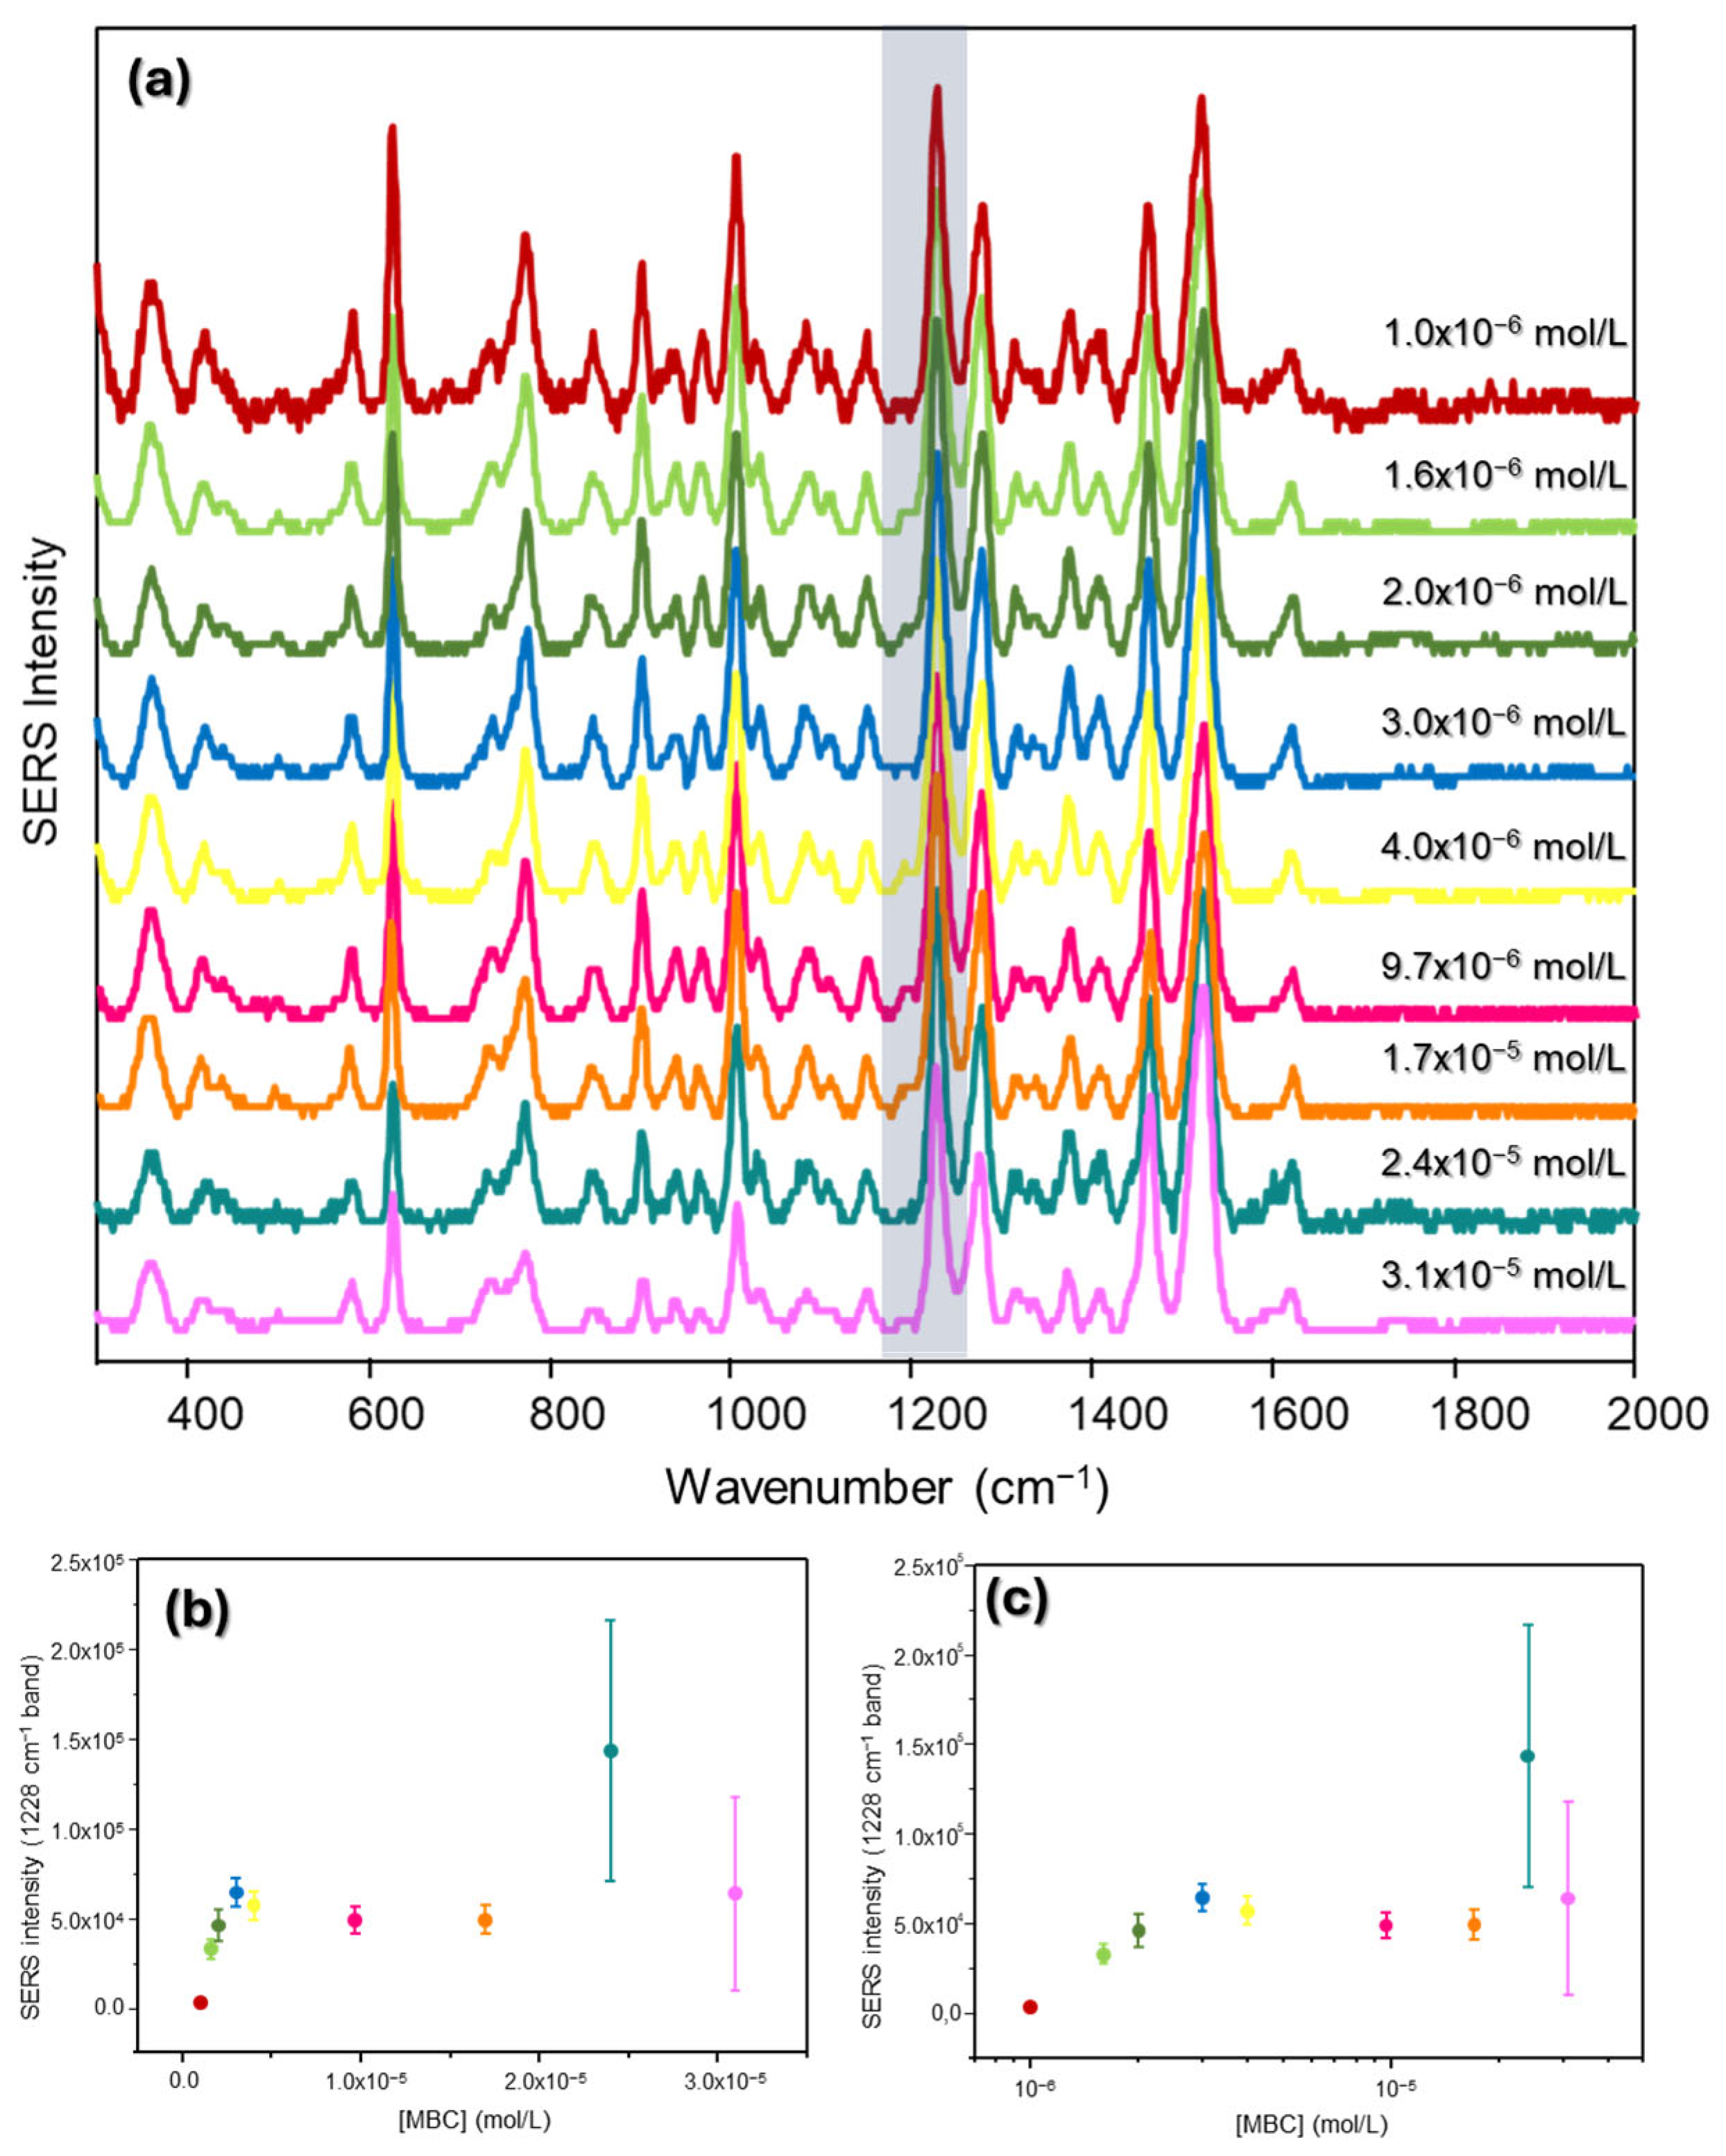
3.1.1. SERS
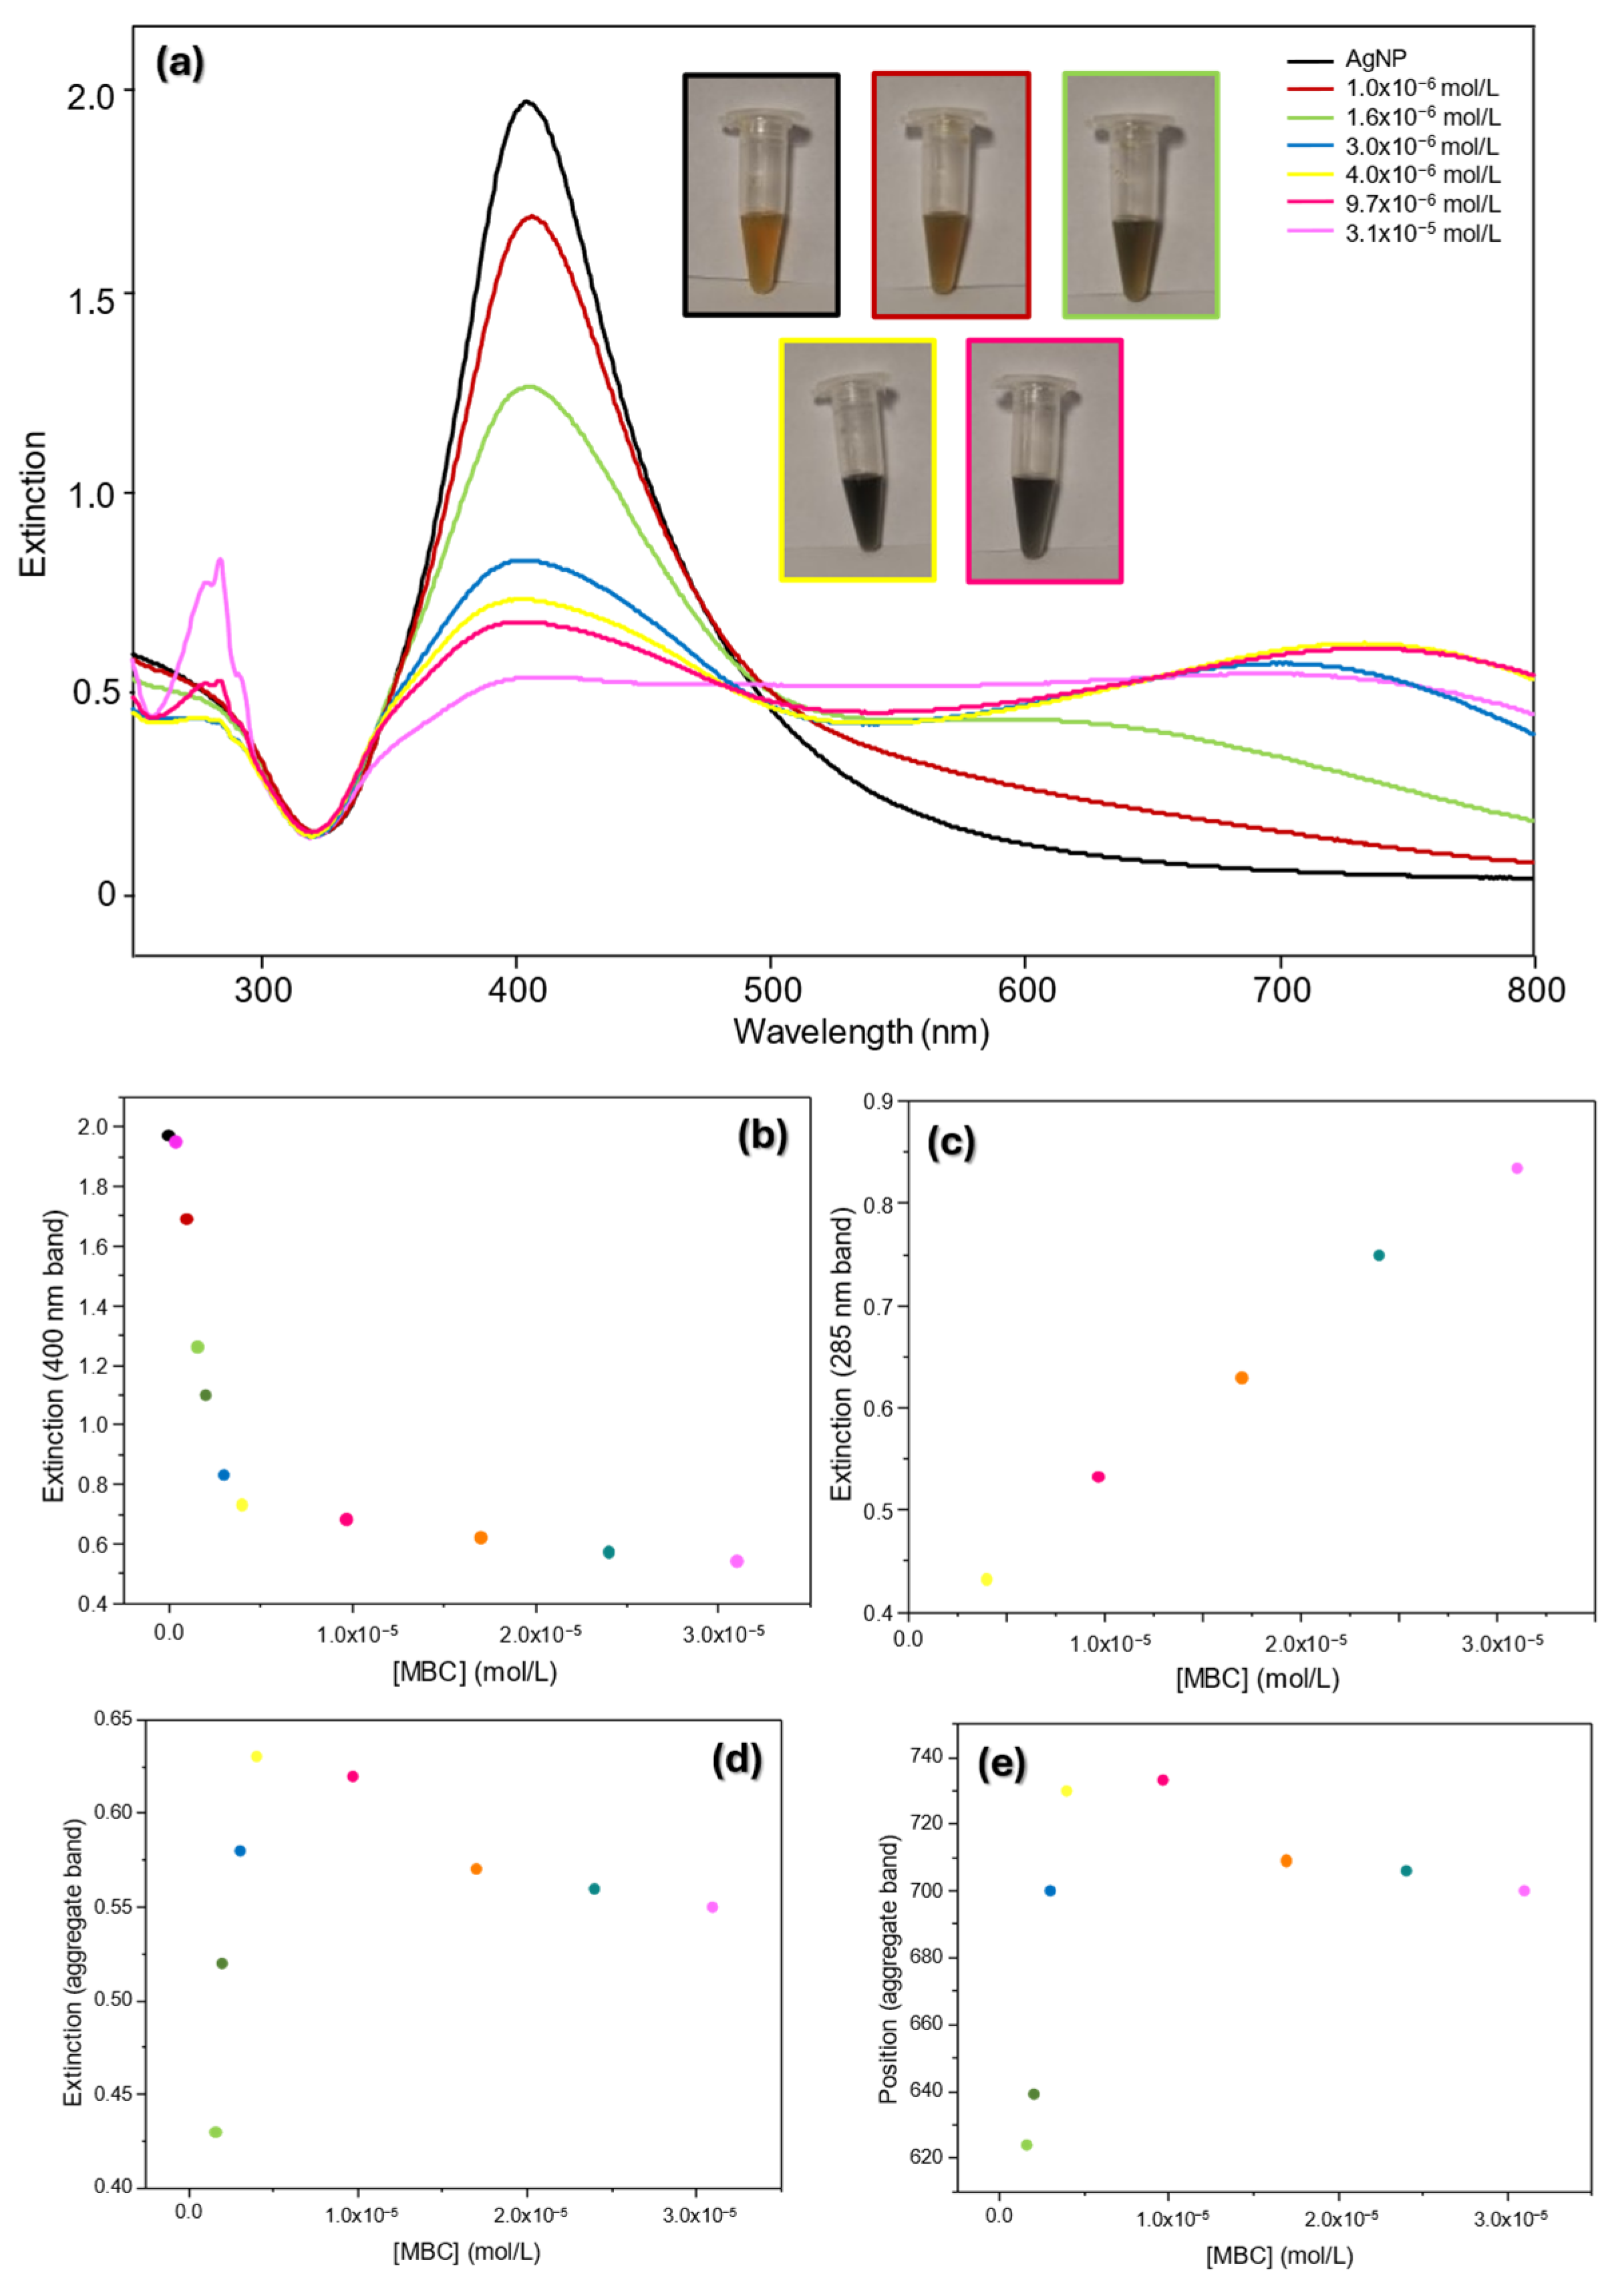
3.1.2. UV-Vis Extinction
3.1.3. TEM Images
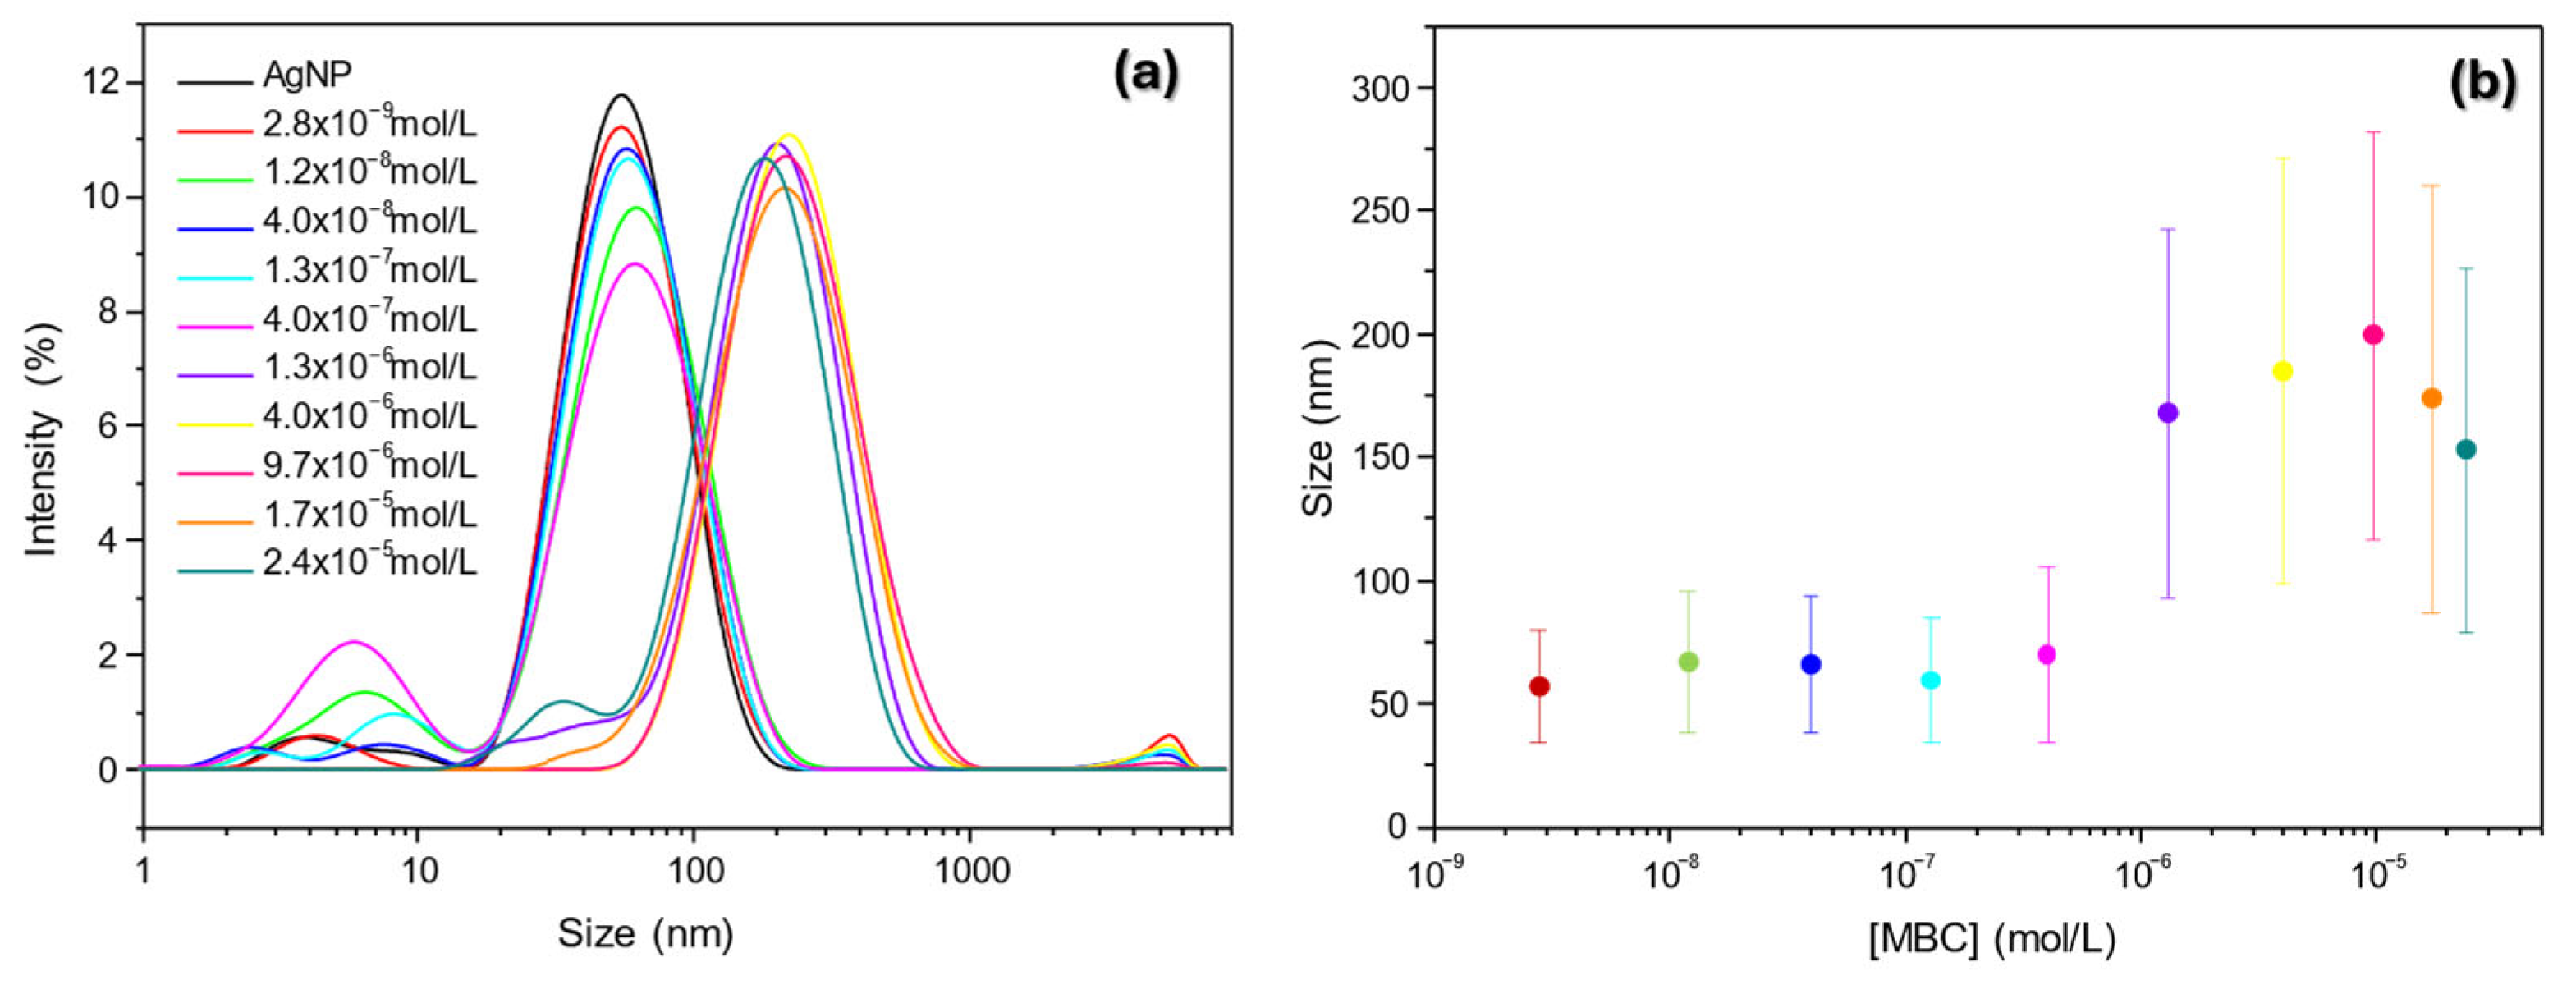
3.1.4. DLS
3.1.5. Zeta Potential
3.2. SERS in the Presence of Salt Without Ag Colloid Dilution
3.3. In the Presence of Salt: Dilution with Water Before Aggregation with KNO3
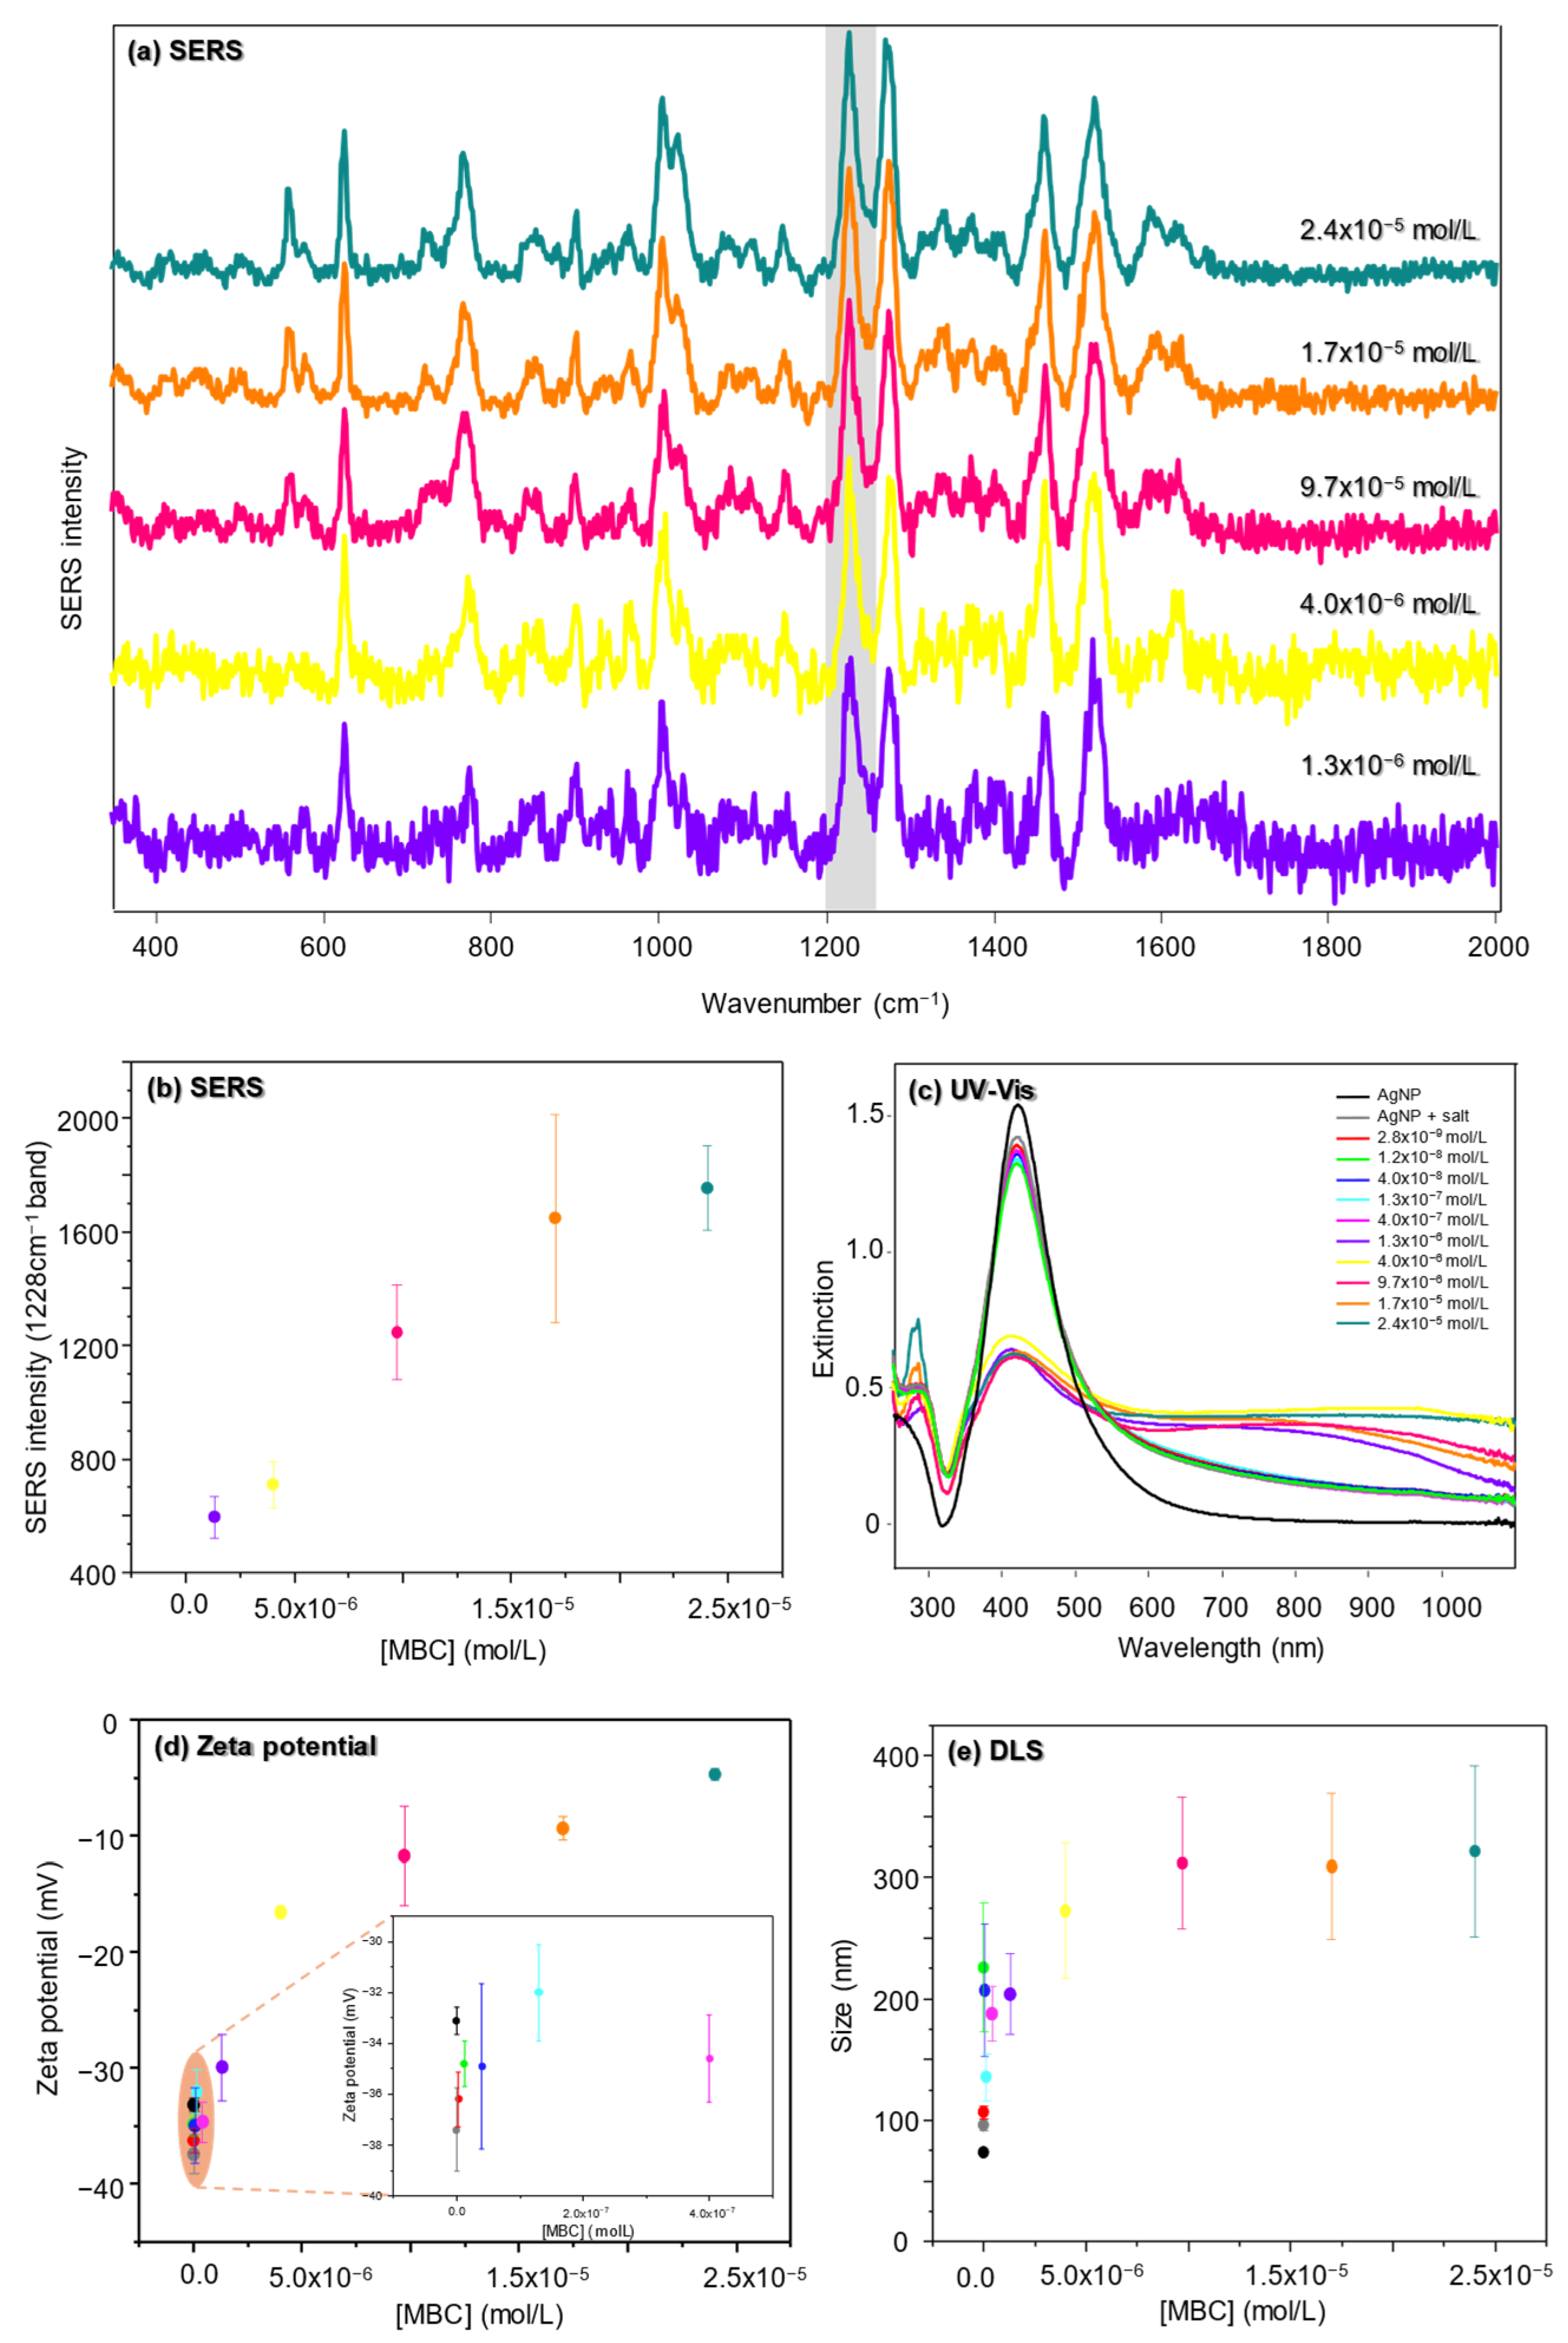
3.3.1. SERS
3.3.2. UV-Vis Extinction
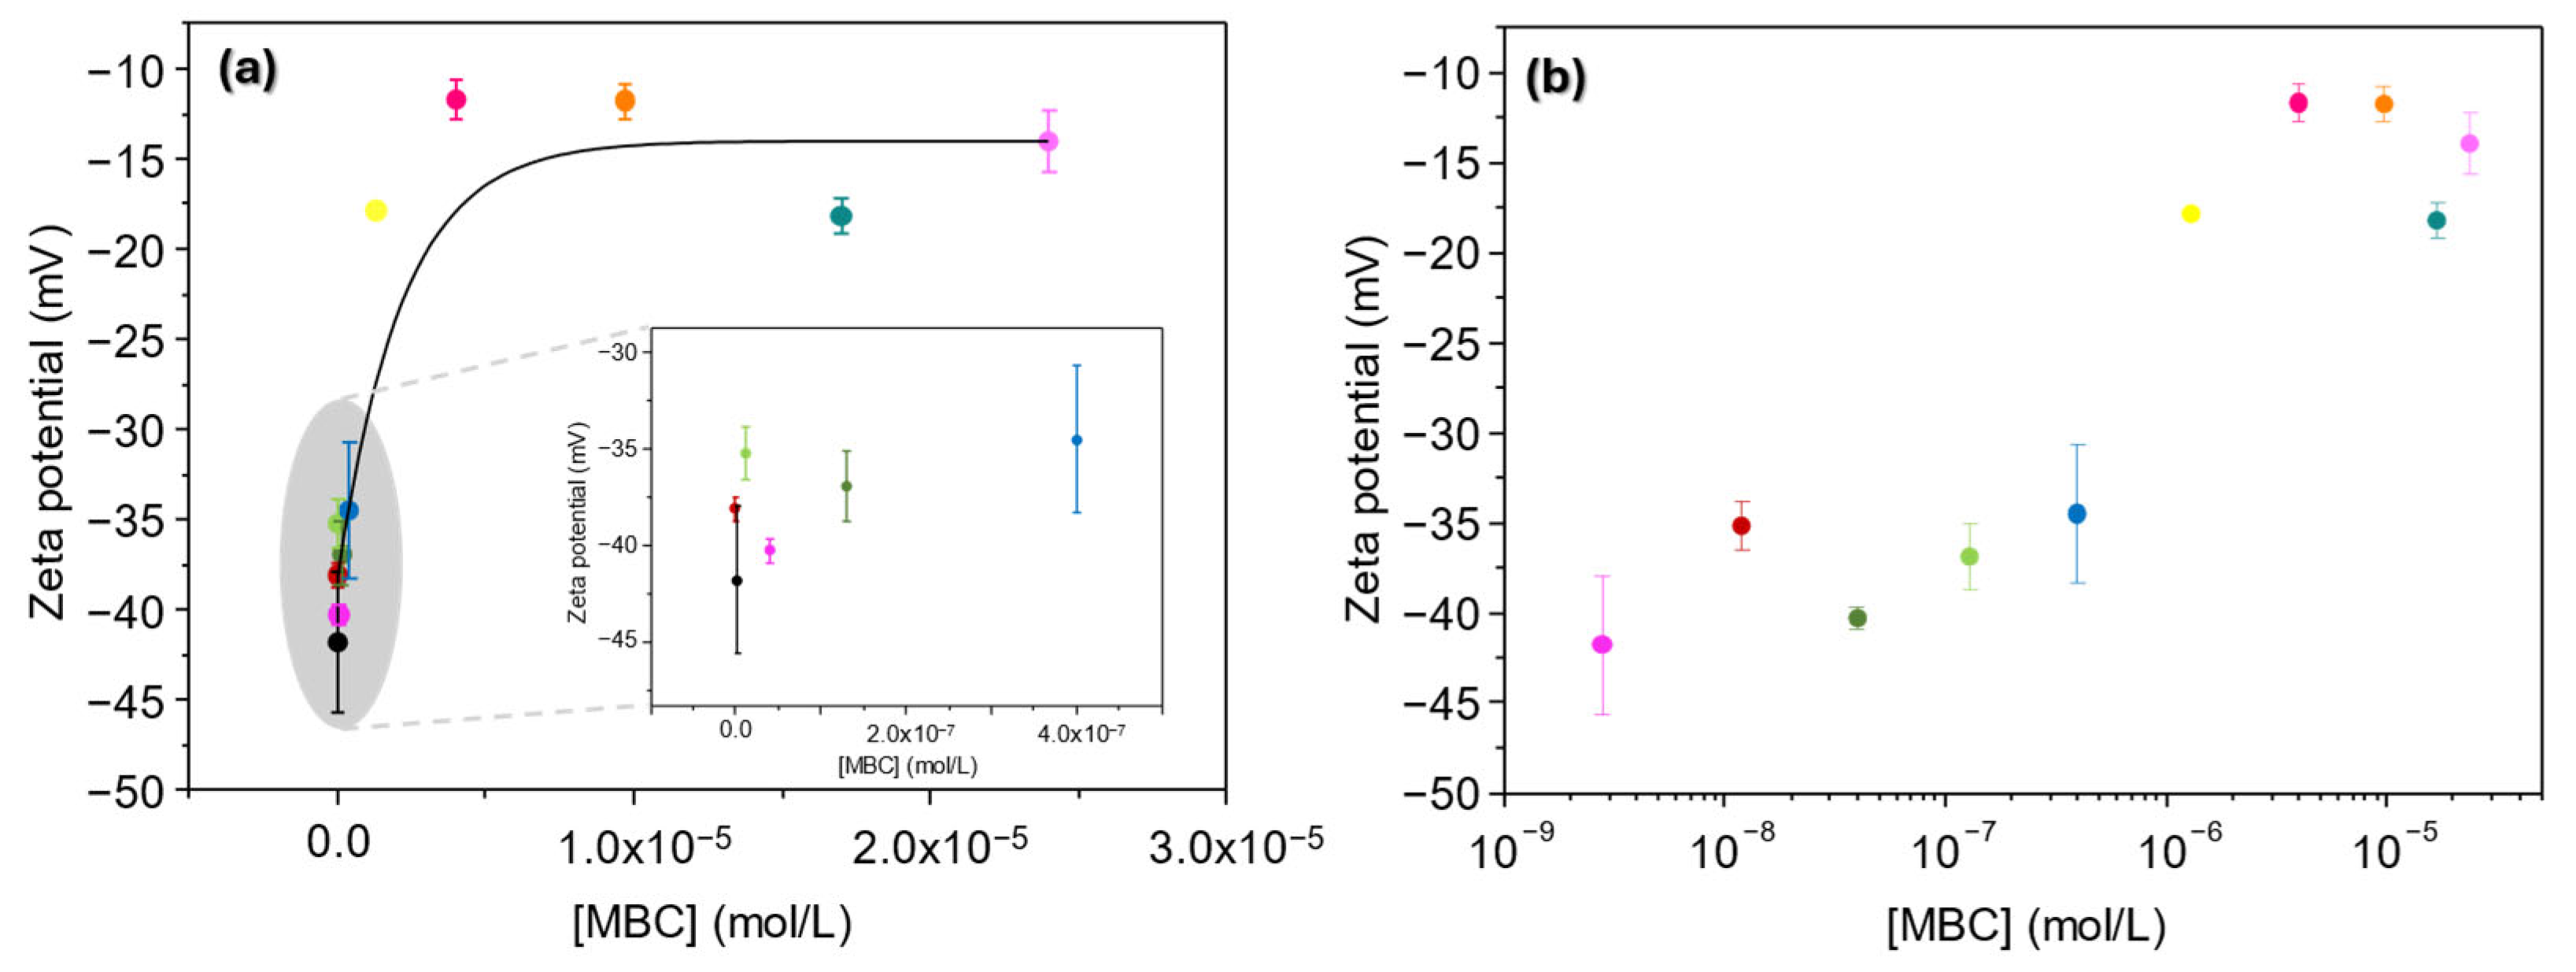
3.3.3. Zeta Potential
3.3.4. DLS
3.4. In the Presence of Salt: Aggregation with Salt Before Dilution with Water
3.4.1. UV-Vis Extinction
3.4.2. DLS
3.4.3. Zeta Potential
4. Discussion
5. Conclusions
Supplementary Materials
Author Contributions
Funding
Institutional Review Board Statement
Informed Consent Statement
Data Availability Statement
Acknowledgments
Conflicts of Interest
References
- Anvisa (Agência Nacional de Vigilância Sanitária). Nota Técnica Conclusiva de Reavaliação do Carbendazim. Available online: https://www.gov.br/anvisa/pt-br/acessoainformacao/perguntasfrequentes/agrotoxicos/reavaliacao-de-agrotoxicos-2/copy_of_NotaTcnicaFinalcomseusanexos.pdf (accessed on 4 April 2023).
- Ministério da Saúde. Carbendazim: Anvisa Concluiu Processo de Reavaliação e Mantém o Banimento. Available online: https://www.gov.br/anvisa/pt-br/assuntos/noticias-anvisa/2022/carbendazim-anvisa-concluiu-processo-de-reavaliacao-e-mantem-o-banimento (accessed on 4 April 2023).
- Shi, J.; Li, C.; Jiang, Z. A new nanosurface molecularly imprinted polymer difunctional probe and on site generated gold nanosol SERS/RRS/Abs trimode determination of trace carbendazim. Microchem. J. 2024, 196, 109573. [Google Scholar] [CrossRef]
- Wang, M.; Feng, J.; Ding, J.; Xiao, J.; Liu, D.; Lu, Y.; Liu, Y.; Gao, X. Color- and background-free Raman-encoded lateral flow immunoassay for simultaneous detection of carbendazim and imidacloprid in a single test line. Chem. Eng. J. 2024, 487, 150666. [Google Scholar] [CrossRef]
- Luong, H.N.; Nguyen, N.M.; Tran, C.K.; Nguyen, T.T.; Nguyen, N.P.; Huynh, T.M.H.; Tran, T.T.; Phan, B.T.; Thi, T.V.T.; Dang, V.Q. Detection of carbendazim by utilizing multi-shaped Ag NPs decorated ZnO NRs on patterned stretchable substrate through surface-enhanced Raman scattering effect. Sens. Actuators A Phys. 2022, 346, 113816. [Google Scholar] [CrossRef]
- Ma, C.-H.; Zhang, J.; Hong, Y.-C.; Wang, Y.-R.; Chen, X. Determination of carbendazim in tea using surface enhanced Raman spectroscopy. Chin. Chem. Lett. 2015, 26, 1455–1459. [Google Scholar] [CrossRef]
- Chen, X.; Lin, M.; Sun, L.; Xu, T.; Lai, K.; Huang, M.; Lin, H. Detection and quantification of carbendazim in Oolong tea by surface-enhanced Raman spectroscopy and gold nanoparticle substrates. Food Chem. 2019, 293, 271–277. [Google Scholar] [CrossRef]
- Furini, L.N.; Sanchez-Cortes, S.; López-Tocón, I.; Otero, J.C.; Aroca, R.F.; Constantino, C.J.L. Detection and quantitative analysis of carbendazim herbicide on Ag nanoparticles via surface-enhanced Raman scattering. J. Raman Spectrosc. 2015, 46, 1095–1101. [Google Scholar] [CrossRef]
- Furini, L.N.; Constantino, C.J.L.; Sanchez-Cortes, S.; Otero, J.C.; López-Tocón, I. Adsorption of carbendazim pesticide on plasmonic nanoparticles studied by surface-enhanced Raman scattering. J. Colloid. Interface Sci. 2016, 465, 183–189. [Google Scholar] [CrossRef] [PubMed]
- S Oliveira, M.J.; Bianchi-Carvalho, I.; GRubira, R.J.; Sánchez-Cortés, S.; LConstantino, C.J. Plasmonic Ag Nanoparticles: Correlating Nanofabrication and Aggregation for SERS Detection of Thiabendazole Pesticide. ACS Omega 2024, 9, 42571–42581. [Google Scholar] [CrossRef] [PubMed]
- Leopold, N.; Lendl, B. A New Method for Fast Preparation of Highly Surface-Enhanced Raman Scattering (SERS) Active Silver Colloids at Room Temperature by Reduction of Silver Nitrate with Hydroxylamine Hydrochloride. J. Phys. Chem. B 2003, 107, 5723–5727. [Google Scholar] [CrossRef]
- McCreery, R.L. Raman Spectroscopy for Chemical Analysis; Wiley: Hoboken, NJ, USA, 2000. [Google Scholar] [CrossRef]
- Sánchez-Cortés, S.; García-Ramos, J.V.; Morcillo, G. Morphological Study of Metal Colloids Employed as Substrate in the SERS Spectroscopy. J. Colloid Interface Sci. 1994, 167, 428–436. [Google Scholar] [CrossRef]
- Hsu, J.-P.; Liu, B.-T. Critical Coagulation Concentration of a Colloidal Suspension at High Particle Concentrations. J. Phys. Chem. B 1998, 102, 334–337. [Google Scholar] [CrossRef]
- Blatchford, C.G.; Campbell, J.R.; Creighton, J.A. Plasma resonance—Enhanced raman scattering by absorbates on gold colloids: The effects of aggregation. Surf. Sci. 1982, 120, 435–455. [Google Scholar] [CrossRef]
- Bodian, E.; Sarr, I.; Sambou, S.; Mendy, A.; Gueye, C.; Diop, C.; Diagne, I.; Thiaré, D.; Diaw, P.; Gaye-Seye, M.; et al. Spectrophotometric Method for the Determination of Carbendazim in Orange Juice Samples Marketed in Senegal. Chem. Sci. Int. J. 2017, 21, 1. [Google Scholar] [CrossRef]
- Weitz, D.A.; Lin, M.Y.; Lindsay, H.M. Universality laws in coagulation. Chemom. Intell. Lab. Syst. 1991, 10, 133–140. [Google Scholar] [CrossRef]
- Aroca Muñoz, R.F.; Campos Vallete, M.; García Ramos, J.V. Amplificación Plasmónica de Espectros Raman y de Fluorescencia: SERS y SEF Sobre Nanoestructuras Metálicas; Consejo Superior de Investigaciones Cientificas: Madrid, Spain, 2014. [Google Scholar]
- Giles, C.H.; MacEwan, T.H.; Nakhwa, S.N.; Smith, D. 786. Studies in adsorption. Part XI. A system of classification of solution adsorption isotherms, and its use in diagnosis of adsorption mechanisms and in measurement of specific surface areas of solids. J. Chem. Soc. (Resumed) 1960, 846, 3973–3993. [Google Scholar] [CrossRef]
- Cunningham, D.; Littleford, R.E.; Smith, W.E.; Lundahl, P.J.; Khan, I.; McComb, D.W.; Graham, D.; Laforest, N. Practical control of SERRS enhancement. Faraday Discuss. 2006, 132, 135–145. [Google Scholar] [CrossRef] [PubMed]

Disclaimer/Publisher’s Note: The statements, opinions and data contained in all publications are solely those of the individual author(s) and contributor(s) and not of MDPI and/or the editor(s). MDPI and/or the editor(s) disclaim responsibility for any injury to people or property resulting from any ideas, methods, instructions or products referred to in the content. |
© 2025 by the authors. Licensee MDPI, Basel, Switzerland. This article is an open access article distributed under the terms and conditions of the Creative Commons Attribution (CC BY) license (https://creativecommons.org/licenses/by/4.0/).
Share and Cite
Bianchi-Carvalho, I.; Oliveira, M.J.d.S.; Martin, C.S.; Sánchez-Cortés, S.; Constantino, C.J.L. Influence of Sample Preparation on SERS Signal. Chemosensors 2025, 13, 22. https://doi.org/10.3390/chemosensors13010022
Bianchi-Carvalho I, Oliveira MJdS, Martin CS, Sánchez-Cortés S, Constantino CJL. Influence of Sample Preparation on SERS Signal. Chemosensors. 2025; 13(1):22. https://doi.org/10.3390/chemosensors13010022
Chicago/Turabian StyleBianchi-Carvalho, Isabela, Marcelo José dos Santos Oliveira, Cibely Silva Martin, Santiago Sánchez-Cortés, and Carlos José Leopoldo Constantino. 2025. "Influence of Sample Preparation on SERS Signal" Chemosensors 13, no. 1: 22. https://doi.org/10.3390/chemosensors13010022
APA StyleBianchi-Carvalho, I., Oliveira, M. J. d. S., Martin, C. S., Sánchez-Cortés, S., & Constantino, C. J. L. (2025). Influence of Sample Preparation on SERS Signal. Chemosensors, 13(1), 22. https://doi.org/10.3390/chemosensors13010022