Article

Near-Infrared Multiwavelength Raman Anti-Stokes/Stokes Thermometry of Titanium Dioxide

1
Department of Chemical Sciences, University of Padova, via Marzolo 1, 35131 Padova, Italy
2
Consorzio INSTM, via G. Giusti 9, 50121 Firenze, Italy
*
Author to whom correspondence should be addressed.
Chemosensors 2024, 12(9), 191; https://doi.org/10.3390/chemosensors12090191
Submission received: 1 August 2024 / Revised: 5 September 2024 / Accepted: 13 September 2024 / Published: 17 September 2024
(This article belongs to the Special Issue Recent Advances in Optical Chemo- and Biosensors)

Abstract

:
The use of multiple wavelengths to excite Titanium Dioxide Raman scattering in the near-infrared was investigated for optical nanothermometry. Indeed, Raman spectroscopy can be a very interesting technique for this purpose, as it offers non-disruptive contactless measurements with a high spatial resolution, down to a few µm. A method based on the ratio between the anti-Stokes and Stokes peaks of Anatase Titanium Dioxide was proposed and tested at three different wavelengths, 785, 800 and 980 nm, falling into the first biological transparency window (BTW-I). Using a temperature-controller stage, the temperature response of the sample was measured between 20 and 50 °C, allowing the thermal sensitivity for this range to be estimated. The use of sufficiently high laser power results in the generation of local heating. A proof of concept of the proposed thermometric method was performed by determining the extent of local heating induced by increasing laser power. By exciting with an 800 nm laser at low power intensities, a temperature equal to room temperature (RT) was found, while a maximum temperature increase of 15 °C was detected using the anti-Stokes/Stokes method.

1. Introduction

Temperature is a parameter that plays a fundamental role in chemical and biological processes, so its determination, with high accuracy and precision, is applied in various fields, such as microelectronics, optics, microfluidics, chemical reactions and biochemical processes, living cells and nanomedicine [1,2]. In the biomedical field, the temperature of a living cell can be used to monitor cell health, since pathological cells are warmer than normal cells due to their enhanced metabolic activity [3,4]. Therefore, thermometry can be a powerful diagnostic tool, also useful during hyperthermia treatments to know the exact localized heat release and avoid unwanted damage to surrounding healthy tissues [5,6,7]. Optimized multifunctional materials that simultaneously possess the ability to probe the temperature and allow the controlled release of heat have recently been developed [8]. The local detection of temperature in the context of biomedical applications requires a reduced size of the material, down to the micro- or even nanoscale, and a high thermal resolution, as, for example, many diseases determine intracellular temperature changes of 1 K or less; for these reasons the identification of highly performing and small-dimensional thermometers, useful for a specific detection technique, remains a hot topic [3,5]. Additionally, when light sources are used, a deep penetration capacity is required, working in the biological transparency windows, BTWs (from 700 to 980 nm or 1000 to 1400 nm) [9,10,11].
Conventional thermometry approaches are based on contact techniques, implying direct contact with the medium of interest, but for many applications, including biomedical applications, invasive methods are not useful, and non-invasive methods, which remotely observe the medium of interest to determine its temperature, are preferred [12,13]. These techniques measure the temperature by exploiting the optical properties of materials, such as absorption and emission spectroscopy, luminescence [14,15,16,17,18], for example of lanthanide ion-based materials [19,20,21], and scattering [22,23,24]. Among the materials that have been exploited as Raman temperature sensors, we find opaque semiconductors like silicon, electro-optic materials like LiNbO3 [25], graphene [26], water droplets [27], polymer blends embedded in an organic light-emitting diode [28] and, more recently, Anatase Titanium Dioxide (TiO2) nanoparticles [29].
In general, the spectra of probes used for optical nanothermometry are composed of many peaks, the intensities of which vary with temperature. It is possible to use either a single emission band or a ratio of intensities, with the second emission band serving as a reference. Because the peak intensity depends on the concentration of emitting centers and on the excitation power density that illuminates the sample, changes in these parameters can cause significant variations in signal strength and, as a result, errors in temperature determination. When choosing the signals for ratiometric methods, it is important to keep in mind that (a) they can refer only to thermally coupled levels, so that at a certain temperature the thermal energy (kBT) is enough to populate the higher energy level, and (b) the greater the difference in the temperature variation between the two signal intensities, the greater the sensitivity. The two signals can be two emission bands from two separate excited states, as it is for luminescence thermometry, or Stokes and anti-Stokes bands of the same vibration, as it is for Raman thermometry [22,30,31].
Previously, it was demonstrated by our group that TiO2 in Anatase form is an excellent candidate for temperature detection because it has an intense Raman peak at low frequencies, which is ideal for anti-Stokes-to-Stokes ratio (hereinafter referred to as aS/S) thermometry [29]. It has already been tested in the visible region of the spectrum, where good temperature sensitivity and uncertainty were found. Furthermore, Anatase NPs are biocompatible materials of indispensable quality for applications in the biomedical field [32,33].
This work fits into these research areas; it consists of the characterization of Anatase particles that are tested as thermometric probes in the first biological window. To the best of our knowledge, in the literature, there are presently no examples of Raman aS/S thermometers working efficiently in the NIR and particularly in the BTWs.
The versatility of the thermometer, a feature that can be very useful in cases of interferences with other components in complex biological matrices, was proved by changing the excitation laser wavelength in a wide range from 800 to 980 nm and recording the Stokes and anti-Stokes spectra of Anatase. Three wavelengths were chosen to perform thermometry measurements, 785, 800 and 980 nm, corresponding to commercially available lasers in the NIR. The performance of the thermal probe was determined in terms of thermal sensitivity. Moreover, using the parameters derived from temperature calibration, it was possible to monitor the increasing temperature as a consequence of the increasing laser power irradiating the sample.

2. Materials and Methods

2.1. Materials

A commercial Anatase powder (Sigma Aldrich, Merck KGaA, St. Louis, MO, USA) was used as the Raman active material. It was pressed on a KBr pellet disk, giving a final thickness of a few hundred µm.

2.2. Characterization Techniques

2.2.1. Structural Characterization—XRD

The diffraction patterns were collected using a Bruker AXS D8 ADVANCE Plus diffractometer (Bruker, Billerica, MA, USA) equipped with C u K α radiation of wavelength 1.5406 Å and the data were acquired in the range of 20–80° with a step scan of 0.027°/s. The experimental data were then elaborated using DIFFRACT.EVA (Bruker, Billerica, MA, USA) for phase-matching and estimation of the crystallite dimensions.

2.2.2. Diffuse Reflectance

Diffuse reflectance spectra of TiO2 Anatase powder were recorded in the range of 300–1100 nm using a spectrometer (FLS1000, Edinburgh Instruments Ltd., Livingston, Edinburgh, UK), equipped with an integrating sphere and a Xe lamp as excitation source. A Ba2SO4 plug was used as a reference for the calculation of the diffuse reflectance spectrum. The PMT980 (R13456P, Hamamatsu Photonics Deutschland GmbH, Herrsching am Ammersee, Germany) photomultiplier was used to register the spectrum in the range of 300–900 nm, and PMT-NIR1700 (R5509-73, Hamamatsu Photonics Deutschland GmbH, Herrsching am Ammersee, Germany) was used in the range of 900–1100 nm.

2.2.3. Optical Characterization—Raman Spectroscopy Set-Up

A micro-Raman set-up in a backscattering geometry is used for Raman measurements. It is equipped with a CW Ti: Sapphire laser, tunable in the range from 675 to 1000 nm (MKS Instruments, Spectra Physics, 3900S, Santa Clara, CA, USA) and pumped by a CW Optically Pumped Semiconductor Laser (Coherent, Verdi G7, Santa Clara, CA, USA). The laser beam is coupled to a microscope (Olympus BX 40, Tokyo, Japan) and focused on the sample by a 20× objective (Olympus SLMPL, Tokyo, Japan) for IR. All optics, mirrors, lenses and nonpolarizing beam splitters are optimized for IR light. Raman scattering is collected in the slit of a three-stage subtractive spectrograph (Jobin Yvon S3000, Horiba, Kyoto, Japan) using a set of achromatic lenses. The spectrograph is made up of a double monochromator (Jobin Yvon, DHR 320, Horiba, Kyoto, Japan), which works as a tunable filter rejecting elastic scattering, and a spectrograph (Jobin Yvon, HR 640, Horiba, Kyoto, Japan). The Raman signal is detected by a liquid nitrogen-cooled CCD (Jobin Yvon, Symphony 1024 × 256 pixels front illuminated). When using an entrance slit of 50 µm, an accuracy of 0.6 cm−1 is obtained to determine the peak position.

2.2.4. Excitation Wavelength Measurements

The laser wavelength was changed from 800 to 980 nm to perform excitation wavelength measurements. RT Anatase Stokes and anti-Stokes Raman spectra of the sample, prepared as described above, were collected every 5 nm at various excitation wavelengths in the tested range.

2.2.5. Temperature Detection

During thermometry measurements, the temperature varied, while the laser’s wavelength and input power remained constant. This type of experiment was performed by exciting samples at 785, 800 and 980 nm, with a power of 1 mW. The sample temperature was varied using a temperature-controlled stage (Linkam, THMS600/720, Tadworth, UK), which works with a liquid nitrogen reservoir and heating resistances, producing a control of 0.1 K on the temperature of the sample chamber. A procedure that allowed the purging of air was performed after the sample was introduced into the chamber of the temperature-controlled stage and before all tests were performed. Therefore, the air in the chamber was replaced by an inert static nitrogen environment. The temperature was gradually increased at a rate of 5 K/min, and when it reached the required value, the sample was left to thermalize for 15 min. After this procedure was completed, successive Stokes and anti-Stokes spectra were recorded to determine the local temperature of the sample. Matlab (Version Number R2021b) was used to fit Raman peaks with a Lorentzian function to provide values for intensity, area, location and width. Thus, for any temperature set by the controlled stage, it was possible to determine the value of the aS/S intensity ratio.

2.2.6. Laser Power Effect on the Local Temperature

The local temperature increase in the sample was measured as an effect of an increasing power of the laser. During this type of experiment, the laser power was varied, while the excitation wavelength was fixed. The sample was kept at 25 °C by means of the temperature-controlled stage and illuminated with a laser at 800 and 980 nm. The power of the laser incident on the sample, determined in close vicinity to the sample surface and already accounting for the attenuation of the optics present in the set-up, was set at 0.8, 2, 2.5, 4, 6.4, 10.1, 12.7 and 16 mW. The intensity at the maximum value was calculated to be 3.4 × 10⁸ mW/cm2 at 800 nm and 2.9 × 10⁸ mW/cm2 at 980 nm. For each input power, a set of anti-Stokes and Stokes spectra was recorded, so that the value of the aS/S ratio could be determined. The thermometric parameters obtained with the procedure described above allowed an estimation of the sample’s heating.

2.3. Methods

2.3.1. Raman Nanothermometry

The principle of the anti-Stokes/Stokes method for Raman nanothermometry can be described starting from the Jablonski diagram reported in Figure 1a. Temperature detection can be performed by measuring the intensity ratio of the Stokes and anti-Stokes lines or through the investigation of the Stokes Raman band. Temperature is inferred from changes in the position, intensity or shape of a Stokes Raman band. As the temperature increases, chemical bonds may loosen, leading to a decrease in vibrational frequency (band shift) or the induction of structural changes in the material, as depicted in Figure 1b. The first method is effective for materials with low-frequency Raman modes and can be described as follows.
If two vibrational levels of the ground state S 0 of the Raman-active material are considered, the ratio between their population densities can be described by a Maxwell–Boltzmann distribution. The interaction of the system with a laser with a frequency of ν 0 results in the scattering of Stokes and anti-Stokes photons of frequencies ν S   ν S = ν 0 ν m and ν a S   ν a S = ν 0 + ν m . As the scattering associated with the Stokes and anti-Stokes transitions is proportional, respectively, to the population density of the lower and higher vibrational states [34], the intensity ratio of anti-Stokes I a S and Stokes I S bands is given by
ρ t h T = I a S I S = v 0 + v m 3 v 0 v m 3 exp h v m k B T
where ν m is the frequency of the vibrational mode m considered, ν 0 the laser frequency, h the Planck’s constant, k B the Boltzmann constant and T the local temperature. A frequency dependence on the third power of the aS/S ratio is required when the detection system is based on photon counting (CCD), whereas a fourth power dependence would be more acceptable if the detection were energy-based [25].
Thermal sensitivity, S t h , one of the most often used thermometric figures of merit, defines how significant the variation in the response is—in this case, the aS/S ratio ρ —with regard to a unit temperature variation.
S t h = ρ t h ( T ) T = ρ t h · h v m k B T 2
The relative thermal sensitivity, S r , t h , instead, is determined by simply dividing the thermal sensitivity S t h , as calculated in Equation (2), by the aS/S ratio ρ t h itself. The result shows that the relative thermal sensitivity S r , t h is equal to
S r , t h = 1 ρ t h ( T ) ρ t h ( T ) T = h v m k B T 2
As an example, we can consider a Raman-active system, which can be excited at 514.5, 785 and 980 nm, producing the Stokes and anti-Stokes bands B1, B2, B3 and B4, depicted in the spectrum of Figure 2a. The position of Raman modes in the spectrum, namely the Raman shift, is a characteristic of the material and does not change with the excitation laser’s wavelength. The Stokes peaks are centered at 143, 400, 515 and 640 cm−1, whereas the anti-Stokes counterparts are located at the same Raman shift with negative sign. In principle, it is possible to use the ratio between the Stokes and anti-Stokes intensities (aS/S) of any of the four pairs to determine the temperature of the sample at a local level.
The natural logarithm of the aS/S ratio, calculated using Equation (1) with λ e x c = 785 nm, is shown in Figure 2b, where lines with different colors represent the ρ t h ( T ) values for B1 (dark blue), B2 (light blue), B3 (light red) and B4 (dark red). Because the aS/S ratio depends on the frequency ν m , it is different for each Raman mode, thus explaining the different behavior with respect to temperature. In particular, the lower the frequency, the higher the value of aS/S at a certain temperature. Absolute sensitivities are calculated for the same excitation wavelength ( λ e x c = 785 nm) as the first derivative of the aS/S ratio with respect to temperature (Equation (1)), and are reported in Figure 2c. It is easy to observe that the absolute sensitivities reach their maxima at different positions, where the values of the maxima, S m a x = 0.28, 0.11, 0.09 and 0.08%K−1, and temperature at which are located, T m a x = 103, 287, 369 and 459 K, increase with the increasing frequency of the Raman mode. The relative sensitivities S r , t h , plotted against temperature in Figure 2d, are calculated by dividing S t h for the aS/S ratio (Equation (3)), eliminating the dependence on the excitation wavelength. This operation results in a direct proportionality between S r , t h and v m , thus producing a higher relative sensitivity for the B4 mode than for the B1, as can be appreciated in Figure 2d.
The effect of different excitation wavelengths on the aS/S ratio and absolute sensitivity of the B1 Raman mode are shown in Figure 2e,f. In both cases, the values, calculated at λ e x c = 514.5, 785 and 980 nm, increase with increasing wavelength. Experimentally, anti-Stokes and Stokes bands are collected at different temperatures, producing a set of aS/S ratios as functions of T for each Raman mode and for each excitation wavelength at which the experiments were conducted. These data can be fitted using the following equation,
ρ e x p T = β · e x p ( α T )
or with the following equation, if the logarithm of the aS/S ratio is plotted against 1/T.
l n ρ e x p T = l n β α T
From the fitting of the experimental thermometric curves, it is possible to determine the parameters α and β , and compare their values with the pre-exponential factor and the exponent coefficient of Equation (1), respectively [35,36]. The deviations of α from h v m / k B and β from v 0 + v m 3 / v 0 v m 3 are mainly attributed to the dependence of these empirical parameters also on the experimental set-up characteristics, such as incoming laser polarization and detector and grating efficiency. Not only is a different value of ρ e x p T (Equation (4)), with respect to ρ t h ( T ) (Equation (1)) thus expected, but also of the experimental S e x p and S r , e x p with respect to S t h and S r , t h . The experimental values can be determined once α and β are known (see Equations (4) and (5)):
S e x p = ρ e x p ( T ) T = ρ e x p · α T 2
S r , e x p = 1 ρ e x p ( T ) ρ e x p ( T ) T = α T 2
In summary, the proposed anti-Stokes/Stokes method for local temperature detection can be applied to any Raman peak. The choice of the best Raman mode is based on aS/S ratio comparison together with absolute and relative sensitivities.
These values can be calculated within the relevant temperature range for a specific Raman mode of a given frequency and for a defined excitation wavelength using the equations previously provided (Equations (1)–(3)). Nonetheless, it is preferred to experimentally evaluate these quantities by fitting l n ρ e x p ( T ) data plotted against 1/T with Equation (5) to obtain the α and β parameters and estimate S e x p (Equation (6)) and S r , e x p (Equation (7)).

2.3.2. Use of the Proposed Method to Determine the Increase in the Local Temperature of the Sample

The method described above can also be used to detect the local heating of the sample when the power of the laser is increased above a certain threshold value. The experimental value of the aS/S ratio can be evaluated as a function of laser power, ρ ( P ) , and the local temperature T ( P ) can be calculated using the following equation,
T P = α l n ρ e x p P l n β
where α and β are determined through the fitting of l n ρ e x p ( T ) vs. 1/T thermometric data (Equation (5)). The temperature increase T is expressed as the difference between T ( P ) and RT.

3. Results and Discussion

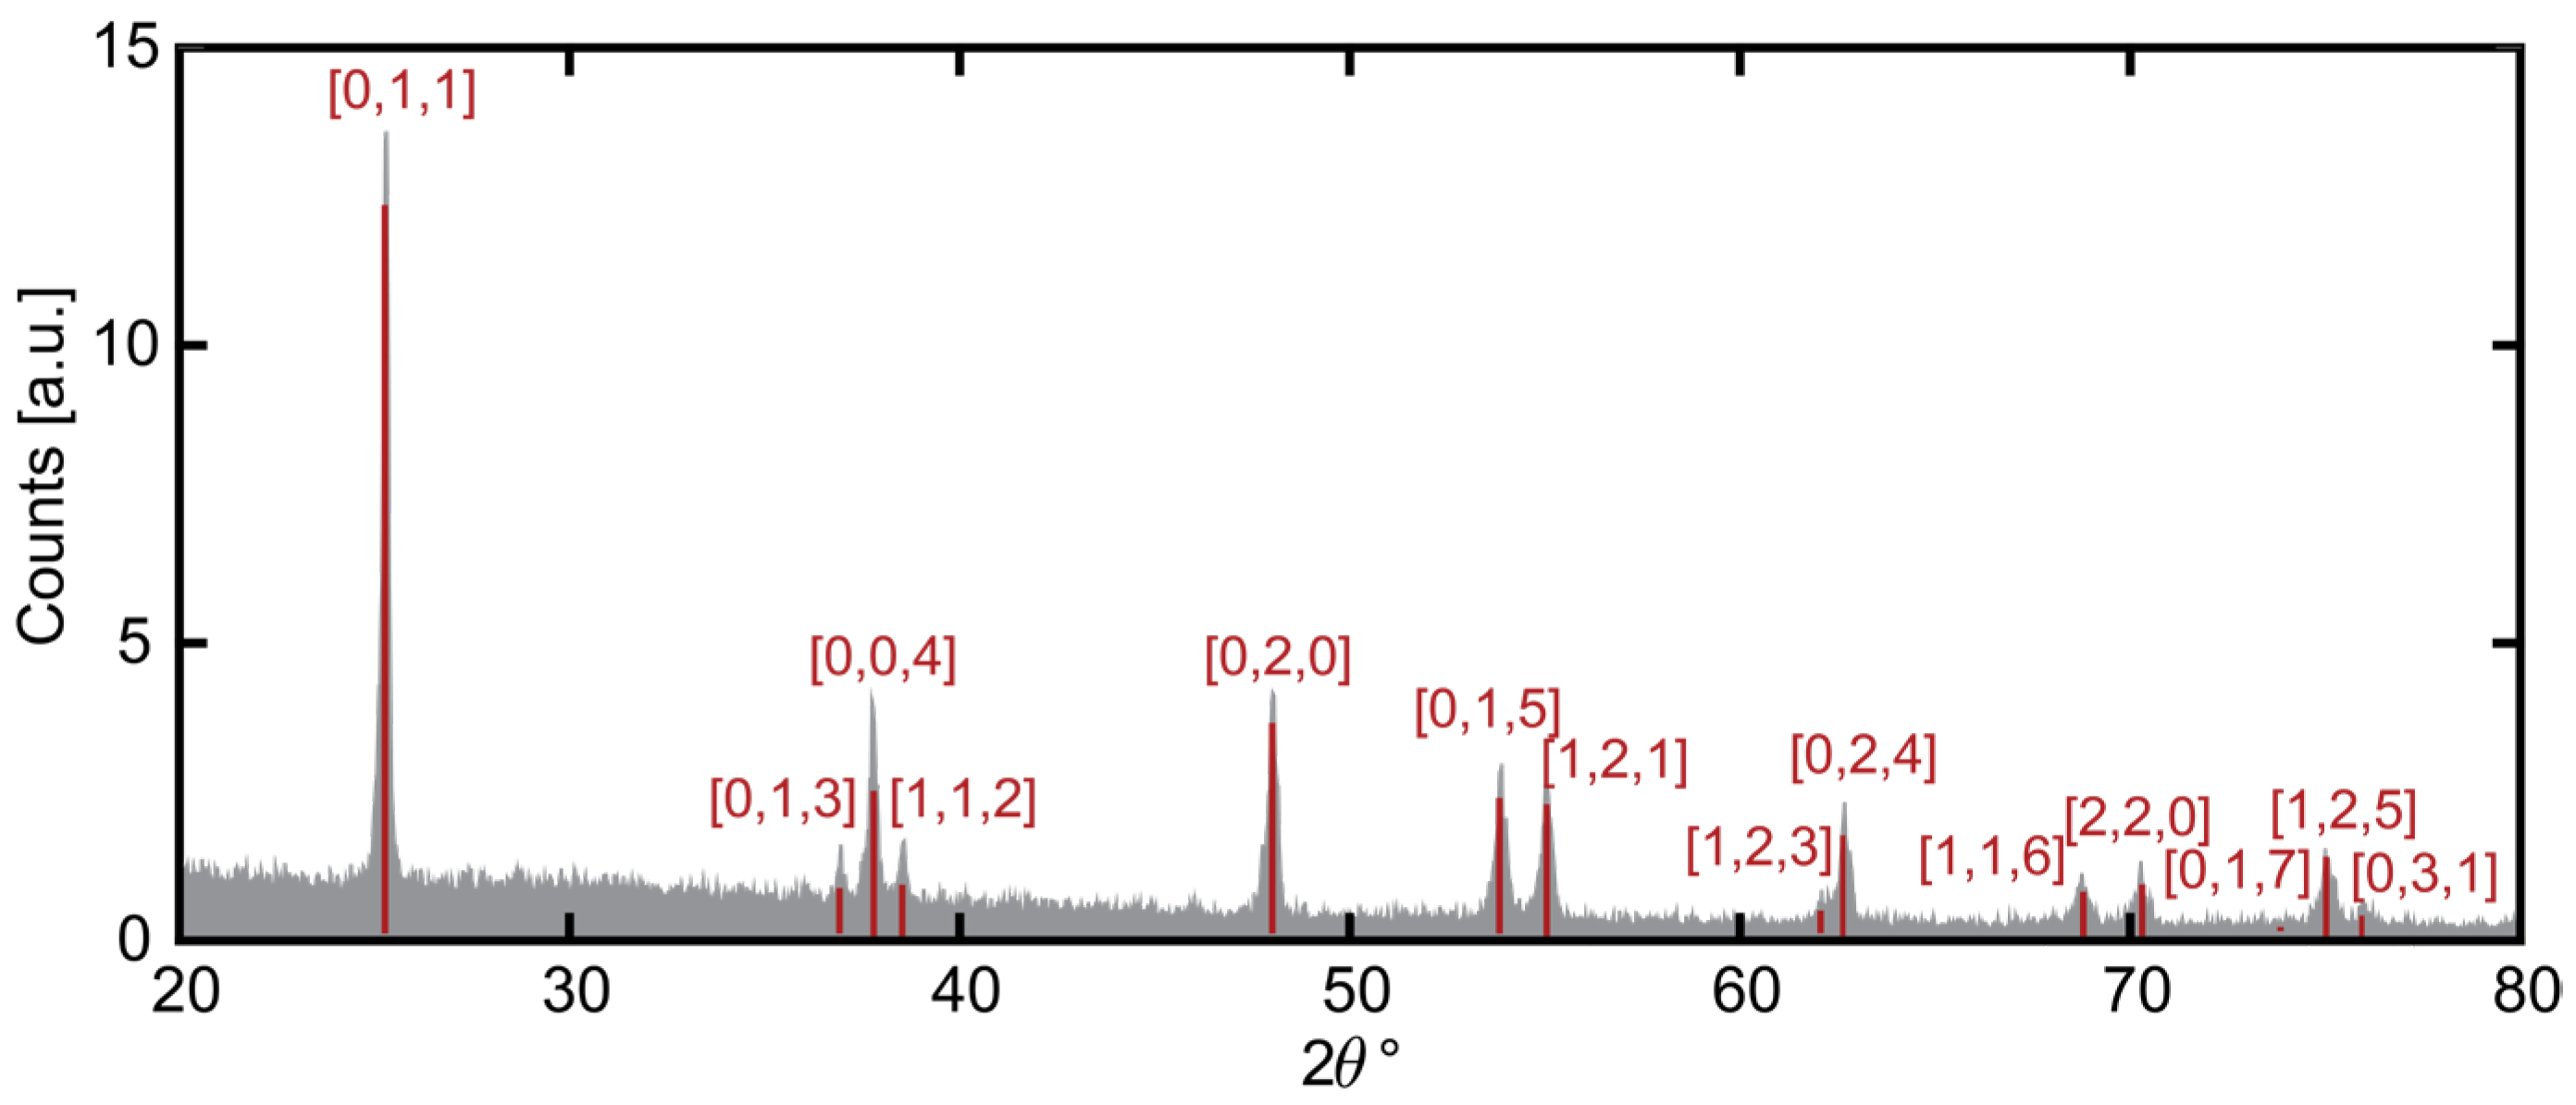
DIFFRACT.EVA was used to analyze the X-ray diffraction (XRD) pattern, shown in Figure 3, which confirmed the purity of the sample, since Anatase (COD 9015929) is the only phase present.
An average crystallite size of 41 nm was calculated from the [0 1 1] peak located at 25.31°, which is the most intense peak of the diffraction pattern, through the Scherrer equation. The other diffraction peaks, indexed using the [h,k,l] notation, are assigned in the same Figure.
The diffuse reflectance spectrum of the anatase powder, reported in Figure 4, shows a jump at the anatase band-gap between 350 and 400 nm and a reflectance equal to 90% from 400 nm up to 1100 nm.
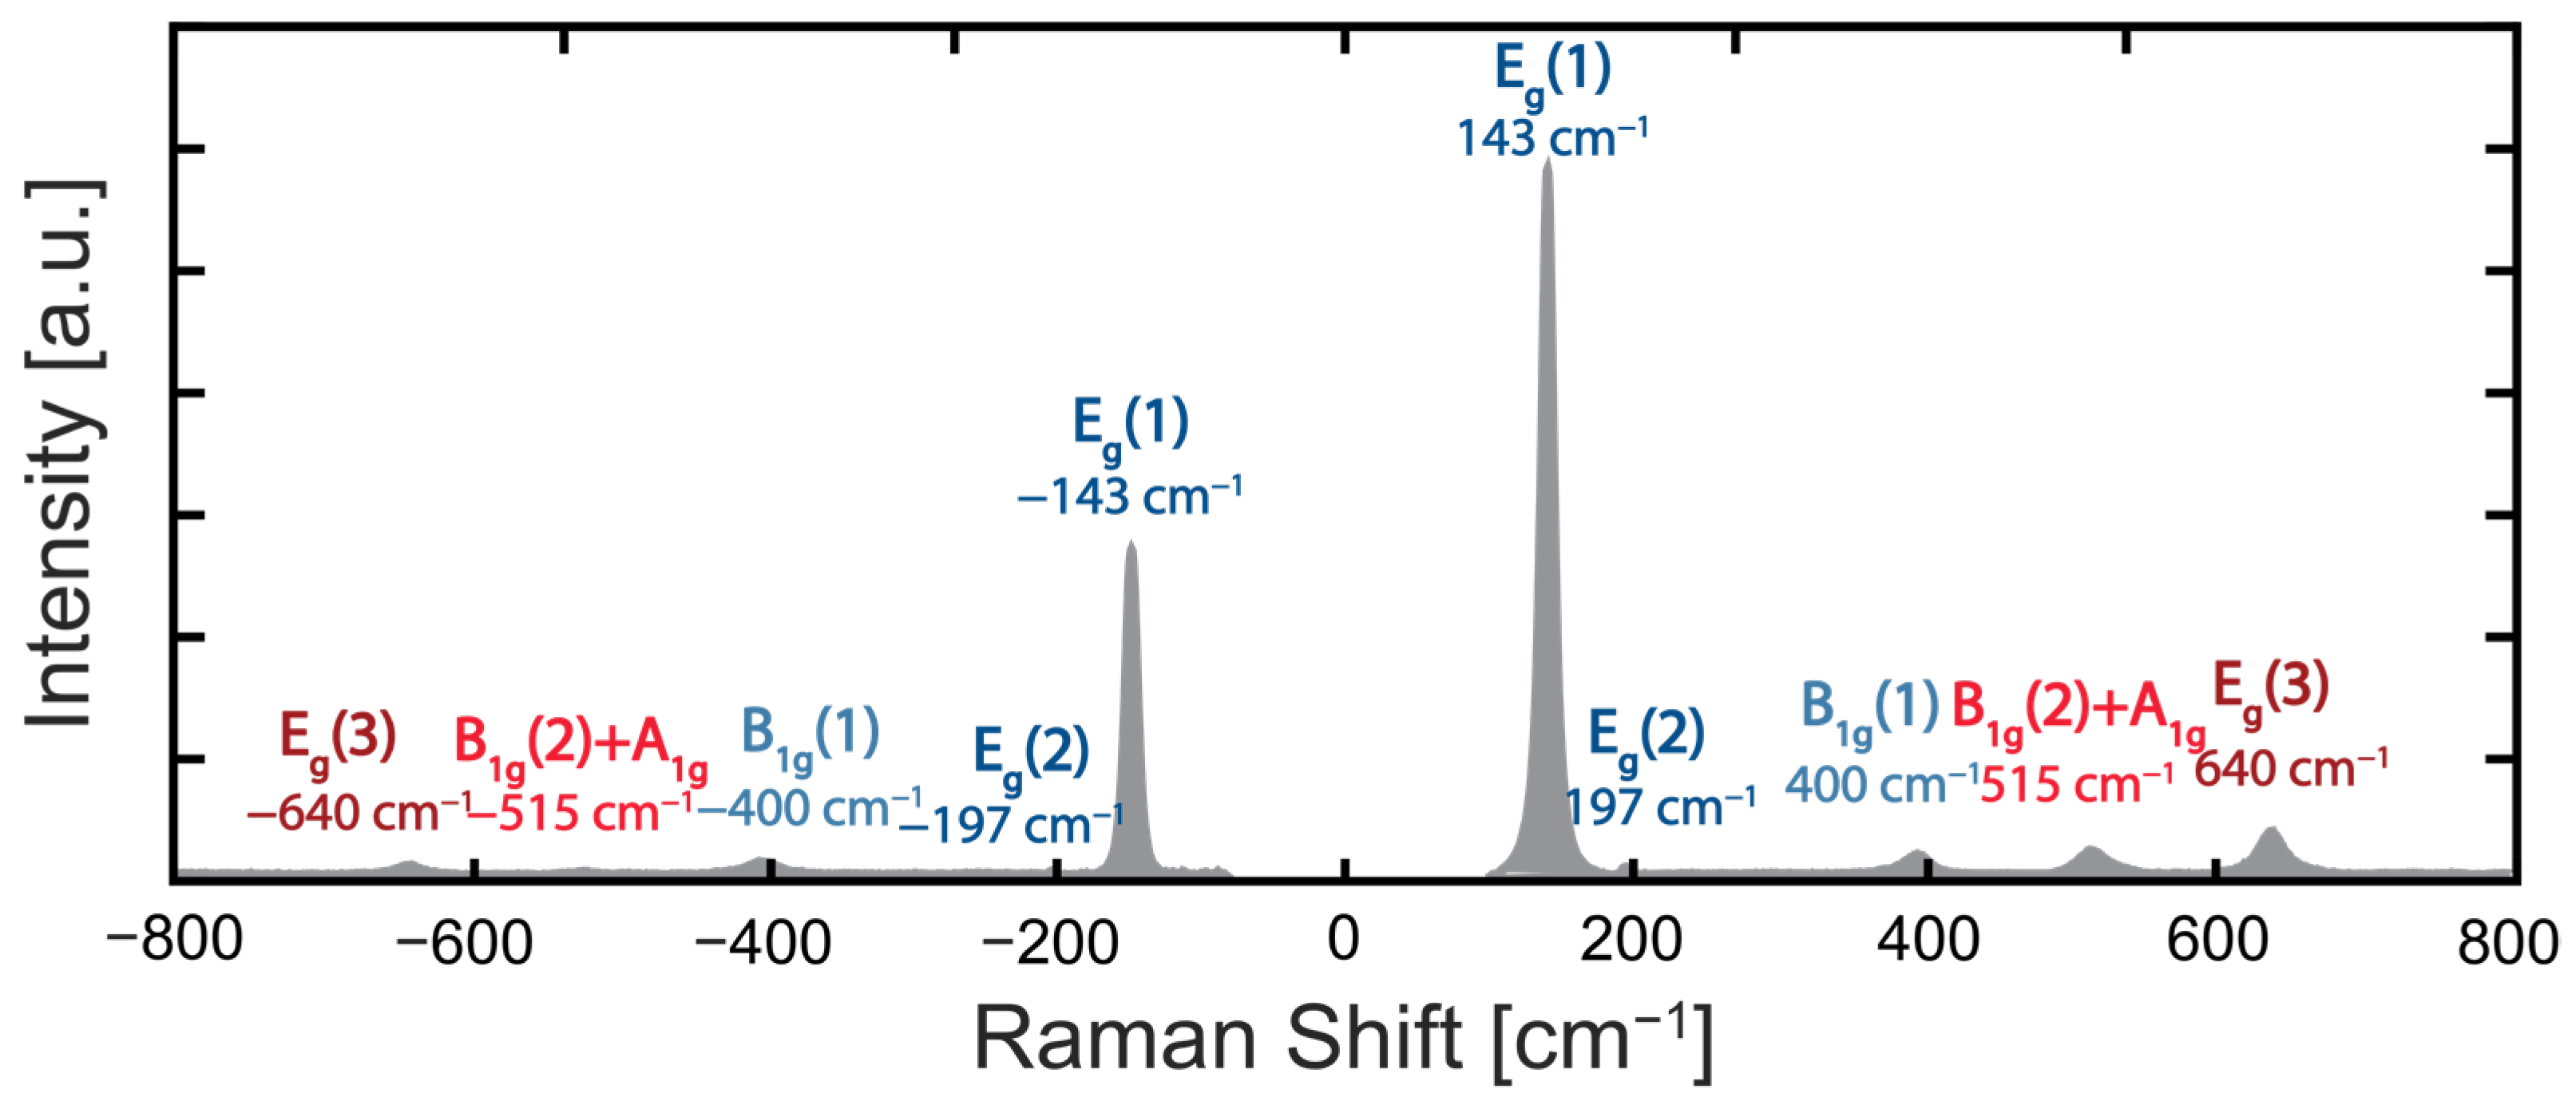
The Stokes (positive Raman shift) and anti-Stokes (negative Raman shift) Raman spectra collected at 800 nm are displayed in Figure 5. The Stokes peaks, centered at 143, 197, 397, 515 and 640 cm−1, were assigned to the E g ( 1 ) , E g ( 2 ) , B 1 g 1 , B 1 g ( 2 ) + A 1 g and E g ( 3 ) Raman modes of anatase [37,38]. The anti-Stokes peaks, located at the same positions but with the opposite sign, were also assigned, as shown in Figure 5. The characteristics of the E g ( 1 ) Raman peak, which is centered at 143 cm−1 and has a full width at half-maximum (FWHM) of 7 cm−1, are in agreement with the relatively large crystallites found by XRD [39].
By applying the method described in detail in the Section 2.3, the choice of the Raman mode for thermometry at a given excitation wavelength could be based on the value of the aS/S ratio ρ t h ( T ) , the absolute sensitivity S t h or the relative sensitivity S r , t h . According to Equation (2), the absolute sensitivity is proportional to the frequency of the Raman mode v m and to the aS/S ratio ρ t h ( T ) , which is higher for modes with lower frequencies; thus, in comparison with the B 1 g ( 1 ) mode, having a higher frequency ( v m = 4.27·1012 s−1) than the E g ( 1 ) peak ( v m = 1.19·1013 s−1), but a lower ρ t h ( T ) (at T = 300 K and λ e x c = 800 nm, 0.5393 for E g ( 1 ) and 0.1778 for B 1 g ( 1 ) ), it turns out that the former has a higher S t h than the latter (0.12%K−1 and 0.11%K−1, respectively, at T = 300 K and λ e x c = 800 nm). However, when S t h is divided by ρ t h ( T ) to generate S r , t h (Equation (3)), this quantity is only affected by v m , resulting in a larger relative thermal sensitivity for the B 1 g ( 1 ) mode (0.23 in comparison to 0.64%K−1 at T = 300 K). Nonetheless, the E g ( 1 ) Raman mode at 143 cm−1 has a good value of relative thermal sensitivity, and it is the most intense signal in the Raman spectrum of anatase, as we can see in Figure 5. Moreover, it has the highest aS/S ratio value, meaning that in a wide temperature range, the anti-Stokes signal will still be visible. Taking these considerations into account, we decided to use the E g 1 peak for thermometry. The same conclusions were found for anatase Raman thermometry in the visible region of the spectrum, as explained by Zani et al. [29]. The choice to exploit the low frequency mode also favors the use of the material within biological systems, which generally show Raman signals at higher frequencies. When testing the anatase in biological environments, it will become essential to verify the maintenance of this indispensable condition or the possibility to clearly distinguish the anatase Raman mode from the matrix signal. A different option would be to look for new synthetical ways to amplify the anatase signal.
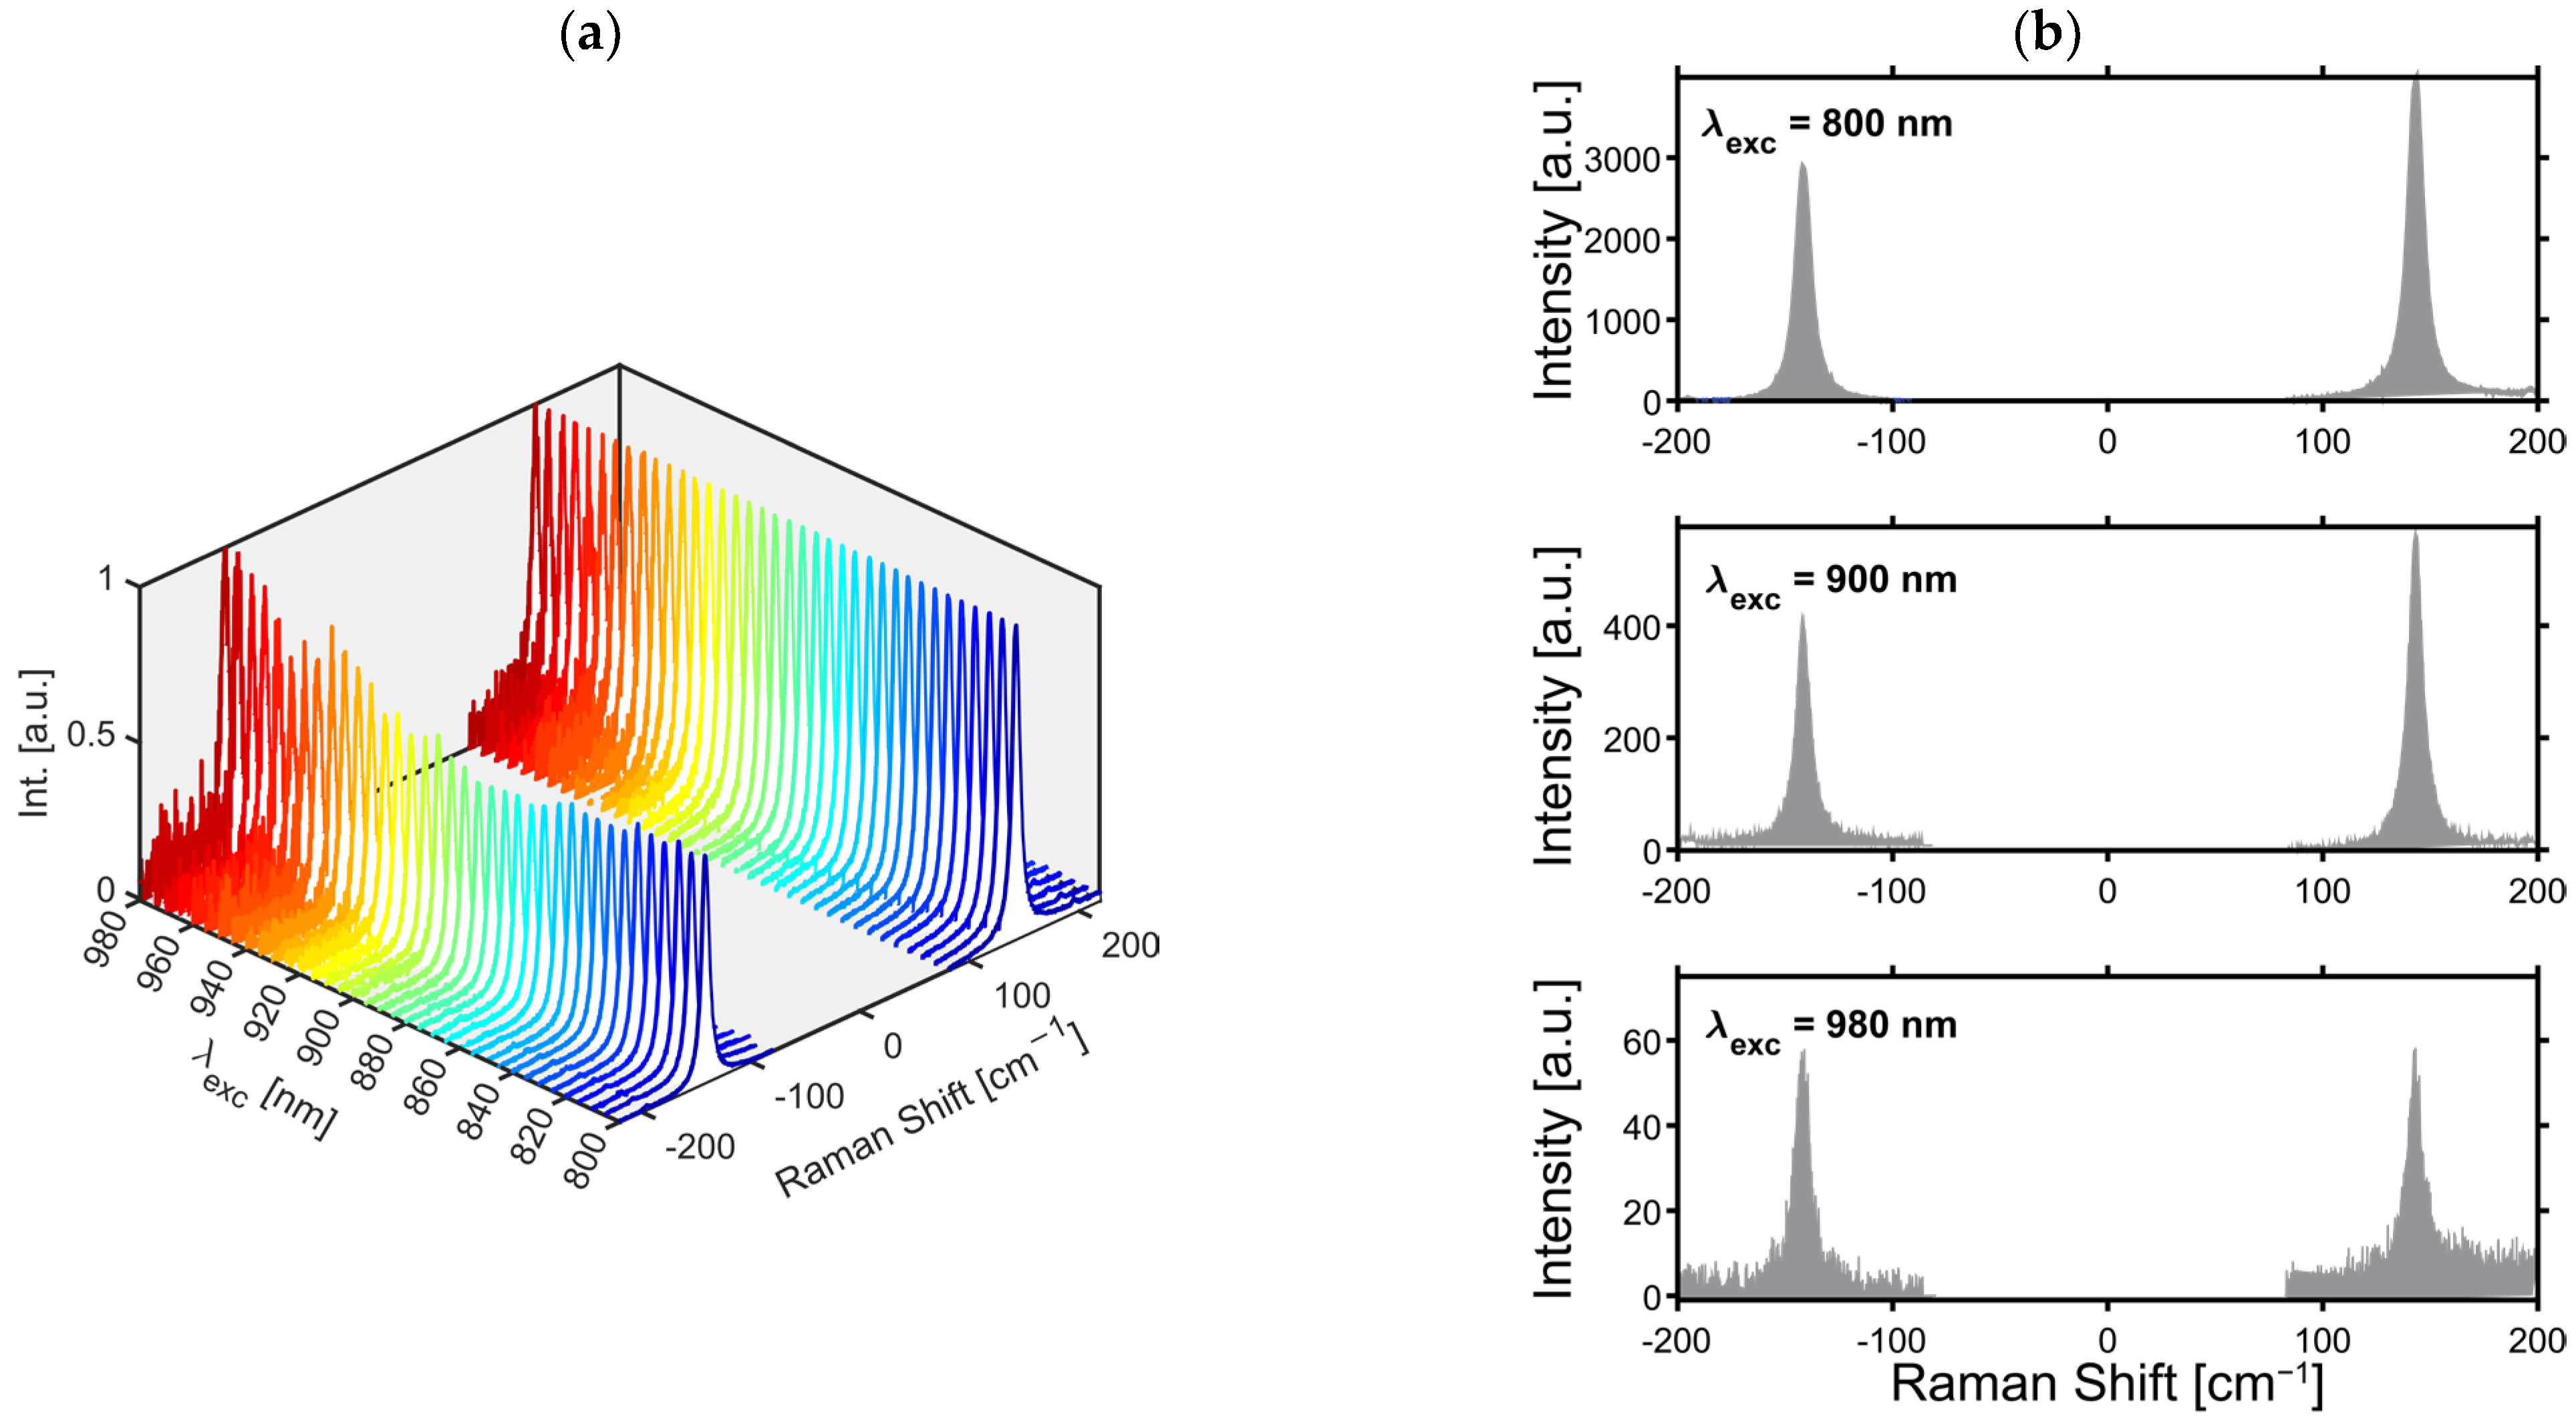
Normalized Stokes and anti-Stokes Raman spectra of the E g ( 1 ) mode, recorded approximately at the same laser power, are reported in Figure 6a as function of the excitation wavelength. When the wavelength was increased from 800 to 980 nm every 5 nm, a substantial decrease in the signal-to-noise ratio (all the spectra were collected using the same experimental conditions) was observed. The intensity also gradually decreased with increasing wavelength, as is shown by the non-normalized spectra in Figure 6b, recorded at 800, 900 and 980 nm, because of the decreasing efficiency of the Raman detector. Therefore, it was demonstrated that the E g ( 1 ) anti-Stokes and Stokes peaks of anatase may be used for Raman nanothermometry over a broad wavelength range, as confirmed by the presence of a sufficiently powerful signal from 800 to 980 nm. Anatase thermometric performance was examined at three wavelengths, 785, 800 and 980 nm, which correspond to the most popular commercially available lasers used in the biomedical field.
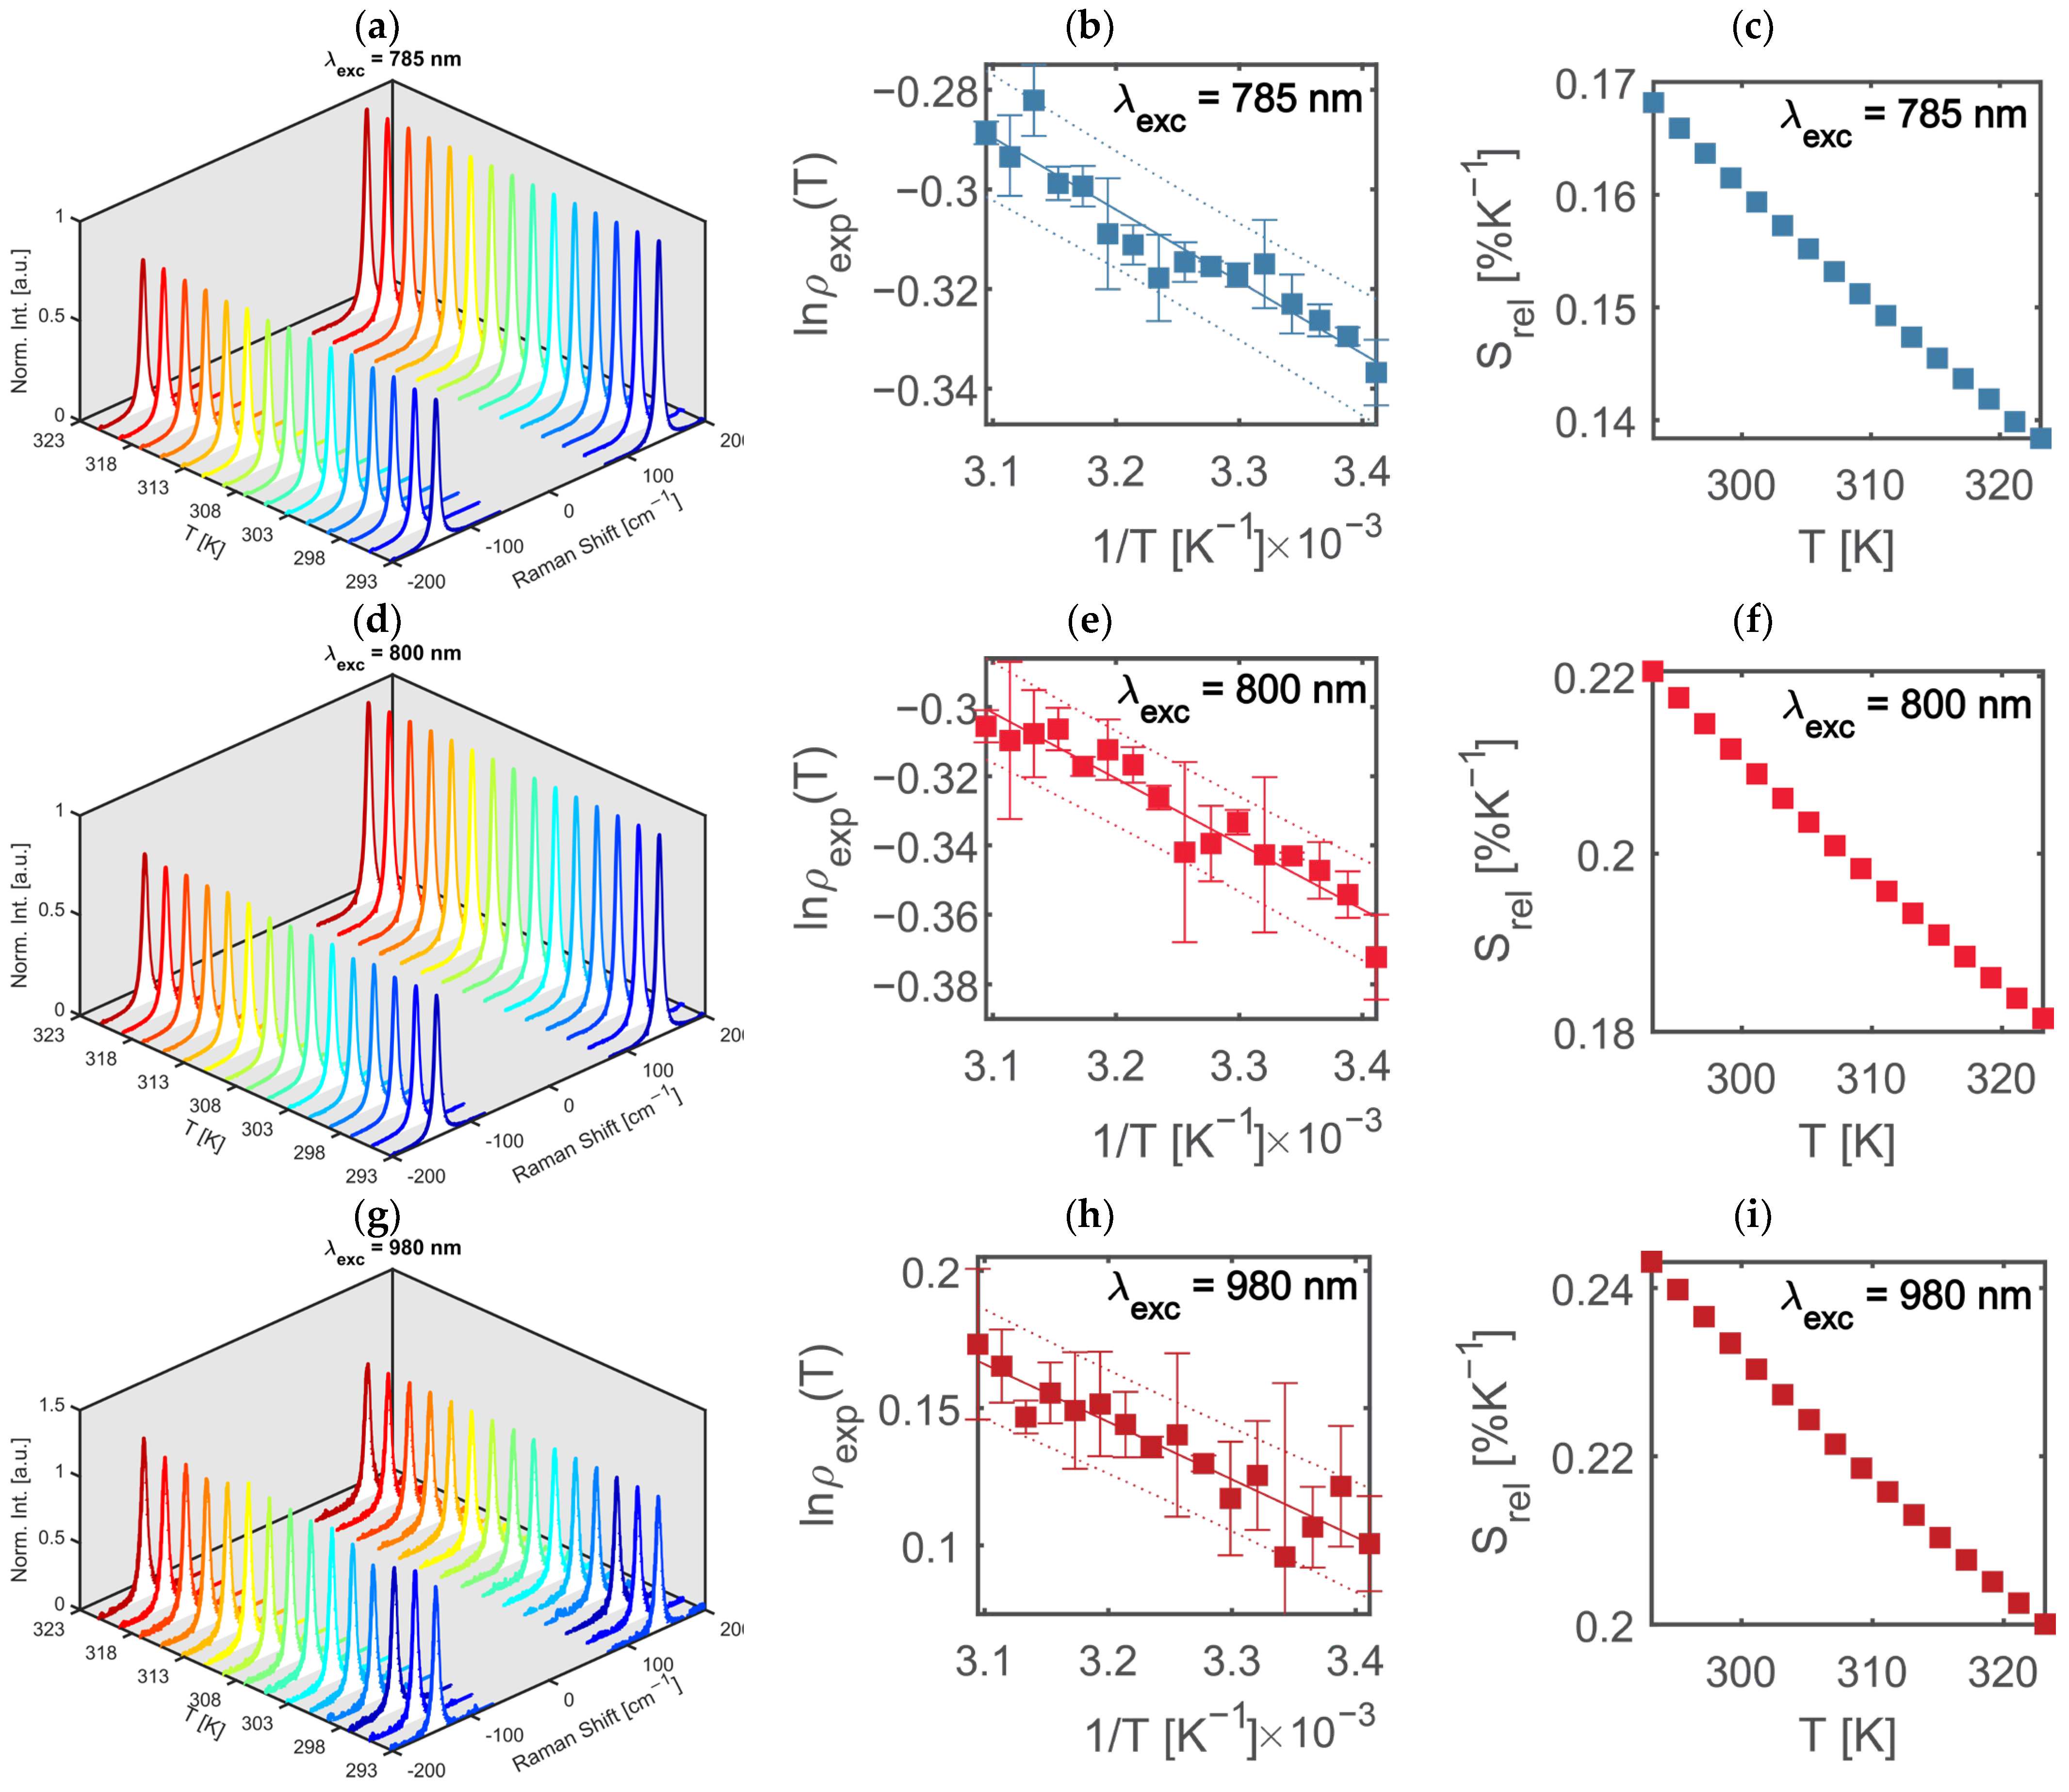
By following the method extensively described in the Section 2.3, during Raman thermometry experiments, Stokes and anti-Stokes spectra were acquired between 293 and 323 K, as shown in Figure 7a,d,g, for λ e x c = 785, 800 and 980 nm, respectively.
The values of the aS/S ratios ρ e x p were then calculated; the linear fitting of l n ρ e x p plotted against 1/T in Figure 7b,e,h allowed the determination of α and β empirical constants (see Equation (5)), reported in Table 1.
As expected, these thermometry curves have different intercepts of l n β with slopes α . Actually, β is affected not only by the third power of the excitation frequency, but also by many wavelength-dependent parameters, among which are the detector and grating efficiency. The values of S r , e x p , calculated using Equation (7), are plotted as functions of temperature in Figure 7c,f,i. A decreasing trend in this parameter with temperature was observed at a specific excitation wavelength, whereas, for all the temperatures of the investigated range, higher values were observed when exciting at 980 nm rather than at 800 and 785 nm. S e x p and S r , e x p , evaluated at T = 300 K for the three wavelengths investigated, are reported in Table 1, where they are also compared to the correspondent values found in ref. [29] for λ e x c = 514.5 nm.
As we can see in Table 1, the relative sensitivities, S r , e x p , assume different values depending on the excitation wavelength in the NIR. It was observed that the reported value for 514.5 nm, 0.27%K−1, was higher than the one determined at 980 nm, 0.23%K−1, the highest value found for the investigated wavelengths in NIR. Indeed, a good thermal relative sensitivity and the ability to excite the materials over a wide wavelength range make the system a good candidate as an optical thermometer.
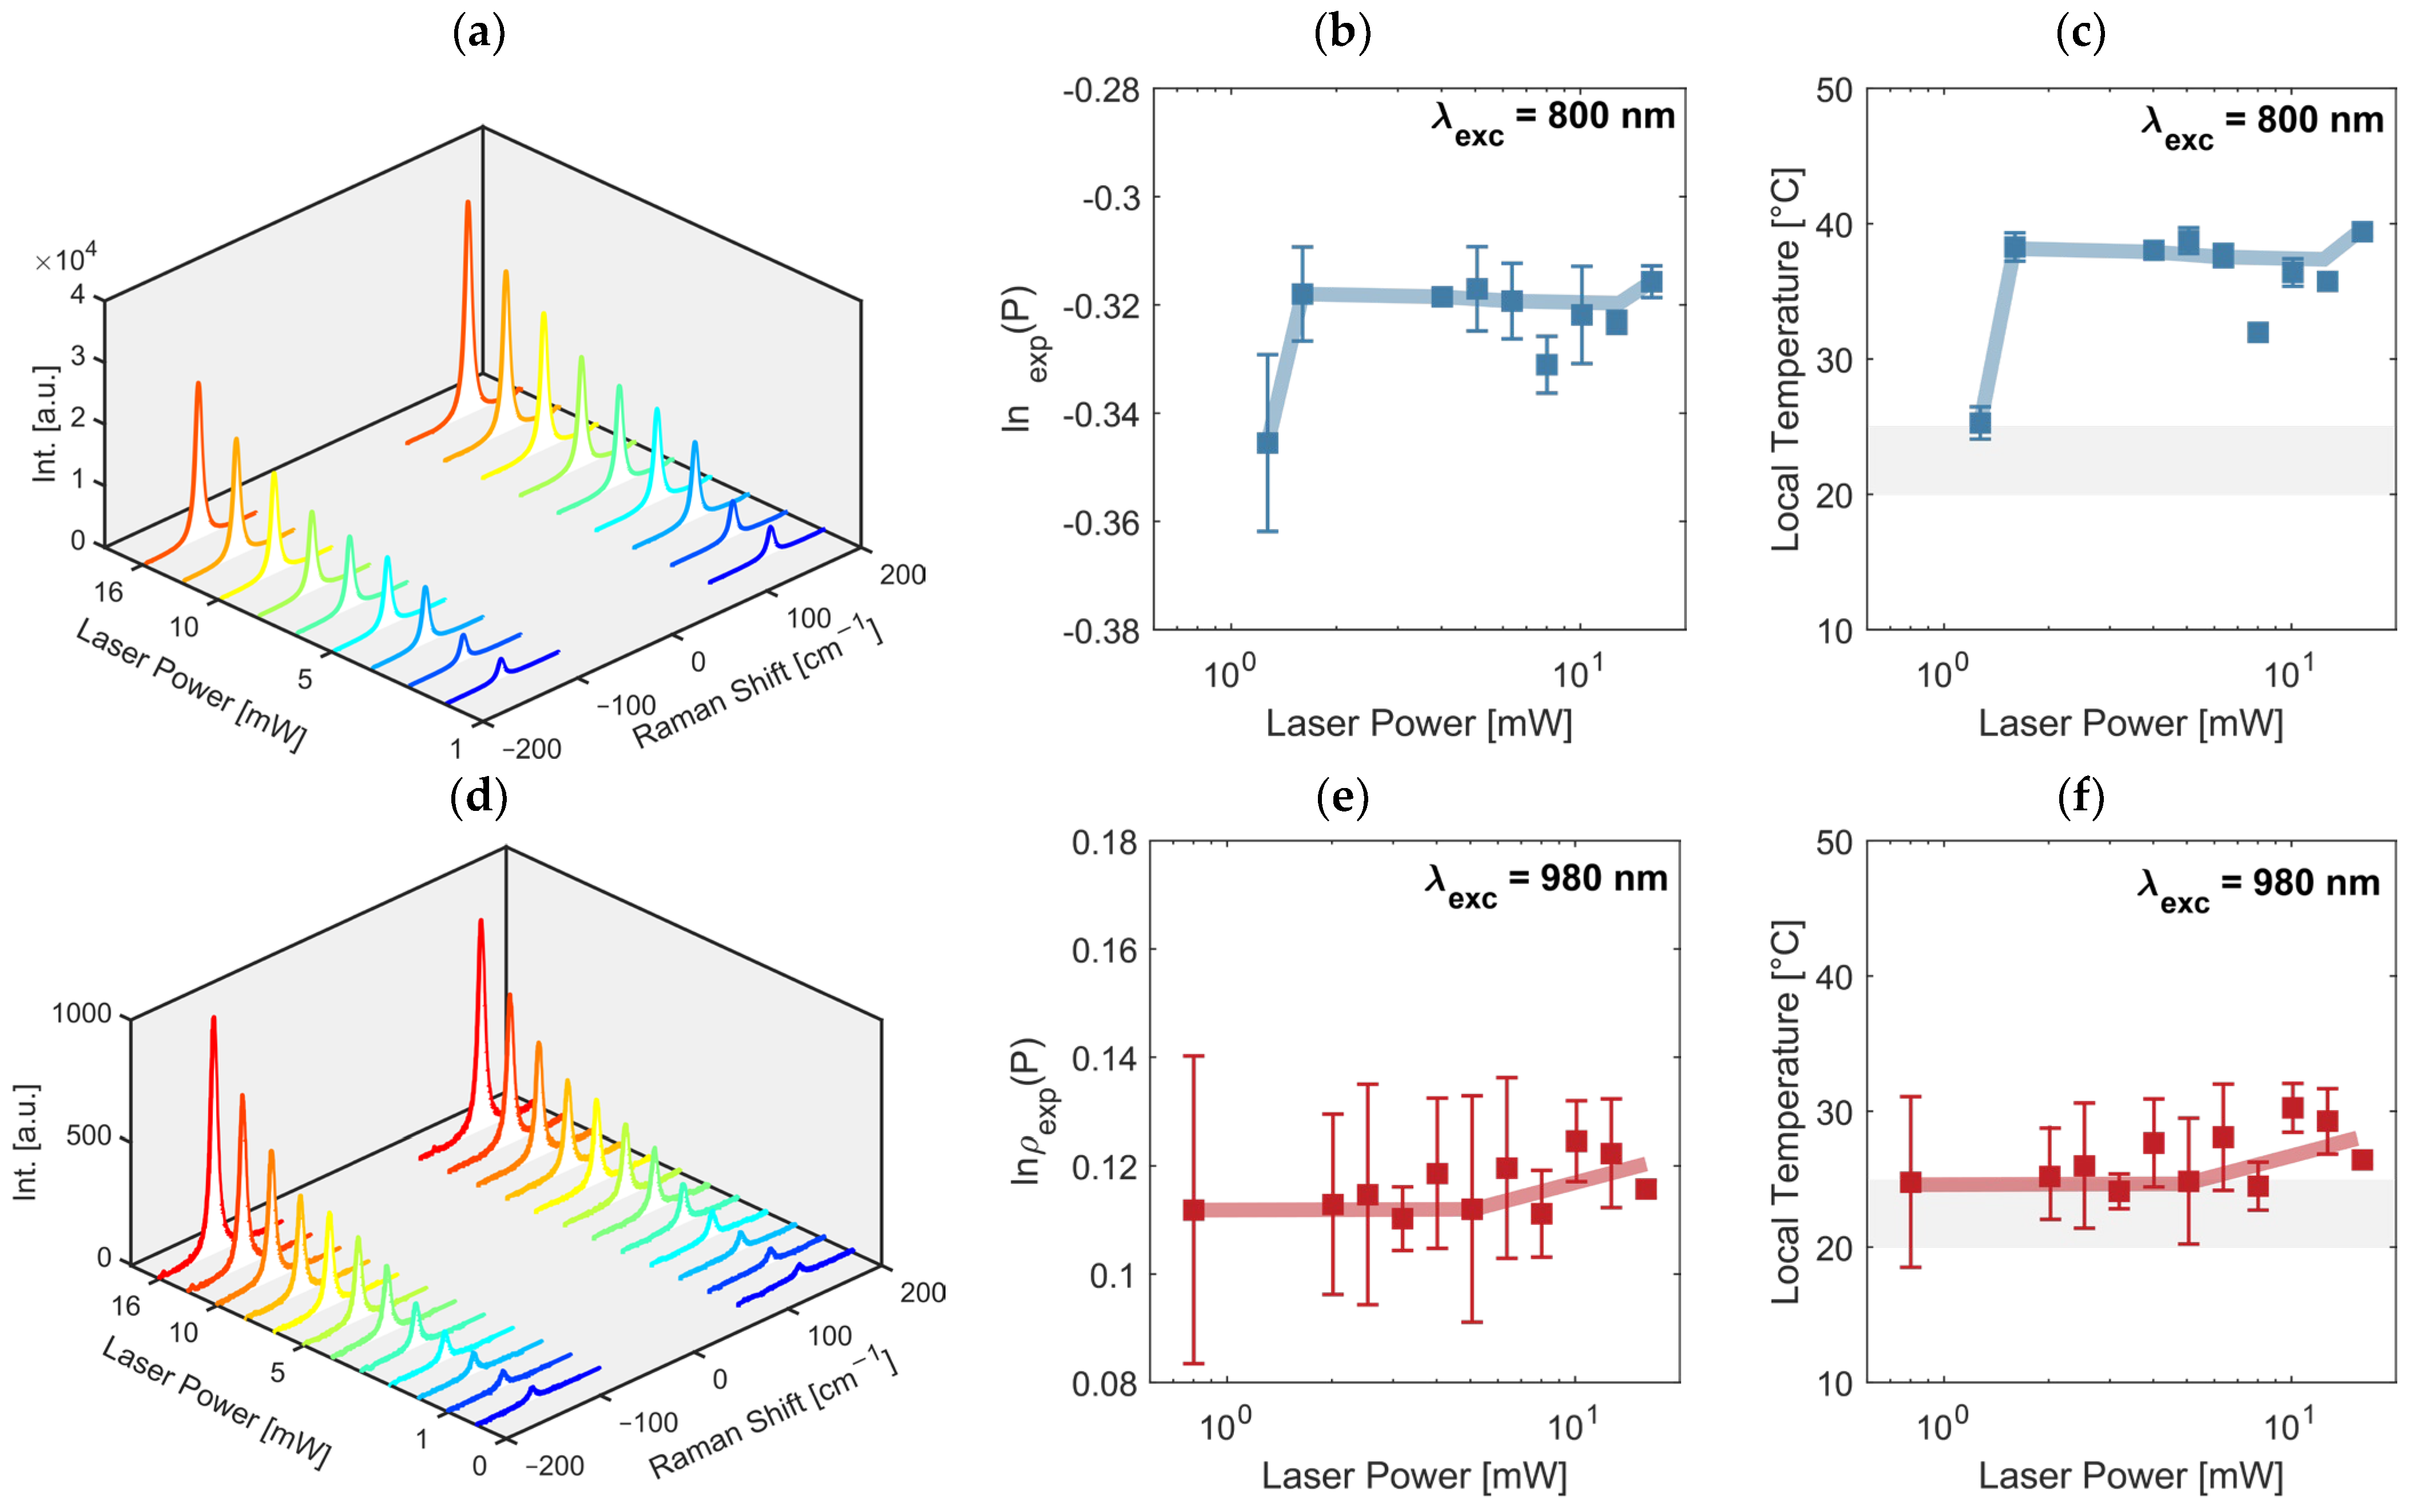
It has been demonstrated before that, above a certain threshold power, lasers can induce a local temperature modification in the sample. For low laser powers, a range in which the aS/S ratio is unaffected by laser power can be observed, whereas an increase in laser power is expected to generate a rise in the aS/S ratio, which can be attributed to local temperature variation. Sample heating is not desired in the case of thermometric measurements (Figure 7) in which the power is carefully fixed below the heating threshold (1 mW) in order to not alter the local temperature. Instead, the heating phenomenon was investigated at λ e x c = 800 and 980 nm (these values were determined with a photodiode in a position close to the sample) to investigate the potentiality of anatase in heating release. For each laser power, anti-Stokes and Stokes Raman spectra, shown in Figure 8a,d, were acquired to calculate the logarithm of the aS/S ratio l n ρ e x p ( P ) , plotted in Figure 8b,e, along with the estimated error. Consequently, the temperature T ( P ) was estimated using Equation (8), and the temperature increase with respect to RT is reported in Figure 8c,f. The local temperature of the sample was initially close to RT but suddenly increased because of higher laser power, reaching a maximum of 15 °C in the case of λ e x c = 800 nm. A maximum Δ T of 6 °C was observed in the case of λ e x c = 980 nm, while a more oscillating tendency, rather than a pronounced increase in temperature, was detected. Nevertheless, even if a high-intensity laser is concentrated in a small spot (few µm), the sample is not visually degraded, and the Raman spectrum remains unchanged, as shown in the left panel of Figure 8a,d. When particles are interacting with light, incident photons can be scattered and absorbed. The absorbed photons may induce heat generation and other radiative processes, including luminescence. Consequently, the efficiency of heat generation depends on the absorption efficiency of the sample. Anatase TiO2, characterized by a wide band gap of approximately 3.2 eV, is supposed to exhibit negligible optical absorption within the visible and near-infrared (NIR) regions of the spectrum. Experimental measurements, such as the UV–visible and NIR diffuse reflectance spectra of anatase powder, reported in Figure 4, indeed confirmed the absence of any absorption feature in the spectral range considered. However, the aS/S thermometric method shows a localized temperature increase, indicative of heat release, upon laser illumination with excitation wavelengths of 800 and 980 nm. This phenomenon was already demonstrated in the literature, where excitation wavelengths in the visible range were used [29]. These findings, together with the results reported in the present work, suggest that the sample indeed absorbs laser radiation at wavelengths in the visible and NIR spectra, which may not be stimulated by the lamp light utilized in UV–visible and NIR diffuse reflectance experiments, but rather by laser irradiation at significantly higher power densities. Under such conditions, nonlinear optical phenomena, such as two-photon absorption, become feasible, as evidenced in the existing literature concerning z-scan measurements on TiO2 anatase [40,41].

4. Conclusions

A commercial powder of anatase particles was used to demonstrate the capability of this material as a Raman thermometer, exploiting anti-Stokes and Stokes signals of the E g ( 1 ) mode, at 143 cm−1, in the first biological transparency window. Among the other Raman modes of anatase, the E g ( 1 ) mode was chosen for its intense signal in the spectrum, and for the high value of the associated aS/S ratio, which guaranteed the high intensity of the anti-Stokes peak, in the 293–323 K temperature range. Different excitation wavelengths, 785, 800 and 980 nm, were also explored to perform thermometric experiments, corresponding to commercially available lasers in the NIR. Very good experimental values of thermal sensitivities were determined through the parameters obtained with the fitting of thermometric curves, ranging from 0.16 to 0.23% K−1 for S r , e x p , similar to those found for the same material excited in the visible spectrum. The proposed method was also used to determine the local temperature increase by irradiating the sample at increasing laser power, at 800 and 980 nm. A maximum temperature increase above a RT of 6 and 15 °C at λ e x c = 980 and 800 nm, respectively, was detected, which may be attributed to nonlinear phenomena induced by the high laser power density.
This work proposed a new system, highly biocompatible, working within the BTW-I, for potential application in biomedicine, since, to the best of our knowledge, there has been no previous research on this material in the NIR spectral range. The strength of this work lies in the fact that pure anatase has enviable potential in terms of extending the Raman signal, and thus the ability to measure the local temperature into a spectral range that is difficult to cover by plasmonic or luminescent systems. The versatility and good performances of the local temperature sensor are thought to encourage further investigation of this material, and future developments should aim to control the dimensions of anatase particles and their surface modification to promote their uptake in cells.

Author Contributions

Conceptualization, D.P. and R.S.; methodology, V.Z.; software, V.Z.; validation, V.Z., R.P. and R.S.; formal analysis, V.Z.; investigation, V.Z., R.P. and R.S.; resources, R.P. and R.S.; data curation, V.Z.; writing—original draft preparation, V.Z., R.P. and R.S.; writing—review and editing, V.Z., R.P., D.P. and R.S.; visualization, V.Z.; supervision, R.S.; project administration, R.S.; funding acquisition, R.P. and R.S. All authors have read and agreed to the published version of the manuscript.

Funding

This research was funded by the MUR 2022 PNRR—DD 1409 of 14 September 2022—CUP “C53D23007890001”, MUR Project P2022XMF43—“Optical NanoThermometry using Luminescence and Raman Spectroscopies—OPTIMISE”.

Institutional Review Board Statement

Not applicable.

Informed Consent Statement

Not applicable.

Data Availability Statement

Data are included in the paper.

Conflicts of Interest

The authors declare no conflicts of interest.

References

  1. Brites, C.D.S.; Lima, P.P.; Silva, N.J.O.; Millan, A.; Amaral, V.S.; Palacio, F.; Carlos, L.D. Thermometry at the nanoscale. Nanoscale 2012, 4, 4799–4829. [Google Scholar] [CrossRef] [PubMed]
  2. Del Rosal, B.; Ximendes, E.; Rocha, U.; Jaque, D. In Vivo Luminescence Nanothermometry: From Materials to Applications. Adv. Opt. Mater. 2017, 5, 1600508. [Google Scholar] [CrossRef]
  3. Gota, C.; Okabe, K.; Funatsu, T.; Harada, Y.; Uchiyama, S. Hydrophilic Fluorescent Nanogel Thermometer for Intracellular Thermometry. J. Am. Chem. Soc. 2009, 131, 2766–2767. [Google Scholar] [CrossRef]
  4. Monti, M.; Brandt, L.; Ikomi-Kumm, J.; Olsson, H. Microcalorimetric investigation of cell metabolism in tumour cells from patients with non-Hodgkin lymphoma (NHL). Scand. J. Haematol. 1986, 36, 353–357. [Google Scholar] [CrossRef]
  5. Quintanilla, M.; Henriksen-Lacey, M.; Renero-Lecuna, C.; Liz-Marzán, L.M. Challenges for optical nanothermometry in biological environments. Chem. Soc. Rev. 2022, 51, 4223–4242. [Google Scholar] [CrossRef]
  6. Zhou, H.; Sharma, M.; Berezin, O.; Zuckerman, D.; Berezin, M.Y. Nanothermometry: From Microscopy to Thermal Treatments. Chem. Phys. Chem. 2016, 17, 27–36. [Google Scholar] [CrossRef]
  7. Wang, M.; Skripka, A.; Zhang, Y.; Cheng, T.; Ng, M.; Wong, S.Y.; Zhao, Y.; Sun, X.; Li, X.; Bhakoo, K.K.; et al. Theranostic Nanocapsules: Heating, Imaging, and Luminescence Nanothermometry. Chem. Mater. 2024, 36, 3285–3295. [Google Scholar] [CrossRef]
  8. Debasu, M.L.; Brites, C.D.S.; Balabhadra, S.; Oliveira, H.; Rocha, J.; Carlos, L.D. Nanoplatforms for Plasmon-Induced Heating and Thermometry. Chem. Nano Mat. 2016, 2, 520–527. [Google Scholar] [CrossRef]
  9. Jaque, D.; Maestro, L.M.; del Rosal, B.; Haro-Gonzalez, P.; Benayas, A.; Plaza, J.L.; Rodríguez, E.M.; Solé, J.G. Nanoparticles for photothermal therapies. Nanoscale 2014, 6, 9494–9530. [Google Scholar] [CrossRef]
  10. Liu, B.; Li, C.; Cheng, Z.; Hou, Z.; Huang, S.; Lin, J. Functional nanomaterials for near-infrared-triggered cancer therapy. Biomater. Sci. 2016, 4, 890–909. [Google Scholar] [CrossRef]
  11. Zhang, X.; An, L.; Tian, Q.; Lin, J.; Yang, S. Tumor microenvironment-activated NIR-II reagents for tumor imaging and therapy. J. Mater. Chem. B 2020, 8, 4738–4747. [Google Scholar] [CrossRef] [PubMed]
  12. Childs, P.R.N.; Greenwood, J.R.; Long, C.A. Review of temperature measurement. Rev. Sci. Instrum. 2000, 71, 2959–2978. [Google Scholar] [CrossRef]
  13. Quintanilla, M.; Liz-Marzan, L.M. Guiding Rules for Selecting a Nanothermometer. Nano Today 2018, 19, 126–145. [Google Scholar] [CrossRef]
  14. Jaque, D.; Vetrone, F. Luminescence nanothermometry. Nanoscale 2012, 4, 4301–4326. [Google Scholar] [CrossRef] [PubMed]
  15. Jin, H.; Jiang, X.; Sun, Z.; Gui, R. Phosphorescence-based ratiometric probes: Design, preparation and applications in sensing, imaging and biomedicine therapy. Coord. Chem. Rev. 2021, 431, 213694. [Google Scholar] [CrossRef]
  16. Wetzl, C.; Renero-Lecuna, C.; Cardo, L.; Liz-Marzán, L.M.; Prato, M. Temperature-Dependent Luminescence of Nd3+-Doped Carbon Nanodots for Nanothermometry. ACS Appl. Mater. Interfaces 2024, 16, 35484–35493. [Google Scholar] [CrossRef]
  17. Jurga, N.; Runowski, M.; Grzyb, T. Lanthanide-based nanothermometers for bioapplications: Excitation and temperature sensing in optical transparency windows. J. Mater. Chem. C 2024, 12, 12218–12248. [Google Scholar] [CrossRef]
  18. Borisov, E.V.; Kalinichev, A.A.; Kolesnikov, I.E. ZnTe Crystal Multimode Cryogenic Thermometry Using Raman and Luminescence Spectroscopy. Materials 2023, 16, 1311. [Google Scholar] [CrossRef]
  19. Xie, X.; Wang, W.; Chen, H.; Yang, R.; Wu, H.; Gan, D.; Li, B.; Kong, X.; Li, Q.; Chang, Y. CaGdF5 based heterogeneous core@shell upconversion nanoparticles for sensitive temperature measurement. RSC Adv. 2023, 13, 8535–8539. [Google Scholar] [CrossRef]
  20. Zhang, W.; Huang, X.; Liu, W.; Gao, Z.; Zhong, L.; Qin, Y.; Li, B.; Li, J. Semiconductor Plasmon Enhanced Upconversion toward a Flexible Temperature Sensor. ACS Appl. Mater. Interfaces 2023, 15, 4469–4476. [Google Scholar] [CrossRef]
  21. Jia, M.; Chen, X.; Sun, R.; Wu, D.; Li, X.; Shi, Z.; Chen, G.; Shan, C. Lanthanide-based ratiometric luminescence nanothermometry. NanoResearch 2023, 16, 2949–2967. [Google Scholar] [CrossRef]
  22. Beechem, T.E.; Serrano, J.R. Raman Thermometry of Microdevices: Choosing a Method to Minimize Error. Spectroscopy 2011, 26, 36–44. [Google Scholar]
  23. Pozzi, E.A.; Zrimsek, A.B.; Lethiec, C.M.; Schatz, G.C.; Hersam, M.C.; Van Duyne, R.P. Evaluating Single-Molecule Stokes and Anti-Stokes SERS for Nanoscale Thermometry. J. Phys. Chem. C 2015, 119, 21116–21124. [Google Scholar] [CrossRef]
  24. Kumar, K.; Stefanczyk, O.; Chorazy, S.; Nakabayashi, K.; Ohkoshi, S. Ratiometric Raman and Luminescent Thermometers Constructed from Dysprosium Thiocyanidometallate Molecular Magnets. Adv. Optical Mater. 2022, 10, 2201675. [Google Scholar] [CrossRef]
  25. Tuschel, D.; Adar, F. Molecular Spectroscopy Workbench Raman Thermometry. Spectroscopy 2016, 31, 8–13. [Google Scholar]
  26. Freitag, M.; Steiner, M.; Martin, Y.; Perebeinos, V.; Chen, Z.; Tsang, J.C.; Avouris, P. Energy Dissipation in Graphene Field-Effect Transistors. Nano Lett. 2009, 9, 1883–1888. [Google Scholar] [CrossRef]
  27. Smith, J.D.; Cappa, C.D.; Drisdell, W.S.; Cohen, R.C.; Saykally, R.J. Raman Thermometry Measurements of Free Evaporation from Liquid Water Droplets. J. Am. Chem. Soc. 2006, 128, 12892–12898. [Google Scholar] [CrossRef]
  28. Sugiyama, T.; Tsuji, H.; Furukawa, Y. Temperature measurements of the PEDOT-PSS layer in a polymer light-emitting diode by Stokes and anti-Stokes Raman scattering. Chem. Phys. Lett. 2008, 453, 238–241. [Google Scholar] [CrossRef]
  29. Zani, V.; Pedron, D.; Pilot, R.; Signorini, R. Contactless Temperature Sensing at the Microscale Based on Titanium Dioxide Raman Thermometry. Biosensors 2021, 11, 102. [Google Scholar] [CrossRef]
  30. Wu, G.; Xue, J.; Li, X.; Ren, K.; Leng, Z.; Bi, Q.; Tang, C. Excellent Sensitive Temperature Sensing Performance Based on Fluorescence Intensity Ratio Technique of Yb3+/Er3+ Codoped Gd2(WO4)3. Phys. Status Solidi B 2023, 260, 2200471. [Google Scholar] [CrossRef]
  31. Zhao, Y.; Li, D. Lanthanide-functionalized metal–organic frameworks as ratiometric luminescent sensors. J. Mater. Chem. C 2020, 8, 12739–12754. [Google Scholar] [CrossRef]
  32. Carbone, R.; Marangi, I.; Zanardi, A.; Giorgetti, L.; Chierici, E.; Berlanda, G.; Podestà, A.; Fiorentini, F.; Bongiorno, G.; Piseri, P.; et al. Biocompatibility of cluster-assembled nanostructured TiO2 with primary and cancer cells. Biomaterials 2006, 27, 3221–3229. [Google Scholar] [CrossRef] [PubMed]
  33. Wang, Y.; Wen, C.; Hodgson, P.; Li, Y. Biocompatibility of TiO2 nanotubes with different topographies. J. Biomed. Mater. Res. A 2014, 102, 743–751. [Google Scholar] [CrossRef] [PubMed]
  34. Long, D.A. The Raman Effect; John Wiley & Sons, Ltd.: Hoboken, NJ, USA, 2002. [Google Scholar] [CrossRef]
  35. Alencar, M.A.R.C.; Maciel, G.S.; de Araújo, C.B.; Patra, A. Er3+-doped BaTiO3 nanocrystals for thermometry: Influence of nanoenvironment on the sensitivity of a fluorescence based temperature sensor. Appl. Phys. Lett. 2004, 84, 4753–4755. [Google Scholar] [CrossRef]
  36. Brandão-Silva, A.C.; Gomes, M.A.; Macedo, Z.S.; Avila, J.F.M.; Rodrigues, J.J.; Alencar, M.A.R.C. Multiwavelength Fluorescence Intensity Ratio Nanothermometry: High Sensitivity over a Broad Temperature Range. J. Phys. Chem. C 2018, 122, 20459–20468. [Google Scholar] [CrossRef]
  37. Frank, O.; Zukalova, M.; Laskova, B.; Kürti, J.; Koltai, J.; Kavan, L. Raman spectra of titanium dioxide (anatase, rutile) with identified oxygen isotopes (16, 17, 18). Phys. Chem. Chem. Phys. 2012, 14, 14567–14572. [Google Scholar] [CrossRef]
  38. Giarola, M.; Sanson, A.; Monti, F.; Mariotto, G.; Bettinelli, M.; Speghini, A.; Salviulo, G. Vibrational dynamics of anatase TiO2 Polarized Raman spectroscopy and ab initio calculations. Phys. Rev. B 2010, 81, 174305. [Google Scholar] [CrossRef]
  39. Swamy, V.; Kuznetsov, A.; Dubrovinsky, L.S.; Caruso, R.A.; Shchukin, D.G.; Muddle, B.C. Finite-size and pressure effects on the Raman spectrum nanocrystalline anatase TiO2. Phys. Rev. B 2005, 71, 184302. [Google Scholar] [CrossRef]
  40. Divya, S.; Nampoori, V.P.N.; Radhakrishnan, P.; Mujeeb, A. Electronic and optical properties of TiO2 and its polymorphs by Z-scan method. Chin. Phys. B 2014, 23, 084203. [Google Scholar] [CrossRef]
  41. Guo, L.H.; Wang, Y.W.; Jiang, Y.Q.; Xiao, S.; He, J. Dependence of Nonlinear Optical Response of Anatase TiO2 on Shape and Excitation Intensity*. Chin. Phys. Lett. 2017, 34, 077803. [Google Scholar] [CrossRef]
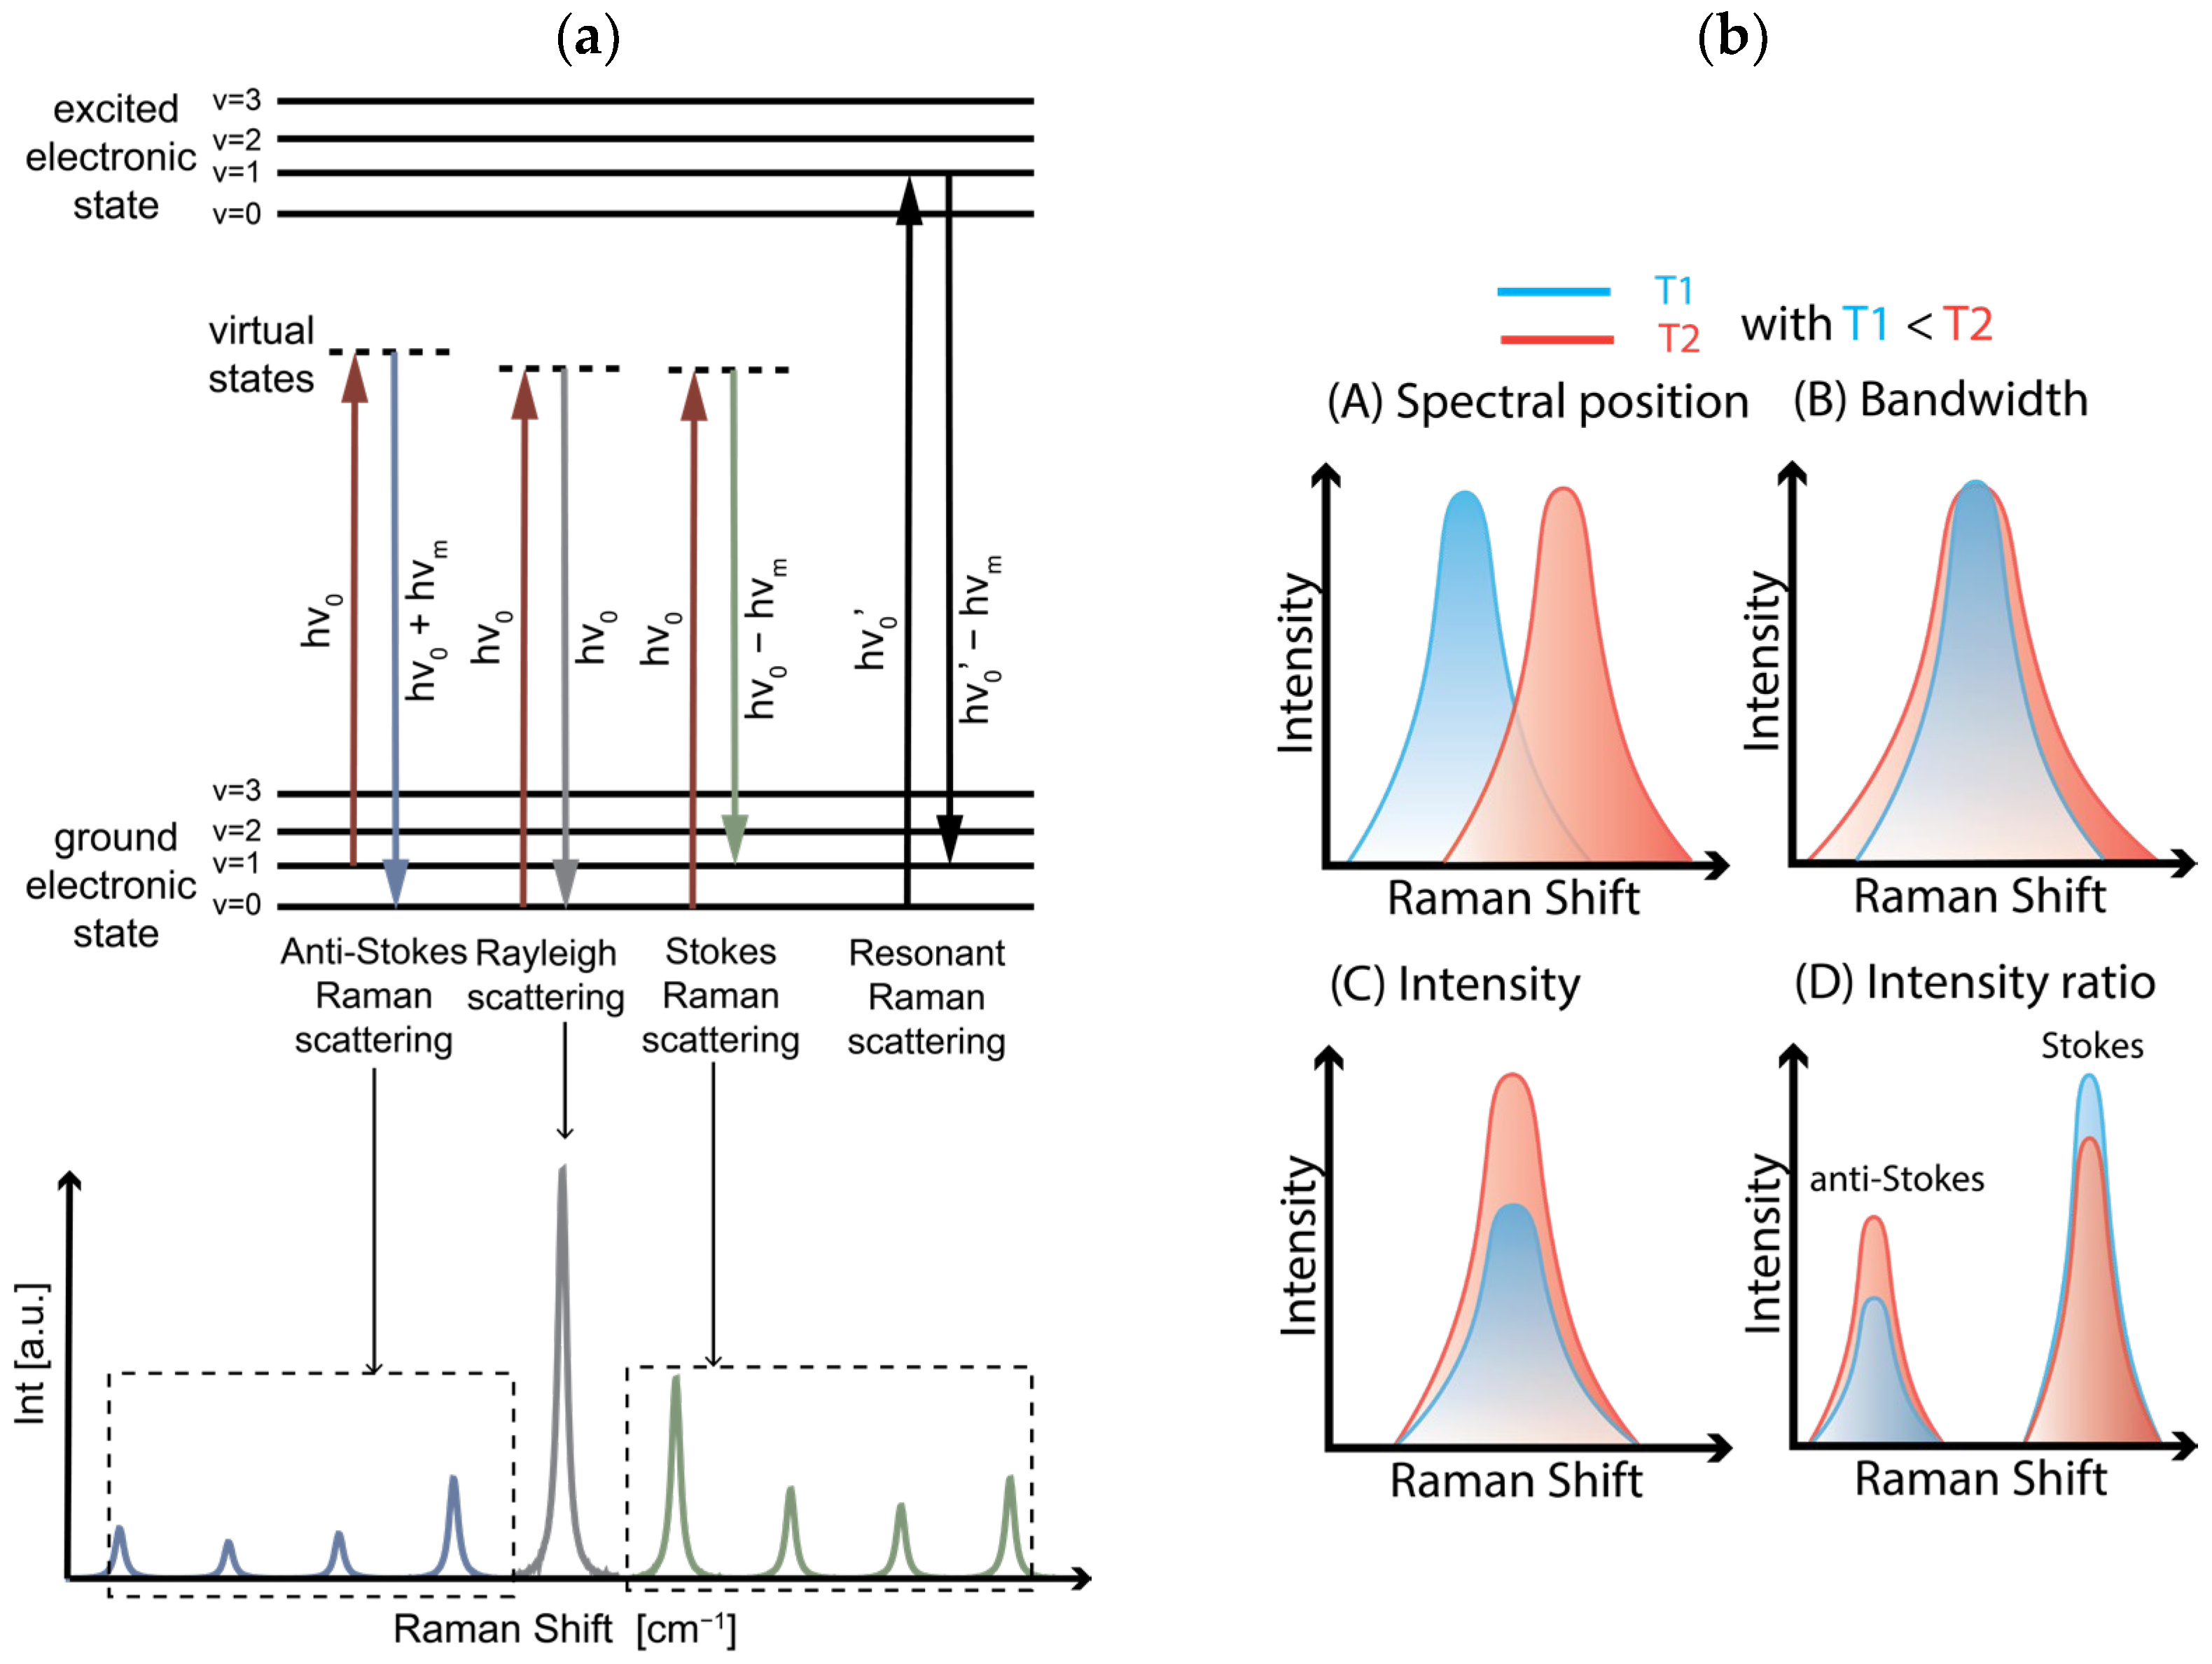
Figure 1. (a) Jablonski diagram reporting the anti-Stokes, Rayleigh and Stokes Raman scattering in non-resonant conditions, and the correspondent peaks originating from these processes, relative to a generic compound. The principle of resonant Raman scattering is also shown. (b) Schematic representation of the variation in the Raman spectrum features (spectral position (A), bandwidth (B), intensity (C) and intensity ratio (D)) caused by a temperature change. Red lines correspond to the temperature T2, which is higher than T1, relative to the blue lines. When T = T1, the lower temperature, the first vibrational state (v = 1) of the ground state (S0) is poorly populated, whereas when the temperature is raised to T2, it becomes more populated.
Chemosensors 12 00191 g001
Figure 2. (a) Anti-Stokes and Stokes peaks of the Anatase. The Raman modes are labeled as B1, B2, B3 and B4, from lower to higher Raman shift values; (b) anti-Stokes/Stokes ratio, calculated at λ e x c = 785 nm, for B1 (dark blue), B2 (light blue), B3 (light red) and B4 (dark red). Calculated (c) absolute ( λ e x c = 785 nm) and (d) relative (independent from λ e x c ) sensitivities of the four peaks. The aS/S ratios (e) and the absolute sensitivities (f) calculated for B1 at 514.5 (dotted line), 785 (dashed–dotted line) and 980 nm (dashed line).
Chemosensors 12 00191 g002
Figure 3. X-ray diffraction pattern of anatase (black line) in perfect agreement with the database pattern COD 9015929 (red lines) of the anatase Titanium Dioxide phase.
Chemosensors 12 00191 g003
Figure 4. Diffuse reflectance spectrum of TiO2 anatase powder.
Chemosensors 12 00191 g004
Figure 5. Stokes (positive Raman shift) and anti-Stokes (negative Raman shift) Raman spectra of anatase (black line). Stokes (and correspondent anti-Stokes with opposite sign) peaks centered at 143, 197, 400, 515 and 640 cm−1 are assigned to E g ( 1 ) , E g ( 2 ) , B 1 g ( 1 ) , B 1 g 2 + A 1 g and E g ( 3 ) , respectively.
Chemosensors 12 00191 g005
Figure 6. (a) Anti-Stokes and Stokes E g ( 1 ) Raman spectra of anatase as functions of excitation wavelength, recorded from 800 (first dark blue line) to 980 nm (last dark red line), each 5 nm (corresponding to the blue, light blue, green, yellow, orange, light red and red lines); intensities are normalized with respect to the maximum intensity of the Stokes peak. The non-normalized spectra at three selected excitation wavelengths ( λ e x c = 800, 900 and 980 nm) are shown in panel (b).
Chemosensors 12 00191 g006
Figure 7. Anti-Stokes and Stokes anatase E g ( 1 ) spectra (a,d,g) collected as functions of temperature from 293 K (first dark blue line) to 323 K (last dark red line), each 2 K (blue, light blue, green, yellow, orange and red lines) correspondent calculated values of the aS/S ratios natural logarithm (b,e,h) and relative sensitivities (c,f,i) for the excitation wavelengths explored, λ e x c = 785, 800 and 980 nm.
Chemosensors 12 00191 g007
Figure 8. Anti-Stokes and Stokes E g ( 1 ) anatase spectra (a,d), and corresponding values of the aS/S ratio natural logarithm l n ρ e x p ( P ) (b,e), as functions of increasing input power ( λ e x c = 800 and 980 nm). In panel (a) data are reported from 1 mW (blue) to 16 mW (red), in panel (d) data are reported from 0.8 mW (blue) to 16 mW (red) (different colors correspond to different laser power). In panels (c,f) the local temperature of the sample determined with the method described in the main text is reported.
Chemosensors 12 00191 g008
Table 1. Results of thermometry measurements at λ e x c 514.5, 785, 800 and 980 nm, where the intercept l n β and the slope α are reported, together with the experimental values of thermal sensitivity S e x p and relative thermal sensitivity S r , e x p , evaluated at T = 300 K. The values reported at 514.5 nm were adapted from ref. [29].
λ e x c
[ n m ]
l n β α
[ K ]
S e x p
% K 1
S r , e x p
% K 1
514.50.1229240.50.130.27
7850.1584144.50.120.16
8000.2858189.40.150.21
9800.8161209.70.260.23
Disclaimer/Publisher’s Note: The statements, opinions and data contained in all publications are solely those of the individual author(s) and contributor(s) and not of MDPI and/or the editor(s). MDPI and/or the editor(s) disclaim responsibility for any injury to people or property resulting from any ideas, methods, instructions or products referred to in the content.