Abstract
As industry continues to develop rapidly, the greenhouse effect is becoming increasingly severe. CO2, CH4, and N2O are the three primary greenhouse gases, making their effective monitoring a crucial step in reducing emissions. This paper investigates the gas sensing performance of Mo-doped WSe2 for these three gases, through a theoretical study. First, using first-principles calculations, the doping behavior of Mo in WSe2 is examined. Subsequently, the adsorption properties of Mo-WSe2 for CO2, CH4, and N2O are analyzed by calculating adsorption energy, charge transfer, the electron localization function (ELF), Hirshfeld partition (IGMH), and the density of states (DOSs), culminating in an analysis of its sensing properties. The results indicate that when Mo is positioned above the upper Se atom, the structure is most stable. Therefore, this position is selected as the optimal adsorption site for studying the adsorption of the three gases. The adsorption energies for CO2, CH4, and N2O are 1.349 eV, −1.194 eV, and −0.528 eV, respectively, with corresponding charge transfers of 0.418, 0.450, and 0.115. In the N2O and CO2 adsorption systems, significant adsorption energy and charge transfer are observed, leading to relatively better adsorption compared to the CH4 system. Additionally, considering the adsorption performance, Mo-WSe2 demonstrates good sensor response and desorption times for N2O and CO2 at temperatures above 298 K. The findings of this research provide theoretical guidance for the application of Mo-WSe2 as a gas sensing material for detecting greenhouse gases.
1. Introduction
With the rapid development of industry, the detrimental effects of greenhouse gas emissions on ecosystems and socio-economies are becoming increasingly apparent, presenting a serious challenge for the 21st century [1,2,3]. Additionally, as economic growth and population numbers continue to rise, anthropogenic greenhouse gas emissions are also steadily increasing. CO2, CH4, and N2O are the primary greenhouse gases contributing to global warming, collectively accounting for nearly 80% of the greenhouse effect [4]. Therefore, effective sensing and monitoring of these gases are essential for mitigating greenhouse gas emissions.
Currently, sensors for monitoring greenhouse gases include electrochemical gas sensors [5], semiconductor gas sensors [6], infrared gas sensors [7], and emerging nano-gas sensors. Compared to traditional gas sensors, new nano-gas sensors offer advantages such as high sensor response, low operating temperature, and compact size, significantly expanding their application fields [8,9,10,11,12]. Gas-sensitive materials are at the core of these nano-gas sensors, and primarily include metal oxide semiconductors [13], carbon nanotubes [14], graphene [15], and transition metal dichalcogenides (TMDs) [16,17,18]. TMDs, a novel class of two-dimensional layered nanomaterials with the general formula MX2 (where M is a transition metal element like Mo or W, and X is a chalcogen element such as S, Se, or Te), have a unique structure, with two layers of X atoms sandwiching a single layer of M atoms [19]. Unlike graphene, TMDs possess a band gap, which enhances their potential for gas adsorption and sensing [20]. Among TMD materials, WSe2 shows considerable promise for gas sensing applications [21]. Ni et al. studied the adsorption of small gas molecules on single-layer WSe2 doped with Pt, Au, Ag, and Pd, finding that these transition metals improve the adsorption of CO2, NO2, and SO2 [22]. Mi et al. [23] investigated the adsorption of Cl2, SO2, and N2O on WSe2 doped with three Ag atoms, while Chen et al. [24] examined the adsorption of HCN on WSe2 doped with Fe, Ag, Au, As, and Mo. These studies confirm that doping with transition metals can enhance gas molecule adsorption performance. However, the feasibility of using transition metal-doped WSe2 for greenhouse gas adsorption still requires further investigation. Currently, Mo-doped WSe2 shows promising adsorption effects for some small gas molecules. To expand the options for greenhouse gas sensing materials, further in-depth research on the adsorption and sensing properties of greenhouse gases with Mo-doped WSe2 is necessary.
Therefore, the Mo-doped WSe2 model based on first principles is established, to obtain the most stable structure of Mo-WSe2. Furthermore, the adsorption properties of Mo-WSe2 for CO2, CH4, and N2O are analyzed by calculating the adsorption energy, charge transfer, electron localization function (ELF), Hirshfeld partition (IGMH), and density of states (DOSs). Meanwhile, the sensor response and desorption time of the three gases by Mo-WSe2 are also calculated, to evaluate the feasibility of Mo-WSe2 as a gas-sensitive material. This study provides theoretical support for the application of Mo-doped WSe2 gas sensors in various environments.
2. Computational Method
Density Functional Theory (DFT) is a method used to study multi-electron systems [25]. It is also highly effective in the field of gas sensing [26]. In this paper, calculations are performed using the DMol3 module in Materials Studio [27]. A monolayer WSe2 superlattice, consisting of 16 W atoms and 32 Se atoms, is constructed. A vacuum layer with a thickness of 15 Å is introduced to prevent interactions between the periodic WSe2 crystals. The Perdew–Burke–Ernzerhof (PBE) functional, within the framework of the generalized gradient approximation (GGA), is used to handle the exchange–correlation interactions between electrons, while the Tkatchenko–Scheffler (TS) method describes van der Waals interactions. Double numerical polarized (DNP) atomic orbital basis sets are employed, with a global orbital cutoff radius of 5 Å [28]. To simplify the process, a DFT semi-core pseudopotential (DSPP) with relativistic effects is used. The structure is geometrically optimized using a 5 × 5 × 1 Monkhorst Pack k-point grid, with the following convergence criteria: tolerance precision, maximum force, and maximum displacement are set to 10−⁵ Ha, 0.002 Ha/Å, and 0.005 Å, respectively. The bonding between molecules is further analyzed in Multiwfn, using the ELF and IGMH [29,30].
3. Results
The molecular structure of the gas molecules is first geometrically optimized, and the optimized gas molecules are shown in Figure 1, where both CO2 and N2O with linear structures, with C-O, N-N, and N-O bond lengths of 1.178 Å, 1.141 Å, and 1.197 Å, respectively, are shown. CH4, on the other hand, exhibits high symmetry, forming a regular tetrahedron with C-H bond lengths of 1.097 Å.

Figure 1.
Molecular structures of gas molecules (a) N2O; (b) CO2; (c) CH4.
3.1. Analysis of Monolayer Mo-WSe2
In this paper, geometric optimization of the WSe2 unit cell is carried out, resulting in lattice constants of a = b = 13.308 Å and C = 18.363 Å. As shown in Figure 2, doping modification of the WSe2 surface is performed to improve the adsorption and sensing properties of the material [31,32]. Three surface positions of WSe2 are considered as possible doping sites for Mo atoms, namely, above the Se atom, at the center of the six-membered ring formed by three Se atoms, and above the upper-layer W atom. The initial distance of the doping atom from the doping site is set to 2 Å.
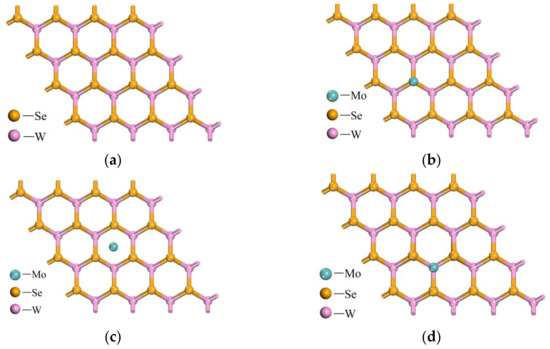
Figure 2.
WSe2 pristine and three Mo doping sites: (a) WSe2 pristine; (b) above the Se atom; (c) center of the three Se atoms; (d) above the W atom.
The adsorption energy (Ebind) of the doping atom on the adsorbent material is calculated according to Equation (1).
Ebind = EMo-WSe2 − EMo − EWSe2
Here, EMo-WSe2 represents the total energy of Mo-WSe2, EMo is the energy of the Mo atom, and EWSe2 is the total energy of the monolayer WSe2.
Lower adsorption energies clearly correspond to more stable adsorption structures. Table 1 displays the adsorption results of Mo atoms at three different doping sites. Comparing these results reveals that the adsorption energy is lowest when the Mo atom is positioned directly above the Se atom, at −0.830 eV. As illustrated in Figure 3, this position is relatively stable. Figure 4 shows the difference charge density map of Mo-WSe2 at the optimal adsorption site, where green indicates charge accumulation and blue indicates charge depletion. Charge depletion is predominantly concentrated near the adsorbed Mo atom, with the lost charge mainly involved in forming the Mo-Se bond. This suggests that the incorporation of Mo atoms modifies the electronic structure of WSe2, reducing the surface chemical reaction potential energy. Consequently, these factors establish this position as the optimal adsorption site for gas molecules.

Table 1.
Different parameters of Mo at three doping positions on the WSe2.

Figure 3.
Optimal adsorption site of Mo-WSe2: (a) top view; (b) side view.

Figure 4.
Differential charge density map of Mo-WSe2 at the nearest adsorption site: (a) top view; (b) side view.
The DOS and partial density of states (PDOSs) for Mo-doped WSe2 are presented in Figure 5. From Figure 5a, it is evident that Mo doping leads to a decrease in the overall energy of the WSe2 material and induces changes in its shape. A new peak appears at 0 eV following Mo doping. Additionally, the DOS above the Fermi level is significantly affected by the Mo atom, resulting in peaks in Mo-WSe2 at 0 eV to 1.6 eV, higher than those observed in pristine WSe2. Figure 5b illustrates the PDOS of the adsorbent material, where the Mo 4p orbital strongly hybridizes with the Se 4s, 4p, and 4d orbitals, as well as the W 5p orbital within the range of −8 eV to 2 eV. This hybridization contributes to the formation of a stable adsorption system of Mo atoms on WSe2, aligning with the previous analysis.
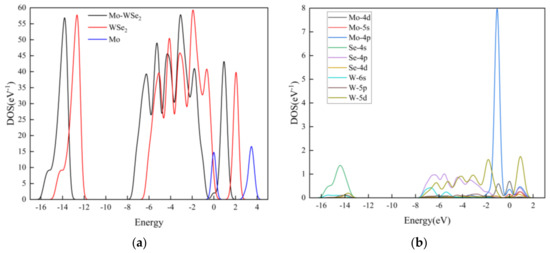
Figure 5.
DOS and PDOS of Mo-doped WSe2: (a) DOS; (b)DPOS.
3.2. Adsorption Performance Analysis of Mo-WSe2
3.2.1. Adsorption Configuration Analysis
The gas molecules N2O, CO2, and CH4 were positioned at the optimal adsorption sites of Mo-WSe2, as previously identified. By varying the position and orientation of these gas molecules and performing geometric optimizations, the most stable adsorption configurations were determined. For the N2O molecule, three adsorption configurations were evaluated: the O-atom end oriented perpendicularly, the N-atom end oriented perpendicularly, and the N2O molecule oriented parallel to the surface. For the CO2 molecule, only perpendicular and parallel orientations were considered, due to its symmetry. Similarly, for CH4, two orientations were assessed: one with the H-atom end oriented perpendicularly, and the other with the central C atom directed toward the surface. Based on the simulation results, the adsorption system structures with the lowest adsorption energies are illustrated in Figure 6.
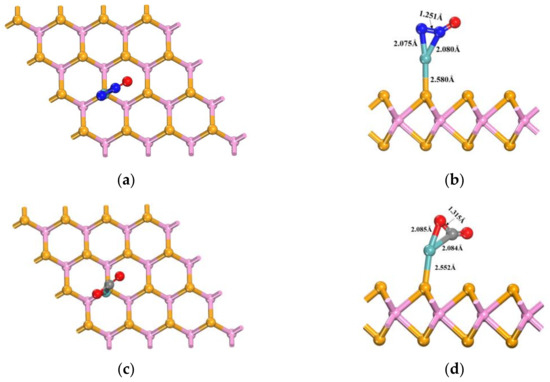
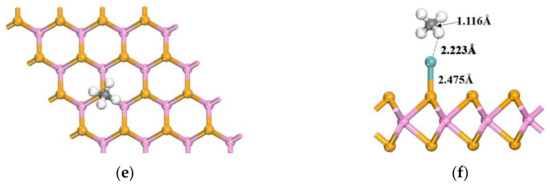
Figure 6.
Most-stable adsorption systems of the three gases: (a) top view after N2O adsorption; (b) side view after N2O adsorption; (c) top view after CO2 adsorption; (d) side view after CO2 adsorption; (e) top view after CH4 adsorption; (f) side view after CH4 adsorption.
In order to further analyze the adsorption properties of gases on Mo-WSe2, this study takes the energy change of gas molecules during the adsorption process on the Mo-WSe2 surface as the adsorption energy. The adsorption energy Ead of the gas adsorption process is shown in Equation (2).
where Egas/Mo-WSe2, EMo-WSe2 and Egas represent the total energy of the system after gas adsorption, the energy of the adsorbent material Mo-WSe2, and the energy of the gas molecule, respectively.
Ead = Egas/Mo-WSe2 − EMo-WSe2 − Egas
Table 2 shows parameters such as the bond length of the gas molecule before adsorption (dgas’), the bond length of the gas molecule after adsorption (dgas), the bond length of Mo-Se before adsorption (dMo-Se’), and the bond length of Mo-Se after adsorption (dMo-Se), as well as the adsorption distance and adsorption energy for the three systems.

Table 2.
Parameters before and after adsorption of gas molecules on Mo-doped WSe2.
As shown in Figure 6a,b, the N2O adsorption system reveals significant changes in the bond lengths of the N2O molecule before and after adsorption compared to the undoped state. The N-N bond length increases from 1.141 Å to 1.251 Å. Additionally, the Mo-Se bond length extends from 2.219 Å to 2.580 Å, and the distance between the Mo atom and the central N atom increases notably, to 2.079 Å. With an adsorption energy of −1.349 eV, Mo-WSe2 demonstrates a strong adsorption effect on N2O. In the CO2 adsorption system, as shown in Figure 6c,d, the distance between the C atom and the Mo atom increases significantly, to 2.084 Å. Furthermore, the C=O bond length, particularly between the O atom closest to the Mo atom and the C atom, increases from 1.178 Å to 1.315 Å. The Mo-Se bond length also extends from 2.214 Å to 2.552 Å, with an adsorption energy of −1.194 eV, indicating that Mo-doped WSe2 has a good adsorption effect on CO2. In contrast, the CH4 adsorption system, depicted in Figure 6e,f, shows a much weaker adsorption effect compared to CO2 and N2O. The C-H bond length closest to the Mo atom only increases slightly, to 1.116 Å, and the change in the Mo-Se bond length is relatively minimal. With an adsorption energy of −0.528 eV, the adsorption effect of CH4 on Mo-doped WSe2 is relatively poor, compared to the other two gases.
To further analyze the electronic distribution of certain chemical bonds in the doped adsorption system after bonding, the charge density difference of these systems is studied, as shown in Equation (3):
Δρ = ρgas/Mo-WSe2 − ρgas − ρMo-WSe2
Here, ρgas/Mo-WSe2, ρgas and ρMo-WSe2 represent the charge density difference of the gas molecule adsorption system, the charge density difference of a single gas molecule, and the charge density difference of Mo-WSe2. The calculation results are shown in Figure 7, where the green region indicates charge accumulation and the blue region indicates charge loss.
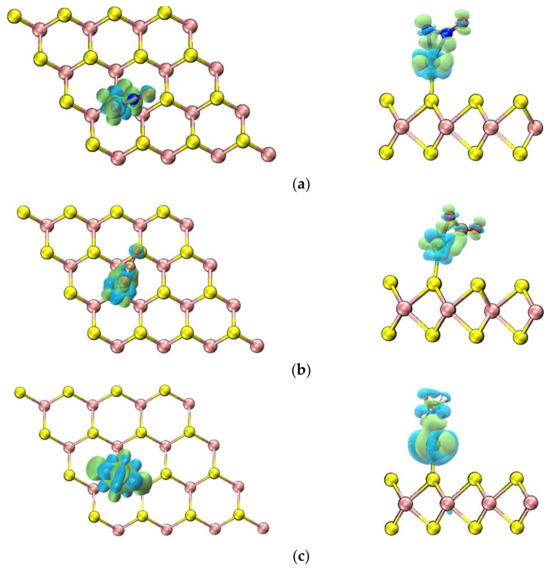
Figure 7.
Charge density difference of different adsorption systems: (a) N2O adsorption system; (b) CO2 adsorption system; (c) CH4 adsorption system.
As shown in Figure 7, there is a significant charge transfer in the N2O, CO2, and CH4 adsorption systems, and the number of transferred electrons can be obtained through calculations. Firstly, for the N2O adsorption system, 0.418 electrons are transferred from the Mo/WSe2 adsorbent material to N2O, and the electrons primarily accumulate between the Mo and N atoms for the formation of Mo-N bonds. Secondly, for the CO2 adsorption system, Mo atoms transferred 0.332 electrons to the nearest C and O atoms, which are used to form Mo-C and Mo-O bonds. Moreover, Mo/WSe2 transferred 0.450 electrons to CO2. However, for the CH4 adsorption system, a difference from the previous two cases is that CH4 transferred 0.115 electrons to Mo/WSe2. Mo atoms also only lost 0.157 electrons, with more electrons transferred to the C-H bonds. Therefore, no chemical bond is formed between the Mo and C atoms. Combining the analysis of bond lengths and adsorption energies mentioned above, it can be further concluded that Mo/WSe2 has a better adsorption effect on N2O and CO2.
3.2.2. Analysis of the Interaction Force
In order to further investigate the direct interaction force between gas molecules and Mo-WSe2, the three N2O, CO2 and CH4 gas systems are analyzed, based on IGMH. The IGMH isosurfaces and scatter plots of the three adsorption systems are shown in Figure 8. Blue, green and red colors indicate regions where sign (λ2) ρ > 0, sign (λ2) ρ < 0 and sign (λ2) ρ ≈ 0, respectively. The isovalue is 0.05 a.u. As can be seen in Figure 8a, there is a section of blue color between N2O and Mo, which indicates an obvious gathering of electrons between the N atom and Mo atom, leading to the formation of a N-Mo. In addition, the peak at the symbol (λ2) ρ = −0.1 a.u. corresponds to the attraction of this position, and the δ g_inter at the peak is as high as 0.19 a.u., which indicates that there is a strong adsorption between Mo-WSe2 and N2O. In the CO2 adsorption system shown in Figure 8b, there is a significant electron aggregation between C and O and Mo, resulting in the formation of C-Mo and O-Mo; the peak corresponding to this position reaches 0.18 a.u., suggesting that there is also a strong adsorption between Mo-WSe2 and CO2. For Figure 8c, the region between CH4 and Mo is repulsive, due to the spatial site resistance effect. However, due to the presence of attractive forces between H and Mo, there is, in turn, a partial region of mutual attraction, corresponding to the peak at the symbol (λ2) ρ = −0.035 a.u. The value of δ g_inter at the peak is 0.058 a.u., which indicates that the adsorption between CH4 and Mo-WSe2 is weak, mainly due to van der Waals forces. The results are all in agreement with the analysis before and after this paper.
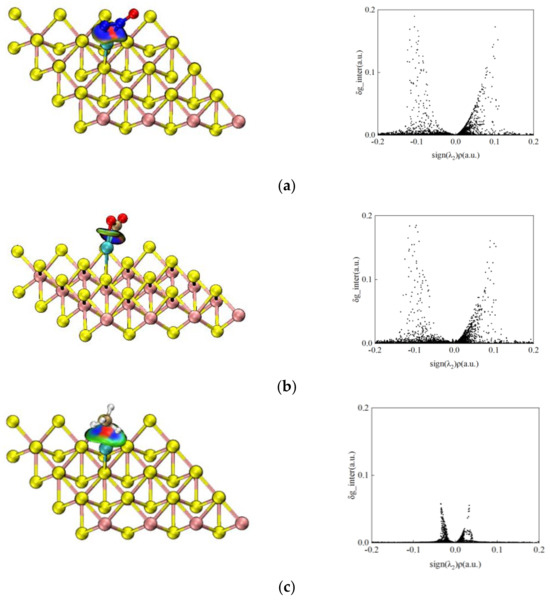
Figure 8.
IGMH isosurface and scatter plots for three adsorption systems: (a) N2O; (b) CO2; (c) CH4.
3.2.3. Analysis of ELF
To further investigate the adsorption properties of Mo-WSe2 on the three gas molecules, the Electron Localization Function (ELF) was analyzed, and the results are presented in Figure 9. As shown in Figure 9a, a distinct green region forms between the N and Mo atoms, with the ELF value between them close to 0.55. This indicates a strong charge accumulation between the N and Mo atoms, suggesting a good bonding tendency and confirming the effective adsorption of N2O by Mo-WSe2. In Figure 9b, the electrons are primarily concentrated between the C and Mo atoms, with an ELF value close to 0.6. This also indicates a strong adsorption effect of Mo-WSe2 on CO2. In contrast, Figure 9c shows that the electrons are uniformly distributed around the CH4 molecule, with almost no charge accumulation between it and the Mo atoms. The ELF value is close to 0, confirming the poor adsorption effect of Mo-WSe2 on CH4.

Figure 9.
ELF of three adsorption systems: (a) N2O; (b) CO2; (c) CH4.
3.2.4. Analysis of the DOS of the Adsorption Systems
To further analyze the interaction between gas molecules and the adsorbent material surface, this section investigates the DOS and PDOS of the three gas adsorption systems. The results are shown in Figure 10.
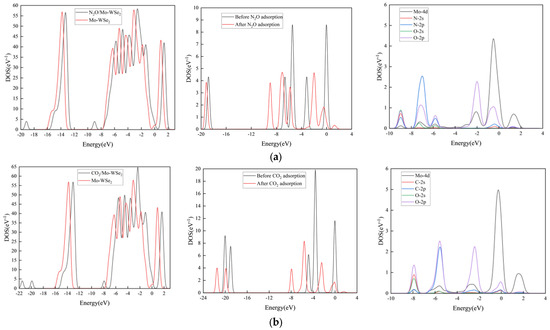

Figure 10.
DOS and PDOS of different gas adsorption systems: (a) N2O adsorption system; (b) CO2 adsorption system; (c) CH4 adsorption system.
From Figure 10, it can be observed that the DOS and PDOS of Mo-WSe2 change, to varying degrees, after gas adsorption. In the N2O adsorption system, as shown in Figure 10a, after adsorption, two new peaks appear at −19.5 eV and −9 eV for N2O/Mo-WSe2. Additionally, in the range from −1.4 eV to 0.6 eV, the Mo 4d orbitals strongly hybridize with the N 2p and O 2p orbitals. This also confirms that Mo-WSe2 exhibits a good adsorption effect on N2O, leading to structural changes in the N2O gas molecule. In the CO2 adsorption system, as shown in Figure 10b, the adsorption behavior causes three new peaks to appear for CO2/Mo-WSe2, located at −21.5 eV, −20 eV, and −8 eV. The Mo 4d orbital strongly hybridizes with the C 2p and O 2p orbitals in the range from −4 eV to 0.6 eV, indicating a strong adsorption effect of Mo-WSe2 on CO2 and leading to changes in the CO2 structure. From Figure 10c, it can be seen that the CH4 adsorption system is different from the above two gas adsorption systems, in that the peak changes are not significant; the Mo-4d orbital only shows a slight hybridization with the C-2p and H-1s orbitals in the range from −9 eV to −7 eV, which indicates weak adsorption of CH4 by Mo-WSe2.
3.3. Analysis of the Sensing Performance of Mo-WSe2
To evaluate the potential of Mo-WSe2 as a resistive gas sensor, the sensor response and desorption time after adsorption of each gas are studied. Sensor response can be obtained by detecting the change in conductivity of the material before and after adsorption of the gas, and the bandgap is the main factor determining the conductivity of the material.
Additionally, there is a quantitative relationship between the conductivity (σ) and the bandgap (Bg), given by Equation (4) [33,34]:
in which A is the attempt frequency, typically around 10−12, k is the Boltzmann constant, and T represents the thermodynamic temperature.
σ = A × e(−Bg/2kT)
The relationship between sensor response (S) and conductivity (σ) is given by Equation (5) [35]:
where σgas and σpure represent the conductivity of the gas adsorption system and the Mo-WSe2 pristine, respectively.
The band structures of N2O, CO2, and CH4 after adsorption are shown in Figure 11. The calculated sensitivities of Mo-WSe2 to N2O, CO2, and CH4 at room temperature are 31781.96, 789.44, and 0.99, respectively, using Equations (4) and (5). This indicates that Mo-WSe2 has a high sensor response to N2O and CO2, with significant changes in conductivity before and after adsorption. In contrast, the sensor response of Mo-WSe2 to CH4 is much lower than the response to the other two gases mentioned above. Therefore, Mo-WSe2 is more suitable for detecting N2O and CO2.
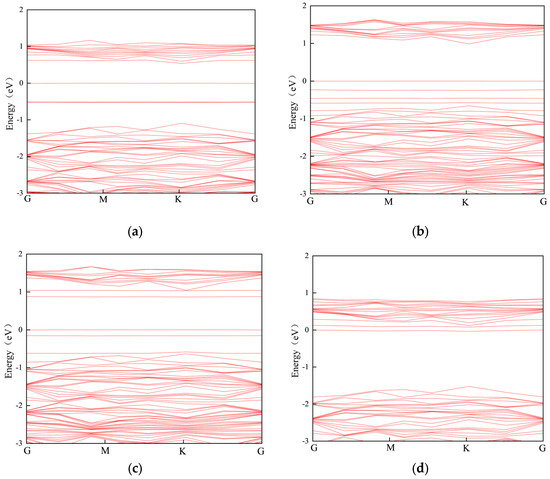
Figure 11.
Band structure and bandgap of Mo-WSe2 and each adsorption system: (a) Mo-WSe2 (0.451 eV); (b) N2O (0.987 eV); (c) CO2 (0.796 eV); (d) CH4 (0.079 eV).
Additionally, desorption time (τ) is an important indicator for evaluating gas sensors, representing the time it takes for a gas to desorb from the material surface, as shown in Equation (6) [36,37]:
where A is the attempt frequency, typically around 10−12, k is the Boltzmann constant, T represents the thermodynamic temperature, and Eg represents the energy barrier; the value of the energy barrier for the desorption process can be considered as the absolute value of the adsorption energy.
τ = A−1 × e(−Eg/kT)
If the desorption time is prolonged, it can significantly impact the sensor response and accuracy of the adsorbent material. Ideally, desorption should occur within a few seconds to a few dozen seconds. If the desorption time is not optimal, adjusting the temperature is necessary to achieve a suitable desorption time.
Table 3 presents the desorption times of different gases at varying temperatures. In the case of the N2O adsorption system, the optimal desorption time is observed between 498 K and 598 K. Similarly, for the CO2 adsorption system, the optimal desorption time ranges from 398 K to 498 K. However, due to the weaker adsorption effect in the CH4 system, achieving the desired desorption time necessitates a significantly lower temperature. Consequently, Mo-doped WSe2 is suitable for the adsorption and sensing of N2O and CO2 in various environments.

Table 3.
Desorption times of different gases at different temperatures.
4. Discussion
This paper investigates the adsorption properties of three typical greenhouse gases (N2O, CO2, and CH4) on Mo-doped WSe2 models. Through a comprehensive analysis involving adsorption energy, charge transfer, adsorption geometry, density of states, charge density difference, band structure, conductivity, and desorption time, the study explores the adsorption and sensing performance of these gases on monolayer Mo-WSe2. The findings indicate that the lowest adsorption energy occurs when Mo is doped above the Se atom in WSe2, identifying it as the optimal adsorption site. Mo-WSe2 demonstrates superior adsorption performance for CO2 and N2O, compared to CH4. In terms of conductivity sensor response, Mo-WSe2 is more responsive to N2O and CO2 detection. The desorption time for different gases on Mo-WSe2 is temperature-dependent, highlighting the importance of optimizing sensing conditions based on temperature. When compared with Ti-HfSe2, as reported in the literature study [35], Mo-WSe2 is shown to be more effective as a sensor for N2O. These results contribute to the exploration of monolayer WSe2 doped with metals for potentil gas sensing applications.
Author Contributions
Conceptualization M.D., Y.W., S.Z. (Shiqi Zhou), S.Z. (Shuai Zhang), J.P., S.T. and B.L.; investigation, M.D., Y.W., S.Z. (Shiqi Zhou), S.Z. (Shuai Zhang), J.P., S.T. and B.L.; methodology, Y.W.; writing—original draft preparation, M.D.; writing—review and editing, S.Z. (Shiqi Zhou); supervision, S.Z. (Shuai Zhang), J.P., S.T. and B.L.; funding acquisition, S.T. All authors have read and agreed to the published version of the manuscript.
Funding
This research is supported by the Natural Science Foundation of Hubei Province (Innovative Group Program of Hubei) (2021CFA025). The authors declare that this study received funding from Shuangshuang Tian. The funder had the following involvement with the study: Conceptualization; investigation; writing—review and editing.
Institutional Review Board Statement
Not applicable.
Informed Consent Statement
Not applicable.
Data Availability Statement
Data are contained within the article.
Conflicts of Interest
Authors Mingqi Dong and Junzhe Peng were employed by the Economic and Technical Research Institute of State Grid Hubei Electric Power Co., Ltd. Authors Shiqi Zhou and Shuai Zhang were employed by the State Grid Hubei Electric Power Co., Ltd. The remaining authors declare that the research was conducted in the absence of any commercial or financial relationships that could be construed as a potential conflict of interest.
References
- Wang, Y.; Ding, D.; Zhang, Y.; Yuan, Z.; Tian, S.; Zhang, X. Research on infrared spectrum characteristics and detection technology of environmental-friendly insulating medium C5F10O. Vib. Spectrosc. 2022, 118, 103336. [Google Scholar]
- Wu, Y.; Ding, D.; Wang, Y.; Zhou, C.; Lu, H.; Zhang, X. Defect recognition and condition assessment of epoxy insulators in gas insulated switchgear based on multi-information fusion. Measurement 2022, 190, 0263–2241. [Google Scholar]
- Lv, Y.; Wang, Y.; Sun, Y.; Li, N.; Wang, X.; Hao, R. Status analysis of domestic and foreign strategies for climate change health adaptation. J. Environ. Health 2022, 12, 241–253. [Google Scholar]
- Fan, Z.; Song, C.; Qi, X.; Zeng, L.; Wu, F. Accounting of greenhouse gas emissions in the Chinese agricultural system from 1980 to 2020. Sheng Tai Xue Bao 2022, 42, 1–13. [Google Scholar]
- Chen, Z.; Li, J.; Zhang, X.; Jiang, F. Progress on Construction and Research of Sensing Films of Molecularly Imprinted Electrochemical Sensors. J. Instrum. 2010, 29, 97–104. [Google Scholar]
- Li, W.; Huang, S.; Chen, W. Recent developments of gas sensors for methane detection. J. Fujian Univ. Technol. 2006, 4, 4–8. [Google Scholar]
- Zhang, Y.; Zhang, X.; Fu, M.; Wang, D.; Wang, T.; Tian, S. Quantitative Analysis Method of C4F7N and Its Decomposition Products Based on Infrared Spectroscopy Technology. High Volt. Eng. 2022, 48, 1836–1845. [Google Scholar]
- Zhang, D.; Tong, J.; Xia, B. Humidity-sensing properties of chemically reduced graphene oxide/polymer nanocomposite film sensor based on layer-by-layer nano self-assembly. Sens. Actuators B Chem. 2014, 197, 66–72. [Google Scholar]
- Cui, H.; Zhang, X.; Zhang, J.; Zhang, Y. Nanomaterials-based gas sensors of SF6 decomposed species for evaluating the operation status of high-voltage insulation devices. High Volt. 2019, 4, 242–258. [Google Scholar]
- Zhang, D.; Sun, Y.; Li, P.; Zhang, Y. Facile fabrication of MoS2-modified SnO2 hybrid nanocomposite for ultrasensitive humidity sensing. ACS Appl. Mater. Interfaces 2016, 8, 14142–14149. [Google Scholar]
- Chen, D.; Zhang, X.; Xiong, H.; Li, Y.; Tang, J.; Xiao, S.; Zhang, D. A First-Principles Study of the SF6 Decomposed Products Adsorbed Over Defective WS2 Monolayer as Promising Gas Sensing Device. IEEE Trans. Device Mater. Reliab. 2019, 19, 473–483. [Google Scholar] [CrossRef]
- Zhang, X.; Yu, L.; Wu, X.; Hu, W. Experimental sensing and density functional theory study of H2S and SOF2 adsorption on Au-modified graphene. Adv. Sci. 2015, 2, 1500101. [Google Scholar]
- Zhang, X.; Wu, F.; Tie, J.; Xiong, H.; Jiang, H.; Tang, J. TiO2 Nanotube Array Sensor for Detecting SF6 Decomposition Component SO2F2. High Volt. Eng. 2014, 40, 3396–3402. [Google Scholar]
- Tian, Y.; Feng, Q.; Zhou, K.; Liu, P. Effect of optical gas sensing properties rutile phase oxide TiO2, SnO2 and GeO2 surface oxidation with HCl molecules. Chin. Sci. Bull. 2017, 62, 1729–1737. [Google Scholar]
- Pi, S.; Zhang, X.; Fang, J.; Chen, D. Different PtNPs Doped Graphene Sensor for Detecting Gas Sensitive Property of SF6 Decomposition Components. High Volt. Appar. 2022, 58, 67–72. [Google Scholar]
- Zhang, X.; Wang, J.; Chen, D.; Liu, L. The adsorption performance of harmful gas on Cu doped WS2: A First principle study. Mater. Today Commun. 2021, 28, 102488. [Google Scholar] [CrossRef]
- Li, H.; Liu, S.; Feng, Q. Research and Application Progress of Electrochemical Sensors Based on Two-dimensional Layered Semiconductor Materials. Mater. Rep. 2022, 36, 20080298. [Google Scholar]
- Yang, Z.; Li, B.; Han, Y.; Su, C.; Chen, W.; Zhou, Z. Gas sensors based on two-dimensional transition metal dichalcogenide nanoheterojunctions. Chin. Sci. Bull. 2019, 64, 3699–3716. [Google Scholar]
- Zhang, Y.; Wei, X.; Yu, Y.; Zhang, H. Research Progress on the Application of Transition-metal Dichalcogenides in FET. J. Synth. Cryst. 2017, 46, 868–873. [Google Scholar]
- Pham, V.P.; Yeom, G.Y. Recent Advances in Doping of Molybdenum Disulfide: Industrial Applications and Future Prospects. Adv. Mater. 2016, 28, 9024–9059. [Google Scholar]
- Chen, Z.; Zhang, X.; Xiong, H.; Chen, D.; Cheng, H.; Tang, J.; Tian, Y.; Xiao, S. Dissolved GasAnalysis in Transformer Oil Using Pt-Doped WSe2 Monolayer Based on FirstPrinciples Method. IEEE Access 2019, 7, 72012–72019. [Google Scholar] [CrossRef]
- Ni, J.; Wang, W.; Quintana, M.; Jia, F.; Song, S. Adsorption of small gas molecules onstrained monolayer WSe2 doped with Pd, Ag, Au, and Pt: A computationalinvestigation. Appl. Surf. Sci. 2020, 514, 145911. [Google Scholar] [CrossRef]
- Mi, H.; Zhou, Q.; Zeng, W. A density functional theory study of the adsorption of Cl2, NH3, and NO2 on Ag3-doped WSe2 monolayers. Appl. Surf. Sci. 2021, 563, 150329. [Google Scholar] [CrossRef]
- Chen, J.; Chen, J.; Zeng, W.; Zhou, Q. Adsorption of HCN on WSe2 monolayer doped with transition metal (Fe, Ag, Au, As and Mo). Sens. Actuators A Phys. 2022, 341, 113612. [Google Scholar] [CrossRef]
- Wang, D.; Chen, D.; Pi, S.; Zhang, X.; Tang, J. Density Functional Theory Study of SF6 Decomposed Products Over ZnO (0001) with Gas Sensing Properties. CES TEMS 2020, 35, 1592–1602. [Google Scholar]
- Zhang, D.; Cao, Y.; Yang, Z.; Wu, J. Nanoheterostructure construction and DFT study of Ni-doped In2O3 nanocubes/WS2 hexagon nanosheets for formaldehyde sensing at room temperature. ACS Appl. Mater. 2020, 12, 11979–11989. [Google Scholar] [CrossRef]
- Liu, L.; Yao, H.; Jiang, Z. Theoretical study of methanol synthesis form CO2 hydrogenation on PdCu3(111) Surfaces. Appl. Surf. Sci. 2018, 451, 333–345. [Google Scholar] [CrossRef]
- Xiao, S.; Zhang, J.; Zhang, X.; Chen, D.; Fu, M.; Tang, J.; Li, Y. Adsorption Characteristics of γ-Al2O3 for the Environment-friendly Insulation Medium C3F7CN/N2 and Its Decomposition Products. High Volt. Eng. 2018, 44, 3135–3140. [Google Scholar]
- Burdett, J.K.; McCormick, T.A. Electron localization in molecules and solids: The meaning of ELF. J. Phys. Chem. A 1998, 102, 6366–6372. [Google Scholar] [CrossRef]
- Lu, T.; Chen, F. Multiwfn: A multifunctional wavefunction analyzer. J. Comput. Chem. 2012, 33, 580–592. [Google Scholar] [CrossRef]
- Duan, K. Design and Study on the Adsorption of WSe2 Gas Doped with Group V and VII Atoms Based on the First Principle. Master’s Thesis, Nanjing University of Posts and Telecommunications, Nanjing, China, 2022. [Google Scholar]
- Xie, Z.; Li, X.; Zeng, L.; Cheng, C.; Song, Z.; Liu, M. Research on Adsorption Mechanism of Mn-doped SnS Two-dimensional Materials Towards Dissolved Gases Analy. High Volt. Appar. 2024, 60, 182–190. [Google Scholar]
- Wu, H.; Zhang, B.; Li, X.; Hu, X. First-principles screening upon Pd-doped HfSe2 monolayer as an outstanding gas sensor for DGA in transformers. Comput. Theor. Chem. 2022, 1, 1208. [Google Scholar] [CrossRef]
- Sharma, A.; Khan, M.S.; Husain, M.; Khan, M.S.; Srivastava, A. Sensing of CO and NO on Cu-doped MoS2 Monolayer Based Single Electron Transistor: A First Principles Study. IEEE Sens. J. 2018, 18, 2853–2860. [Google Scholar] [CrossRef]
- Wang, Y.; Liu, B.; Fang, R.; Jing, L.; Wu, P.; Tian, S. Adsorption and Sensing of CO2, CH4 and N2O Molecules by Ti-Doped HfSe2 Monolayer Based on the First-Principle. Chemosensors 2022, 10, 414. [Google Scholar] [CrossRef]
- Cui, H.; Zhang, X.; Zhang, G.; Tang, J. Pd-doped MoS2 monolayr: A promising candidate for DGA in transformer oil based on DFT method. Appl. Surf. Sci. 2019, 470, 1035. [Google Scholar] [CrossRef]
- Zhang, D.; Yang, Z.; Li, P.; Pang, M.; Xue, Q. Flexible self-poared high-performance ammonia sensor based on Au-decoratedMoSe2 nanoflowers driven by single layer MoS2-flake piezoelectric nanogenerator. Nano Energy 2019, 65, 103974. [Google Scholar] [CrossRef]
Disclaimer/Publisher’s Note: The statements, opinions and data contained in all publications are solely those of the individual author(s) and contributor(s) and not of MDPI and/or the editor(s). MDPI and/or the editor(s) disclaim responsibility for any injury to people or property resulting from any ideas, methods, instructions or products referred to in the content. |
© 2024 by the authors. Licensee MDPI, Basel, Switzerland. This article is an open access article distributed under the terms and conditions of the Creative Commons Attribution (CC BY) license (https://creativecommons.org/licenses/by/4.0/).