Article

Rational Design and Optimization of Plasmonic Nanohole Arrays for Sensing Applications

CNR-IMM, Institute for Microelectronic and Microsystems, Lecce Section, University Campus Ecotekne, Via per Monteroni, 73100 Lecce, Italy
*
Author to whom correspondence should be addressed.
Chemosensors 2024, 12(8), 157; https://doi.org/10.3390/chemosensors12080157
Submission received: 5 July 2024 / Revised: 5 August 2024 / Accepted: 6 August 2024 / Published: 8 August 2024

Abstract

:
The design and optimization of plasmonic nanohole arrays (NHAs) as transducers for efficient bioanalytical sensing is a rapidly growing field of research. In this work, we present a rational method for tailoring the optical and functional properties of Au NHAs realized on planar transparent substrates. Experimental and numerical results demonstrate how the far- and near-field properties of the NHAs can be controlled and optimized for specific sensing applications, proving a valuable insight into the distribution of electric fields generated on the nanostructured metal surface and the depth of penetration into the surrounding media. Metal thickness is found to play a crucial role in determining the sensing volume, while the diameter of the nanoholes affects the localization of the electromagnetic field and the extent of the decay field. The remarkable surface and bulk refractive index sensitivities observed a rival performance of more complex geometric designs reported in the recent literature, showcasing their outstanding potential for chemo-biosensing applications.

1. Introduction

Each year, the materials science research community demonstrates a growing interest in nanophotonic devices that rely on the optical properties of metal nanostructures. This renewed interest can be attributed to the vast array of applications that can harness the resonant photon-induced collective oscillations of free electrons. Driven by incident light, plasmonic modes are responsible for a huge enhancement of the electromagnetic (EM) field near the metal nanostructure surface, decaying rapidly with a distance from the surface depending on the excited plasmonic mode and on the nanostructure geometry. In this nanoscale volume, any local increase in the refractive index (RI), due to molecular binding events close to the surface, can be probed by the EM field, resulting in changes in the far field spectral readout. Both local and volumetric RI changes can be monitored by the spectral modulation of the transmitted or reflected light or by metal-enhanced spectroscopies like surface-enhanced Raman scattering (SERS) and surface-enhanced fluorescence spectroscopy (SEFS).
To achieve an optimal sensing response from the plasmonic transducer, careful consideration of its geometric features is essential. These features play a crucial role in determining the specific plasmonic modes excited, the localization and enhancement of the EM field, and the extent of the decay field into the dielectric. A tailor-designed plasmonic transducer will guarantee that the volume occupied by the analyte–recognition element couple will be perfectly fitted to the sensing volume. In this way, the investigated biorecognition event would occur exactly within the shallow decay field where the plasmonic field strength is stronger, leading to an optimized sensing response.
In this frame, a crucial issue is the proper engineering of plasmonic nanostructures properties to efficiently probe the local refractive index variations upon the biomolecular surface-binding events yielding high refractometric and local sensitivities [1,2,3,4,5,6,7,8,9,10].
Nanohole arrays in thin metal films have emerged as highly effective plasmonic platforms for local refractive index detection in diverse sensing applications. This transducing platform offers several technical advantages that contribute to its widespread adoption. Notably, the ability to excite resonances in a collinear optical configuration enables seamless integration into low-cost, user-friendly, and portable platforms. This ensures compact device size, straightforward measurement setup, and effortless sensor integration with imaging systems [11].
Incident light can excite various plasmonic modes in metal nanohole arrays. These include localized surface plasmon modes at the rim of the nano apertures and propagating surface plasmons on the metal–dielectric interface, which are induced by the grating order of the array. The coupling between these modes, and potentially with additional diffractive modes, leads to the emergence of multiple resonances characterized by dips and peaks in the transmittance spectrum. They can be tailored by changing geometrical parameters of the array or the experimental configuration [12,13,14] finding different applications depending on their peculiar sensing abilities. Thick metal nanohole arrays (i.e., hundreds of nanometers) have been largely explored in the literature both from an optical and functional point of view. Pioneering work of Masson research group [15,16,17,18,19] showed that grating coupling conditions are greatly influenced by the periodicity of the array while hole diameters affect the transmission intensity more. In such holey metal thick films, they recognized the phenomenon of extraordinary light transmission (EOT), an unexpected intensity enhancement of the transmitted light compared to the incident light when normalized to the holes’ aperture areas. The transmission peaks showed an interesting response to bulk RI changes close to the metal interface, while local changes were probed by Raman spectroscopy.
A significant part of literature has been devoted to understanding the physical origin of EOT in thick metal nanohole arrays: it is agreed that the phenomenon is attributed to the strong coupling between the different plasmonic modes efficiently excited by incoming light at the metal/dielectric interfaces. The same Masson research group has also shown how the passage from enhanced transmission to attenuated transmission (CGAT) conditions is regulated by the reduction in the diameter of the nanoholes. Further research groups have focused their attention on the role of the metal thickness in the modulation of the above optical properties. A significant part of the incident light energy is demonstrated to be dispersed in the glass substrate and the effect is amplified by a reduction in the metal thickness [7,20,21,22,23,24]. In the above conditions, EOT can leave the place to enhanced absorption spectral properties, often attributed to the so-called Fano interference effects due to interference of diffractive modes with the continuum state [25,26,27,28,29]. This approach has been particularly useful to explain the optical behavior of ultrathin plasmonic nanoarrays of varying size and shape [30].
The use of metal nanohole arrays as RI sensing transducers has garnered significant interest in the sensing research community, particularly when considering EOT or enhanced absorption phenomena. In this context, sensing performance has been evaluated in terms of refractive index sensitivity (RIS) or Raman response [9,31,32,33]. However, a comprehensive investigation into the relationship between the far- and near-field properties of Au nanohole arrays and their functional properties, relative to their geometrical features, is still lacking or reported with a limited scope.
To this purpose, the aim of this work is to offer a rational design method for easy identification of optical and functional properties of Au nanohole arrays realized on planar transparent substrates relating them to their geometry and arrangement. By playing with geometrical features, namely the thickness and the diameter size, an accurate rational design of metal NHA is offered, giving the possibility to guide the functional properties of the selected transducer to a specific application where its analytical performance is maximized.
Both RIS data and surface sensitivity are obtained through experimental methods and analyzed using numerical simulations. These simulations provide valuable insights into the extent of electric fields extending from metal surfaces into the surrounding media. By combining experimental and numerical results, we can establish guidelines for selecting the appropriate transducer, ensuring optimal functional properties for a specific analytical problem.

2. Materials and Methods

2.1. Ordered Gold Nanoholes Arrays Fabrication

Ordered gold nanohole arrays were fabricated starting from the self-assembly of polystyrene (PS) nanospheres (Sigma-Aldrich, Darmstadt, Germany, nominal diameter 500 nm in aqueous suspensions with a concentration of 10 wt%) at an air/water interface organized in a close-packed array (CPA) with hexagonal symmetry and successively deposited onto glass substrates and used as a mask for successive metal evaporation. The adopted experimental technique and the home-made apparatus are detailed in our previous works [34,35].
After PS-CPA mask realization, a non-close packed array (NCPAs) of PS nanospheres was successively obtained by oxygen plasma etching procedure (Diener ATTO, Diener electronics), which induces a progressive and controllable reduction in the diameter of the spheres, preserving both the periodicity and the order of the starting array. Oxygen plasma treatment was carried out in 120 s in time, with cooling pauses of 60 s each, and repeated until the desired size of the spheres was reached. To obtain suitable masks adopted in our study, specific oxygen plasma treatments lasting 720 s and 840 s were used.
The fabricated NCPAs deposited onto glass substrates were used as lithographic masks to obtain two-dimensional (2D) distributions of gold nanoholes. A preliminary evaporation (electron beam evaporation method) of 2 nm titanium as the adhesion layer and a successive 30 nm (thin metal layers) or 100 nm (thick metal layer) were carried out to realize suitable families of investigated plasmonic transducers.
After metal deposition, the colloidal mask was removed by a mechanical process using an adhesive tape in the case of the larger spheres, while a chemical process by an ultrasonic bath of toluene was employed in the case of the smaller ones.

2.2. FEM Simulations

A computational technique based on finite element method (FEM) was used for predicting the optical behavior and the unique electromagnetic properties of the developed plasmonic metamaterials. In particular, the radio frequency (RF) module of COMSOL Multiphysics was used to investigate the electric field distribution and the far-field spectra of nanohole arrays characterized by hexagonal geometry. Owing to the spatial symmetry of the metal nanostructures and the perpendicular excitation using a linearly polarized light, the significant computational resources often required by 3D simulations was overcome by restricting the computational domain. Accurate results can be achieved by applying appropriate boundary conditions, that allow to model the periodic unit cell reported in Figure 1. The geometry of the computational domain was built by considering a hexagonal CPA of polystyrene nanospheres with nominal diameter of 500 nm. Starting from the bottom of the computational domain reported in Figure 1a, the first domain is a Perfectly Matched Layer (PML) followed by the glass substrate, on which the metal layer with gold nanoholes have been modeled. As reported in Figure 1b, a thickness of 30 nm or 100 nm has been considered for the plasmonic material with nanoholes characterized by perfectly circular shape. The last domain at the top represents the external environment.
Additionally, we simulated the presence of 10 polyelectrolytes monolayers by introducing a 10 nm thick layer of dielectric medium with specific refractive index and absorption properties.
The finite element discretization of the model was optimized according to the geometrical features of each domain. A free triangular mesh was adopted for domains characterized by larger geometrical features like the glass substrate and the environment. To limit the computational cost of the problem, a swept mesh with a local refinement near the holes edges was adopted for domains characterized by smaller geometrical details like the metal nanohole and the polyelectrolyte layers.
The optical properties of the involved materials were described by their frequency-dependent dielectric functions. In the visible spectral range, a complex dielectric constant value has been adopted for the nanostructured metal layer, while a 1.5 refractive index has been considered for the polyelectrolyte layer. Localized surface plasmon activation was achieved simulating a linearly polarized EM wave coming from the external environment. Appropriate boundary conditions were set for both the upper and lower edges of the simulation domain to calculate the reflection and transmission coefficients of the system. Perfect electrical conductor (PEC) and perfect magnetic conductor (PMC) boundary conditions were set for the sides of the unit cell to simulate an infinite array of plasmonic NH with hexagonal periodicity. Far- and near-field analyses were indeed performed simulating all the four samples, setting the corresponding thicknesses and diameters.

2.3. Morphological and Optical Characterization

The morphology of fabricated gold nanohole arrays was investigated by atomic force microscopy (AFM NT-MDT Spectralight, Moscow, Russia): height topographic images and corresponding profiles were acquired in a semi-contact mode, using commercial probes (TipsNano AFM probes ETALON series, HA-NC: frequency 235–140 kHZ, force constant 12–3.5 N/m).
The optical transmission spectra of all samples were measured in air at normal incidence using an ultraviolet-visible-near infrared spectrometer (Cary 500 UV-VIS-NIR Spectrometer, Varian, Palo Alto, CA, USA), in the 400–1100 nm spectral range and normalized to the corresponding signal of a bare glass substrate, with a spectral resolution of 1 nm.

2.4. Sensitivity Performance Measurements

Metal nanoholes arrays were tested for bulk refractive index changes: their transmission spectra were obtained by immersing them in aqueous solutions of glycerol at different concentrations.
This functional characterization was performed in a liquid environment with a compact optical fiber system equipped with a deuterium halogen light source, a portable spectrometer (Avantes AVS-MC2000-5, wavelength ranging between 300–1100 nm), and a collecting optical fiber in transmission configuration.
White light emerging from the optical fiber directly immersed into the liquid environment hit the sample perpendicularly: the transmitted signal was then coupled into a detection fiber and analyzed by the spectrometer.
To determine the RIS, the samples were immersed in liquids with a refractive index (RI) increasing from 1.33 (water) up to 1.40 (obtained mixing glycerol and water, with an increasing percentage of glycerol). Under these conditions, the spectral shift of the wavelength position of the transmission features was detected and used to evaluate RIS by means of the variation in position of the wavelength transmission peak and R I , the variation in the refractive index.
A further functional characterization of the substrates was obtained by estimating the so-called local or surface sensitivity. It was performed by depositing an increasing number of polyelectrolytes monolayers of controlled thickness giving rise to a variation in the refractive index in the immediate vicinity of the metal nanohole array.
Polyelectrolytes multilayer films (PEM) were deposited with the well-known layer-by-layer technique [36] on both nanohole arrays and clean quartz substrates, the latter having been carried out to verify the linear growth and the thickness of the PEM.
All the analyzed samples and quartz substrates were pre-cleaned by five minutes of ultrasonic baths in acetone, ethanol, and deionized (DI) water, and subsequently subjected to an optimized hydrophilization process based on oxygen plasma treatment (Diener Atto, 1 mbar O2, 100 W, 5 min), performed immediately before PEM multilayer deposition.
PEMs were assembled by dipping substrates for 10 min each in a 2.0 mg/mL 0.1 M sodium chloride (NaCL) aqueous solutions (DI water) of Poly(diallyldimethylammonium chloride) (PDDA, 20 wt.-% aqueous solution, Mw: 200,000–350,000, Sigma-Aldrich Co.), positively charged, and Poly (sodium4-styrene sulfonate) (PSS, MW:70,000, powder, Sigma-Aldrich Co.), negatively charged, alternately. After every deposition step, each substrate was rinsed for one minute with DI water. The entire sequence was repeated until the desired number of layers was obtained (3, 6, 9, 12, 15, 18, 21, 24, 27, 30).
The thickness of the deposited layers was estimated by means of the AFM measurement on a sample obtained by depositing a predetermined number of PEMs in correspondence with an intentional scratch, given the verified hypothesis of a linear growth of the thickness with the number of layers. A thickness of 1 nm per layer was estimated, confirming the result reported in the literature under the same experimental conditions [37,38].
The transmittance spectra of the nanostructures were collected in air every three PEMs with a compact optical fiber system equipped with a deuterium halogen light source and a portable spectrometer.

3. Results and Discussion

3.1. Optical and Morphological Description

Three representative AFM images of the fabricated nanohole gold arrays, with 500 nm periodicity, are shown in Figure 2. In the top line, AFM topographic images of a (3 × 3) µm2 area of the three samples are shown. The corresponding profiles are reported in the bottom line: from left to right, the LD100 (Figure 2a) sample is characterized by a diameter of (320 ± 20) nm and a height of (100 ± 10) nm, the SD100 (Figure 2b) sample has a diameter of (230 ± 20) nm and a height of (100 ± 10) nm, the SD30 (Figure 2c) sample has a diameter of (240 ± 20) nm and height of (30 ± 5) nm. As expected, AFM images reveal very regular hexagonal nanohole patterns obtained with an NSL-based tuning technique, already described in detail in our previous work [35]. Some polystyrene residuals, visible in the SD30 sample inside the holes, do not affect the quality of the substrate, having been shown their negligible effect on the optical and sensing properties [39].
The experimental and calculated normal incident transmission spectra of each sample in water solution are reported in Figure 3. The monitored spectral positions in each sample have been identified with different subscripts, each for the different color region of the visible spectrum. As one can see by comparing experimental (solid lines) and calculated (dashed lines) spectra, the overall correspondence of the trend with the same number of resonances of the experimental and theoretical transmittance curves is evidenced. Nevertheless, it is possible to notice some differences between modeled and experimental curves, particularly in the position of some resonances and in the width or intensity of others. These inevitable discrepancies are due to differences between real samples and modeled ones: the former being formed by numerous hexagonal symmetry domains with different orientations, while the latter are made up of a single domain. Moreover, the simulated structure has sharp edges and flat surfaces which instead appear mostly rounded and irregular in the real ones.
For instance, experimental λNIR peaks consistently appear broader than their calculated counterparts. This phenomenon can be attributed to the mode primarily being generated by propagating plasmons resulting from lattice effects. As such, this mode represents a convolution of several resonances due to various diffraction orders [40]. Additionally, the physical sample consists of numerous domains with different orientations, each contributing lattice modes slightly displaced from one another. The convolution of these modes results in a broadening effect on the peak observed.
In a previous study, we analyzed the optical behavior of these nanostructures, with a particular focus on their performance as SERS substrates [41].
Here we propose a deepening analysis of the optical properties, focusing on their sensing capability. Briefly, the presence of numerous resonances in transmittance spectra shown in Figure 3 is due to the coupling between localized plasmonic resonances (LSP) and surface plasmonic polaritons (SPP): the former are due to the interaction of light with nano-sized holes in the metal film, while the latter are generated at the two interfaces between the metal and the surrounding dielectric media, due to the grating-like nature of the nanohole arrays which provide the extra momentum for free space coupling. The SPPs at both sides of the metal film combine through the waveguide dark multipole modes in the nanoholes [42], generating hybridized modes, which weaken the transmission through the holes but yield sharp peak features. This band structure should have potential applications such as high-resolution biosensors [43].
These types of structures also show grating resonances, the so-called Rayleigh–Wood (RW) anomalies, which interact with plasmonic resonances and have a non-negligible role in the overall optical behavior [41].
Furthermore, in the thinnest films, the coupling between the SPPs at the two metal interfaces generates a suppression of transmission toward an enhancement of absorption [27].
Although it exhibits higher transmittance values on average compared to 100 nm thick samples due to its thinner film, the 30 nm thick sample shows a less intense peak at the longer wavelength (λNIR) (Figure 3c) than the 100 nm thick samples (Figure 3a,b). Additionally, the absorption is more pronounced, as seen in the dip at λR. Furthermore, both of these resonances are redshifted by more than 100 nm in the thinner samples compared to the thicker ones. These phenomena have been previously observed in ultra-thin films (<100 nm) and explained in earlier studies [27,44].
Furthermore, as seen in the corresponding spectrum of Figure 3c, the thin sample exhibits two additional resonances compared to the others: the λB and λG resonances are doubled, each consisting of a maximum and a minimum, indicated by * and **, respectively.
As shown, increasing the diameter shifts the resonances to longer wavelengths, while decreasing the diameter results in a spectral shift towards shorter wavelengths. By further modulating the diameter, metal composition, and array symmetry of the nanostructured gold films, the operational frequency range of the proposed plasmonic sensors is expected to be further expanded. By leveraging these design parameters, precise control over the plasmonic resonances can be achieved, enabling the development of sensors tailored for specific applications across a broader spectral range.

3.2. Sensitivity Performances

In plasmonic optical sensors, sensing performance depends on the sizes of the analyte and probe. Larger analytes cause more significant refractive index changes, making detection easier. Conversely, smaller probes require improved resolution to detect localized changes. Therefore, the plasmonic transducer must be able to detect both volumetric and localized variations in the refractive index [37]. This property is strictly linked to the distribution of electric fields generated on the nanostructured metal surface and the depth of penetration into the dielectric.
The transducer response also depends on the distance of the analyte from its metal surface where the probe field is located. This dependence is closely linked to the penetration depth of the local evanescent electromagnetic field generated by the plasmonic modes and extends from the metal structure towards the surrounding dielectric medium with an exponential trend which, as a first approximation, can be described by the following relationship [45]:
λ = η b u l k Δ n 1 e x p 2 d δ
where Δ λ represents the response of the transducer (variation of the wavelength of the extinction peak); η b u l k is the RIS, i.e., the wavelength displacement of the peak per unit of refractive index, which is sometimes referred to as bulk sensitivity; Δ n is the variation of the refractive index (RI) of the surrounding dielectric medium; d is the thickness of the dielectric layer; δ is the plasmonic decay length [46,47].
From Equation (1), in the limit d δ the asymptotic shift λ ( ) = η b u l k Δ n is obtained, from which the definition of the bulk RIS follows:
η b u l k = λ Δ n
On the opposite, if d δ , approximating the exponential in Equation (1) to the first-order series expansion, a linear expression is obtained:
λ d λ 0 + η b u l k Δ n 1 1 2 d δ = λ 0 + 2 η b u l k Δ n δ d
which leads to the surface or local sensitivity η s u r f , defined as the derivative of λ calculated at d = 0 and normalized to Δ n :
η s u r f = 1 Δ n λ d | d = 0
We sought to experimentally obtain the two functional characterizations. For this purpose, Figure 4 compiles the transmission spectra of the three samples after immersing them in aqueous solutions with increasing refractive indices. As shown, the highlighted resonances undergo varying degrees of spectral redshift as the refractive index increases. The insets magnify the features exhibiting the most pronounced shifts. Different behaviors are evident among the investigated samples and even within the same sample at different spectral positions. The expected spectral redshifts can appear in transmission maxima and minima, displaying varying behaviors within the same sample and among different samples. This variation is likely due to the distinct nature of the plasmonic modes responsible for the transducing process.
Calibration curves (reported in Figure S1) were derived from the wavelength shift (nm) of each resonance with varying refractive indices. The plasmonic response exhibits a linear dependence on the refractive index of the external environment within the examined range. RIS results, presented in the top row of Table 1, were calculated from the slope of the calibration curves, according to Equation (2).
As seen in Figure 4, the 100 nm thick samples (LD100 and SD100) display very similar results. The spectral positions λB (associated with the transmittance minimum) and λNIR (associated with the transmittance maximum) exhibit the highest RIS values among the investigated spectral features, exceeding 400 nm/RIU. In contrast, the values corresponding to the resonance λG are about half of the highest RIS values. The minima at λR, however, are substantially insensitive to refractive index changes within the considered range. This result supports the hypothesis that this resonance is primarily due to a Rayleigh–Wood anomaly at the metal/glass interface, and therefore, not in contact with the liquid environment [28].
Thinner samples (SD30) exhibit a completely different behavior. The highest RIS value was achieved using the spectral position related to the transmittance maximum λB**, while the minimum λB* produced a lower value, close to the minimum λG*. The maximum λG** did not exhibit any detectable displacement in response to changes in the refractive index. The minimum λR showed an intermediate RIS value, unlike the corresponding thicker samples, which showed a negligible response to refractive index changes. Additionally, the spectral position λNIR (associated with a transmittance maximum) was not sensitive to refractive index variations, contrasting with the results from thicker samples. This indicates that the decrease in metal thickness leads to the excitation of different plasmonic modes compared to thicker samples, resulting in a significantly different functional response to optical changes in the environment.
As reported in the literature, reducing metal thickness enables the coupling of plasmonic modes excited at both metal interfaces, resulting in enhanced absorption rather than transmission [48]. This causes a redistribution of the electromagnetic field on the surface and metal boundaries, which affects the sensor’s ability to detect refractive index changes at the metal–dielectric interface. To investigate this further, surface sensitivity characterization is necessary, as the sensor’s response to bulk refractive index changes provides only volumetric information about the sensing probe. Since detecting receptor/analyte binding involves changes in the local refractive index, it is crucial to evaluate the effect of variations in the immediate environment adjacent to the plasmonic transducer (within a few nanometers) to fully understand the sensor’s performance.
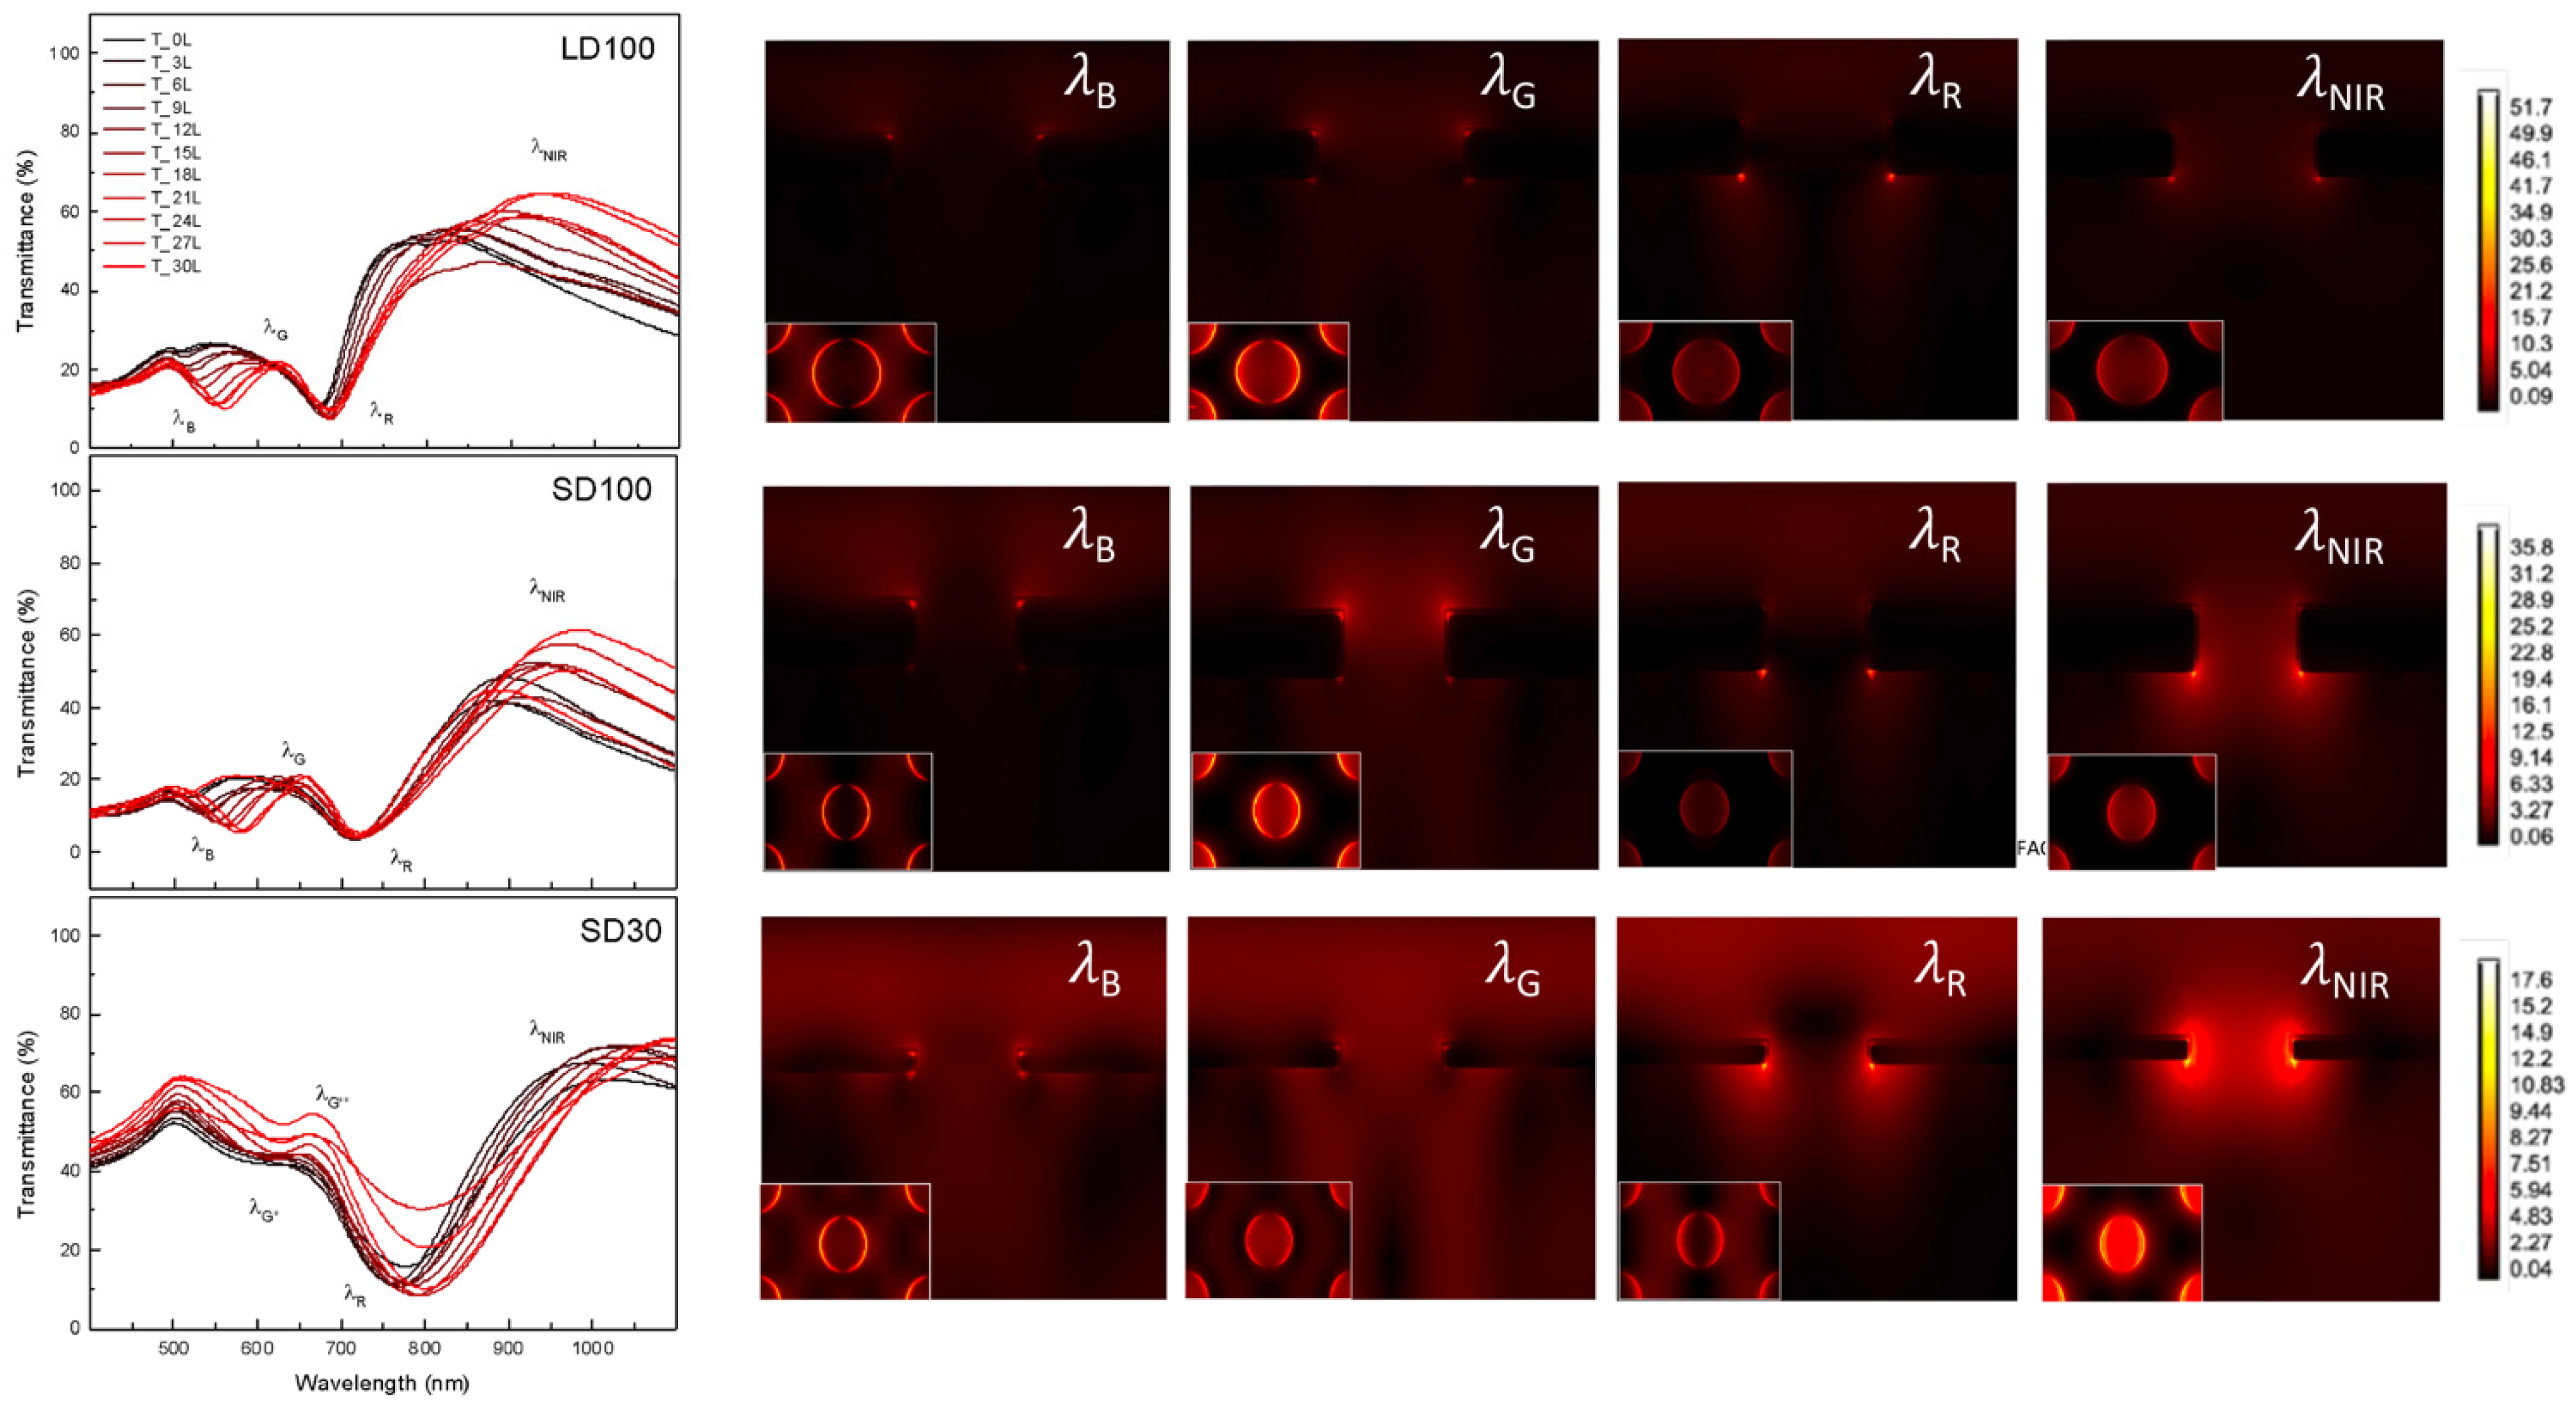
For this purpose, 30 individual adlayers of polyelectrolytes were applied as surface coatings, as previously described, and the transmittance spectra of the analyzed samples were recorded in air every three layers. The resulting transmission spectra are shown in the left column of Figure 5.
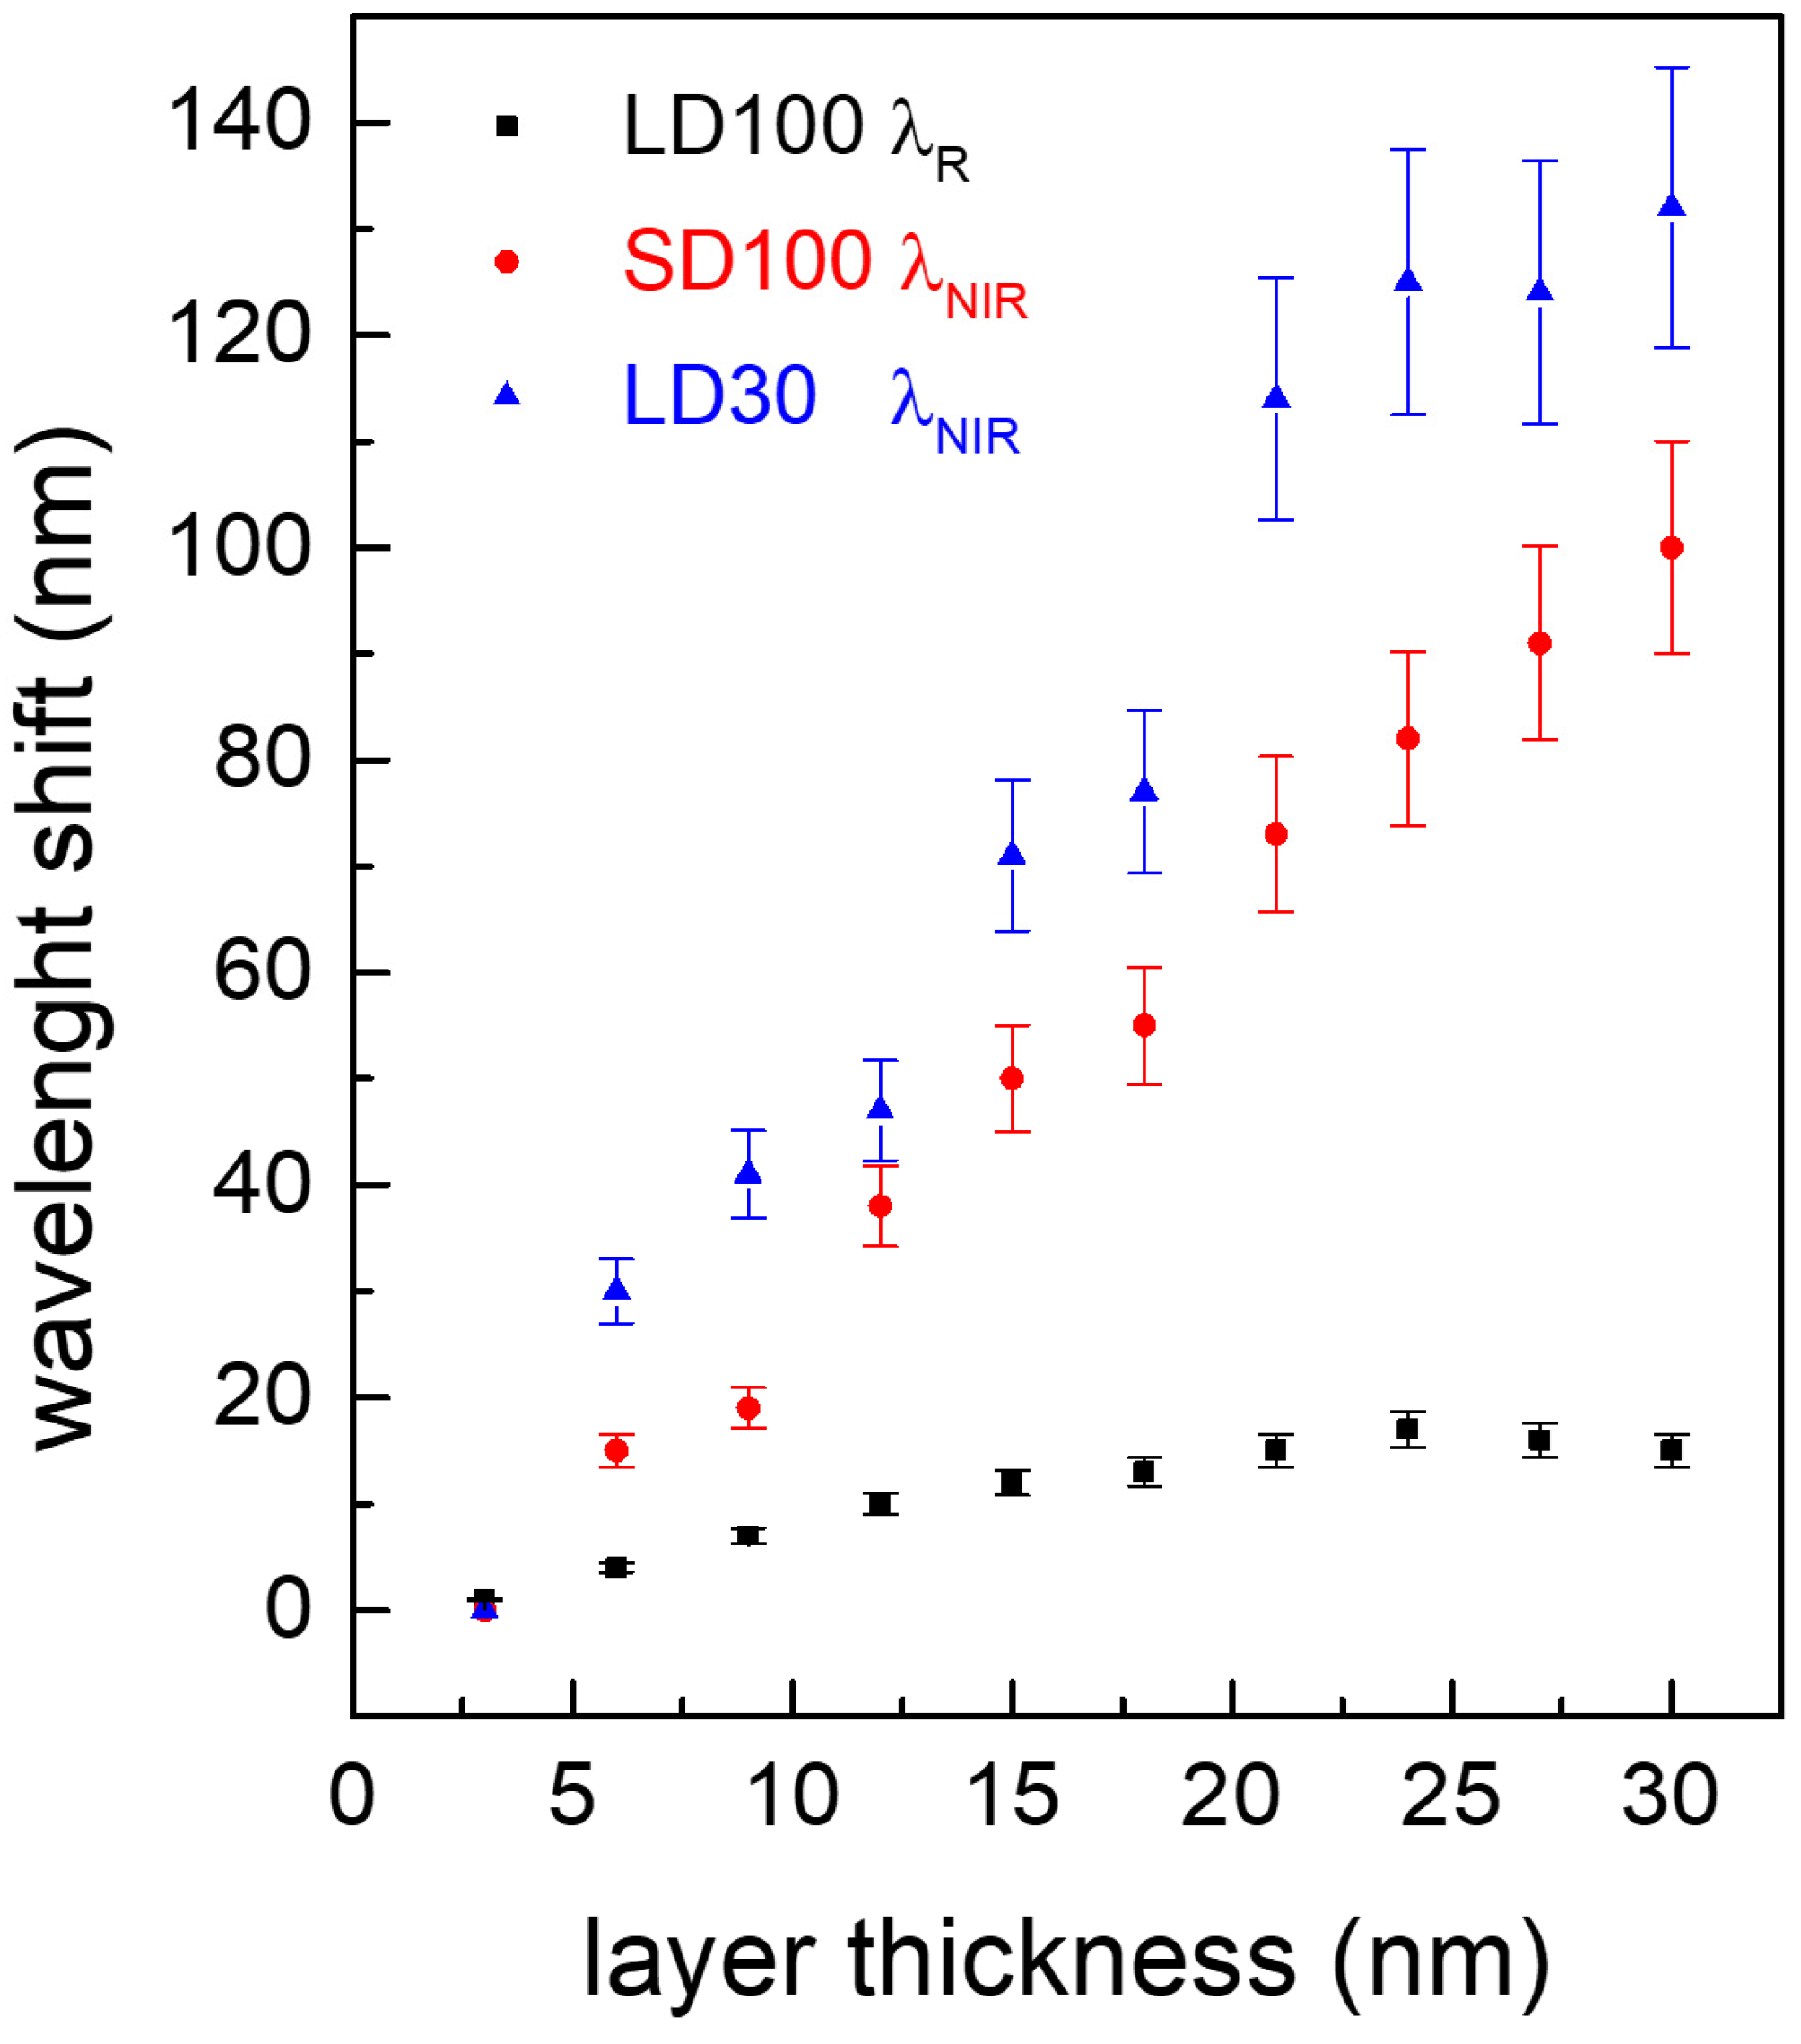
A noticeable redshift is observed with the increasing number of adlayers, with each spectral feature exhibiting different behavior. Surface sensitivity is reported in the bottom row of Table 1. The calculation was performed from the linear portion of the calibration curves, corresponding primarily to the initial layers. These values were normalized to the refractive index variation Δn (accordingly to Equation (4)), determined by the difference between the refractive index of air and that of the polyelectrolytes. Complete calibration curves for representative samples are shown in Figure 6. As shown, LD100 samples, with a resonance labeled as R, demonstrates relatively low sensitivity to local refractive index changes across the full range of investigated coating thicknesses. In contrast, the resonances observed for the LD30 and SD100 samples, which are in the near-infrared (NIR) region, show a very high surface sensitivity. In close proximity to the sample (within 20 nm), there is a more pronounced spectral shift as the overlayer thickness increases; beyond 20 nm, the resonance shift with additional polyelectrolyte layers becomes more modest. The variation in the LD30 sample attenuates more significantly compared to the SD100 sample, which displays a more consistent trend. This difference can be attributed to the more localized nature of the NIR mode in the LD30 sample relative to the same mode in the SD100 sample.
This behavior supports the hypothesis that plasmonic modes supported by holed metal films in the NIR have a hybrid nature, with surface plasmon polaritons (SPPs) significantly influencing their optical behavior [49,50]. For these modes, electromagnetic fields can extend from the metal surface into the surrounding dielectric medium for hundreds of nanometers, whereas localized pure plasmonic modes typically exhibit electromagnetic field decay lengths of just a few nanometers.
This hypothesis finds strong support in numerical simulations depicting the distribution of the EM fields for the different spectral features of interest, as shown in Figure 5 from both lateral and top views. Experimental results consistently show that spectral features displaying a distinct and concentrated distribution of the EM field exhibit superior performance in terms of surface sensitivity. According to Table 1, the highest surface sensitivity value, (10.0 ± 0.7) RIU−1, was achieved at the λNIR wavelength of the SD30 sample. The sensing performance achieved with the investigated Au nanostructures rivals the literature findings for comparable arrangements employing different metals or more complex geometries, underscoring the remarkable capabilities of the proposed simple design for chemo-biosensing purposes [51,52,53,54]. The corresponding EM field distribution, calculated at this wavelength (Figure 5, last image on the right), confirms its distinct localization and amplification at the edges and inside the hole. Conversely, much lower or negligible values were observed at shorter wavelengths for other resonances within the same sample.
In general, it is evident that greater localization and amplification of the EM fields at the upper interface between the metal and polyelectrolytes correspond to higher surface sensitivity values. There is a clear correlation between the relative intensity of the electric field and the sensitivity value. For example, the strongly localized field distribution at λNIR in the SD30 sample (Figure 5) corresponds to the highest surface sensitivity value.
Conversely, at wavelengths where the electric fields are poorly localized and more diffused (such as λB in LD100 or λG in SD30, Figure 5), or when localization occurs at the lower interface between the metal and glass (such as λR in LD100 and SD100, Figure 5), the corresponding surface sensitivity values are negligible (see Table 1). As demonstrated earlier for RIS, thicker samples exhibit similar functional behavior also in terms of surface sensitivity values (Table 1), regardless of diameter size. This similarity is also evident in the EM field distributions (Figure 5, first two lines). Figure 7 presents histograms summarizing the bulk and surface sensitivity results for all investigated samples, offering a clear overview of the sensing performance related to each spectral feature in the transmittance spectra. This allows for a quick comparison between resonances within the same sample and across different samples.
As mentioned earlier, thicker samples (LD100 and SD100) exhibit very similar behavior in terms of both bulk and surface sensitivities, regardless of the diameter size, as shown by the comparison of the first two graphs on the left. This indicates that for these samples, the optical and functional behavior is primarily determined by surface propagating modes, which are related to the periodicity of the array rather than the diameter size. In contrast, thinner samples display different properties. Firstly, a redshift can be observed in the SD samples compared to the thicker ones. Additionally, thicker samples show more pronounced λG and λNIR intensity maxima (Figure 3a,b) compared to thinner samples. This leads to a more significant intensity variation of these peaks as the refractive index changes, resulting in the λNIR resonance displaying notably similar values of both bulk and surface sensitivity in the thicker samples (see Table 1). Furthermore, this suggests that variations in diameter for such structures have a significant impact on these resonances [55].
The histogram for the thinner sample family (SD30) (Figure 7, right) reveals completely different sensing characteristics compared to the other two sample families. The near-infrared resonance (λNIR) exhibits a very high surface sensitivity and, simultaneously, a negligible RIS value within the investigated refractive index range.
In contrast, the spectral features λB and λG demonstrate significant volumetric RIS values but negligible surface sensitivity. This behavior suggests that these resonances can be used to detect binding events that do not occur directly on the metal surface, such as when a relatively thick functional biolayer is present, when analyzing cell membranes in real time while immersed in their culture media, or in refractometric sensors used outside the realm of biosensing.
This approach, which combines numerical and experimental results, helps identify the optimal applications for the investigated transducers. The functional properties of thicker metal nanohole transducers suggest that, in addition to sensing bulk refractive index changes (e.g., in refractometric gas sensors [56]), they are well suited for detecting and monitoring the growth of large biomolecules (e.g., bacteria, viruses [57,58,59]) when appropriate recognition layers are anchored onto the metal surfaces. The long dielectric-probing field characteristic of these samples ensures proper overlap between the analyte-receptor volume and the evanescent sensing field. This advantage can also be exploited in analytical strategies that require the use of a second or third labeled element binding to a previously captured analyte for sensitive detection (e.g., fluorescent-tagged antibodies, Au nanoparticles, or enzymes [60]).
Monitoring tissues and intracellular activities or secretions can also benefit from the properties of thick metal nanohole transducers. In this context, alongside spectroscopic experimental readouts, innovative imaging approaches can provide multiple types of information, complementing traditional confocal imaging configurations [61,62,63].
A critical aspect to consider is the potential background interference from the sampled matrix containing the analytes. This issue can arise when analyzing complex matrices such as serum, blood, or cell lysate. However, it can be mitigated by selecting appropriate surface treatments or sampling strategies [64,65].
In contrast, thinner metal nanohole surfaces, with their more confined field localization, make these transducers more sensitive to surface refractive index variations and less susceptible to background interference. The strong field localization enables the sensitive detection of very thin layers and small biomolecules (e.g., nucleotides, aptamers [66,67,68]), even at low concentrations, reducing noise from environmental effects such as changes in buffer composition and temperature.
Surface-enhanced processes, including surface-enhanced Raman scattering (SERS) and surface-enhanced fluorescence spectroscopy, can also find optimal application with these types of transducers [41,69].

4. Conclusions

Gold nanohole arrays were fabricated using a straightforward combination of nanosphere lithography, reactive ion etching, and e-beam deposition techniques. By varying the metal thickness and hole diameter size, their far- and near-field optical properties were investigated through both numerical and experimental approaches. Multiple spectral features, visible as dips and peaks in the transmittance spectrum, can be easily adjusted in intensity, shape, and position by modifying the array geometry or measurement configuration, due to the different plasmonic modes excited by incident light at metal-dielectric interfaces and their coupling.
The optical properties of these arrays were also explored from a functional perspective, focusing on both surface and volumetric refractive index sensitivities. The remarkable results obtained (10.0 ± 0.7) RIU−1 and 400 nm/RIU, which make the optimized transducers suitable for a wide range of sensing applications well surpassing performances reported in the recent literature for similar metal arrangements. Furthermore, near-field information on the distribution and propagation length of the enhanced plasmonic field within the probed environment helped identify the optimal transducer for various analytical challenges. This can serve as a valuable guide for scientists engaging in biosensing investigations using these plasmonic probes.

Supplementary Materials

The following supporting information can be downloaded at: https://www.mdpi.com/article/10.3390/chemosensors12080157/s1, Figure S1: Calibration curves relative to bulk refractive index changes at the metal-dielectric interfaces for the three class of samples. Related RIS results are reported in Table 1.

Author Contributions

Conceptualization and methodology, D.L. and M.G.M.; formal analysis, D.L. and A.C.; software and validation, A.C.; investigation, A.C. and D.L.; resources and data curation, D.L.; writing—original draft preparation, D.L.; writing—review and editing, M.G.M.; visualization, R.R and M.G.M.; supervision, R.R.; project administration and funding acquisition, M.G.M. All authors have read and agreed to the published version of the manuscript.

Funding

Ministero dell’Università e della Ricerca—PRIN 2022 PNRR: Prot. P2022MNPZ8.

Institutional Review Board Statement

Not applicable.

Informed Consent Statement

Not applicable.

Data Availability Statement

The raw data supporting the conclusions of this article will be made available by the authors on request.

Acknowledgments

Authors are grateful to Enrico Melissano, Pasquale Creti’, and Adriana Campa who performed the metal deposition and oxygen plasma etching in the clean room facilities. Thanks also to Giovanni Montagna for technical support during functional experiments.

Conflicts of Interest

The authors declare no conflict of interest.

References

  1. Zhang, X.; Li, Z.; Ye, S.; Wu, S.; Zhang, J.; Cui, L.; Li, A.; Wang, T.; Li, S.; Yang, B. Elevated Ag Nanohole Arrays for High Performance Plasmonic Sensors Based on Extraordinary Optical Transmission. J. Mater. Chem. 2012, 22, 8903–8910. [Google Scholar] [CrossRef]
  2. Atwater, H.A.; Polman, A. Plasmonics for Improved Photovoltaic Devices. Nat. Mater. 2010, 9, 205–213. [Google Scholar] [CrossRef] [PubMed]
  3. Sun, L.B.; Hu, X.L.; Zeng, B.; Wang, L.S.; Yang, S.M.; Tai, R.Z.; Fecht, H.J.; Zhang, D.X.; Jiang, J.Z. Effect of Relative Nanohole Position on Color Purity of Ultrathin Plasmonic Subtractive Colour Filters. Nanotechnology 2015, 26, 305204. [Google Scholar] [CrossRef]
  4. Mahani, F.F.; Mokhtari, A.; Mehran, M. Dual Mode Operation, Highly Selective Nanohole Array-based Plasmonic Colour Filters. Nanotechnology 2017, 28, 385203. [Google Scholar] [CrossRef] [PubMed]
  5. Yokogawa, S.; Burgos, S.P.; Atwater, H.A. Plasmonic Color Filters for CMOS Image Sensor Applications. Nano Lett. 2012, 12, 4349–4354. [Google Scholar] [CrossRef] [PubMed]
  6. Li, H.; Xu, S.; Wang, H.; Gu, Y.; Lombardi, J.R.; Xu, W. Active-Tuned Plasmonic Angle Modulator of Light Beams for Potential Application of 3D Display. ACS Photonics 2014, 1, 677–682. [Google Scholar] [CrossRef]
  7. Sannomiya, T.; Scholder, O.; Jefimovs, K.; Hafner, C.; Dahlin, A.B. Investigation of Plasmon Resonances in Metal Films with Nanohole Arrays for Biosensing Applications. Small 2011, 7, 1653–1663. [Google Scholar] [CrossRef] [PubMed]
  8. Ye, S.; Zhang, X.; Chang, L.; Wang, T.; Li, Z.; Zhang, J.; Yang, B. High-Performance Plasmonic Sensors Based on Two-Dimensional Ag Nanowell Crystals. Adv. Opt. Mater. 2014, 2, 779–787. [Google Scholar] [CrossRef]
  9. Zheng, P.; Cushing, S.K.; Suri, S.; Wu, N. Tailoring Plasmonic Properties of Gold Nanohole Arrays for Surface-Enhanced Raman Scattering. Phys. Chem. Chem. Phys. 2015, 17, 21211–21219. [Google Scholar] [CrossRef]
  10. Wang, Y.; Wu, L.; Wong, T.I.; Bauch, M.; Zhang, Q.; Zhang, J.; Liu, X.; Zhou, X.; Bai, P.; Dostalek, J.; et al. Directional Fluorescence Emission co-Enhanced by Localized and Propagating Surface Plasmons for Biosensing. Nanoscale 2016, 8, 8008–8016. [Google Scholar] [CrossRef]
  11. Im, H.; Lesuffleur, A.; Lindquist, N.C.; Oh, S.-H. Plasmonic Nanoholes in a Multichannel Microarray Format for Parallel Kinetic Assays and Differential Sensing. Anal. Chem. 2009, 81, 2854–2859. [Google Scholar] [CrossRef] [PubMed]
  12. Pang, L.; Hwang, G.M.; Slutsky, B.; Fainman, Y. Spectral Sensitivity of Two-Dimensional Nanohole Array Surface Plasmon Polariton Resonance Sensor. Appl. Phys. Lett. 2007, 91, 123112. [Google Scholar] [CrossRef]
  13. Stark, P.R.H.; Halleck, A.E.; Larson, D.N. Short Order Nanohole Arrays in Metals for Highly Sensitive Probing of Local Indices of Refraction as the Basis for a Highly Multiplexed Biosensor Technology. Methods 2005, 37, 37–47. [Google Scholar] [CrossRef] [PubMed]
  14. Rindzevicius, T.; Alaverdyan, Y.; Käll, M.; Murray, W.A.; Barnes, W.L. Long-Range Refractive Index Sensing Using Plasmonic Nanostructures. J. Phys. Chem. C 2007, 111, 11806–11810. [Google Scholar] [CrossRef]
  15. Correia-Ledo, D.; Gibson, K.F.; Dhawan, A.; Couture, M.; Vo-Dinh, T.; Graham, D.; Masson, J.F. Assessing the Location of Surface Plasmons Over Nanotriangle and Nanohole Arrays of Different Size and Periodicity. J. Phys. Chem. C 2012, 116, 6884–6892. [Google Scholar] [CrossRef] [PubMed]
  16. Gibson, K.F.; Correia-Ledo, D.; Couture, M.; Grahama, D.; Masson, J.-F. Correlated AFM and SERS Imaging of the Transition from Nanotriangle to Nanohole Arrays. Chem. Commun. 2011, 47, 3404–3406. [Google Scholar] [CrossRef] [PubMed]
  17. Murray-Méthot, M.P.; Mathieu Ratel, M.; Masson, J.-F. Optical Properties of Au, Ag, and Bimetallic Au on Ag Nanohole Arrays. J. Phys. Chem. C 2010, 114, 8268–8275. [Google Scholar] [CrossRef]
  18. Murray-Methot, M.-P.; Menegazzo, N.; Masson, J.-F. Analytical and Physical Optimization of Nanohole-Array Sensors Prepared by Modified Nanosphere Lithography. Analyst 2008, 133, 1714–1721. [Google Scholar] [CrossRef] [PubMed]
  19. Sharpe, J.C.; Mitchell, J.C.; Lin, L.; Sedoglavich, N.; Blaikie, R.J. Gold Nanohole Array Substrates as Immunobiosensors. Anal. Chem. 2008, 80, 2244–2249. [Google Scholar] [CrossRef]
  20. Zhu, X.; Cao, N.; Thibeault, B.J.; Pinsky, B.; Yanik, A.A. Mechanisms of Fano-Resonant Biosensing: Mechanical Loading of Plasmonic Oscillators. Opt. Commun. 2020, 469, 125780. [Google Scholar] [CrossRef]
  21. Schwind, M.; Kasemo, B.; Zorić, I. Localized and Propagating Plasmons in Metal Films with Nanoholes. Nano Lett. 2013, 13, 1743–1750. [Google Scholar] [CrossRef] [PubMed]
  22. Schmidt, T.M.; Frederiksen, M.; Bochenkov, V.; Sutherland, D.S. Exploring Plasmonic Coupling in Hole-Cap Arrays. Beilstein J. Nanotechnol. 2015, 6, 1–10. [Google Scholar] [CrossRef] [PubMed]
  23. Bochenkov, V.E.; Frederiksen, M.; Sutherland, D.S. Enhanced Refractive Index Sensitivity of Elevated Shortrange Ordered Nanohole Arrays in Optically thin Plasmonic Au Films. Opt. Express 2013, 21, 14763–14770. [Google Scholar] [CrossRef] [PubMed]
  24. Junesch, J.; Emilsson, G.; Xiong, K.; Kumar, S.; Sannomiya, T.; Pace, H.; Vörös, J.; Oh, S.H.; Bally, M.; Dahlin, A.B. Location-Specific Nanoplasmonic Sensing of Biomolecular Binding to Lipid Membranes with Negative Curvature. Nanoscale 2015, 7, 15080–15085. [Google Scholar] [CrossRef] [PubMed]
  25. Rodrigo, S.G.; Martín-Moreno, L.; Nikitin, A.Y.; Kats, A.V.; Spevak, I.S.; García-Vidal, F.J. Extraordinary Optical Transmission Through Hole Arrays in Optically Thin Metal Films. Opt. Lett. 2009, 34, 4–6. [Google Scholar] [CrossRef] [PubMed]
  26. Braun, J.; Gompf, B.; Kobiela, G.; Dressel, M. How Holes Can Obscure the View: Suppressed Transmission through an Ultrathin Metal Film by a Subwavelength Hole Array. Phys. Rev. Lett. 2009, 103, 203901. [Google Scholar] [CrossRef] [PubMed]
  27. Spevak, I.S.; Nikitin, A.Y.; Bezuglyi, E.V.; Levchenko, A.; Kats, A.V. Resonantly Suppressed Transmission and Anomalously Enhanced Light Absorption in Periodically Modulated Ultrathin Metal Films. Phys. Rev. B 2009, 79, 161406. [Google Scholar] [CrossRef]
  28. Yoon, J.W.; Jung, M.J.; Song, S.H.; Magnusson, R. Analytic Theory of the Resonance Properties of Metallic Nanoslit Arrays. IEEE J. Quantum Electron. 2012, 48, 852–861. [Google Scholar] [CrossRef]
  29. Yoon, J.W.; Magnusson, R. Fano Resonance Formula for Lossy Two-Port Systems. Opt. Express 2013, 21, 17751–17759. [Google Scholar] [CrossRef]
  30. Liu, M.; Song, Y.; Zhang, Y.; Wang, X.; Jin, C. Mode Evolution and Transmission Suppression in a Perforated Ultrathin Metallic Film with a Triangular Array of Holes. Plasmonics 2012, 7, 397–410. [Google Scholar] [CrossRef]
  31. Valsecchi, C.; Gomez Armas, L.E.; Weber de Menezes, J. Large Area Nanohole Arrays for Sensing Fabricated by Interference Lithography. Sensors 2019, 19, 2182. [Google Scholar] [CrossRef]
  32. Larson, S.; Carlson, D.; Ai, B.; Zhao, Y. The Extraordinary Optical Transmission and Sensing Properties of Ag/Ti Composite Nanohole Arrays. Phys. Chem. Chem. Phys. 2019, 21, 3771–3780. [Google Scholar] [CrossRef]
  33. Martin-Moreno, L.; Garcia-Vidal, F.J.; Lezec, H.J.; Pellerin, K.M.; Thio, T.; Pendry, J.B.; Ebbesen, T.W. Theory of Extraordinary Optical Transmission through Subwavelength Hole Arrays. Phys. Rev. Lett. 2001, 86, 1114–1117. [Google Scholar] [CrossRef] [PubMed]
  34. Cesaria, M.; Colombelli, A.; Lospinoso, D.; Taurino, A.; Melissano, E.; Rella, R.; Manera, M.G. Long-and Short-Range Ordered Gold Nanoholes as Large-Area Optical Transducers in Sensing Applications. Chemosensors 2019, 7, 13. [Google Scholar] [CrossRef]
  35. Colombelli, A.; Lospinoso, D.; Rella, R.; Manera, M.G. Shape Modulation of Plasmonic Nanostructures by Unconventional Lithographic Technique. Nanomaterials 2022, 12, 547. [Google Scholar] [CrossRef]
  36. Decher, G.; Hong, J.-D.; Schmitt, J. Buildup of Ultrathin Multilayer Films by a Self-Assembly Process: III. Consecutively Alternating Adsorption of Anionic and Cationic Polyelectrolytes on Charged Surfaces. Thin Solid Films 1992, 210–211, 831–835. [Google Scholar] [CrossRef]
  37. Kedem, O.; Tesler, A.B.; Vaskevich, A.; Rubinstein, I. Sensitivity and Optimization of Localized Surface Plasmon Resonance Transducers. ACS Nano 2011, 5, 748–760. [Google Scholar] [CrossRef]
  38. Gandra, N.; Portz, C.; Tian, L.; Tang, R.; Xu, B.; Achilefu, S.; Singamaneni, S. Probing Distance-Dependent Plasmon-Enhanced Near-Infrared Fluorescence Using Polyelectrolyte Multilayers as Dielectric Spacers. Angew. Chem. Int. Ed. 2014, 53, 866–870. [Google Scholar] [CrossRef]
  39. Larson, S.; Zhao, Y. Localized Surface Plasmonic Resonance and Sensing Properties of Ag–MgF2 Composite Nanotriangles. J. Phys. Chem. C 2018, 122, 7374–7381. [Google Scholar] [CrossRef]
  40. Couture, M.; Liang, Y.; Poirier Richard, H.-P.; Faid, R.; Peng, W.; Masson, J.-F. Tuning the 3D Plasmon Field of Nanohole Arrays. Nanoscale 2013, 5, 12399. [Google Scholar] [CrossRef]
  41. Lospinoso, D.; Colombelli, A.; Lomascolo, M.; Rella, R.; Manera, M.G. Self-Assembled Metal Nanohole Arrays with Tunable Plasmonic Properties for SERS Single-Molecule Detection. Nanomaterials 2022, 12, 380. [Google Scholar] [CrossRef] [PubMed]
  42. Nishida, M.; Hatakenaka, N.; Kadoya, Y. Multipole Surface Plasmons in Metallic Nanohole Arrays. Phys. Rev. B 2005, 91, 235406. [Google Scholar] [CrossRef]
  43. Jonsson, M.P.; Dahlin, A.B. Nanoplasmonic Biosensing with Focus on Short-range Ordered Nanoholes in Thin Metal Films. Biointerphases 2008, 3, FD30–FD40. [Google Scholar] [CrossRef] [PubMed]
  44. Rodrigo, S.G.; de León-Pérez, F.; Martín-Moreno, L. Extraordinary Optical Transmission: Fundamentals and Applications. Proc. IEEE 2016, 104, 2288–2306. [Google Scholar] [CrossRef]
  45. Malinsky, M.D.; Kelly, K.L.; Schatz, G.C.; Van Duyne, R.P. Chain Length Dependence and Sensing Capabilities of the Localized Surface Plasmon Resonance of Silver Nanoparticles Chemically Modified with Alkanethiol Self-Assembled Monolayers. J. Am. Chem. Soc. 2001, 123, 1471–1482. [Google Scholar] [CrossRef]
  46. Jung, L.S.; Campbell, C.T.; Chinowsky, T.M.; Mar, M.N.; Yee, S.S. Quantitative Interpretation of the Response of Surface Plasmon Resonance Sensors to Adsorbed Films. Langmuir 1998, 14, 5636–5648. [Google Scholar] [CrossRef]
  47. Haes, A.J.; Van Duyne, R.P. A Nanoscale Optical Biosensor: Sensitivity and Selectivity of an Approach Based on the Localized Surface Plasmon Resonance Spectroscopy of Triangular Silver Nanoparticles. J. Am. Chem. Soc. 2002, 124, 10596–10604. [Google Scholar] [CrossRef]
  48. Kang, E.S.H.; Ekinge, H.; Jonsson, M.P. Plasmonic Fanoholes: On the Gradual Transition from Suppressed to Enhanced Optical Transmission through Nanohole Arrays in Metal Films of Increasing Film Thickness. Opt. Mater. Express 2019, 9, 1404–1415. [Google Scholar] [CrossRef]
  49. Zhang, Z.; Zhao, F.; Gao, R.; Jao, C.-Y.; Ma, C.; Li, J.; Li, X.; Guan, B.-O.; Cetin, A.E.; Chen, K. Rayleigh Anomaly-Enabled Mode Hybridization in Gold Nanohole Arrays by Scalable Colloidal Lithography for Highly-Sensitive Biosensing. Nanophotonics 2022, 11, 507–517. [Google Scholar] [CrossRef]
  50. Haes, A.J.; Zou, S.; Schatz, G.C.; Van Duyne, R.P. A Nanoscale Optical Biosensor:  The Long Range Distance Dependence of the Localized Surface Plasmon Resonance of Noble Metal Nanoparticles. J. Phys. Chem. B 2004, 108, 109–116. [Google Scholar] [CrossRef]
  51. Michieli, N.; Kalinic, B.; Scian, C.; Cesca, T.; Mattei, G. Optimal Geometric Parameters of Ordered Arrays of Nanoprisms for Enhanced Sensitivity in Localized Plasmon Based Sensors. Biosens. Bioelectron. 2015, 65, 346–353. [Google Scholar] [CrossRef] [PubMed]
  52. Vala, M.; Ertsgaard, C.T.; Wittenberg, N.J.; Oh, S.H. Plasmonic sensing on symmetric nanohole arrays supporting high-Q hybrid modes and reflection geometry. ACS Sens. 2019, 4, 3265–3274. [Google Scholar] [CrossRef] [PubMed]
  53. Tobing, L.Y.; Soehartono, A.M.; Mueller, A.D.; Yong, K.T.; Fan, W.; Zhang, D.H. Hybridized surface lattice modes in intercalated 3-disk plasmonic crystals for high figure-of-merit plasmonic sensing. Nanoscale 2021, 13, 4092–4102. [Google Scholar] [CrossRef] [PubMed]
  54. Agrawal, A.K.; Suchitta, A.; Dhawan, A. Nanostructured plasmonic chips employing nanopillar and nanoring hole arrays for enhanced sensitivity of SPR-based biosensing. RSC Adv. 2022, 12, 929–938. [Google Scholar] [CrossRef] [PubMed]
  55. Genet, C.; van Exter, M.P.; Woerdman, J.P. Fano-Type Interpretation of Red Shifts and Red Tails in Hole Array Transmission Spectra. Opt. Commun. 2003, 225, 331–336. [Google Scholar] [CrossRef]
  56. Lindquist, N.C.; Turner, M.A.; Heppner, B.P. Template Fabricated Plasmonic Nanoholes on Analyte-Sensitive Substrates for Real-Time Vapor Sensing. RSC Adv. 2014, 4, 15115. [Google Scholar] [CrossRef]
  57. Kee, J.S.; Lim, S.Y.; Perera, A.P.; Zhang, Y.; Park, M.K. Plasmonic Nanohole Arrays for Monitoring Growth of Bacteria and Antibiotic Susceptibility Test. Sens. Actuators B 2013, 182, 576–583. [Google Scholar] [CrossRef]
  58. Cruz, J.G.; Nair, S.; Manjarrez-Hernandez, A.; Gavilanes-Parra, S.; Ascanio, G.; Escobedo, C. Cost-Effective Flow-through Nanohole Array-based Biosensing Platform for the Label-Free Detection of Uropathogenic E. coli in Real Time. Biosens. Bioelectron. 2018, 106, 105–110. [Google Scholar] [CrossRef]
  59. Jackman, J.A.; Linardy, E.; Yoo, D.; Seo, J.; Ng, W.B.; Klemme, D.J.; Wittenberg, N.J.; Oh, S.-H.; Cho, N.-J. Plasmonic Nanohole Sensor for Capturing Single Virus-Like Particles toward Virucidal Drug Evaluation. Small 2016, 12, 1159–1166. [Google Scholar] [CrossRef]
  60. Belushkin, A.; Yesilkoy, F.; Altug, H. Nanoparticle-Enhanced Plasmonic Biosensor for Digital Biomarker Detection in a Microarray. ACS Nano 2018, 12, 4453–4461. [Google Scholar] [CrossRef]
  61. Carcelen, M.; Vidal, V.; Franco, A.; Gomez, M.; Moreno, F.; Fernandez-Luna, J.L. Plasmonic Biosensing for Label-Free Detection of Two Hallmarks of Cancer Cells: Cell-Matrix Interaction and Cell Division. Biosensors 2022, 12, 674. [Google Scholar] [CrossRef] [PubMed]
  62. So, T.; Lee, D.; Lee, C.; Moon, G.; Eun Ha, G.; Lee, H.; Kwak, H.; Cheong, E.; Kim, D. Superlocalized Three-Dimensional Live Imaging of Mitochondrial Dynamics in Neurons Using Plasmonic Nanohole Arrays. ACS Nano 2019, 13, 3063–3074. [Google Scholar]
  63. Li, X.; Soler, M.; Szydzik, C.; Khoshmanesh, K.; Schmidt, J.; Coukos, G.; Mitchell, A.; Altug, H. Label-Free Optofluidic Nanobiosensor Enables Real-Time Analysis of Single-Cell Cytokine Secretion. Small 2018, 14, 1800698. [Google Scholar] [CrossRef]
  64. Li, X.; Soler, M.; Özdemir, C.I.; Belushkin, A.; Yesilköy, F.; Altug, H. Plasmonic Nanohole Array Biosensor for Label-Free and Real-Time Analysis of Live Cell Secretion. Lab Chip 2017, 17, 2208–2217. [Google Scholar] [CrossRef] [PubMed]
  65. Soler, M.; Belushkin, A.; Cavallini, A.; Kebbi-Beghdadi, C.; Greub, G.; Altug, H. Multiplexed Nanoplasmonic Biosensor for One-Step Simultaneous Detection of Chlamydia Trachomatis and Neisseria Gonorrhoeae in Urine. Biosens. Bioelectron. 2017, 94, 560–567. [Google Scholar] [CrossRef] [PubMed]
  66. del Castillo, G.F.-D.; Emilsson, G.; Dahlin, A. Quantitative Analysis of Thickness and pH Actuation of Weak Polyelectrolyte Brushes. J. Phys. Chem. C 2018, 122, 27516–27527. [Google Scholar] [CrossRef]
  67. Luo, X.; Xing, Y.; Galvan, D.D.; Zheng, E.; Wu, P.; Cai, C.; Yu, Q. Plasmonic Gold Nanohole Array for Surface-Enhanced Raman Scattering Detection of DNA Methylation. ACS Sens. 2019, 4, 1534–1542. [Google Scholar] [CrossRef]
  68. Lenyk, B.; Figueroa-Miranda, G.; Pavlushko, I.; Lo, Y.; Tanner, J.A.; Offenhäusser, A.; Mayer, D. Dual-Transducer Malaria Aptasensor Combining Electrochemical Impedance and Surface Plasmon Polariton Detection on Gold Nanohole Arrays. ChemElectroChem 2020, 7, 4594–4600. [Google Scholar] [CrossRef]
  69. Saboktakin, M.; Ye, X.; Chettiar, U.K.; Engheta, N.; Murray, C.B.; Kagan, C.R. Plasmonic Enhancement of Nanophosphor Upconversion Luminescence in Au Nanohole Arrays. ACS Nano 2013, 7, 7186–7192. [Google Scholar] [CrossRef]
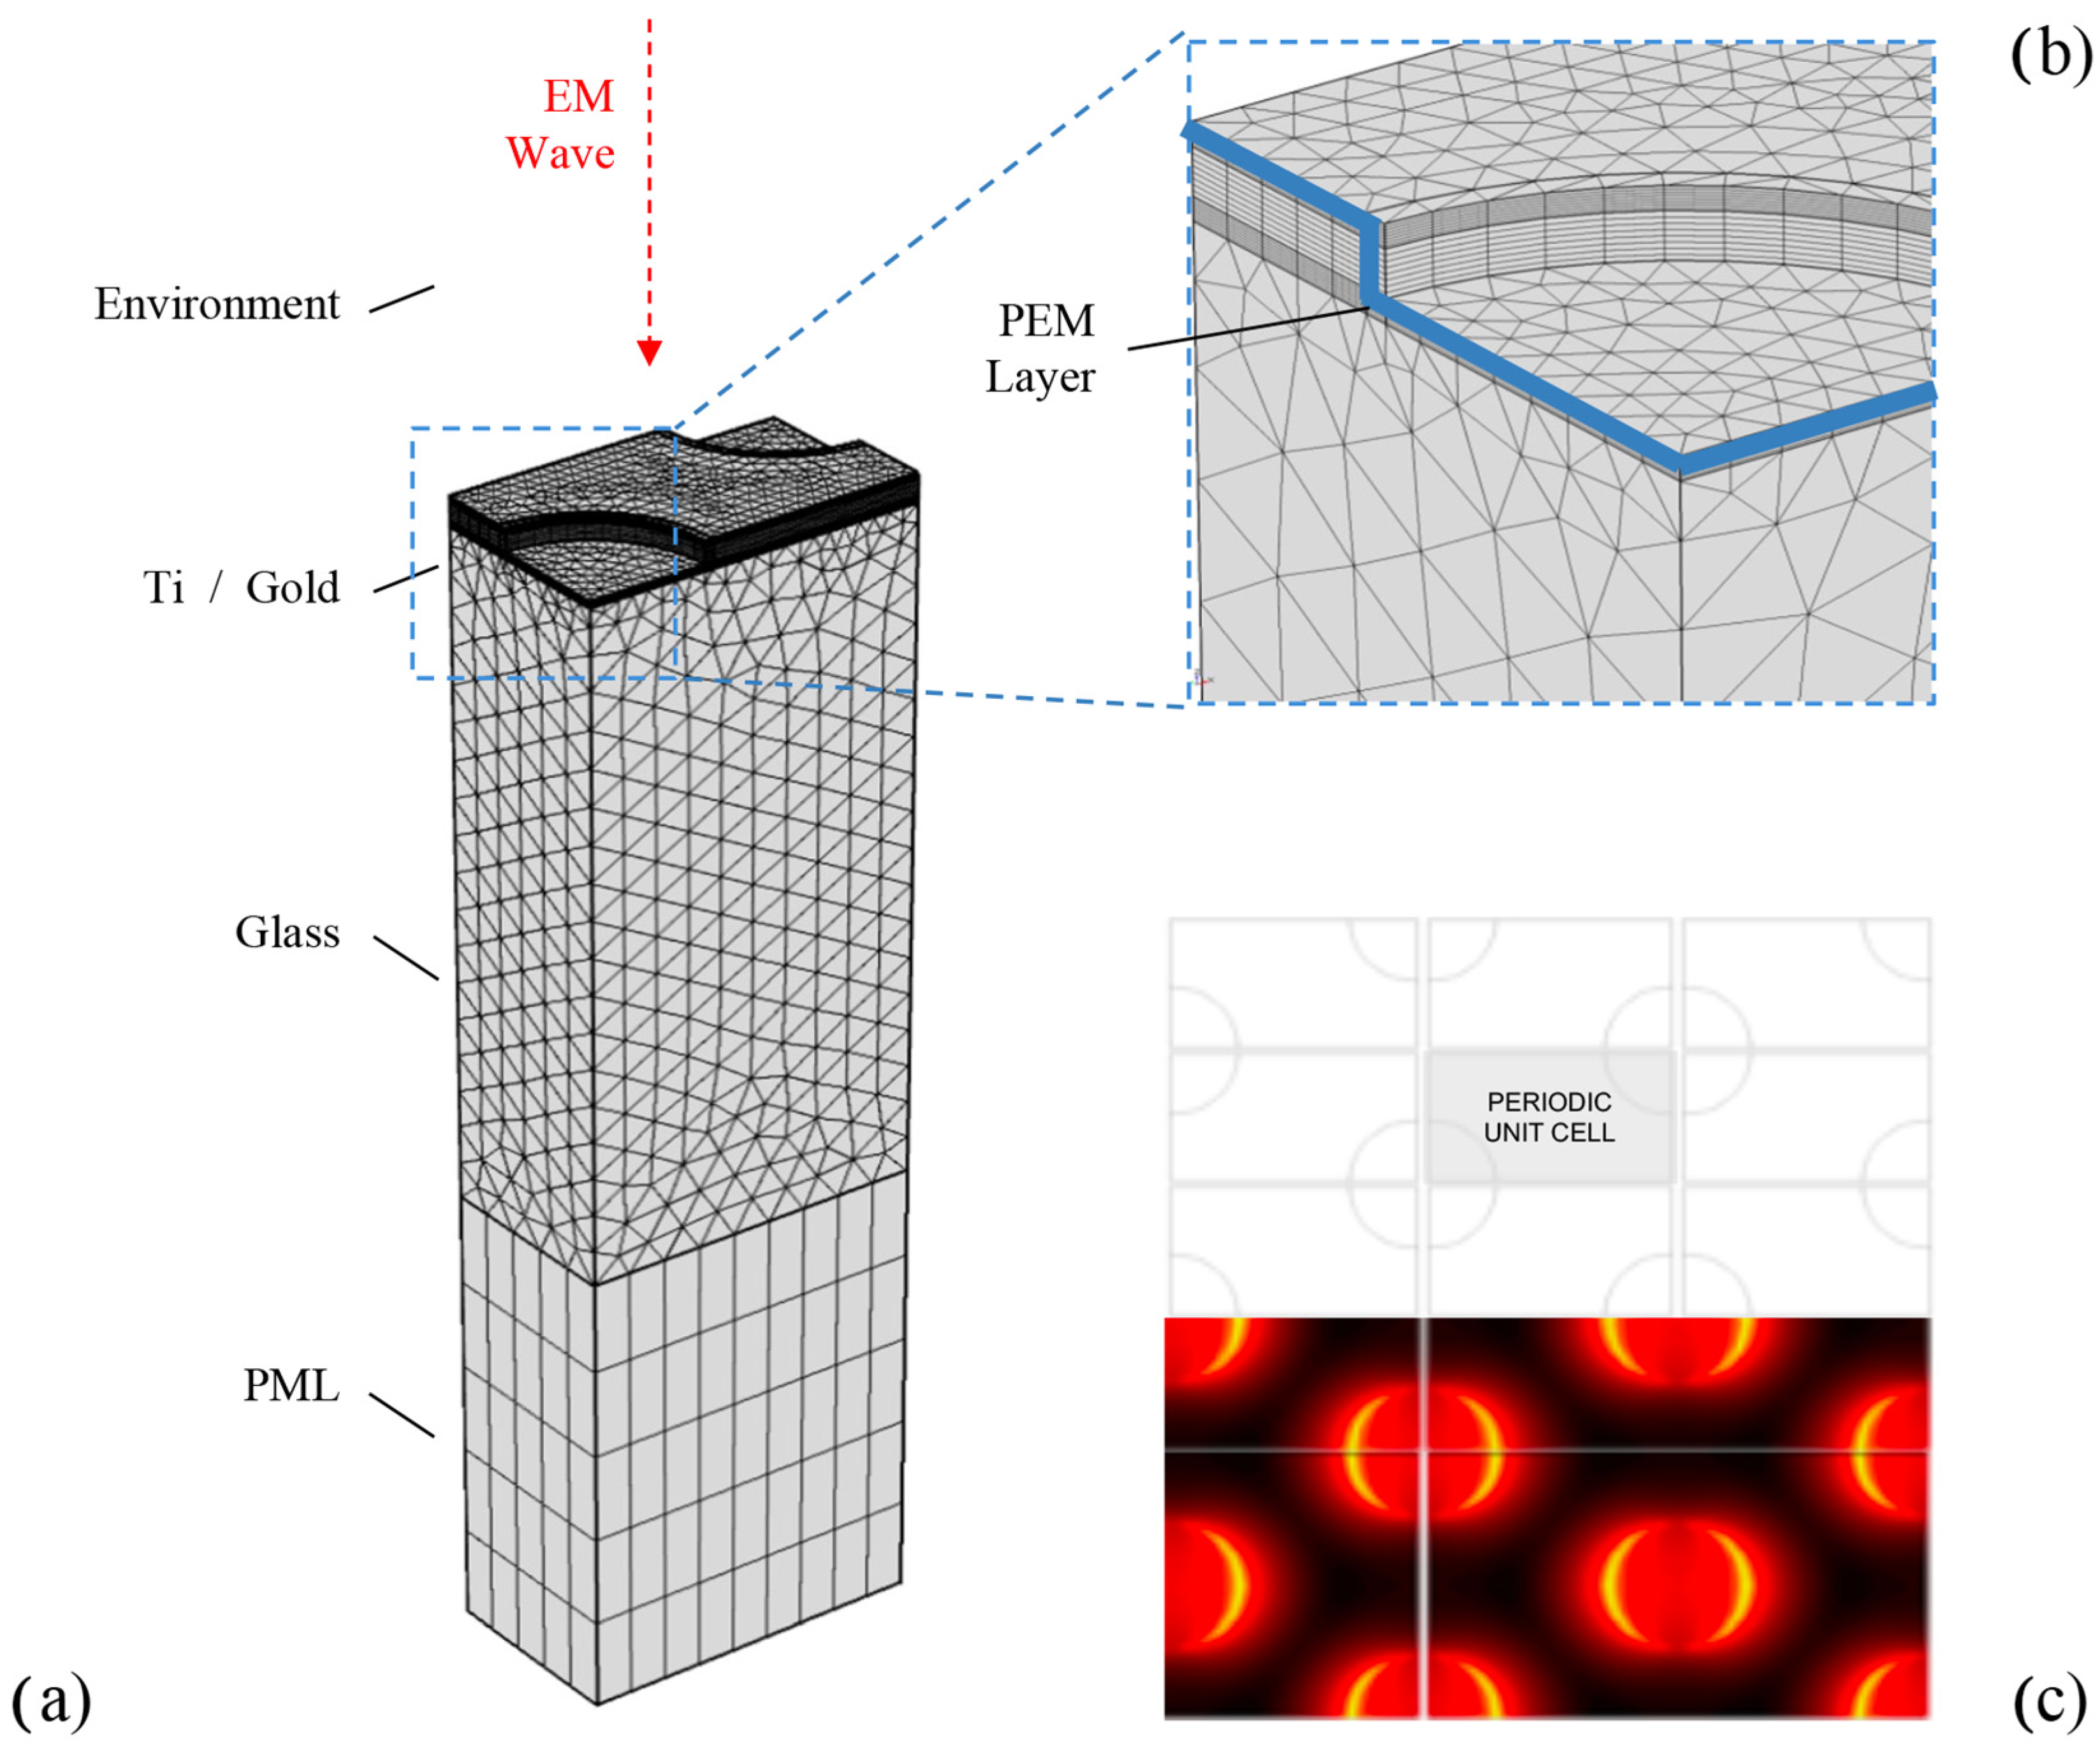
Figure 1. Geometrical domains used for the simulation of a hexagonal array of nanoholes in thin metal film (a). An example of mesh element distribution and local refinement for the simulation of a thin polyelectrolyte layer (b) and a schematic illustration of the simulated unit cell (c).
Chemosensors 12 00157 g001
Figure 2. AFM atomic force microscopy height images of the three samples with diameters of (a) (320 ± 20) nm, (b) (230 ± 20) nm, (c) (240 ± 20) nm. In the bottom line, topographic image profiles show the corresponding height of the gold film: 100 nm (a,b) and 30 nm (c), respectively. Scale bars: 1 µm.
Chemosensors 12 00157 g002
Figure 3. Experimental (solid line) and calculated (dot line) transmittance spectra of the of nanoholes array samples in water: principal resonances are highlighted for LD100 samples in (a) for SD100 samples in (b) and for SD30samples in (c). The acronym LD stand for Larger Diameters while SD for Smaller Diameters. The different investigated thicknesses (100 and 30 nm) are reported at the end of samples names.
Chemosensors 12 00157 g003
Figure 4. Transmittance spectra of the three sample families immersed in liquids with increasing refractive index (solid lines). Dotted lines represent transmittance spectra in air. For thinner samples SD30, λB and λG spectral features present a maximum and a minimum, indicated by * and **, respectively. The magnification of the resonances exhibiting the most intense shifts are shown in the insets.
Chemosensors 12 00157 g004
Figure 5. Transmittance spectra of the typical three sample families covered with a growing number of polyelectrolyte layers: one spectrum for every three layers is reported. On the right, vertical cross sections of the local field’s distribution of the samples with an overlay of ten layers at the wavelengths of the highlighted resonances; corresponding horizontal cross sections at the metal/polyelectrolyte interface are shown in the inset.
Chemosensors 12 00157 g005
Figure 6. Examples of calibration curves for each of the three sample families: the wavelength variation of the resonances indicated in the legend is reported as the thickness of the deposited PEM varies.
Chemosensors 12 00157 g006
Figure 7. Summary histograms of the estimated RIS (y axis, left side) and surface sensitivity values (y axis, right side) at resonance wavelengths (x axis) for the three sample families examined.
Chemosensors 12 00157 g007
Table 1. Summary table of RIS and surface sensitivity for each of the four highlighted resonances of the three sample families under examination. For thinner samples SD30, λB and λG spectral features present a maximum and a minimum, indicated by * and **, respectively.
LARGE D h 100λBλGλRλNIR
Bulk sens. (nm RIU−1)410 ± 60190 ± 3016 ± 3480 ± 70
Surf. sens. (RIU−1)3.81 ± 0.176.25 ± 0.242.03 ±0.018.48 ± 0.47
SMALL D h 100λBλGλRλNIR
Bulk sens. (nm RIU−1)440 ± 65170 ± 25-450 ± 70
Surf. sens. (RIU−1)4.92 ± 0.246.27 ± 0.400.64 ± 0.527.50 ± 0.24
SMALL D h 30λBλGλRλNIR
Bulk sens. (nm RIU−1)280 ± 40 *240 ± 40 *190 ± 30-
420 ± 60 **- **
Surf. sens. (RIU−1)-1.36 ± 0.113.15 ± 0.1910.0 ± 0.7
Disclaimer/Publisher’s Note: The statements, opinions and data contained in all publications are solely those of the individual author(s) and contributor(s) and not of MDPI and/or the editor(s). MDPI and/or the editor(s) disclaim responsibility for any injury to people or property resulting from any ideas, methods, instructions or products referred to in the content.