Article

Poly(ethylene glycol) Diacrylate Hydrogels Doped with Silver Nanoparticles for Optical Sensing and Removing Hg(II) Ions from Water

1
Department of Sciences, Roma Tre University of Rome, Via della Vasca Navale 79, 00146 Rome, Italy
2
Prolabin & Tefarm S.r.l., Via dell’Acciaio, 9, 06134 Perugia, Italy
3
Department of Industrial Engineering, University of Rome Tor Vergata, Via del Politecnico 1, 00133 Rome, Italy
*
Author to whom correspondence should be addressed.
Chemosensors 2023, 11(10), 518; https://doi.org/10.3390/chemosensors11100518
Submission received: 29 August 2023 / Revised: 22 September 2023 / Accepted: 29 September 2023 / Published: 1 October 2023

Abstract

:
In this study, an innovative approach for the integration of silver nanoparticles (AgNPs) into poly(ethylene glycol) diacrylate (PEGDA) hydrogels is described. The composite material is the first in the literature where AgNPs were doped into PEGDA using photo-polymerization technique for a double function: detection and elimination of Hg(II) ions from water. The doping of AgNPs into PEGDA-based matrices was performed using a photo-polymerizable process. The Hg(II) sensing properties were explored in a concentration range from 0 to 20 mg/L. Notably, a linear dependence was observed up to 1 mg/L, accompanied by a limit of detection of 0.3 mg/L. Beyond sensing, the efficiency of the doped hydrogel in removing Hg(II) ions was also investigated and compared with an undoped PEGDA matrix. The outcome highlighted an enhanced removal efficiency of the doped material of approximately 23%. Finally, the experimental data suggested that the interaction between Hg(II) ions and the modified hydrogel adhered to the Langmuir isotherm model, which suggested that chemisorption was the driving mechanism of the adsorption of Hg(II) onto the modified hydrogel matrix.

1. Introduction

Water is an essential resource for life on earth and is necessary for the sustenance of many types of ecosystems. However, the heedless exploitation of natural resources, the rapid march of industrialization, and urban sprawl are progressively encroaching upon water quality, inflicting significant hardships upon all forms of life. While organic compounds such as dyes and pesticides can benignly degrade into harmless byproducts [1,2,3], inorganic pollutants such as heavy metal ions and metalloids amass within ecosystems, perilously endangering living organisms through various pathways [4]. Among these toxic elements, cadmium (Cd), cobalt (Co), chromium (Cr), mercury (Hg), nickel (Ni), and lead (Pb), originating from both natural sources and industrial outputs, can be easily found in water.
Mercury (Hg) is a pollutant that poses a global threat, and it was listed by the World Health Organization as one of the “10 chemicals of public health concern” [5]. Hg occurs naturally and exists in different forms: elemental (or metallic), inorganic, and organic. Furthermore, all these forms have their own toxicity [6,7]. The pollution of Hg can come from natural sources, such as volcanic activity, weathering of rocks, water movements, and biological processes, and from human activities, such as mercury-added products, manufacturing processes in which mercury or mercury compounds are used, artisanal and small-scale gold mining, and coal-fired power plants [8,9,10]. Mercury profoundly affects human physiology, inducing neurological disorders and impairing renal function. A link has also been established between infertility and elevated blood mercury levels. Manifestations of mercury poisoning encompass oral mucous membrane darkening, accompanied by chest pain, gastrointestinal harm, and mercurial stomatitis. Acute high-dose exposure is marked by external symptoms such as nail discoloration, mucous membrane corrosion, and caustic burns. Furthermore, chronic inorganic mercury exposure leads to conditions such as polyuria, proteinuria, hematuria, and anuria [11,12,13]. For these reasons, the easy detection and removal of Hg is highly needed.
Among the sensing techniques, optical sensors exploit the capacity of specific materials to modulate their properties, encompassing reflectance/transmittance [14,15,16,17], absorbance [18,19,20], and emission [21,22,23,24], when subjected to contaminants. Herein, uncomplicated and cost-effective experimental configurations, involving tools like spectrophotometers or fluorometers, serve to unravel these features; in contrast, well-established analytical methods such as atomic absorption spectroscopy, atomic emission spectroscopy, and mass spectrometry are sophisticated and financially demanding. Nanostructures like carbon quantum dots (CQDs) [25,26,27,28] and noble metal nanoparticles (NMPs) [29,30,31] take center stage in this sensor realm, capitalizing on their distinctive optical features and ease of synthesis and functionalization. Recently, these nanomaterials have been seamlessly integrated into hydrogels or solid matrices [32,33,34,35,36,37], aiming to produce economical devices fit for not only laboratory settings but also on-site applications. The alteration in optical characteristics of these nanomaterials results from chemical interactions with heavy metal ions, a phenomenon that not only facilitates sensing but also offers the potential for pollutant removal from water, culminating in the inception of dual-purpose systems combining sensing and filtration capabilities [38,39].
To our knowledge, this paper represents the first study where silver nanoparticles are doped within a polymer matrix, through the easy and rapid photo-polymerization technique, and where their function is bivalent: to synthesize both a sensor and a filter for Hg(II) ions. Indeed, in this work, silver nanoparticles (AgNPs) functionalized with 3-mercapto-1-propanesulfonic acid sodium salt (3MPS) in aqueous solution were synthesized. Subsequently, the AgNPs solution was mixed with a photo-initiator and PEGDA. The composite solution was cross-linked through UV light exposition to obtain a silver nanoparticle-doped hydrogel. Sensitivity tests towards Hg(II) ions were performed in order to calculate the efficiency of removal of the composite material and the limit of detection (LOD). Finally, the adsorption capacity (qe) of the hydrogels was investigated in the presence of Hg(II) ions. Hydrogels without AgNPs were also prepared and tested to assess and compare the qe.

2. Materials and Methods

2.1. Chemicals

Silver nitrate (AgNO3), 3-mercapto-1-propanesulfonic acid sodium salt (3MPS, 90%), sodium borohydride (NaBH4, ≥98.0%), poly (ethylene glycol) diacrylate (PEGDA700, Mn = 700, density 1.12 g/mL at 25 °C), and ethanol (>99.8%, density 0.789 g/mL at 25 °C) were purchased from Merck (Darmstadt, Germany). Table 1 lists the metal precursors employed for the selectivity tests. They were of analytical grade and were purchased from Merck (Darmstadt, Germany). They were used without further purification processes and dissolved in deionized water (18.2 MΩ•cm). The photoinitiator Irgacure 184 (Irg.184) was purchased from Ciba Specialty Chemicals.

2.2. Synthesis of Silver Nanoparticles (AgNPs-3MPS)

Silver nanoparticles were prepared following the methodology outlined in the prior literature [40]. In this process, an aqueous solution of NaBH4 was first made and then placed within an ice/water bath at a temperature of 3 °C, while subjected to intense stirring. The AgNO3 freshwater solution was gradually introduced drop by drop into the reducing agent solution. Suddenly, the capping agent (3MPS) was swiftly introduced, and the magnetic stirring was stopped. The AgNPs-3MPS colloidal solution was stored in the fridge before the further processes. A schematic representation of the synthesis is provided in Figure S1 of the Supporting Information. All the characterizations about the AgNPs-3MPS colloidal solution such as dynamic light scattering, zeta-potential, transmission electron microscopy, and X-ray photoemission spectroscopy are reported in our previous work [40].
Quantification of the concentration of AgNPs-3MPS was achieved through two distinct methodologies: 2 mL of NPs solution was dried (overnight at room temperature, 25 °C) and the remaining powder was weighted, obtaining a concentration of 6 mg/mL. The second method involved the following calculation [41,42]:
N = π   ρ   D 3 6   M N A   1600   a t o m s
where N represents the average number of atoms belonging to a nanoparticle, ρ is the density for face-centered cubic structure (fcc) silver (10.5 g/cm3) [42], D is the average diameter of nanoparticles (3.71 nm) estimated with transmission electron microscopy technique [43], M is the atomic mass of silver (107.9 g/mol), and NA is the number of atoms per mole (Avogadro’s number, 6.023 × 10²³ mol−1). The approximations of a spherical shape and a uniform fcc structure for applying Formula (1) must be conducted.
The molar concentration of the AgNPs in solution was calculated by dividing the total number of silver atoms (NT, that is, the initial amount of silver salt added to the reaction solution) with the average number of silver atoms per nanoparticles (N) according to Formula (1). V is the volume of the reaction solution in liter, and NA is Avogadro’s constant. It was assumed that the reduction from Ag(I) to silver atoms was 100% complete.
C N P s = N T N   V   N A   8 10 8 M = 80   n M

2.3. Synthesis of PEGDA/AgNPs-3MPS Hydrogels

The synthesis of hydrogels is based on a photo-crosslinking process, which was carried out by exploiting UV radiation (λ = 366 nm, MinUVIS, DESAGA company, Wiesloch, Germany). In a typical synthesis, a solution of Irg.184, ethanol, and PEGDA was prepared and stirred for 5 min, in the dark. Subsequently, AgNPs-3MPS solution was added dropwise and mixed with the previous precursor solution for 5 min. The details of the investigated compositions are reported in Table 2, where the mass of Irg.184, the percentage in volume of ethanol, the percentage in volume of PEGDA, and AgNPs-3MPS are listed, and the percentage in weight of PEGDA and the mass of AgNPS-3MPS are also depicted. All the calculations refer to a final volume of 10 mL. The use of the lowest volume (and therefore mass) of polymer and the highest possible volume of silver nanoparticles guided the choice of the compositions investigated. On the one hand, the lower presence of polymer should facilitate the interaction between Hg(II) ions and AgNPs, and on the other hand, a greater quantity of silver NPs should increase the filtering capacity of the system.
After the preparation of the solution, a volume of 2 mL of the photoactive solution was poured into a square plastic box of 2.7 × 2.7 × 1.0 cm3 and exposed to the UV light source until the complete photo-reticulation (6 min) was achieved. To compare the adsorption properties, hydrogels were prepared as references without doping them with the AgNPs, and in this case, the complete polymerization occurred in 2 min.
Before the investigations, the hydrogels were washed in a solution of 30% by volume of ethanol in water for 24 h at room temperature and in the dark, to remove any unreacted Irg.184 and/or PEGDA. The hydrogels were used for the filtering tests without any further process.

2.4. Selectivity and Sensitivity Tests

The sensor property of the PEGDA/AgNPs-3MPS hydrogels was investigated by studying optical absorption of its behavior as a function of the interaction time with a solution of metal ions after 1 h, 24 h, and 48 h. The sensitivity tests towards Hg(II) was studied by varying the ion concentration from 0.4 to 20.0 mg/L.
The hydrogels were cut in rectangle slabs of about 2.5 × 0.8 × 0.1 cm3, and this size allowed to insert the sample into disposable plastic cuvettes. A volume of 2 mL of polluted water was injected in the cuvette with the hydrogel, and the Surface Plasmon Resonance (SPR) band of AgNPs-3MPS was monitored at different times, using a spectrophotometer (see Section 2.6 Instrumentation, for details). During these tests, a hydrogel without AgNPs-3MPS was placed in the reference optical path to subtract the PEGDA contribution on the optical absorption, and to reveal in a better way the SPR peak belonging to AgNPs-3MPS. All the tests were repeated three times.

2.5. Filtering Tests

The Hg(II) filtering tests were accomplished in static conditions: a single filter was immersed in a beaker containing 10 mL of Hg(II)-polluted water for 24 h and at t = 25 °C. To select the best composition of filter, the quantities of PEGDA (10% and 14% in wt.) and AgNPs-3MPS (from 0 to 0.72 mg) were varied. These hydrogels were kept in contact with a solution of 20 mg/L of Hg(II) ions, and subsequently, the adsorption percentage was evaluated to select the best composition of sorbent material. The removal efficiency (RE) of the material (in percentage) was calculated by applying the following formula:
R E   % = C i C e C i 100
where Ci and Ce represent the initial and equilibrium concentrations of metal ion (mg/L) in water, respectively, and these concentrations were measured using Inductively Coupled Plasma-Optical Emission Spectroscopy (ICP-OES).
The composition exhibiting the maximal RE was subsequently employed to investigate filtration performance through variation of Hg(II) concentration, ranging from 20 mg/L to 2 mg/L. A parallel examination was conducted on the non-doped filters to facilitate comparative analysis. The quantification of adsorbed metal ions per unit mass of the sorbent (mg/g) was assessed utilizing the following equation:
q e = C i C e m V
where qe (mg/g) is the adsorption capacity at equilibrium; Ci and Ce are the initial and equilibrium concentrations of metal ion (mg/L), respectively, while V is the volume of adsorbate solution in liter, and m is the mass of the filter in gram.

2.6. Instrumentation

A two-beam UV/Vis/NIR spectrophotometer (Lambda 750, Perkin-Elmer, Waltham, MA, USA) was used to optically characterize the samples in the range 300–700 nm, with a speed scan of about 266 nm/min and one nm as step.
The concentrations of Hg in the filtered water were measured with ICP-OES (Avio 200, Perkin-Elmer). All the tests were repeated three times.

3. Results and Discussion

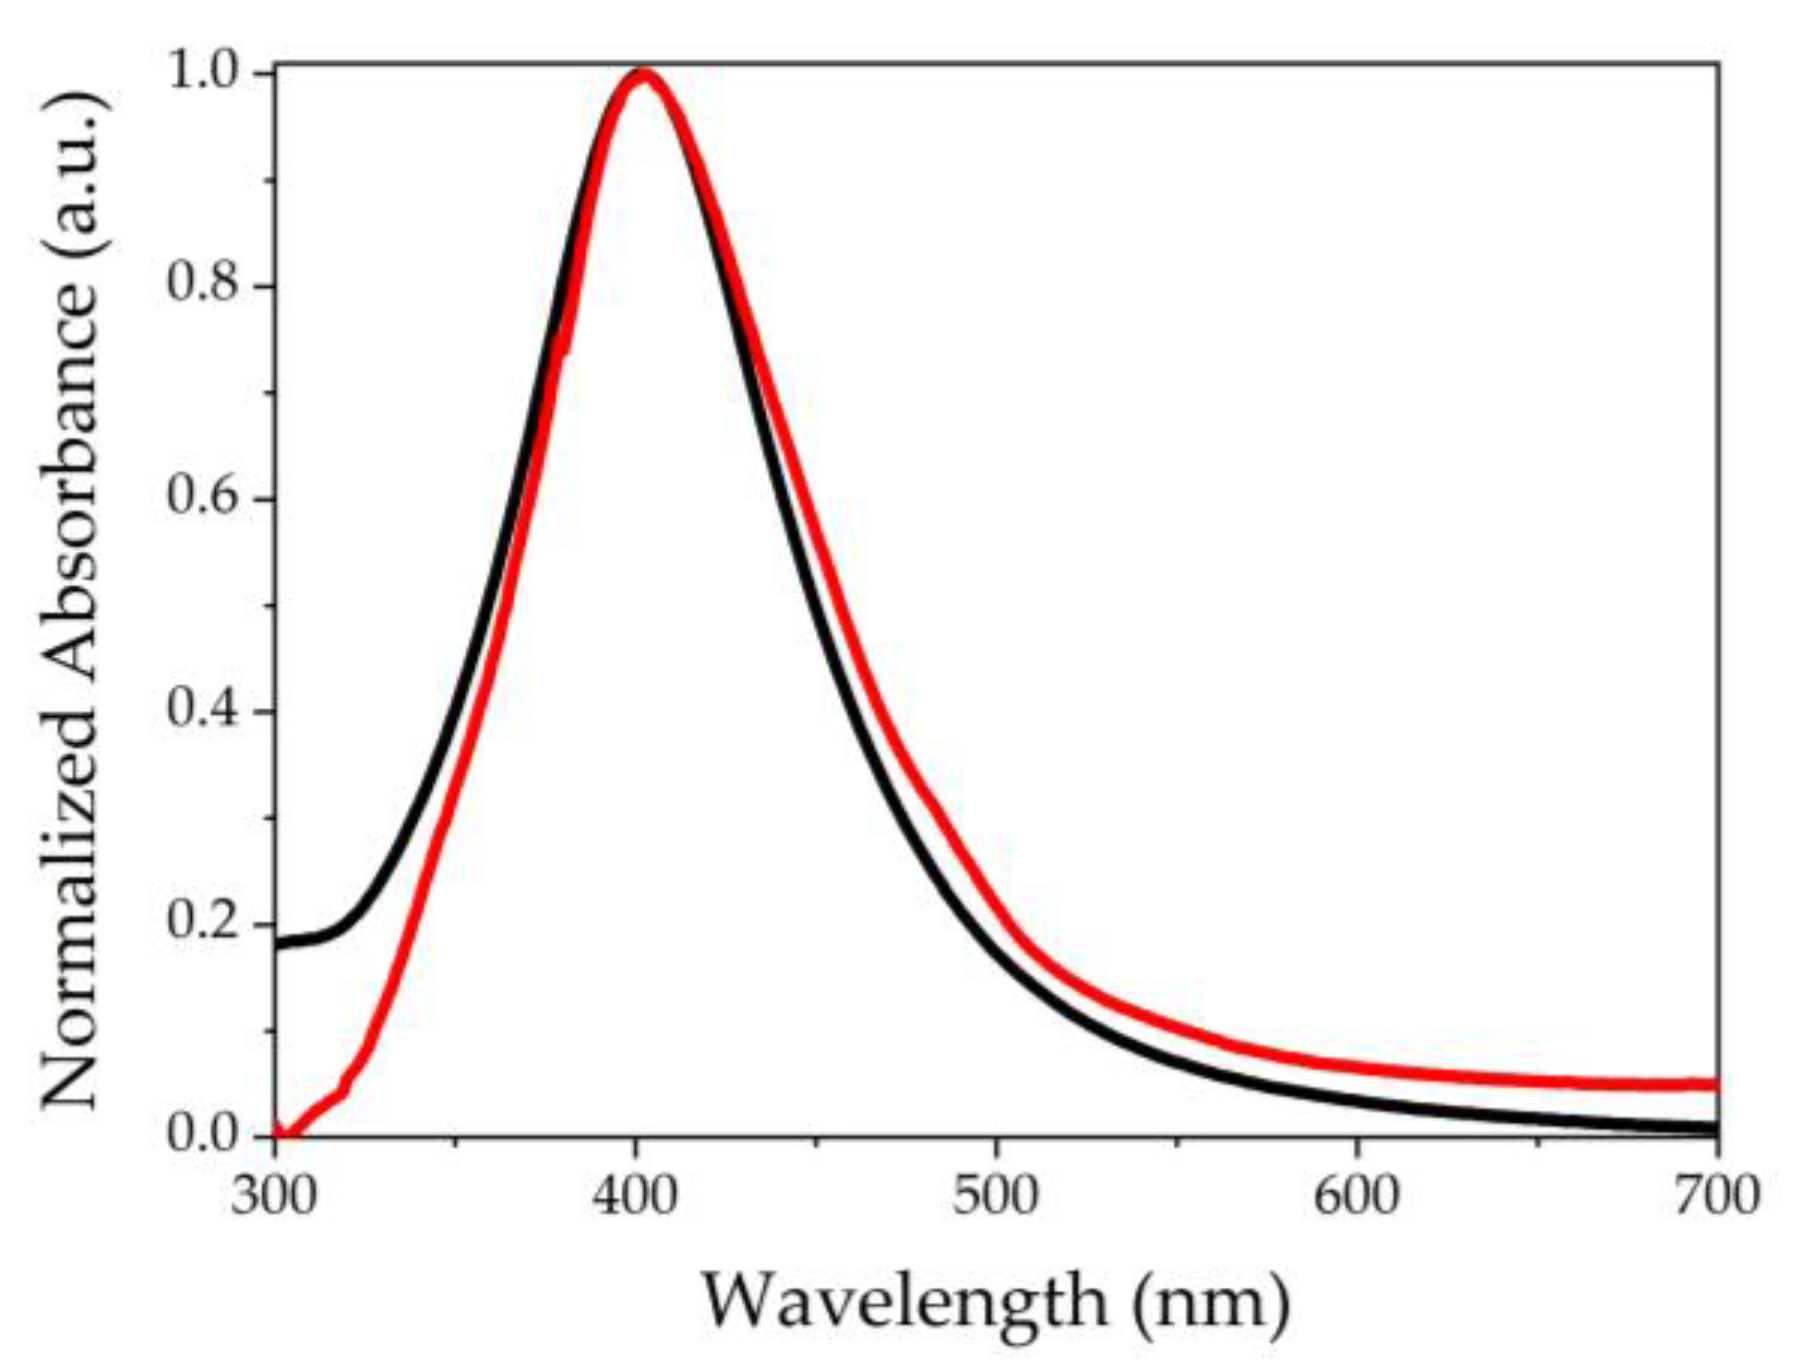
3.1. Optical Characterization

The Figure 1 shows the normalized UV-Vis absorption spectra of AgNPs-3MPS in colloidal solution (black curve) and of the PEGDA-based hydrogel with AgNPs (red curve, chemical composition A-3). Both samples present a SPR band at about 400 nm and a Full Width at Half Maximum (FWHM) of 90 nm. Once the AgNPs-3MPS are embedded in the hydrogel, the SPR band does not undergo modifications, indicating that the AgNPs insertion process was successful.

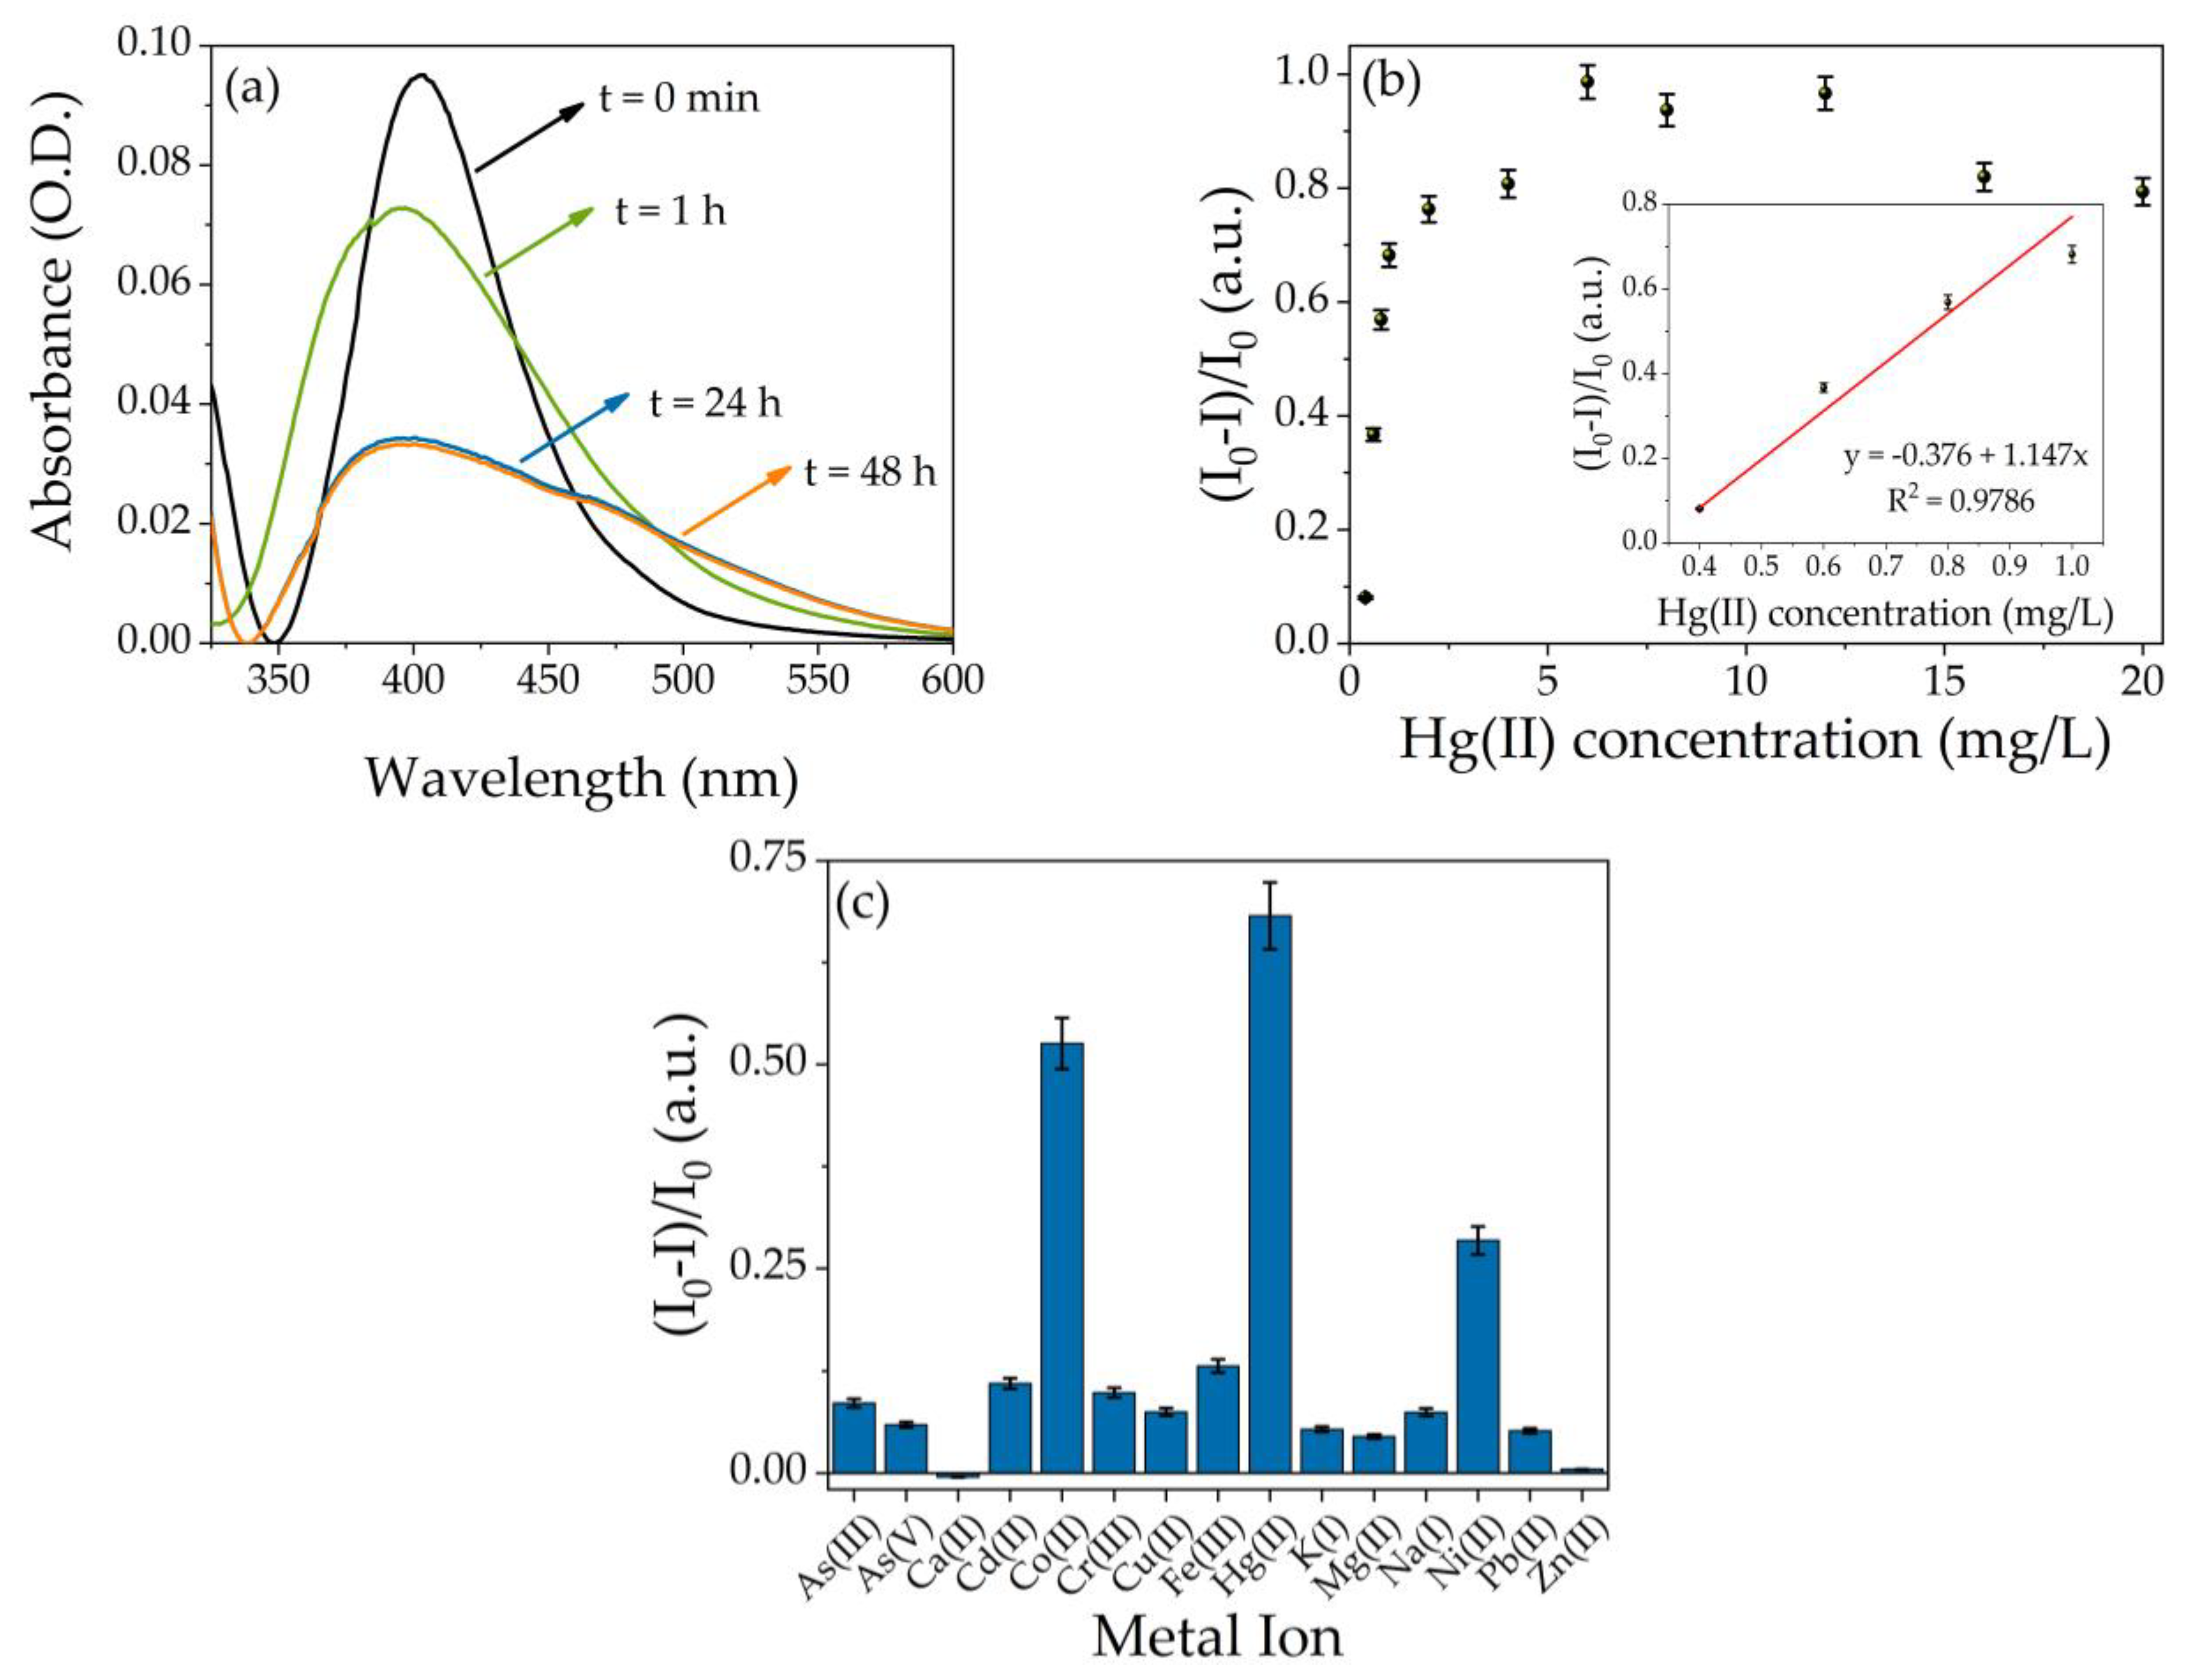
3.2. Selectivity and Sensitivity Tests of PEGDA/AgNPs-3MPS on Metal Ions

The optical absorption of hydrogel modified with AgNPs-3MPS was monitored as a function of time at 1 h, 24 h, and 48 h, following the interaction between PEGDA/AgNPs-3MPS hydrogel and different metal ions. The Figure 2a shows the SPR band in the presence of Hg(II) solution at the concentration of 1 mg/L as a function of the interaction time. Three effects occur on the plasmon band, a slight shift towards shorter wavelengths with respect to the reference band (black curve, in the figure), and at the same time, the peak intensity decreases until achieving the minimum value after 24 h and also a broadening of the band occurs. A similar trend was observed in our previous research [43], where the AgNPs-3MPS colloidal solution polluted with Hg(II) showed a blue shift of the plasmon band, due to the formation of the Ag/Hg amalgam. The color of the doped hydrogel turns from yellow to colorless as reported in Figure S2. The interaction process between Hg and Ag lasts up to 24 h, and indeed, by observing the spectrum recorded after 48 h, this overlaps with that of 24 h, and from that, it is possible to conclude that the interaction is complete. Tests carried out with all the other Hg(II) concentrations showed the same behavior. The intensity of the SPR peak was analyzed to evaluate the sensing properties toward Hg(II) ions. The Figure 2b represents the dimensionless ratio (I0I)/I0 as a function of Hg(II) concentration, where I0 refers to the intensity at the maximum of the SPR band of uncontaminated sample, while I represents the intensity at the maximum of the SPR of polluted samples when the interaction is completed (24 h). In the graph, two regions can be identified; for low concentration, from 0.4 to 1.0 mg/L, the behavior is linear, while for concentrations higher than 1.0 mg/L, the ratio reaches a plateau value already at a concentration of about 4 mg/L, indicating a saturation process of the system. From the linear range (inset of the Figure 2b), the LOD (3σ) is equal to 0.3 mg/L. The procedure to obtain the LOD is described in the Supporting Information.
Figure 2c shows the selectivity tests of the PEGDA-based hydrogel with AgNPs-3MPS on 15 different metal ions at the concentration of 1 mg/L, and an optical response was also observed in the case of Co(II) and Ni(II). However, in these cases, the SPR peak shifted towards longer wavelengths, while for Hg(II), a blue shift was observed (see Figure S3 of the Supporting Information). In presence of cobalt(II), the band red-shifted by 18 nm, while for nickel(II), 10 nm of shifting occurred, and this behavior was also observed in colloidal solutions and reported in a previous work [40], where cobalt and nickel ions induced aggregation of AgNPs-3MPS. Indeed, the Co(II) and Ni(II) ions can interact with the sulfonate groups (-SO3) present in the stabilizing agent and deprive the electrostatic repulsion, favoring the aggregation of the Ag nanoparticles [40]. Despite the presence of PEGDA polymeric chains, which considerably reduce the possibility of aggregation of the particles, this type of phenomenon cannot be excluded, indeed, the color of the hydrogel in contact with Ni(II) or Co(II) turns to reddish as found for the AgNPs-3MPS in colloidal solution. The pictures of the Co(II) and Ni(II) contaminated samples are reported in the insets of Figure S3. The UV-Vis spectra of PEGDA/AgNPs-3MPS hydrogels with and without all the others metal ions are reported in Figure S4. Recently, several nanocomposite hydrogels embedding gold or silver nanoparticles have been developed to detect mercury ions, a comparison about the sensing capabilities toward Hg(II) ions of various hydrogel composites is showed in Table 3.

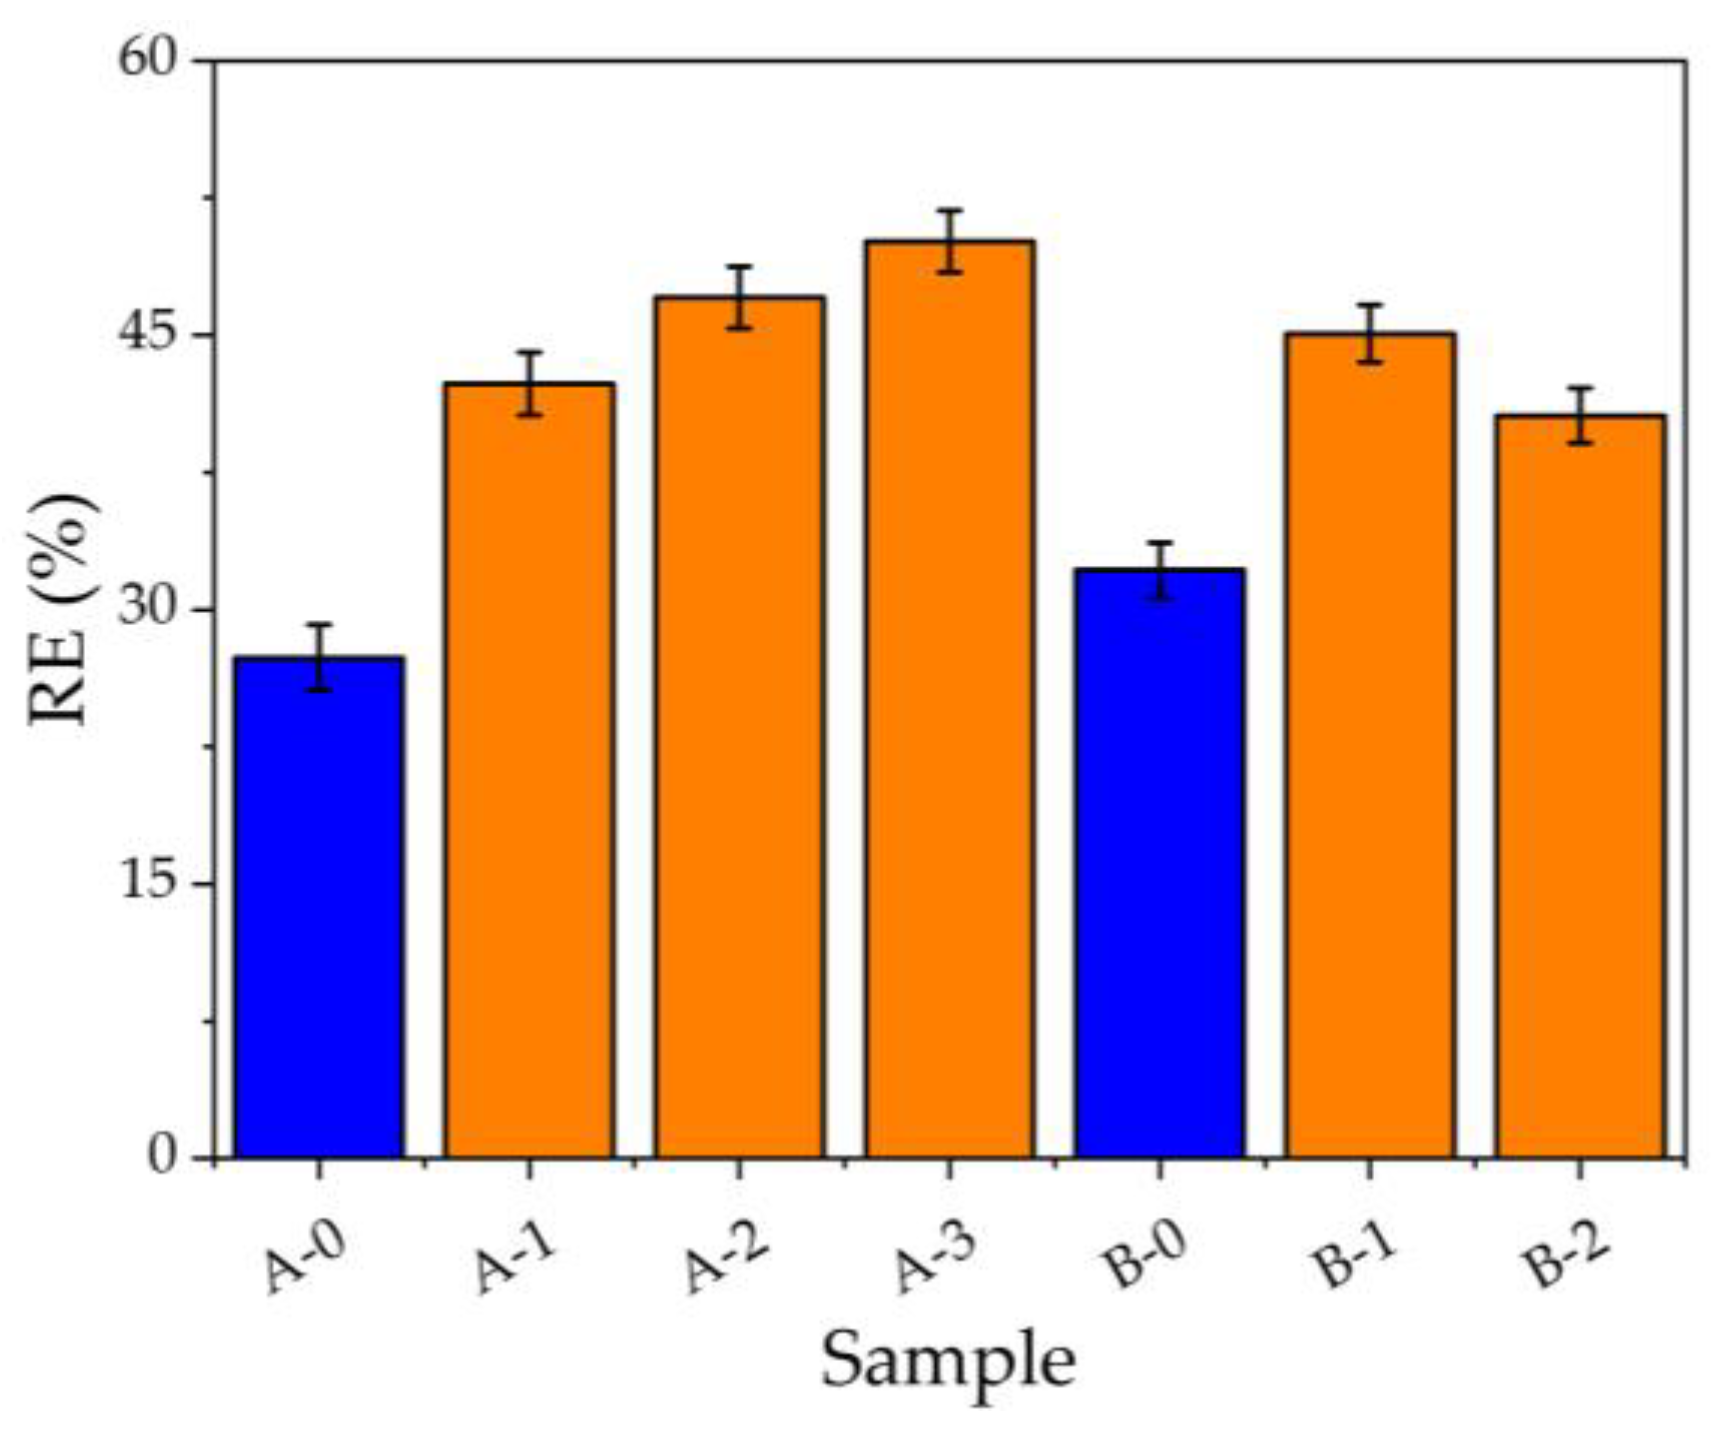
3.3. Optimization of PEGDA/AgNPs-3MPS Composition for Filtering Process

The Figure 3 shows the removal efficiency as a function of filter composition listed in Table 2 for 20 mg/L of Hg(II) solution, and the blue bars represent filters without nanoparticles, while the orange ones the filters doped with AgNPs-3MPS. Sample A-0 removes 27% of the initial Hg(II) concentration, while the sample B-0 shows an RE of 32%. This increment can be due to the richer oxygen atoms of the sample B-0 (PEGDA 14% in weight), and in fact, the oxygen atoms can electrostatically interact with the toxic cations, sequestering them more efficiently from the contaminated water, i.e., the more PEGDA content, the more adsorption process. By doping the hydrogel with AgNPs-3MPS, the RE value increases proportionally with the nanoparticles content. The RE values are 42%, 47%, and 50% for the samples A-1, A-2, and A-3, respectively. The reverse behavior of the sample B-2 compared with B-1 can be probably due to the electrostatic interaction between the sulfonate groups (-SO3) of the 3MPS and the oxygen atoms belonging to the PEGDA chains. We hypothesize that the AgNPs are trapped in the nets of the polymer, but by increasing the PEGDA (from 10% wt. to 14% wt.), the number of oxygen atoms increases, interacting repulsively with the functionality -SO3 of the capping agent, and consequently, it is possible that the AgNPs are not trapped in the polymeric structure. Thus, the actual concentration of the nanoparticles could be lower than the nominal one because the AgNPs may have been washed away during the purification step.
Based on the highest RE of the hydrogel A-3, this was selected for the adsorption capacity study.

3.4. Adsorption Capacity and Equilibrium Studies

The investigation on adsorption capacity was conducted by varying aqueous concentrations of Hg(II), ranging from 2 to 20 mg/L. As depicted in Figure 4, the adsorption capacity was plotted against the equilibrium concentration of Hg(II) for both the undoped filter (indicated by blue dots) and the filters modified with AgNPs (highlighted as orange points). The best fits for the experimental data are shown, where the Freundlich isotherms are represented by the black lines, while the Langmuir models are denoted by the red lines. Details of the parameters derived from the best fits for both filter types can be found in Table 4. Generally, to determine the adsorption mechanism onto a surface, the Freundlich and Langmuir isotherms are used, for physisorption and chemisorption, respectively.
Equation (5) refers to Freundlich isotherm [46]:
q e = K F C e 1 n
where KF stands for Freundlich coefficient (mg/g), reflecting adsorption capacity, while n is associated with the strength constant of the isotherm model. The Freundlich isotherm characterizes a reversible and non-ideal adsorption mechanism, elucidating surface heterogeneity and the exponential energy distribution of active sites. Importantly, it does not predict adsorbent saturation and is primarily suitable for describing the physisorption of ions onto absorbent surfaces [46]. The value of 1/n is temperature-dependent and signifies adsorption conditions such as adsorption intensity or surface diversity. A value of 1/n between 0 and 1 indicates favorable adsorption, 1/n > 1 implies disadvantageous conditions, and 1/n = 1 suggests irreversibility [47].
Equation (6) represents the Langmuir isotherm [46]:
q e = q m K L C e 1 + K L C e
where qm (mg/g) represents the maximum adsorption capacity, and KL (L/mg) is the Langmuir isotherm constant. The main point of the Langmuir isotherm assumes that the thickness of the adsorbed layer is one molecule (monolayer adsorption) in which adsorption process occurs at identical and equivalent definite localized sites (equal in terms of activation energy).
For the undoped system, from Figure 4, both the Langmuir and Freundlich models adapt well to the experimental points. However, taking into account the correlation coefficient R2 (one of the parameters to determine the goodness of fit), it is observed that for the Langmuir model the value of R2 (0.9695) is greater than that of Freundlich (R2 = 0.9502). As a consequence, a chemisorption process (chelation) may occur between the Hg(II) ions and the ester groups of the PEGDA chains. For the sample A-3, from Figure 4 and the data in Table 4, it is clear that the adsorption process is chemisorption. The pristine PEGDA matrix qm value stands at 0.34 mg/g, which enhances to 0.58 mg/g upon doping with merely 10.8 mg/filter of AgNPs-3MPS.
According to the Langmuir isotherm model, it becomes feasible to compute the separation factor or equilibrium parameter (KR) as reported in Formula (7):
K R = 1 1 + K L C 0
where KL is the Langmuir constant (L/mg), and C0 is the initial concentration of Hg(II) in mg/L. The parameter KR assumes significance as an indicator of the favorability of the process. When the value of KR exceeds unity (KR > 1), the adsorption event is determined to be unfavorable. Conversely, when KR equals unity (KR = 1), the adsorption exhibits a linear behavior. Within the range where 0 < KR < 1, the adsorption process is deemed favorable. Notably, the limiting case of KR being equal to zero signifies an irreversible adsorption occurrence [48,49]. In the favorable domain (0 < KR < 1), the degree of favorability is inversely related to the magnitude of KR; smaller KR values correspond to increasingly favorable adsorption events [50]. Figure S5 reports the KR as a function of C0 for both filters, doped and undoped with AgNPs-3MPS. In both cases, the KR values indicate that adsorption is more favorable for the higher initial metal ion concentrations than for the lower ones. The doped filter shows, for all the initial concentrations, lower KR values than the pristine PEGDA filter, and indeed, the presence of AgNPs-3MPS makes the mercury adsorption process more favorable, ending in the formation of Ag/Hg amalgam.

4. Conclusions

This study presents the successful integration of functionalized silver nanoparticles (AgNPs-3MPS) into a PEGDA matrix through a photo-polymerization mechanism. Upon incorporation into the hydrogel matrix, the PEGDA/AgNPs-3MPS composite exhibits a UV-Vis absorption spectrum analogous to that of the initial colloidal AgNPs-3MPS solution, providing conclusive evidence of successful integration. Mercury sensitivity investigations demonstrate that the plasmon resonance band of AgNPs-3MPS undergoes perceptible shifts upon exposure to toxic mercury ions. A linear behavior up to 1.0 mg/L was observed, and from the linear fit, the limit of detection (LOD, 3σ) was calculated to be 0.3 mg/L. Through the optimization of the PEGDA matrix composition, it has been ascertained that filter constructs composed of 10% wt. PEGDA and 10.8 mg of AgNPs-3MPS yield optimal results, showing a removal efficiency (RE) of 50% for Hg(II) ions present in aqueous solutions. Comparatively, this efficacy stands as a significant enhancement, surpassing that of undoped filters (RE ≈ 30%) when in contact with a Hg(II) solution of 20 mg/L concentration. The sensing and the removing capabilities toward Hg(II) ions are based on the interaction mechanism between AgNPs-3MPS and the toxic ions: amalgam formation. This phenomenon is crucial for this dual purpose. Optically, without AgNPs-3MPS, it is not possible to observe the presence of Hg(II) ions, and by doping PEGDA with the nanomaterial, it is possible to obtain a better removal of the toxic metal ions. Furthermore, the investigation about the adsorption capacity has elucidated that the underlying mechanisms of Hg(II) adsorption exhibit congruence with the Langmuir isotherm for both unmodified and AgNP-doped filters.

Supplementary Materials

The following supporting information can be downloaded at: https://www.mdpi.com/article/10.3390/chemosensors11100518/s1, Figure S1. Schematic representation of the synthesis of AgNPs-3MPS. Figure S2. Picture of PEGDA-based hydrogels with AgNPs-3MPS: without Hg(II) interaction, left side, and after 24 h of interaction with Hg(II), right side. Figure S3. Normalized absorption spectra of PEGDA/AgNPS-3MPS matrices without contamination black curves and in presence of 1 mg/L of Co(II) (a) and Ni(II) (b), red lines. Figure S4. UV-Vis spectra of PEGDA/AgNPs-3MPS hydrogels with different metal ions at the concentration of 1 mg/L: (a) As(III); (b) As(V); (c) Ca(II); (d) Cd(II); (e) Cr(III); (f) Cu(II); (g) Fe(III); (h) K(I); (i) Mg(II); (j) Na(I); (k) Pb(II); (l) Zn(II), (m) Co(II); and (n) Ni(II). Figure S5. Separation factor as a function of initial concentration of Hg(II), and the blue points refer to undoped hydrogel, while orange points represent the AgNPs-3MPS-doped hydrogel.

Author Contributions

Conceptualization, L.B. and P.P.; methodology, L.B. and P.P.; software, L.B.; validation, M.S. and P.P.; formal analysis, L.B. and P.P.; investigation, L.B. and I.D.G.; data curation, L.B. and P.P.; writing—original draft preparation, L.B.; writing—review and editing, M.S., I.D.G., P.P., F.D.M. and R.F.; supervision, P.P.; project administration, P.P. All authors have read and agreed to the published version of the manuscript.

Funding

The project A0375-2020-36521 (CUP: E85F21002440002) FACS (Filtraggio acque contaminate tramite sistemi nanostrutturati) has received funding from the Regione Lazio (Italy) by “Gruppi di ricerca 2020”—POR FESR Lazio 2014–2020.

Institutional Review Board Statement

Not applicable.

Informed Consent Statement

Not applicable.

Data Availability Statement

Not applicable.

Conflicts of Interest

The authors declare no conflict of interest.

References

  1. Bhat, A.P.; Gogate, P.R. Degradation of nitrogen-containing hazardous compounds using advanced oxidation processes: A review on aliphatic and aromatic amines, dyes, and pesticides. J. Hazard. Mater. 2021, 403, 123657. [Google Scholar] [CrossRef]
  2. Al-Tohamy, R.; Ali, S.S.; Li, F.; Okasha, K.M.; Mahmoud, Y.A.-G.; Elsamahy, T.; Jiao, H.; Fu, Y.; Sun, J. A critical review on the treatment of dye-containing wastewater: Ecotoxicological and health concerns of textile dyes and possible remediation approaches for environmental safety. Ecotoxicol. Environ. Saf. 2022, 231, 113160. [Google Scholar] [CrossRef]
  3. Routoula, E.; Patwardhan, S.V. Degradation of Anthraquinone Dyes from Effluents: A Review Focusing on Enzymatic Dye Degradation with Industrial Potential. Environ. Sci. Technol. 2020, 54, 647–664. [Google Scholar] [CrossRef]
  4. Witkowska, D.; Słowik, J.; Chilicka, K. Heavy Metals and Human Health: Possible Exposure Pathways and the Competition for Protein Binding Sites. Molecules 2021, 26, 6060. [Google Scholar] [CrossRef]
  5. World Health Organization (WHO). Available online: https://www.who.int/news-room/photo-story/photo-story-detail/10-chemicals-of-public-health-concern (accessed on 18 September 2023).
  6. Yang, L.; Zhang, Y.; Wang, F.; Luo, Z.; Guo, S.; Strähle, U. Toxicity of mercury: Molecular evidence. Chemosphere 2020, 245, 125586. [Google Scholar] [CrossRef]
  7. Raihan, S.M.; Moniruzzaman, M.; Park, Y.; Lee, S.; Bai, S.C. Evaluation of Dietary Organic and Inorganic Mercury Threshold Levels on Induced Mercury Toxicity in a Marine Fish Model. Animals 2020, 10, 405. [Google Scholar] [CrossRef]
  8. Charvát, P.; Klimeš, L.; Pospíšil, J.; Klemeš, J.J.; Varbanov, P.S. An overview of mercury emissions in the energy industry—A step to mercury footprint assessment. J. Clean. Prod. 2020, 267, 122087. [Google Scholar] [CrossRef]
  9. Gerson, J.R.; Szponar, N.; Zambrano, A.A.; Bergquist, B.; Broadbent, E.; Driscoll, C.T.; Erkenswick, G.; Evers, D.C.; Fernandez, L.E.; Hsu-Kim, H.; et al. Amazon forests capture high levels of atmospheric mercury pollution from artisanal gold mining. Nat. Commun. 2022, 13, 559. [Google Scholar] [CrossRef]
  10. Gworek, B.; Dmuchowski, W.; Baczewska-Dąbrowska, A.H. Mercury in the terrestrial environment: A review. Environ. Sci. Eur. 2020, 32, 128. [Google Scholar] [CrossRef]
  11. Choy, C.M.Y.; Lam, C.W.K.; Cheung, L.T.F.; Briton-Jones, C.M.; Cheung, L.P.; Haines, C.J. Infertility, blood mercury concentrations and dietary seafood consumption: A case-control study. BJOG An Int. J. Obstet. Gynaecol. 2002, 109, 1121–1125. [Google Scholar] [CrossRef]
  12. Saleh, T.A.; Fadillah, G.; Ciptawati, E.; Khaled, M. Analytical methods for mercury speciation, detection, and measurement in water, oil, and gas. TrAC Trends Anal. Chem. 2020, 132, 116016. [Google Scholar] [CrossRef]
  13. Wilhelm, S.M.; Bloom, N. Mercury in petroleum. Fuel Process. Technol. 2000, 63, 1–27. [Google Scholar] [CrossRef]
  14. Burratti, L.; Casalboni, M.; De Matteis, F.; Pizzoferrato, R.; Prosposito, P. Polystyrene opals responsive to methanol vapors. Materials 2018, 11, 1547. [Google Scholar] [CrossRef] [PubMed]
  15. Zhang, Y.; Sun, Y.; Cai, L.; Gao, Y.; Cai, Y. Optical fiber sensors for measurement of heavy metal ion concentration: A review. Measurement 2020, 158, 107742. [Google Scholar] [CrossRef]
  16. Pathak, A.K.; Viphavakit, C. A review on all-optical fiber-based VOC sensors: Heading towards the development of promising technology. Sens. Actuators A Phys. 2022, 338, 113455. [Google Scholar] [CrossRef]
  17. Janik, M.; Brzozowska, E.; Czyszczoń, P.; Celebańska, A.; Koba, M.; Gamian, A.; Bock, W.J.; Śmietana, M. Optical fiber aptasensor for label-free bacteria detection in small volumes. Sens. Actuators B Chem. 2021, 330, 129316. [Google Scholar] [CrossRef]
  18. Zhang, M.; Zhang, L.; Tian, H.; Lu, A. Universal preparation of cellulose-based colorimetric sensor for heavy metal ion detection. Carbohydr. Polym. 2020, 236, 116037. [Google Scholar] [CrossRef]
  19. Aadil, K.R.; Pandey, N.; Mussatto, S.I.; Jha, H. Green synthesis of silver nanoparticles using acacia lignin, their cytotoxicity, catalytic, metal ion sensing capability and antibacterial activity. J. Environ. Chem. Eng. 2019, 7, 103296. [Google Scholar] [CrossRef]
  20. Bordbar, M.M.; Nguyen, T.A.; Arduini, F.; Bagheri, H. A paper-based colorimetric sensor array for discrimination and simultaneous determination of organophosphate and carbamate pesticides in tap water, apple juice, and rice. Microchim. Acta 2020, 187, 621. [Google Scholar] [CrossRef]
  21. Burratti, L.; Bolli, E.; Casalboni, M.; de Matteis, F.; Mochi, F.; Francini, R.; Casciardi, S.; Prosposito, P. Synthesis of Fluorescent Ag Nanoclusters for Sensing and Imaging Applications. Mater. Sci. Forum 2018, 941, 2243–2248. [Google Scholar] [CrossRef]
  22. Shanmugaraju, S.; Umadevi, D.; González-Barcia, L.M.; Delente, J.M.; Byrne, K.; Schmitt, W.; Watson, G.W.; Gunnlaugsson, T. “Turn-on” fluorescence sensing of volatile organic compounds using a 4-amino-1,8-naphthalimide Tröger’s base functionalised triazine organic polymer. Chem. Commun. 2019, 55, 12140–12143. [Google Scholar] [CrossRef] [PubMed]
  23. Radhakrishnan, K.; Panneerselvam, P.; Marieeswaran, M. A green synthetic route for the surface-passivation of carbon dots as an effective multifunctional fluorescent sensor for the recognition and detection of toxic metal ions from aqueous solution. Anal. Methods 2019, 11, 490–506. [Google Scholar] [CrossRef]
  24. Shi, M.-Y.; Xu, M.; Gu, Z.-Y. Copper-based two-dimensional metal-organic framework nanosheets as horseradish peroxidase mimics for glucose fluorescence sensing. Anal. Chim. Acta 2019, 1079, 164–170. [Google Scholar] [CrossRef] [PubMed]
  25. Li, L.; Liu, D.; Shi, A.; You, T. Simultaneous stripping determination of cadmium and lead ions based on the N-doped carbon quantum dots-graphene oxide hybrid. Sens. Actuators B Chem. 2018, 255, 1762–1770. [Google Scholar] [CrossRef]
  26. Wang, M.; Ren, X.; Zhu, L.; Xia, Y.; Qiu, J. Preparation of mesoporous silica/carbon quantum dots composite and its application in selective and sensitive Hg2+ detection. Microporous Mesoporous Mater. 2019, 284, 378–384. [Google Scholar] [CrossRef]
  27. Omer, K.M.; Hassan, A.Q. Chelation-enhanced fluorescence of phosphorus doped carbon nanodots for multi-ion detection. Microchim. Acta 2017, 184, 2063–2071. [Google Scholar] [CrossRef]
  28. Limosani, F.; Bauer, E.M.; Cecchetti, D.; Biagioni, S.; Orlando, V.; Pizzoferrato, R.; Prosposito, P.; Carbone, M. Top-Down N-Doped Carbon Quantum Dots for Multiple Purposes: Heavy Metal Detection and Intracellular Fluorescence. Nanomaterials 2021, 11, 2249. [Google Scholar] [CrossRef]
  29. Su, L.; Wang, S.; Wang, L.; Yan, Z.; Yi, H.; Zhang, D.; Shen, G.; Ma, Y. Fluorescent aptasensor for carbendazim detection in aqueous samples based on gold nanoparticles quenching Rhodamine B. Spectrochim. Acta-Part A Mol. Biomol. Spectrosc. 2020, 225, 117511. [Google Scholar] [CrossRef]
  30. Zayed, M.F.; Eisa, W.H.; El-kousy, S.M.; Mleha, W.K.; Kamal, N. Ficus retusa-stabilized gold and silver nanoparticles: Controlled synthesis, spectroscopic characterization, and sensing properties. Spectrochim. Acta Part A Mol. Biomol. Spectrosc. 2019, 214, 496–512. [Google Scholar] [CrossRef]
  31. Bindhu, M.R.; Umadevi, M.; Esmail, G.A.; Al-Dhabi, N.A.; Arasu, M.V. Green synthesis and characterization of silver nanoparticles from Moringa oleifera flower and assessment of antimicrobial and sensing properties. J. Photochem. Photobiol. B Biol. 2020, 205, 111836. [Google Scholar] [CrossRef]
  32. Saenchoopa, A.; Boonta, W.; Talodthaisong, C.; Srichaiyapol, O.; Patramanon, R.; Kulchat, S. Colorimetric detection of Hg(II) by γ-aminobutyric acid-silver nanoparticles in water and the assessment of antibacterial activities. Spectrochim. Acta Part A Mol. Biomol. Spectrosc. 2021, 251, 119433. [Google Scholar] [CrossRef] [PubMed]
  33. Ko, E.; Hur, W.; Son, S.E.; Seong, G.H.; Han, D.K. Au nanoparticle-hydrogel nanozyme-based colorimetric detection for on-site monitoring of mercury in river water. Microchim. Acta 2021, 188, 382. [Google Scholar] [CrossRef] [PubMed]
  34. Jiang, X.; Zhang, H.; Yang, C.; Xia, J.; Liu, G.; Luo, X. A novel electrostatic drive strategy to prepare glutathione-capped gold nanoclusters embedded quaternized cellulose membranes fluorescent colorimetric sensor for Pb(II) and Hg(II) ions detection. Sens. Actuators B Chem. 2022, 368, 132046. [Google Scholar] [CrossRef]
  35. Ren, T.; Peng, J.; Yuan, H.; Liu, Z.; Li, Q.; Ma, Q.; Li, X.; Guo, X.; Wu, Y. Nanocellulose-based hydrogel incorporating silver nanoclusters for sensitive detection and efficient removal of hexavalent chromium. Eur. Polym. J. 2022, 175, 111343. [Google Scholar] [CrossRef]
  36. Pizzoferrato, R.; Bisauriya, R.; Antonaroli, S.; Cabibbo, M.; Moro, A.J. Colorimetric and Fluorescent Sensing of Copper Ions in Water through o-Phenylenediamine-Derived Carbon Dots. Sensors 2023, 23, 3029. [Google Scholar] [CrossRef]
  37. Burratti, L.; De Matteis, F.; Francini, R.; Lim, J.; Scheu, C.; Prosposito, P. Fluorescent Silver Nanoclusters Embedded in Hydrogel Matrix and Its Potential Use in Environmental Monitoring. Appl. Sci. 2021, 11, 3470. [Google Scholar] [CrossRef]
  38. Wankar, S.; Sapre, N.; Gumathannavar, R.; Jadhav, Y.; Kulkarni, A. Silver-chitosan (Ag-CH) nanocomposite hydrogel for remediation of aqueous medium. Mater. Today Proc. 2022; in press. [Google Scholar]
  39. Du, X.J.; Chen, Y.; Qin, L.Y.; Luo, H.Q.; Li, N.B.; Li, B.L. Plasmonic Gold Nanoparticles Stain Hydrogels for the Portable and High-Throughput Monitoring of Mercury Ions. Environ. Sci. Technol. 2022, 56, 1041–1052. [Google Scholar] [CrossRef]
  40. Mochi, F.; Burratti, L.; Fratoddi, I.; Venditti, I.; Battocchio, C.; Carlini, L.; Iucci, G.; Casalboni, M.; De Matteis, F.; Casciardi, S.; et al. Plasmonic Sensor Based on Interaction between Silver Nanoparticles and Ni2+ or Co2+ in Water. Nanomaterials 2018, 8, 488. [Google Scholar] [CrossRef]
  41. Liu, X.; Atwater, M.; Wang, J.; Huo, Q. Extinction coefficient of gold nanoparticles with different sizes and different capping ligands. Colloids Surf. B Biointerfaces 2007, 58, 3–7. [Google Scholar] [CrossRef]
  42. Kalishwaralal, K.; BarathManiKanth, S.; Pandian, S.R.K.; Deepak, V.; Gurunathan, S. Silver nanoparticles impede the biofilm formation by Pseudomonas aeruginosa and Staphylococcus epidermidis. Colloids Surf. B Biointerfaces 2010, 79, 340–344. [Google Scholar] [CrossRef]
  43. Schiesaro, I.; Burratti, L.; Meneghini, C.; Fratoddi, I.; Prosposito, P.; Lim, J.; Scheu, C.; Venditti, I.; Iucci, G.; Battocchio, C. Hydrophilic Silver Nanoparticles for Hg(II) Detection in Water: Direct Evidence for Mercury–Silver Interaction. J. Phys. Chem. C 2020, 124, 25975–25983. [Google Scholar] [CrossRef]
  44. Zhang, H.; Luo, J.J.; Sun, Z.; Zou, H.L.; Luo, H.Q.; Li, N.B.; Li, B.L. Hydrogels allow the precise growth tracking of plasmonic gold nanoparticles for mercury analysis. J. Mater. Chem. C 2022, 10, 14508–14516. [Google Scholar] [CrossRef]
  45. Jeevika, A.; Shankaran, D.R. Functionalized silver nanoparticles probe for visual colorimetric sensing of mercury. Mater. Res. Bull. 2016, 83, 48–55. [Google Scholar] [CrossRef]
  46. Chen, X.; Hossain, M.F.; Duan, C.; Lu, J.; Tsang, Y.F.; Islam, M.S.; Zhou, Y. Isotherm models for adsorption of heavy metals from water—A review. Chemosphere 2022, 307, 135545. [Google Scholar] [CrossRef] [PubMed]
  47. Febrianto, J.; Kosasih, A.N.; Sunarso, J.; Ju, Y.-H.; Indraswati, N.; Ismadji, S. Equilibrium and kinetic studies in adsorption of heavy metals using biosorbent: A summary of recent studies. J. Hazard. Mater. 2009, 162, 616–645. [Google Scholar] [CrossRef]
  48. Demirbaş, O.; Mahir, A.; Mehmet, D. The Removal of Victoria Blue from Aqueous Solution by Adsorption on a Low-Cost Material. Adsorption 2002, 8, 341–349. [Google Scholar] [CrossRef]
  49. Díaz-Nava, C.; Olguín, M.T.; Solache-Ríos, M.; Alarcón-Herrera, M.T.; Aguilar-Elguezabal, A. Phenol sorption on surfactant-modified Mexican zeolitic-rich tuff in batch and continuous systems. J. Hazard. Mater. 2009, 167, 1063–1069. [Google Scholar] [CrossRef]
  50. Ho, Y.S.; Huang, C.T.; Huang, H.W. Equilibrium sorption isotherm for metal ions on tree fern. Process Biochem. 2002, 37, 1421–1430. [Google Scholar] [CrossRef]
Figure 1. Normalized UV-Vis absorption spectra of AgNPs-3MPS colloidal solution (black curve) and PEGDA-based hydrogel with AgNPs-3MPS (red line).
Chemosensors 11 00518 g001
Figure 2. (a) UV-Vis spectroscopy of SPR band as a function of interaction time for the sample containing Hg(II) at the concentration of 1 mg/L; (b) dimensionless ratio (I0I)/I0 as a function of Hg(II) concentration (from 0.4 mg/L to 20.0 mg/L), inset: linear range (0.4–1.0 mg/L) with the best fit (red line) of the experimental points (interaction time 24 h); and (c) selectivity tests towards 15 different metal ions, concentration 1 mg/L (interaction time 24 h).
Chemosensors 11 00518 g002
Figure 3. Removal efficiency as a function of filter composition after the filtration of 20 mg/L of Hg(II) solution. The blue bars correspond to pristine PEGDA, while the orange ones represent the filters modified with AgNPs-3MPS.
Chemosensors 11 00518 g003
Figure 4. Adsorption isotherms illustrating the relationship between adsorption capacity (qe) and equilibrium concentration (Ce) for two scenarios: untreated filter is depicted by blue points, and filter with AgNPs-3MPS is represented by orange points. The isotherm best fits are also shown in the graph: black lines for Freundlich model and red lines for Langmuir model, respectively.
Chemosensors 11 00518 g004
Table 1. List of metal precursors employed in the selectivity tests.
Metal Precursors
NaAsO2Hg(NO3)2
Na2HAsO4KClO4
Ca(ClO4)2*4H2OMg(ClO4)2
Cd(NO3)2*4H2ONaNO2
CoCl2*6H2ONiCl2*6H2O
CrCl3*6H2OPb(NO3)2
Cu(NO3)2*H2OZn(NO3)2*6H2O
FeCl3*6H2O
Table 2. Composition of the investigated samples. For each composition, the mass (mg) of photoinitiator, the volume percentages (% vol.) of ethanol (EtOH), PEGDA, and AgNPs are depicted. The last two columns refer to the weight percentage (% wt.) of PEGDA and the mass of AgNPs (in mg).
SampleIrg.184 (mg)EtOH (% vol.)PEGDA (% vol.)AgNPs (% vol.)PEGDA (% wt.) AgNPs (in mg) *
A-0100190 100
A-1169751045
A-2119801048
A-319901054
B-01403120 140
B-11312751445
B-2312851451
Same mass of Irg.184 as sample A-0. Same mass of Irg.184 as sample B-0. The corresponding mass percentages of PEGDA were obtained using the density of PEGDA = 1.12 g/mL. * The corresponding masses of AgNPs-3MPS were obtained using the density of colloidal solution (6 mg/mL). In this samples, the AgNPs-3MPS solution was replaced with deionized water.
Table 3. Comparison of sensing capabilities toward Hg(II) of various nanocomposite hydrogels with gold or silver metal nanoparticles.
NanocompositeInvestigated RangeLODReference
AgNPs-3MPS hydrogel0–20 mg/L0.3 mg/LThis work
AgNPs/Gelatin hydrogel5–10,000 µM5 µM[32]
AuNPs/PEG/nanozyme hydrogel0.008–20 mg/L1.10 ng/mL[33]
AuNPs/C-AGH0–5 mM3.7 nM[39]
AuNPs/Agarose hydrogel10.0 nM–2.0 µM1.25 nM[44]
AgNPs/Gelatin hydrogel5 pM–0.5 mM25 nM[45]
Table 4. Isotherm parameters determined by fitting the experimental points.
SampleIsotherm ModelParametersSampleIsotherm ModelParameters
A-0FreundlichKF = 0.142 ± 0.005 L/mgA-3FreundlichKF = 0.25 ± 0.02 L/mg
1/n = 0.40 ± 0.031/n = 0.45 ± 0.06
R2 = 0.9502R2 = 0.7973
LangmuirKL = 0.9 ± 0.1 L/mgLangmuirKL = 1.2 ± 0.2 L/mg
qm = 0.34 ± 0.02 mg/gqm = 0.58 ± 0.07 mg/g
R2 = 0.9695R2 = 0.9327
Disclaimer/Publisher’s Note: The statements, opinions and data contained in all publications are solely those of the individual author(s) and contributor(s) and not of MDPI and/or the editor(s). MDPI and/or the editor(s) disclaim responsibility for any injury to people or property resulting from any ideas, methods, instructions or products referred to in the content.

