1. Introduction
Diabetes is a metabolic disorder in which the body cannot effectively regulate its blood glucose level [
1]. It is a global chronic disease with no cure. It is known as the silent killer, and it produces damage and complications in the liver, kidneys, eyes, and nerves, as well as cardiovascular problems [
2]. This disease is a significant concern in the USA, as ~38.4 million people (11.3% of the US population) are reported to have diabetes as of 2023 [
3]. People living with this disease require constant monitoring of their blood glucose levels. One of today’s most common methods is a strip-based electrochemical sensor that utilizes an enzymatic (glucose oxidase) method [
4] and more recently, non-invasive techniques such as wearable devices like rings and smartwatches are becoming more popular. However, the devices have not gone through the process of being classified as medical devices by the FDA [
5]. One of the main disadvantages of this method is that the enzymes used are susceptible to environmental conditions, such as temperature and humidity, which can significantly affect the shelf life of the devices [
6]. This method also requires a painful finger prick to acquire the blood needed for the test. Therefore, developing new methods for long-term glucose monitoring is necessary, since real-time glucose monitoring has more value in clinical applications and is in line with current market trends [
7]. Several alternative methods for glucose sensors have been developed, such as fluorescence [
8], electrochemical [
9], high-performance liquid chromatography (HPLC) [
10], enzymatic methods [
11], colorimetric assays [
12], and surface-enhanced Raman spectroscopy (SERS) [
13,
14]. SERS has a significant advantage over the other methods because it is a non-destructive technique with high sensitivity and the capability of reading molecular fingerprints; this technique uses noble metals such as Au, Ag, and Cu in the form of nanostructures for the enhancement of the Raman signal by several orders of magnitude [
15,
16]. Several gold and silver nanoparticle systems have been developed for SERS-based glucose sensing to enhance the sensitivity [
17]. Among the metal NPs used in SERS applications, Au NPs are the most common due to their high biocompatibility and low toxicity [
18]. It is well known that 4-Mercaptophenylboronic acid (4-MPBA) can be linked to Au NPs by a covalent bond with the -SH groups achieved by thiol functionalization [
19]. 4-MPBA is a biocompatible molecule and has a high affinity for glucose with reversible binding. To increase the sensitivity, having a high surface area and increasing the number of active sites is important. This can be achieved by attaching the Au NPs to porous materials such as porous silicon nanotubes (pSi NTs) by using ZnO nanowires as templates. These pSi NTs have a highly tunable structure with the ability to control the length, inner diameter, and shell thickness. pSi NTs have been demonstrated to be biocompatible, with no harmful products produced during its degradation in a biological medium [
20].
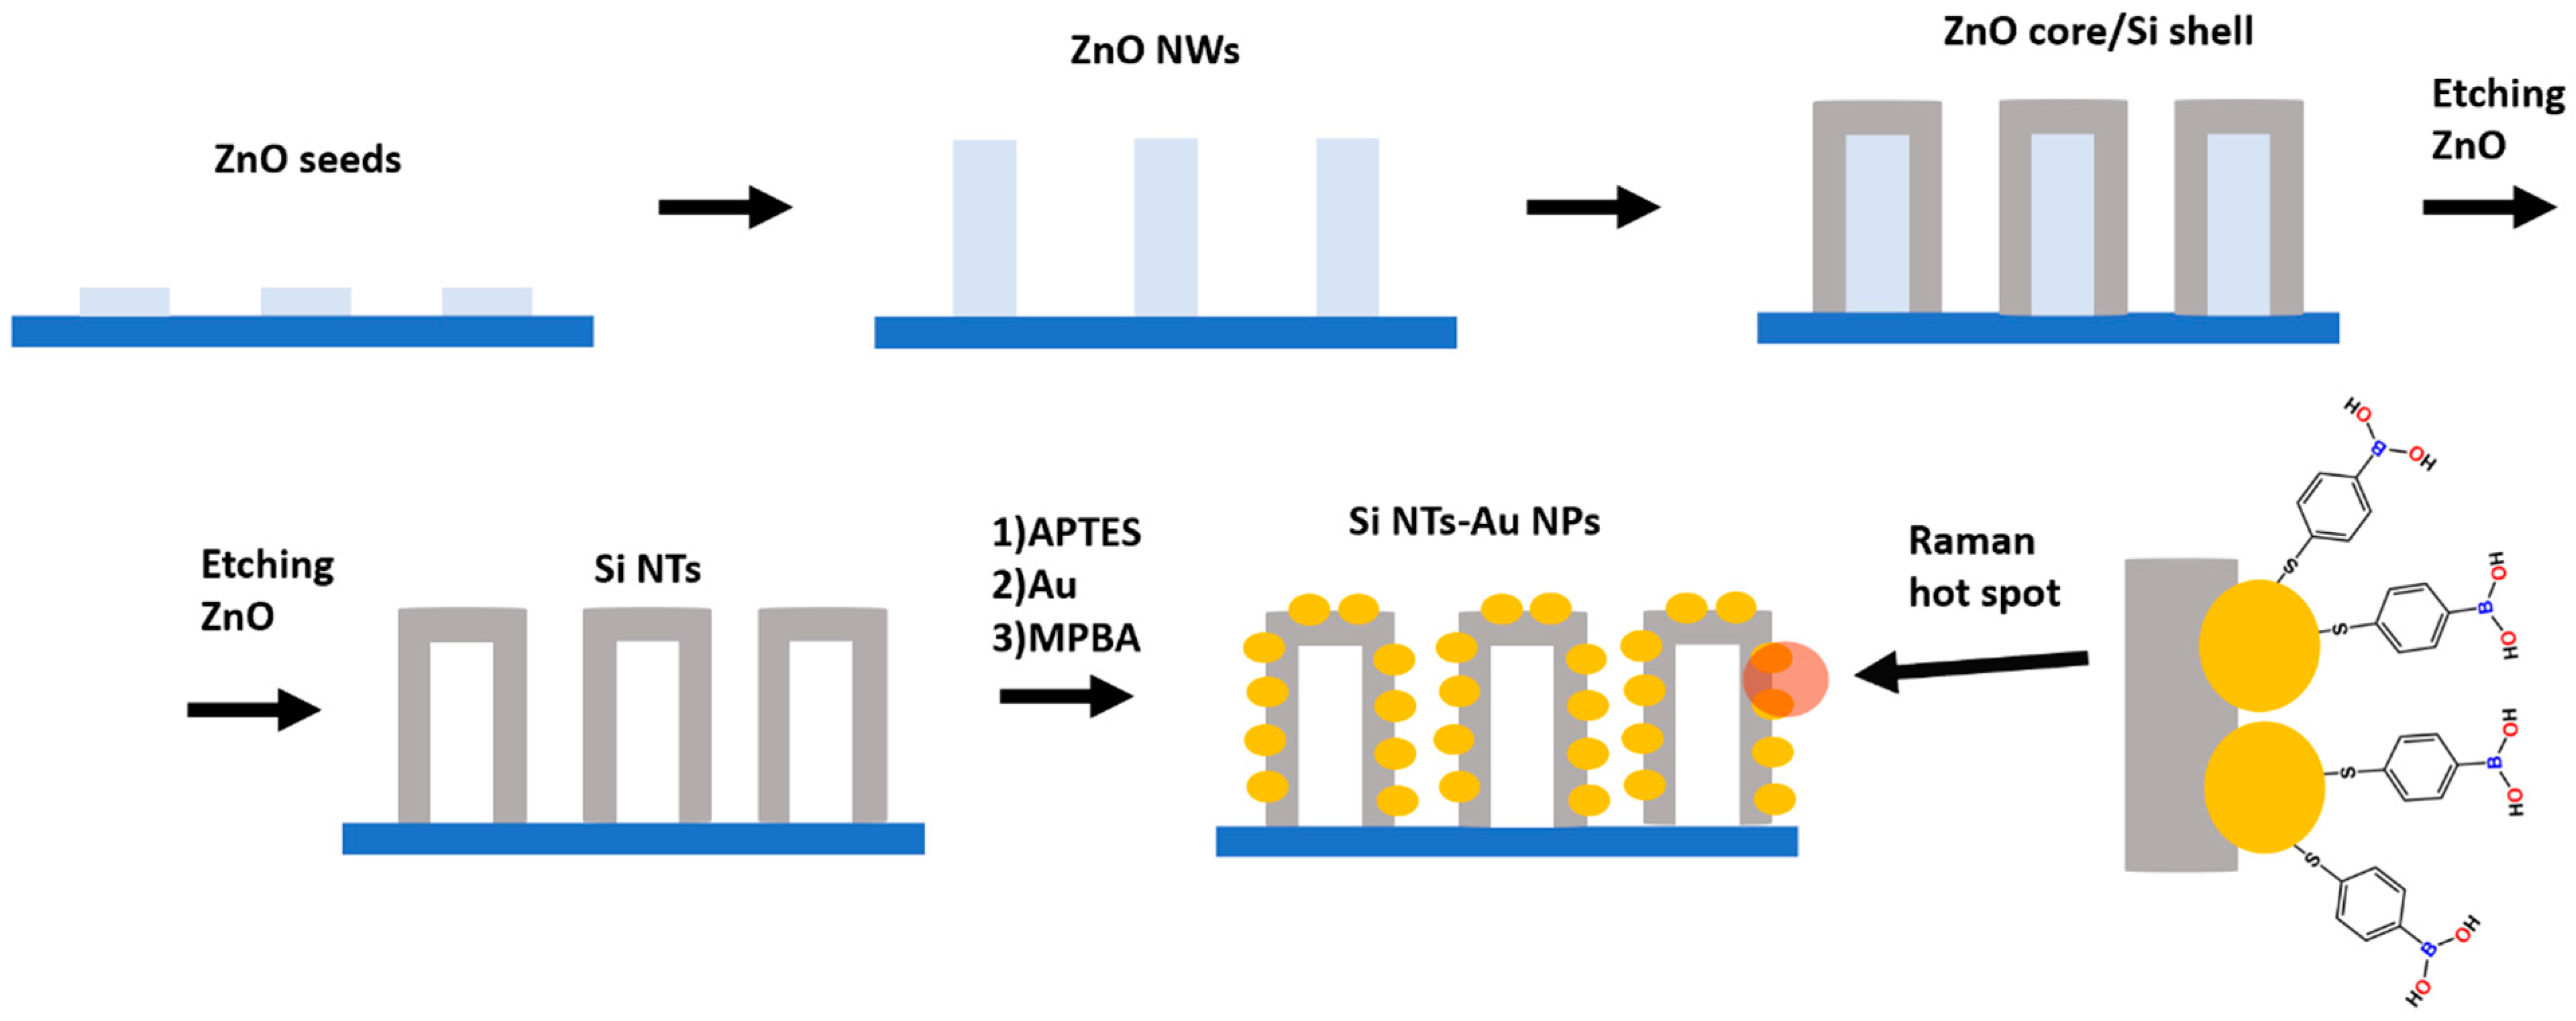
This paper describes a novel SERS surface based on a nanohybrid material with a uniform distribution and size of Au nanocrystals formed on pSi NTs. The pSi NTs were fabricated by using ZnO nanowires as templates; the ZnO nanowires’ dimensions give the inner diameter and length of pSi NTs, while the pSi NTs’ shell thickness is given during the silicon deposition. To form the Au NPs on the pSi NTs, the pSi NTs’ surface was modified with 3-aminopropyltriethoxysilane (APTES). These Au NPs were coupled with MPBA for glucose detection. We demonstrate a simple proof-of-concept potential application for this new nanocomposite material as a glucose sensor that uses MPBA as a selective target for glucose diluted in phosphate-buffered saline (PBS). We also perform theoretical simulations of the electromagnetic field of the nanotubes enhanced by the Au NPs using the RF Module of COMSOL Multiphysics 5.5 software. As a result, this biocompatible system is shown to have potential applications in nanomedicine and microfluidic devices for real-time glucose sensing.
2. Materials and Methods
Materials purchased from Sigma-Aldrich: Zinc acetate (Zn(CH3COO)2·2H2O), sodium hydroxide (NaOH), methanol (MeOH), ethanol (EtOH), toluene, zinc nitrate hexahydrate (Zn(NO3)2·6H2O), hexamethylenetetramine (HMTA), Tetrachloroauric(III) acid (HAuCl4), 4-Mercaptophenylboronic acid (MPBA), phosphate buffer solution, citric acid, and urea; from Praxair: 0.5% silane (SiH4) in helium (He, UHP-grade); from Fisher Scientific: bovine serum albumin (BSA) 3% in PBS; and from Gelest: 3-aminopropyltriethoxysilane (APTES). Characterization was carried out with scanning electron microscopy (FEI Quanta 200) with energy-dispersive X-ray (EDX) and transmission electron microscopy (TEM) using the JEOL JEM-2100 at 200 kV. The TEM sample was prepared by drop-casting on the carbon-coated 200-mesh copper grid and dried in vacuum. X-ray photoelectron spectroscopy (XPS) was conducted using a PHI 5000 Versaprobe Scanning XPS/UPS microscope and Raman RENISHAW InVia Microscope, with a laser excitation wavelength of 532 nm and a laser power of 0.1 mW, a grating of 1800 L/mm, and an objective of 100×.
2.1. Fabrication of Porous Silicon Nanotubes
ZnO nanocrystals (seeds) were prepared by mixing a solution of Zn(CH3COO)2 (12.5 mL, 0.01 M), MeOH (25 mL), and NaOH (6 mL, 0.03 M) for two hours at 60 °C. ZnO seeds were deposited on silicon wafers with a spin coater at 3000 rpm, after which the substrates were annealed at 300 °C for one hour. The ZnO nanocrystals had a diameter in the range of 1–5 nm and were highly crystalline, as shown in the TEM in S1. The Si wafers coated with ZnO seeds were incubated in a solution containing 0.1 M of Zn(NO3)2 and 0.1 M of HTMA for three hours at 95 °C. Silicon was deposited by chemical vapor deposition (CVD) by using silane as a silicon precursor in helium at 530 °C for 5 min. Finally, the ZnO was removed with NH4Cl at 500 °C for 2 hr in a helium atmosphere.
2.2. APTES Functionalization and Au NP Formation
pSi NTs were immersed in a 1% APTES solution in toluene for 5 h at room temperature under a constant stirring; then, the samples were washed with toluene and ethanol several times before they were finally allowed to dry in air at room temperature. These APTES-pSi NTs were incubated in a 2 mM Tetrachloroauric(III) acid solution for 24 h, rinsed with water/ethanol several times, and air-dried at room temperature for a few hours.
2.3. MPBA Functionalization
Mercaptophenylboronic acid (MPBA) functionalization was carried out with the immersion of pSi NTs-Au NPs in 200 mM of MPBA in DMSO for 20 h, followed by rinsing with DI water/ethanol several times and drying in air at room temperature.
2.4. Glucose Sensing
Aqueous glucose solutions were prepared in PBS in the range from 0 to 100 mM. A 300 ul solution was placed on top of the SERS substrate, followed by a glass cover slip. The substrate was then placed in the Raman microscope to collect the (Raman) spectrum. When the concentration was changed, the sample was rinsed several times with DI water and PBS. The pH study was carried out using standard solutions from Fisher-colored solutions, with pH 4.01, pH 7.0, and pH 10.01; a 300 µL buffer solution was placed on top of the SERS substrate, covered by a glass cover slip. The substrate was then placed under the Raman microscope for spectral measurement. The sample was rinsed several times with DI water when the buffer solution was changed. In addition to simulating urine and blood samples, the SERS measurement was performed in citric acid, urea, and BSA buffer by following the same procedure as described above.
3. Results and Discussion
pSi NTs were prepared by using ZnO nanowires as a sacrificial template. The fabrication procedure has been described in detail and can be found in our previous work [
21].
Figure 1 shows the schematic representation of the pSi NT fabrication process and the additional steps used to obtain the final AuNPs-pSiNTs product. In brief, the initial step for the fabrication of pSi NTs consists of ZnO nanocrystals that are first deposited on a silicon wafer.
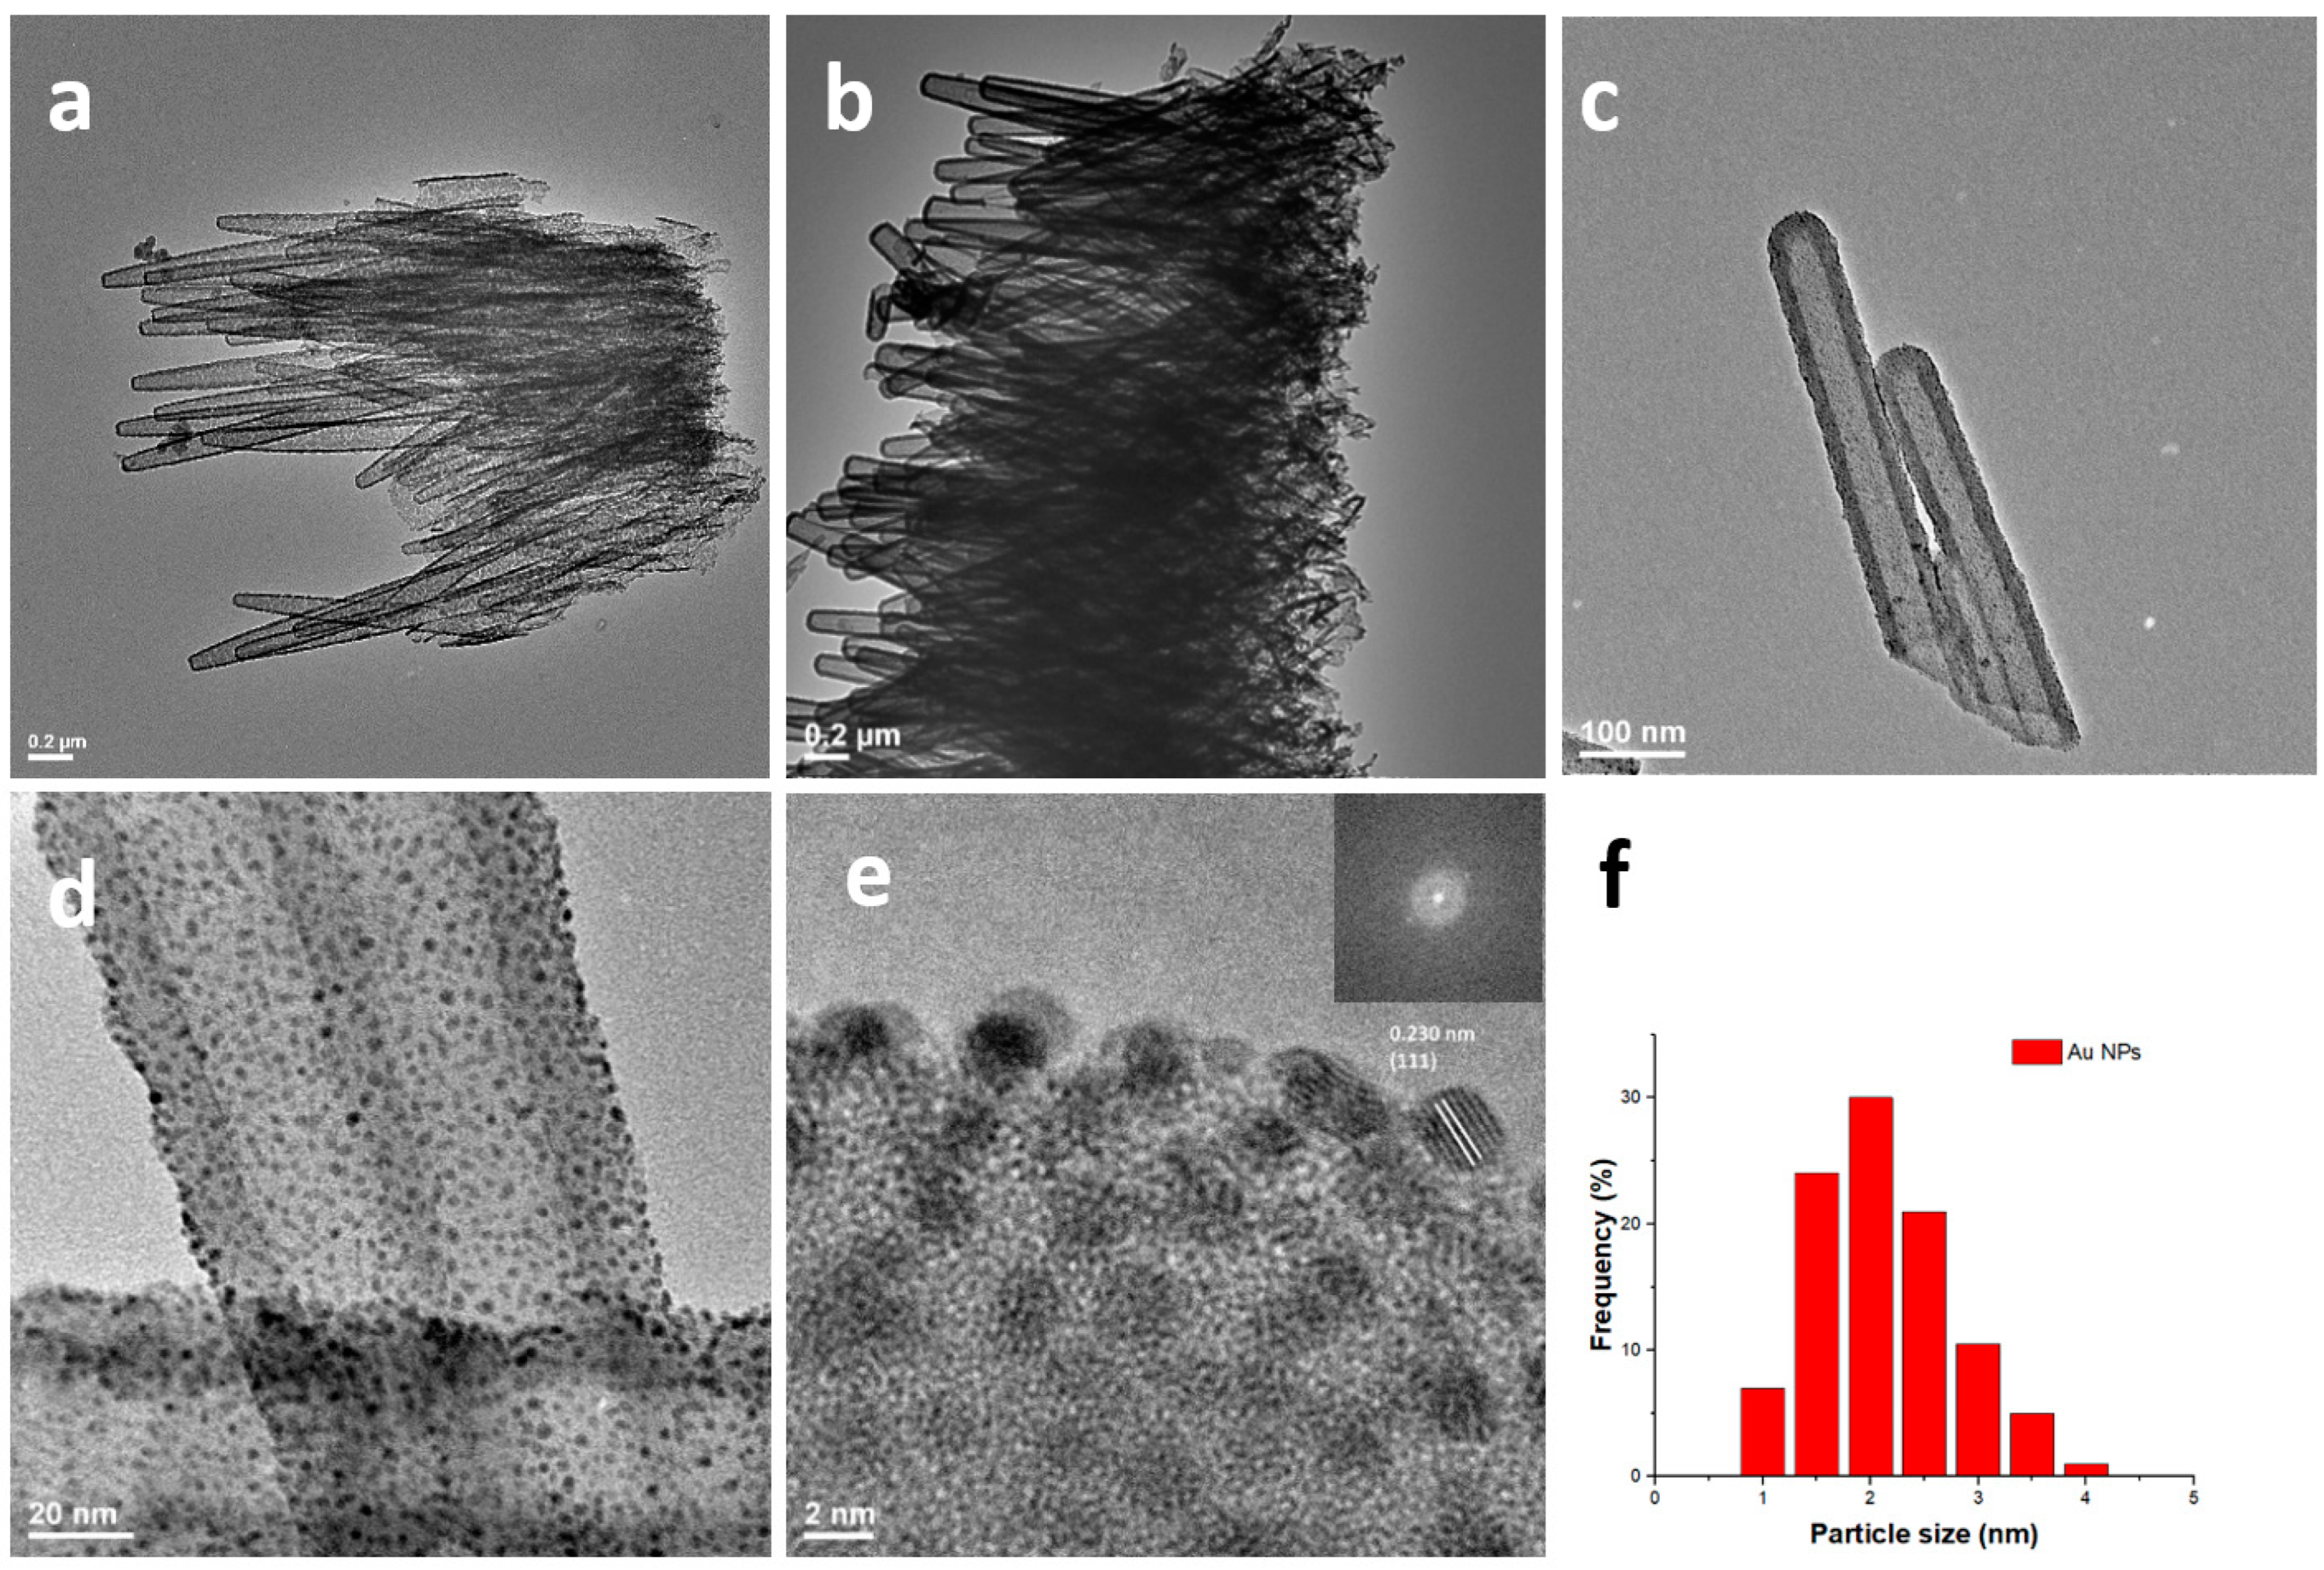
Figure S1 shows a transmission electron microscopy (TEM) image of the ZnO nanocrystals with a 1–5 nm diameter. These ZnO nanocrystals are then used as seeds to grow ZnO nanowires by the hydrothermal method as a precursor for concentration and time control over the ZnO inner diameter and length; a typical scanning electron microscopy (SEM) image of the ZnO nanowire array is shown in
Figure S2. Using this condition, we obtained a ZnO diameter ~80 nm and a ZnO length in the 1–2 µm range; however, the conditions can be modified to produce a ZnO diameter from 30 nm up to 500 nm and a length from 150 nm up to a few microns [
21]. The ZnO nanowires are used as a sacrificial template to produce the pSi NTs; the Si NTs’ shell thickness is controlled by silicon deposition with silane as a precursor diluted in helium at 530 °C by using chemical vapor deposition (CVD) if the conditions are changed during the CVD process (temperature, time, and position in the CVD chamber). The Si NTs’ shell thickness can be tuned from 10 to 80 nm. To ensure that the nanotube wall is porous, it is necessary to keep the shell thickness less than 10 nm; this porosity on the silicon nanotube surface is important for a high surface area, etching, and functionalization with APTES or other molecules.
Figure 2a shows a TEM image of the fabricated pSi NTs and demonstrates the typical porous morphology. The surfaces of the pSi NTs are then modified with 3-aminopropyltriethoxysilane (APTES), which acts as a reducing agent and helps in the formation of Au NPs, and is then followed by incubation in a solution of the gold precursor (HAuCl
4).
Figure 2b–d show TEM images of the pSi NTs with a uniform distribution of Au NPs on the surface. The size distribution of the Au NPs is shown in
Figure 2f, and the average size is about 2.37 ± 0.55 nm. High-resolution TEM (HRTEM) reveals a lattice spacing of d = 0.230 nm, which is consistent with the (111) lattice spacing of Au. The corresponding FFT (Fast Fourier Transform) is also included in the inset of
Figure 2e. A typical scanning electron microscopy (SEM) image for APTES-pSi NTs and Au NPs-pSi NTs is shown in
Figure S3a,b; respectively, SEM shows the same pSi NT morphology with and without the Au NPs. However, the contrast was different due to the presence of the Au NPs. To prove the presence of gold on the pSi NTs, the gold concentration was measured using energy dispersive X-ray spectroscopy (EDX) (
Figure S4) and was found to be 55.69 wt% for gold, 35.39 wt% for silicon, and 8.91 wt % for oxygen. MPBA was chosen as the selective linker for glucose detection in the SERS mode. This strategy is excellent for producing very small Au NPs due to the high porosity and surface of the pSi NTs and the use of APTES on the pSi NTs’ surface. Most synthetic routes to produce very small Au NPs use strong reducing agents such as NaBH
4, hydroquinone, and ascorbic acid to reduce the Au
3+ to Au
0. However, in traditional methods to produce Au NPs and avoid aggregation during synthesis and long-term storage, capping agents are added, such as poly(ethylene)glycol (PEG), polyvinylpyrrolidone (PVP), cetyltrimethylammonium bromide (CTAB) [
22]. Using APTES on the pSi NTs prevents the agglomeration of the Au NPs and thus avoids the use of capping and reducing agents for the Au NPs’ formation. The amine present from the APTES on the pSi NTs’ surface is used to coordinate the [AuCl
4]
− on the pSi NT surface, followed by the reduction of Au
3+ to Au
0. Nanopores present in the pSi NT act as a nanoreactor vessel that prevents the agglomeration of the Au NPs on the pSi NTs’ surface; a similar strategy can be used for forming pSi NTs with other NP compositions (e.g., FePt, Pt, Cu, Co). Amine group-containing molecules have been used in the literature as capping agents and reducing agents, such as triethylamine and oleyl amine, for the synthesis of metal nanoparticles [
23]. However, these methods have been used for metal nanoparticles in solution.
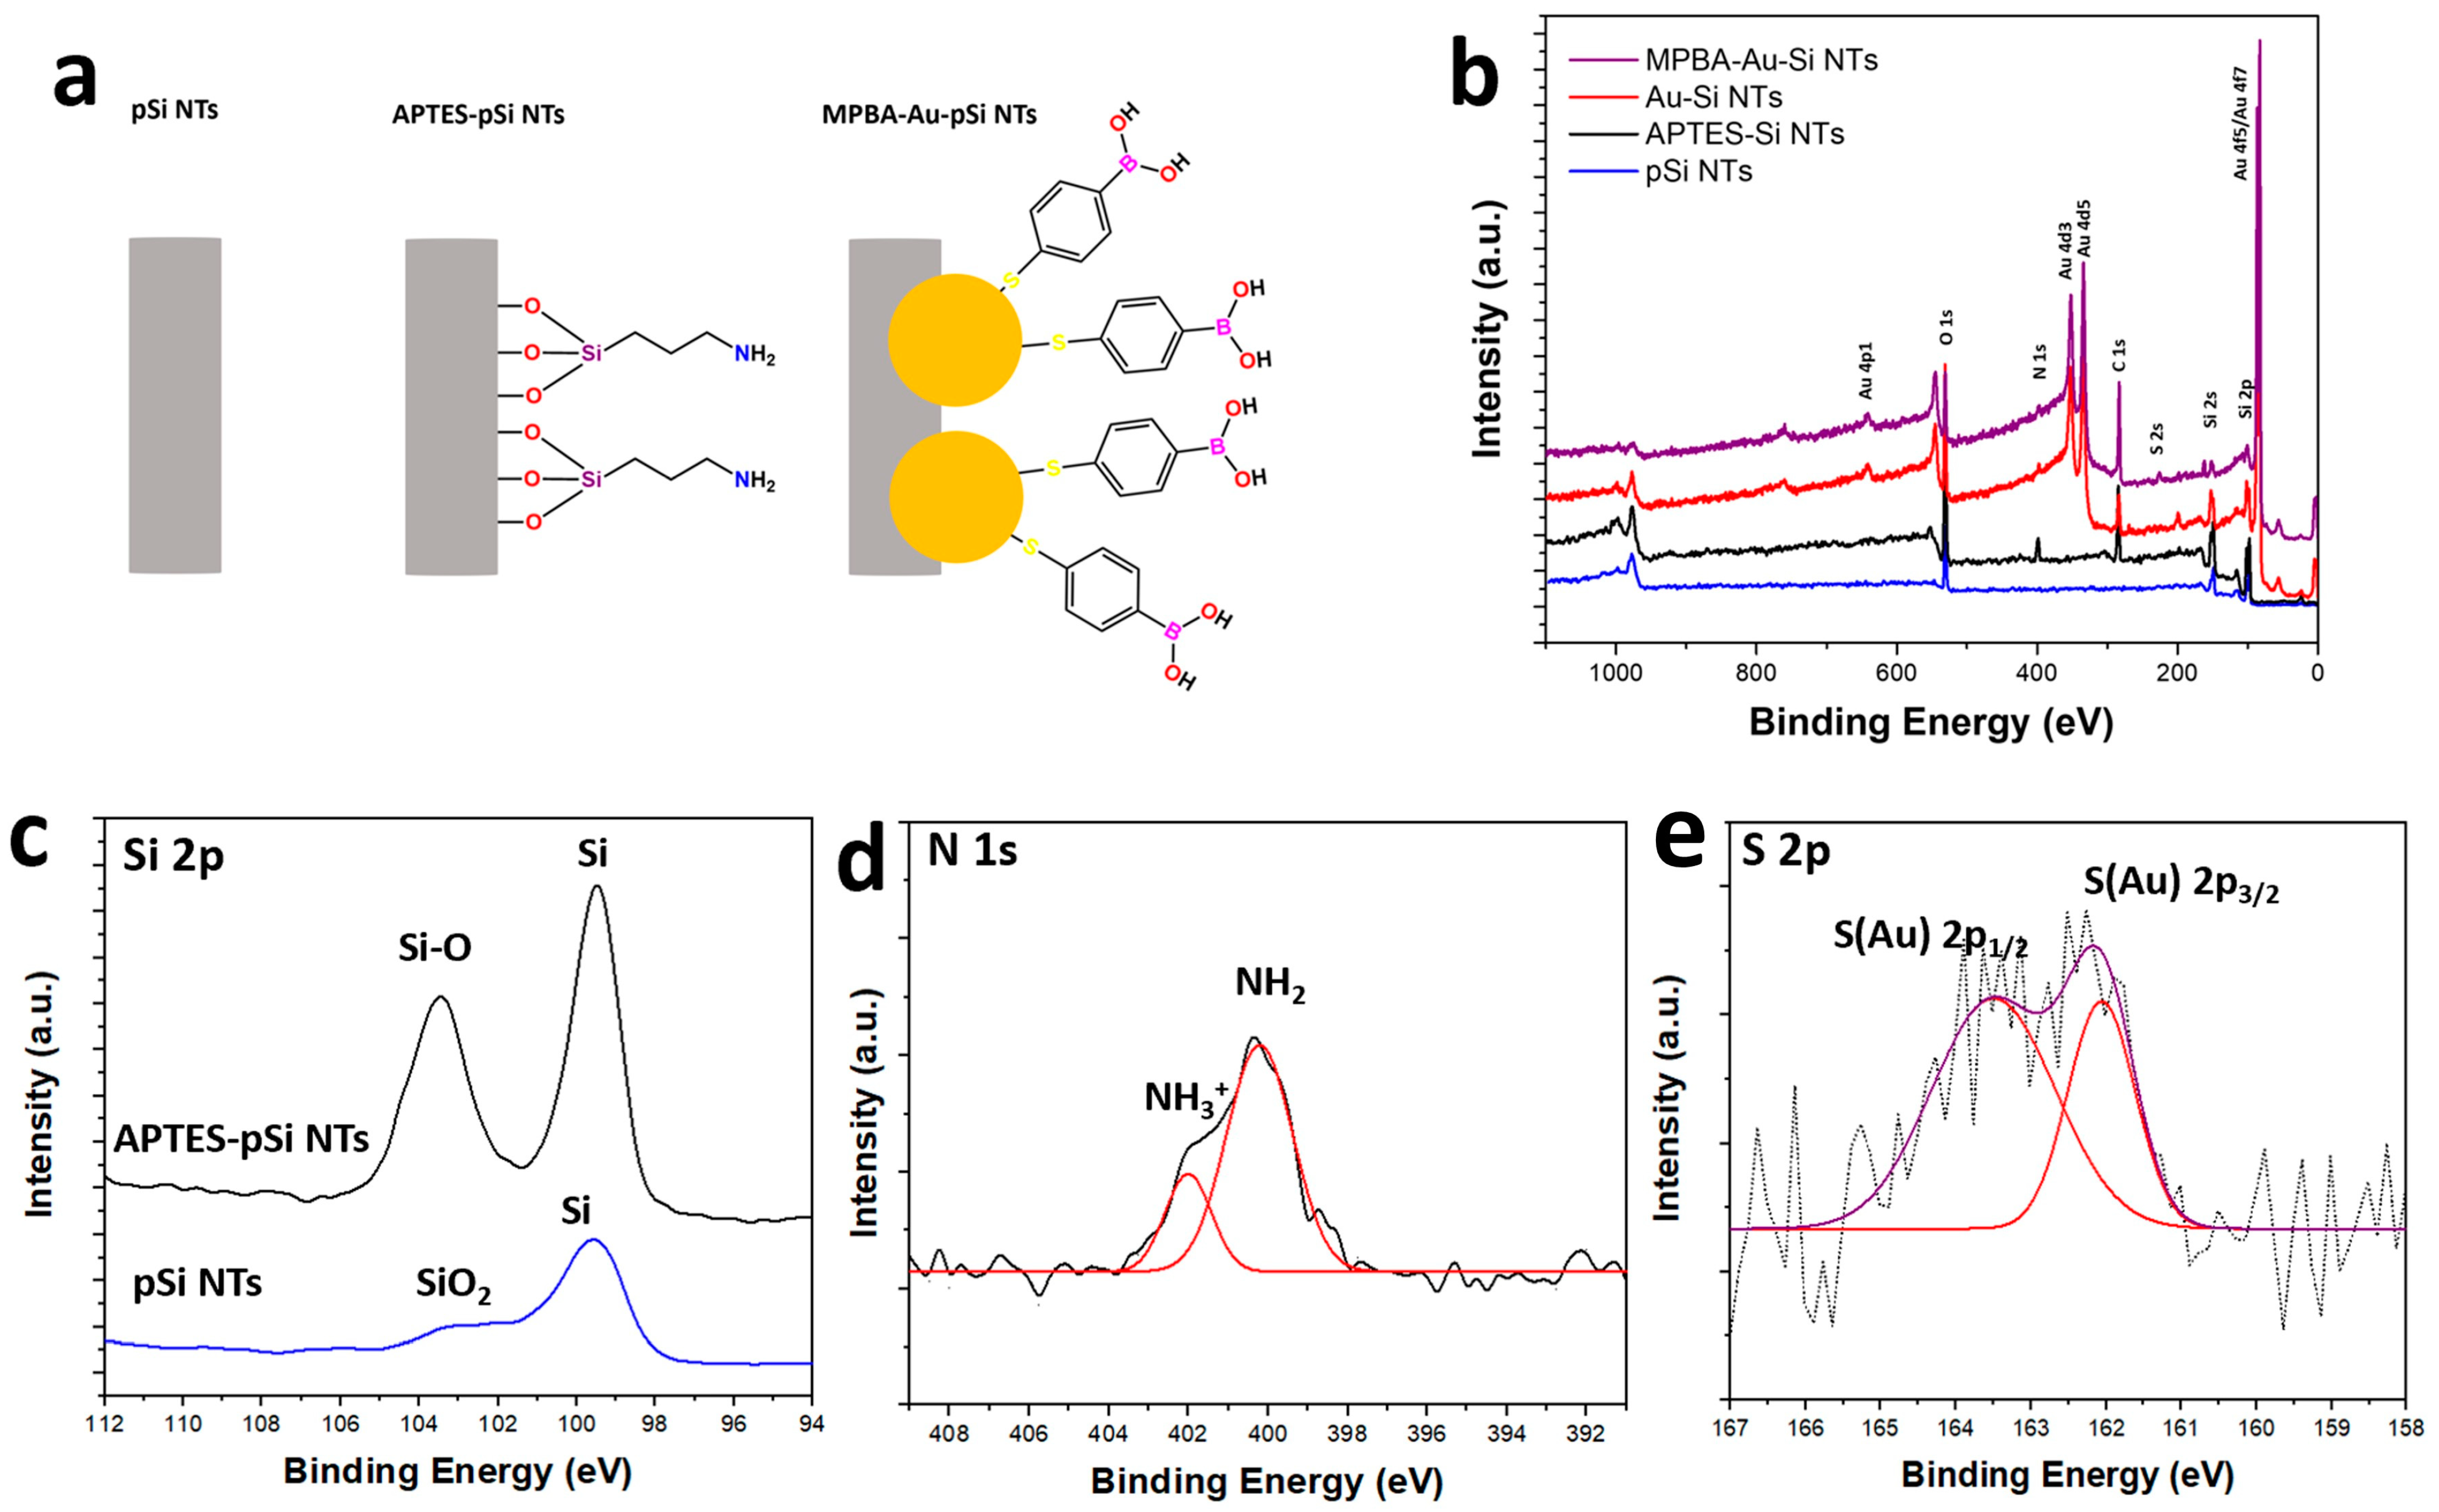
Figure 3a shows the proposed surface chemistry on the pSi NTs during the key steps for the fabrication of the SERS surface. Initially, we have the bare pSi NTs, shown in gray, followed by the APTES functionalization of the pSi NTs, the Au NPs’ formation, and finally, the MPBA functionalization for glucose detection using SERS. The surface chemistry after each step in the process was investigated using X-ray photoelectron spectroscopy (XPS).
Figure 3b shows the XPS survey spectra after each fabrication step shown in
Figure 1, i.e., (1) pSi NTs, (2) APTES-functionalized pSi NTs, (3) Au NPs formed in the modified pSi NTs by APTES, and (4) MPBA attached to Au NPs formed on the pSi NTs. The measured XPS survey spectra are consistent with the proposed surface chemistry in pSi NTs at each step. For example, the XPS of the bare pSi NTs only shows peaks associated with Si and O; this is consistent with the pSi NTs because the pSi NTs are made of silicon with a native SiO
2 layer on the surface due to oxidation when exposed to air. Next, after the APTES functionalization, N and C peaks are observed because the APTES has the NH
2 terminated group, and the C is due to the CH
2 present in the APTES as the backbone. Then, when the Au NPs are formed in APTES-pSi NTs, Au peaks appear in the spectrum; note that Cl is not present on the spectrum. This means that Au is only present on the surface and not the HAuCl
4. Finally, after the MPBA attachment, a signal from S in the MPBA structure is observed. To better understand the oxidation steps in the proposed surface chemistry, a high-resolution XPS analysis for Si 2p, N 1s, and S 2p is carried out.
Figure 3c shows the XPS peak for Si 2p, which has a component at 99.6 eV associated with Si
0 2p3/2 and a shoulder at 103.4 eV corresponding to the superficial silicon oxide layer (SiO
2). When the pSi NTs are functionalized with APTES, the Si 2p peaks associated with Si
0 and native silicon oxide are both still present. However, the aminopropyl silane (Si-O) on the silicon oxide is convoluted with the SiO
2 peak, most likely due to multilayers and monolayers of aminopropylsilane on the pSi NTs’ surface. Otherwise, if the pSi NTs are fully oxidized to SiO
2, the Si 2p peak would be located at a higher binding energy [
24].
Figure 3d shows the XPS spectrum of N 1s, taken on the APTES-pSi NTs. The N 1s signal can be deconvoluted into two peaks associated with the amine (−NH
2 at 399.8 eV) and protonated amino groups (−NH
3+ at 401.7 eV), respectively; these amino groups are responsible for the coordination of the [AuCl
4]
− and the reduction of Au
3+ to Au
0 for the Au NPs’ formation [
25].
Figure 3e shows the XPS analysis for S 2p in MPBA-Au-pSiNTs. The two peaks at 162.2 eV (S 2p
3/2) and 163.8 eV (S 2p
1/2) are known to result from sulfur bonded to Au as sulfides or thiolates [
26]. The combination of SEM, TEM, HRTEM, EDX, and XPS and Raman confirms the successful fabrication of the proposed SERS substrate based on pSi NTs with the Au NPs and the MPBA, as Raman proves the glucose detection.
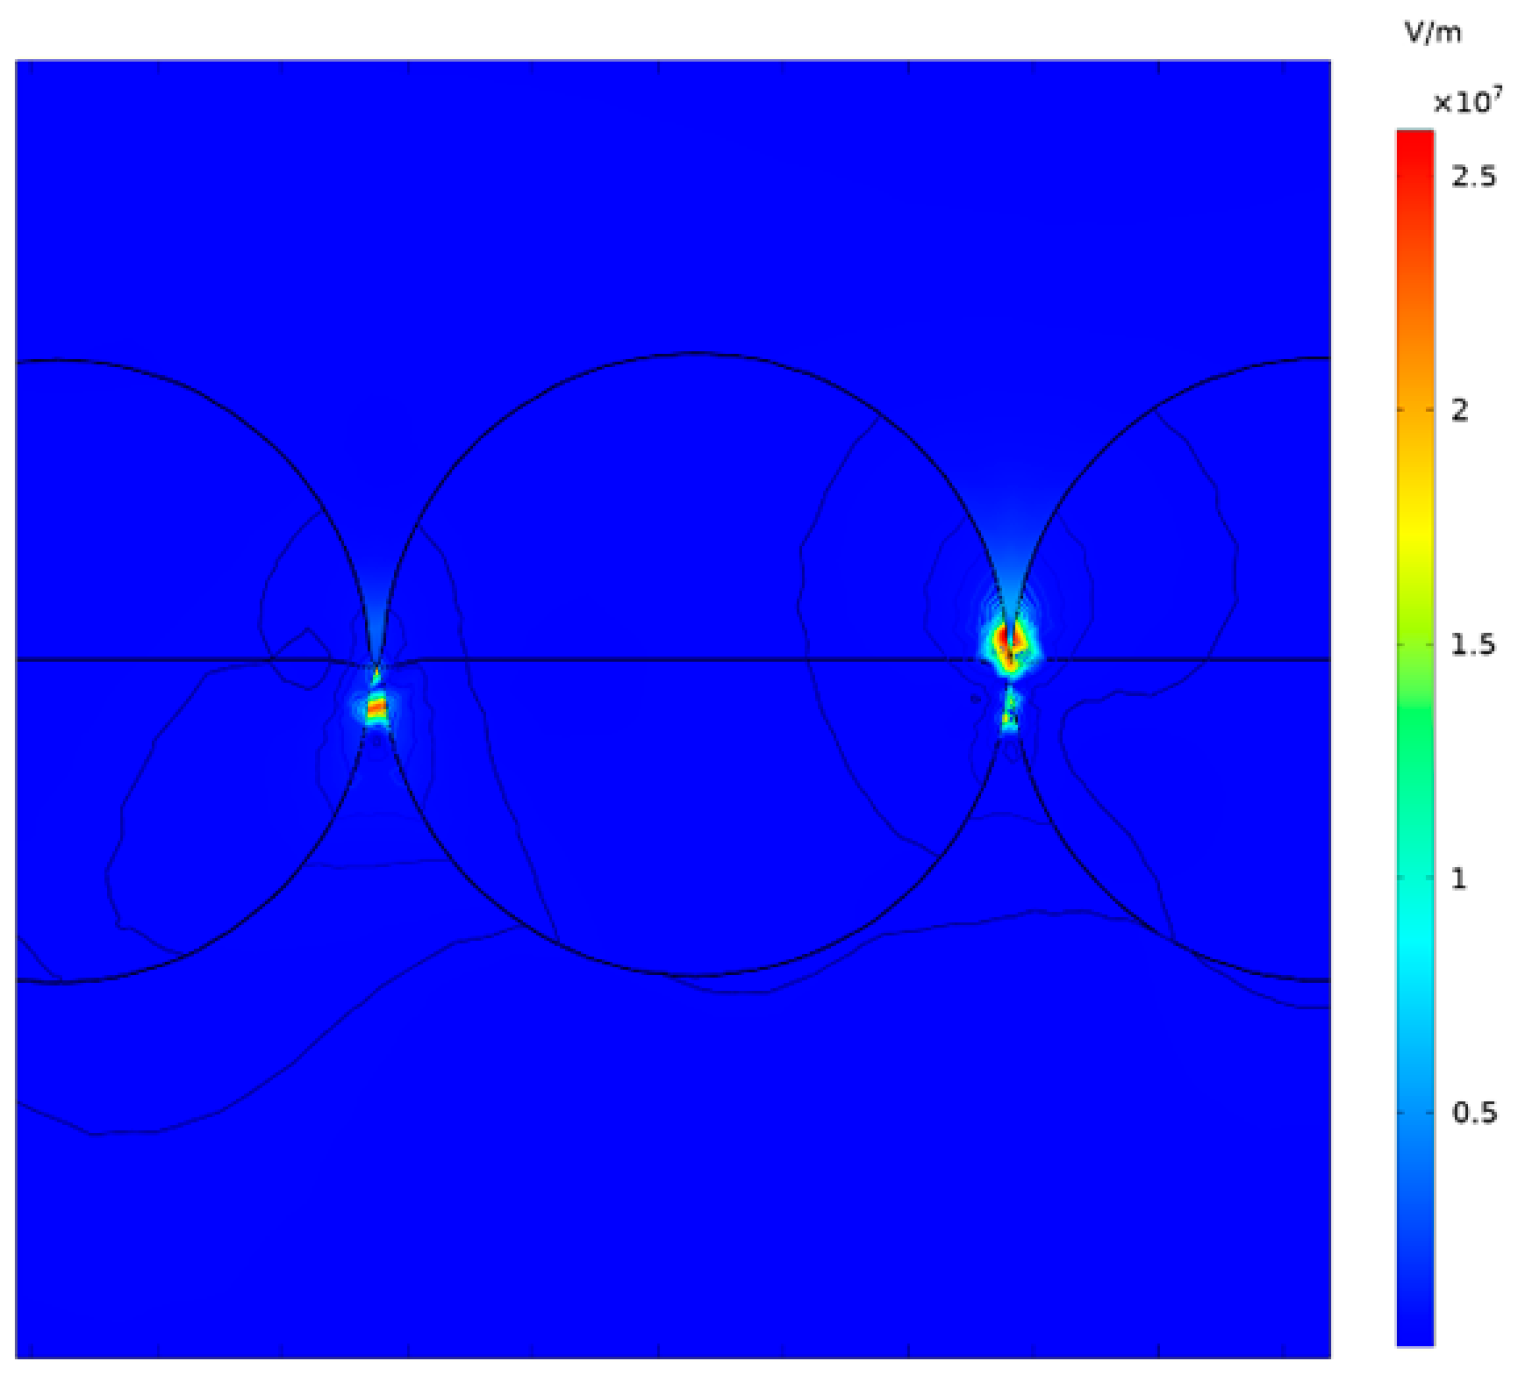
To create an SERS signal, however, a very high electric field must be created at the surface of the SERS substrate, in this case, the Au NPs on the surface of the pSi NTs. This electric field occurs only when the metal NPs such as Au, Pt, or Ag are very close together, as is the case for the Au NPs formed on the surface of the pSi NTs and MPBA as an SERS tag; this is confirmed using TEM, it shows the Au NPs with the size of ~2.37 nm with uniform distribution across the surface of the pSi NTs with an extremely small gap between the Au NPs. A numerical simulation was carried out using the RF module in the COMSOL Multiphysics 5.5 software to visualize this electric field near the Au NPs on the pSi NTs’ surface; for the COMSOL simulation, a size of 3 nm Au NPs with a very small gap of 0.2 nm between the particles was used. The separation between the nanoparticles was adopted from the experimental data as measured by TEM in
Figure 2e.
Figure 4 shows the resulting electric field (E field) color plot for the Au NPs on the pSi NTs. It shows that the E field is very strong at the interconnection point of the Au NPs and that the E field decreases exponentially away from that point. These locations with a strong E field are the so-called Raman hot spots necessary to resolve the SERS signal from MPBA as the SERS tag; this is consistent with a typical Raman hot spot created by metal nanoparticles. The Raman hot spots change based on particle geometry: composition, distribution, and separation on the surface [
27]. As a control experiment, we measured the Raman spectrum of bare pSi NTs and of Au NPs-pSi NTs with no MPBA on the Au NPs-pSi NTs surface; the Raman spectrum was taken in the presence of glucose at varying glucose concentrations in PBS. PBS was used to simulate a biological medium (0–100 mM glucose concentration), as shown in
Figure S5. The Raman peaks of bulk glucose are used as a reference and are shown in
Figure S6. Glucose was not detected when the bare pSi NTs were used, even at very high glucose concentrations (100 mM). In contrast, the glucose-associated Raman peaks appear with the use of Au NPs-pSi NTs at high glucose concentrations (~100 mM). However, the need for glucose concentrations over 100 mM for detection using the Au NPs-pSi NTs is unsuitable for human glucose detection applications because a healthy person typically has a blood glucose concentration of about 4.0–6.5 mM [
28]. We should also note that all our glucose experiments were carried out using a PBS solution with a pH of ~7.4, which is well suited to physiological media. To increase the sensitivity to glucose, we used MBPA conjugated to the Au NPs-pSi NTs due to the strong interaction of MBPA with glucose.
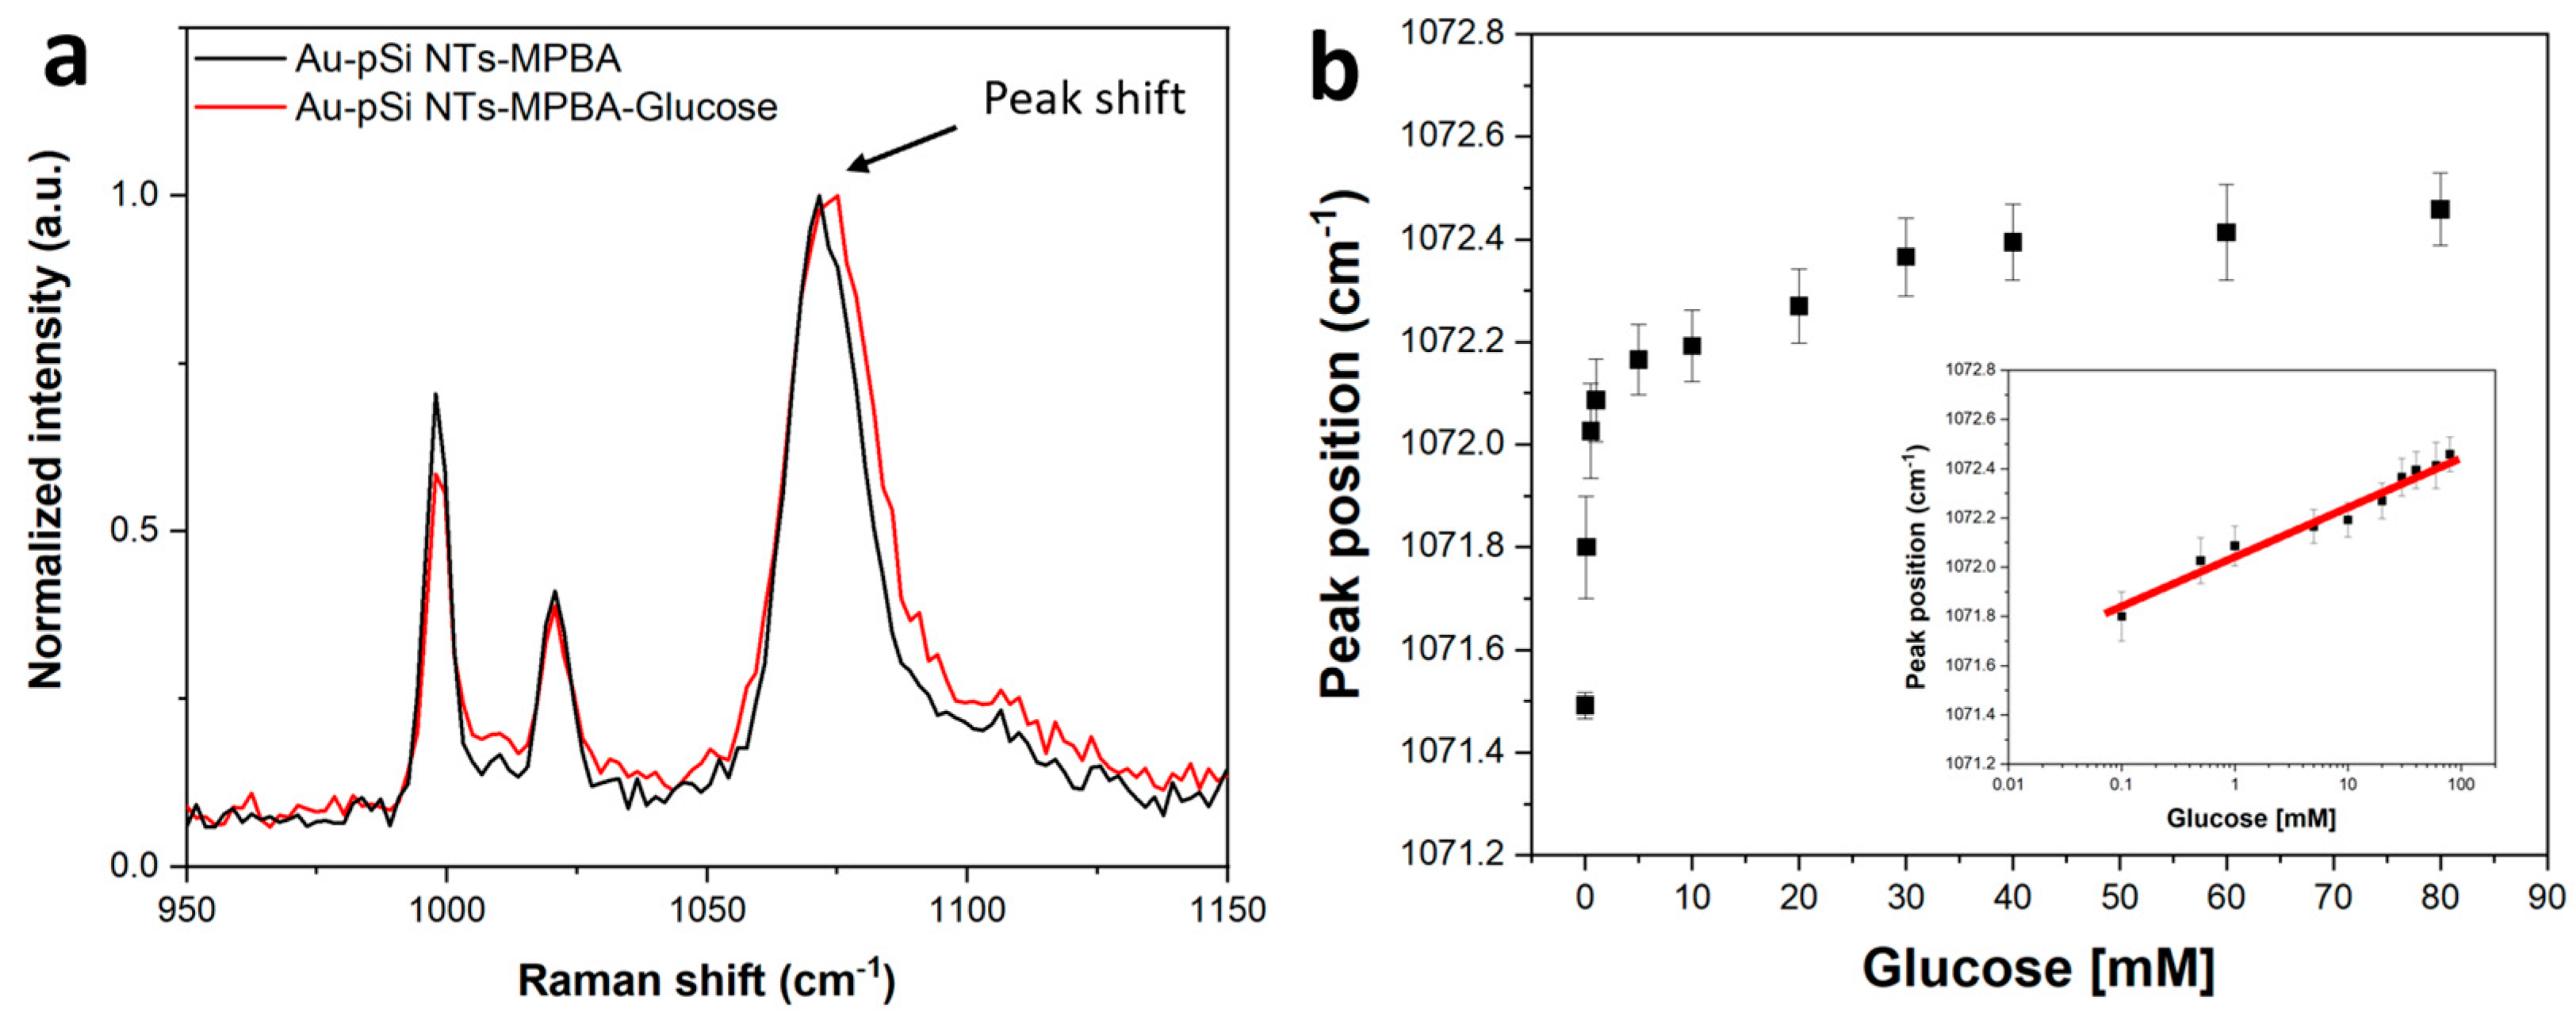
Figure 5a shows the Raman spectra of MPBA bonded to Au-NPs-pSi NTs both in the presence of glucose and without glucose. As a reference, the Raman spectra of crystalline MPBA powder are shown in
Figure S7. The Raman peak of interest is located at ~1071 cm
−1, which corresponds to the C-ring breathing mode coupled with the stretching mode C-S. The Raman spectra of MPBA were measured with different glucose concentrations in PBS using the Au-pSi NTs-MPBA. When the MPBA is bonded to glucose, a red-shift in the breathing mode associated with the Raman peak (~1071 cm
−1) is observed, as shown in
Figure 5a, while the Raman modes at 999 cm
−1 and 1020 cm
−1 for non-totally symmetric ν (CC) remain unaffected. The Raman peak at 1071 cm
−1 shows a redshift when the MPBA is bonded to glucose, which is due to the ring bending mode being affected and entering constrained breathing mode. The Raman peak shift has been used several times in the literature for sensing applications [
29]. The associated peak position changes of the 1071 cm
−1 peak as a function of glucose concentration are shown in
Figure 5b. It shows a quick shift in peak position up to a glucose concentration of 10 mM and a relatively small change above 40 mM, keeping a similar shift up to 80 mM. The inset in
Figure 5b shows the plot in log scale for the glucose concentration. It shows a linear behavior from 0.5 to 80 mM, making the limit of detection (LOD) ~0.5 mM. To ensure that the Raman shift is not caused by a pH value change, the Raman spectra of Au-Si NTs-MPBA were tested at different pH values of 4, 7, and 10, as shown in
Figure S8. No peak shift was observed at ~1071 cm
−1, confirming the Raman sensitivity to glucose other than the pH value within the biological medium. In addition to simulating other biological mediums, the SERS substrate was tested in PBS, urea, citric acid, and BSA.
Figure S9 shows the Raman spectra taken with 8 mM of glucose. The peak position does not change with the presence of different media, while the peak intensity shows a light increase for the citric acid under similar conditions. In addition, the Raman peak position is less likely to be affected by molecules of different molecular structures than glucose. This finding makes the Raman measurement suitable for glucose detection within the physiological pH range of urea: the citric acid found in urine, and BSA for the presence of proteins. However, it is not yet competitive against current enzymatic and electrochemical sensitivity tests due to the possibility of detecting the micromole range [
30]. However, this new fabrication method involving the surface modification with APTES, Au NPS, and the use of MPBA as an SERS tag on the surface of pSi NTs is compatible with the current semiconductor industry and opens the possibility for the inclusion of this type of structure in microfluidic devices and implanted chips, in addition to the use of MPBA and other SERS tags that can be used to detect other biomolecules in a pSi NT nanoarray in microfluidic devices. While a visible laser (532 nm) was used in the Raman microscope for this study, the same processes may be modified to include a near-infrared laser (NIR) capable of penetrating human skin due to human skin being transparent to NIR radiation [
31]. It would offer the capability of measuring blood glucose concentrations in real time without taking blood out of the body. A wide application for non-invasive real-time human blood glucose detection is anticipated if realized.
Table 1 summarizes the rod, pillar, and particle morphology for glucose detection by SERS. These nanorods, pillars, and particles have comparable structures with the proposed structures based on Au NPs-pSi NTs. The main sensing target is boronic-based molecules such as 4-MPBA, 4-cyanophenyl boronic acid (4-CPBA), 4-MPBA-tri osmium carbonyl cluster conjugate (OS-BA), and other molecules such as 1-decanethiol and methylene blue. Note that our system has a superior detection range and avoids the use of enzymes such as glucose oxidase (GOx) as a catalyst. The GOx can be very sensitive to the oxygen concentration in the sample. In addition, only one sensing target is required in the Au NPs-pSi NTs.

 ,
, 


