Review

Spectroscopy-Based Methods and Supervised Machine Learning Applications for Milk Chemical Analysis in Dairy Ruminants

by
Aikaterini-Artemis Agiomavriti
1,2,†,
Maria P. Nikolopoulou
3,4,†,
Thomas Bartzanas
3,
Nikos Chorianopoulos
5,
Konstantinos Demestichas
6 and
Athanasios I. Gelasakis
1,*
1
Laboratory of Anatomy and Physiology of Farm Animals, Department of Animal Science, School of Animal Biosciences, Agricultural University of Athens, Iera Odos 45 Str., 11855 Athens, Greece
2
R&D Department, TCB Avgidis Automations S.A., 11744 Athens, Greece
3
Laboratory of Farm Structures, Department of Natural Resources Management & Agricultural Engineering, Agricultural University of Athens, Iera Odos 45 Str., 11855 Athens, Greece
4
R&D Department, Telefarm S.A., 11744 Athens, Greece
5
Laboratory of Microbiology and Biotechnology of Food, Department of Food Science and Human Nutrition, Agricultural University of Athens, Iera Odos 45 Str., 11855 Athens, Greece
6
Laboratory of Computer Science, Department of Agricultural Economics, Agricultural University of Athens, Iera Odos 45 Str., 11855 Athens, Greece
*
Author to whom correspondence should be addressed.
These authors contributed equally to this work.
Chemosensors 2024, 12(12), 263; https://doi.org/10.3390/chemosensors12120263
Submission received: 2 November 2024 / Revised: 7 December 2024 / Accepted: 10 December 2024 / Published: 13 December 2024

Abstract

:
Milk analysis is critical to determine its intrinsic quality, as well as its nutritional and economic value. Currently, the advancements and utilization of spectroscopy-based techniques combined with machine learning algorithms have made the development of analytical tools and real-time monitoring and prediction systems in the dairy ruminant sector feasible. The objectives of the current review were (i) to describe the most widely applied spectroscopy-based and supervised machine learning methods utilized for the evaluation of milk components, origin, technological properties, adulterants, and drug residues, (ii) to present and compare the performance and adaptability of these methods and their most efficient combinations, providing insights into the strengths, weaknesses, opportunities, and challenges of the most promising ones regarding the capacity to be applied in milk quality monitoring systems both at the point-of-care and beyond, and (iii) to discuss their applicability and future perspectives for the integration of these methods in milk data analysis and decision support systems across the milk value-chain.

1. Introduction

It is projected that by 2050, the global population will exceed 9 billion people [1], a nearly 2-billion increase over the current population [2,3]. Most of this expansion will take place in developing countries, resulting in a sharp rise in the consumption of milk and products thereof. Indeed, in these countries, the annual milk and dairy products consumption per capita is expected to increase by 1.47 times (from 45 to 66 kg), while a respective increase by 1.04 times (from 212 to 221 kg) is expected in developed countries [4]. Moreover, consumers are increasingly concerned about the environmental, public health, and animal welfare implications associated with the intensification of livestock production [3,4,5]. This situation has placed immense pressure on the dairy ruminant sector to find sustainable solutions for the optimization of the milk production systems and the minimization of the environmental impact,(e.g., rising water consumption, land and ecosystems degradation, increased greenhouse gas emissions, waste of natural resources, loss of biodiversity, etc). Toward this target, precision livestock farming (PLF) technologies have emerged as critical tools for the mitigation of environmental impacts and essential components of sustainable production and evidence-based herd health management. Thus, sensors, animal-recording technologies, artificial intelligence (AI), and robotic systems, as well as life cycle assessment (LCA) methods, are utilized by modern dairy farms to significantly reduce their environmental footprint and improve their profitability [6].
It is undeniable that milk and products thereof are listed among the most valuable agricultural commodities, due to their high nutritional value in human diets [7]; therefore, milk production is an essential asset to global societies and economies. Moreover, milk quality is significant for the milk processing industry, directly affecting the technological properties, organoleptic traits, hygiene status, and overall acceptance of the derived dairy products and, subsequently, the market value of milk. Therefore, milk quality and safety must be efficiently evaluated and managed to satisfy consumer demands, meet legal requirements, and ensure transparency and fair pricing for the farmers. Moreover, systematic assessment of milk chemical composition (i) facilitates efficient monitoring of its intrinsic quality, (ii) supports early detection and prevention of milk fraud, as well as intramammary infections and mastitis, and (iii) decreases the time, effort, and expenses demanded for routine laboratory milk analyses [8,9].
Despite the efficiency of the traditional laboratory-based methods utilized for the assessment of milk quality, they require expensive equipment, specialized staff, well-organized logistics, time-consuming (>48 h), labor intensive and destructive/invasive sampling, transferring, and analytical processes; thereby, crucial information sharing and farming decisions are delayed. The potential to monitor milk quality on-site has lately been made possible by the development of portable and handheld devices intended for use at the point-of-care (POC), following the recent advances in chemometric and optical sensor technologies. The primary advantages of these technologies are their capacity to collect enormous data volume, their accuracy, and the real-time output [3]. This is consistent with the idea of PLF, which is defined by Tullo et al. as “the application of process engineering principles and techniques to livestock farming to automatically monitor, model, and manage animal production” [10]. These sensors offer accurate and reliable measurements of milk quality traits, its origin and adulteration, and the udder health status of animals, allowing systematic non-invasive monitoring, even when needed to be applied in situ and at the individual animal level [11,12]. Also, they collect data, which are then processed by algorithms and stored in databases for later use in decision support systems (DSS).
Among optical technologies, spectroscopy-based methods have emerged as promising tools for milk chemical analyses. Indeed, methods such as Raman spectroscopy, near-infrared spectroscopy (NIRS), mid-infrared spectroscopy (MIRS), and laser-induced breakdown spectroscopy (LIBS) provide rapid, non-invasive, and precise evaluation of milk components such as fat, protein, lactose, and others, as well as indications of the milk origin, adulteration, and occurrence of drug residues. Combining spectroscopic techniques with advanced machine learning (ML) algorithms like support vector machines (SVM), random forests (RF), logistic regression (LR), elastic net (EN), k-Nearest Neighbors (k-NN), neural networks (NN), and gradient boosting machines (GBM) can remarkably improve the diagnostic performance of these technologies. Hence, utilizing spectroscopic milk analysis and advanced ML methods, key applications in the field of milk analysis, have been released and are expected to be further developed for the assessment and prediction of milk traits and properties.
The objectives of the current review were (i) to present the use of spectroscopy-based techniques for milk analyses, emphasizing their specific applications and their potential integration into contemporary dairy management systems, (ii) to compare the performance and adaptability of the available spectroscopic methods, providing insights into the strengths, weaknesses, opportunities, and challenges of the most efficient relevant technologies for upgrading milk quality monitoring systems in dairy farms, and (iii) to discuss the applicability and performance of ML techniques for milk data analysis systems and prediction models to facilitate quicker and better-informed DSS.

2. Spectroscopy Principles
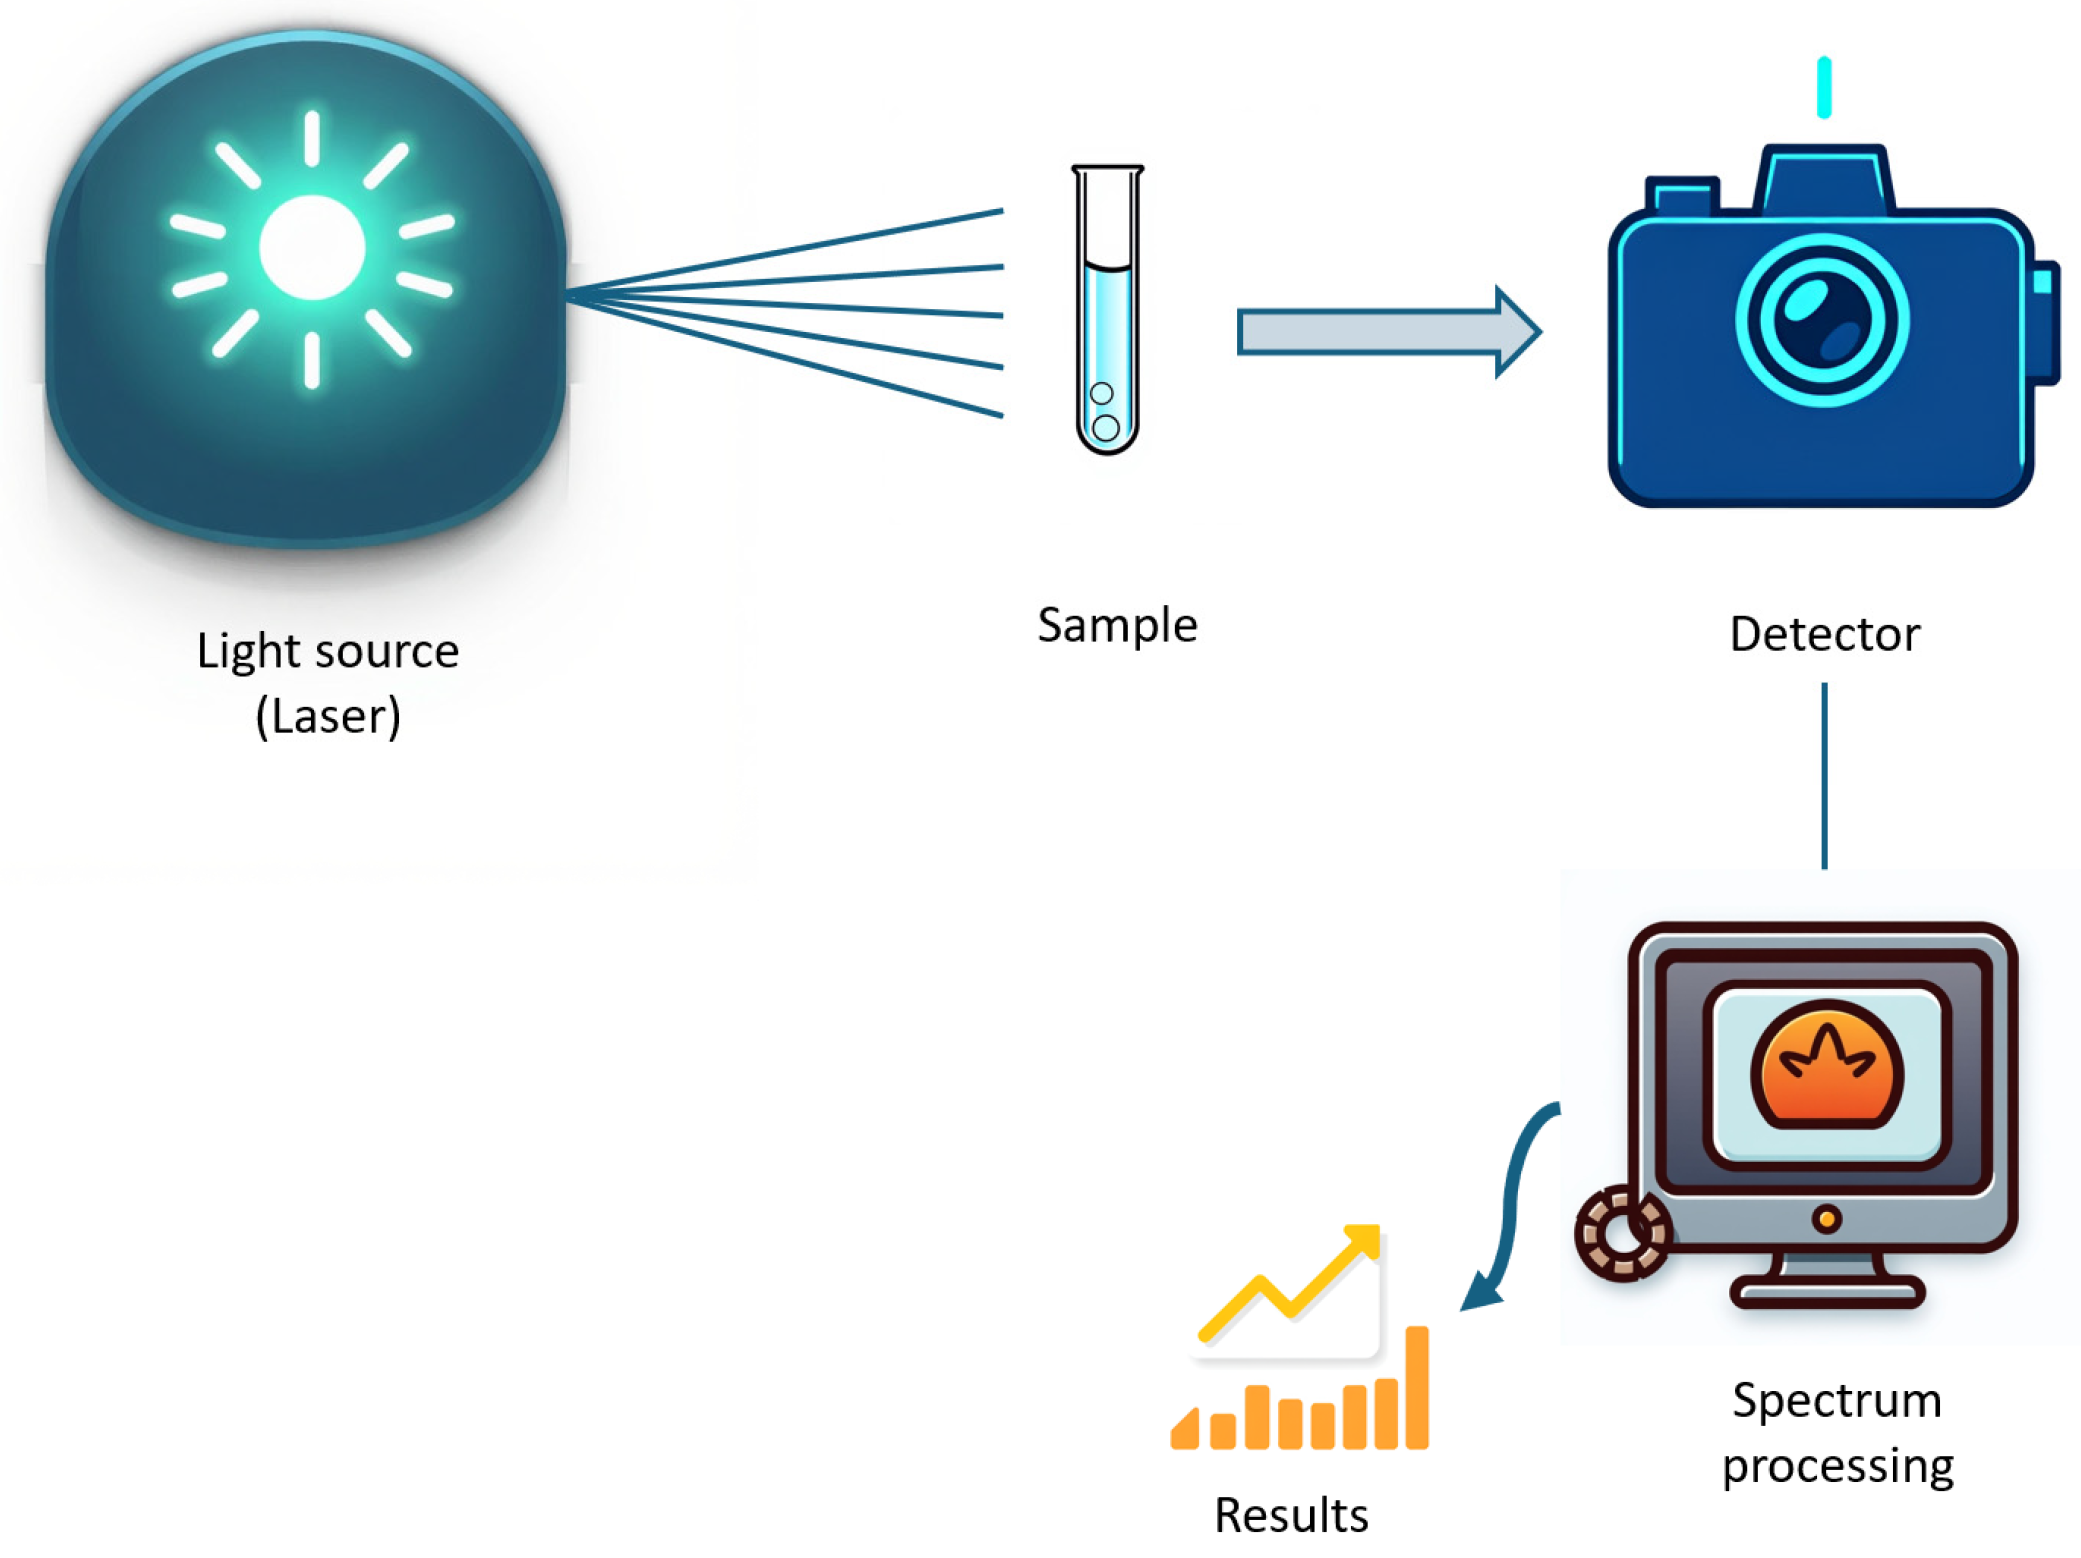
2.1. Spectroscopy

The study of how light interacts with matter is known as spectroscopy [13]. The energy of light is proportional to its frequency and inversely proportional to its wavelength. The relationship is described by the following equation:
Ε = h × f
where E is the energy of the light in J , h is the Planck’s constant 6.62 × 10 34   J × H z 1 , and f is the frequency of the light in H z .
Alternatively, since the frequency is related to the wavelength ( λ ) by the speed of light ( c ) (where c = λ × f ), the energy can also be expressed as
E = h × c λ
where λ is the wavelength of the light in m and c is the speed of light ( 3 × 10 8   m / s ) .
In methodological terms, spectroscopy can be defined as the process of analyzing the spectrum of light that a substance absorbs, emits, or scatters in order to determine its physical structure, molecular composition, and other properties [14].

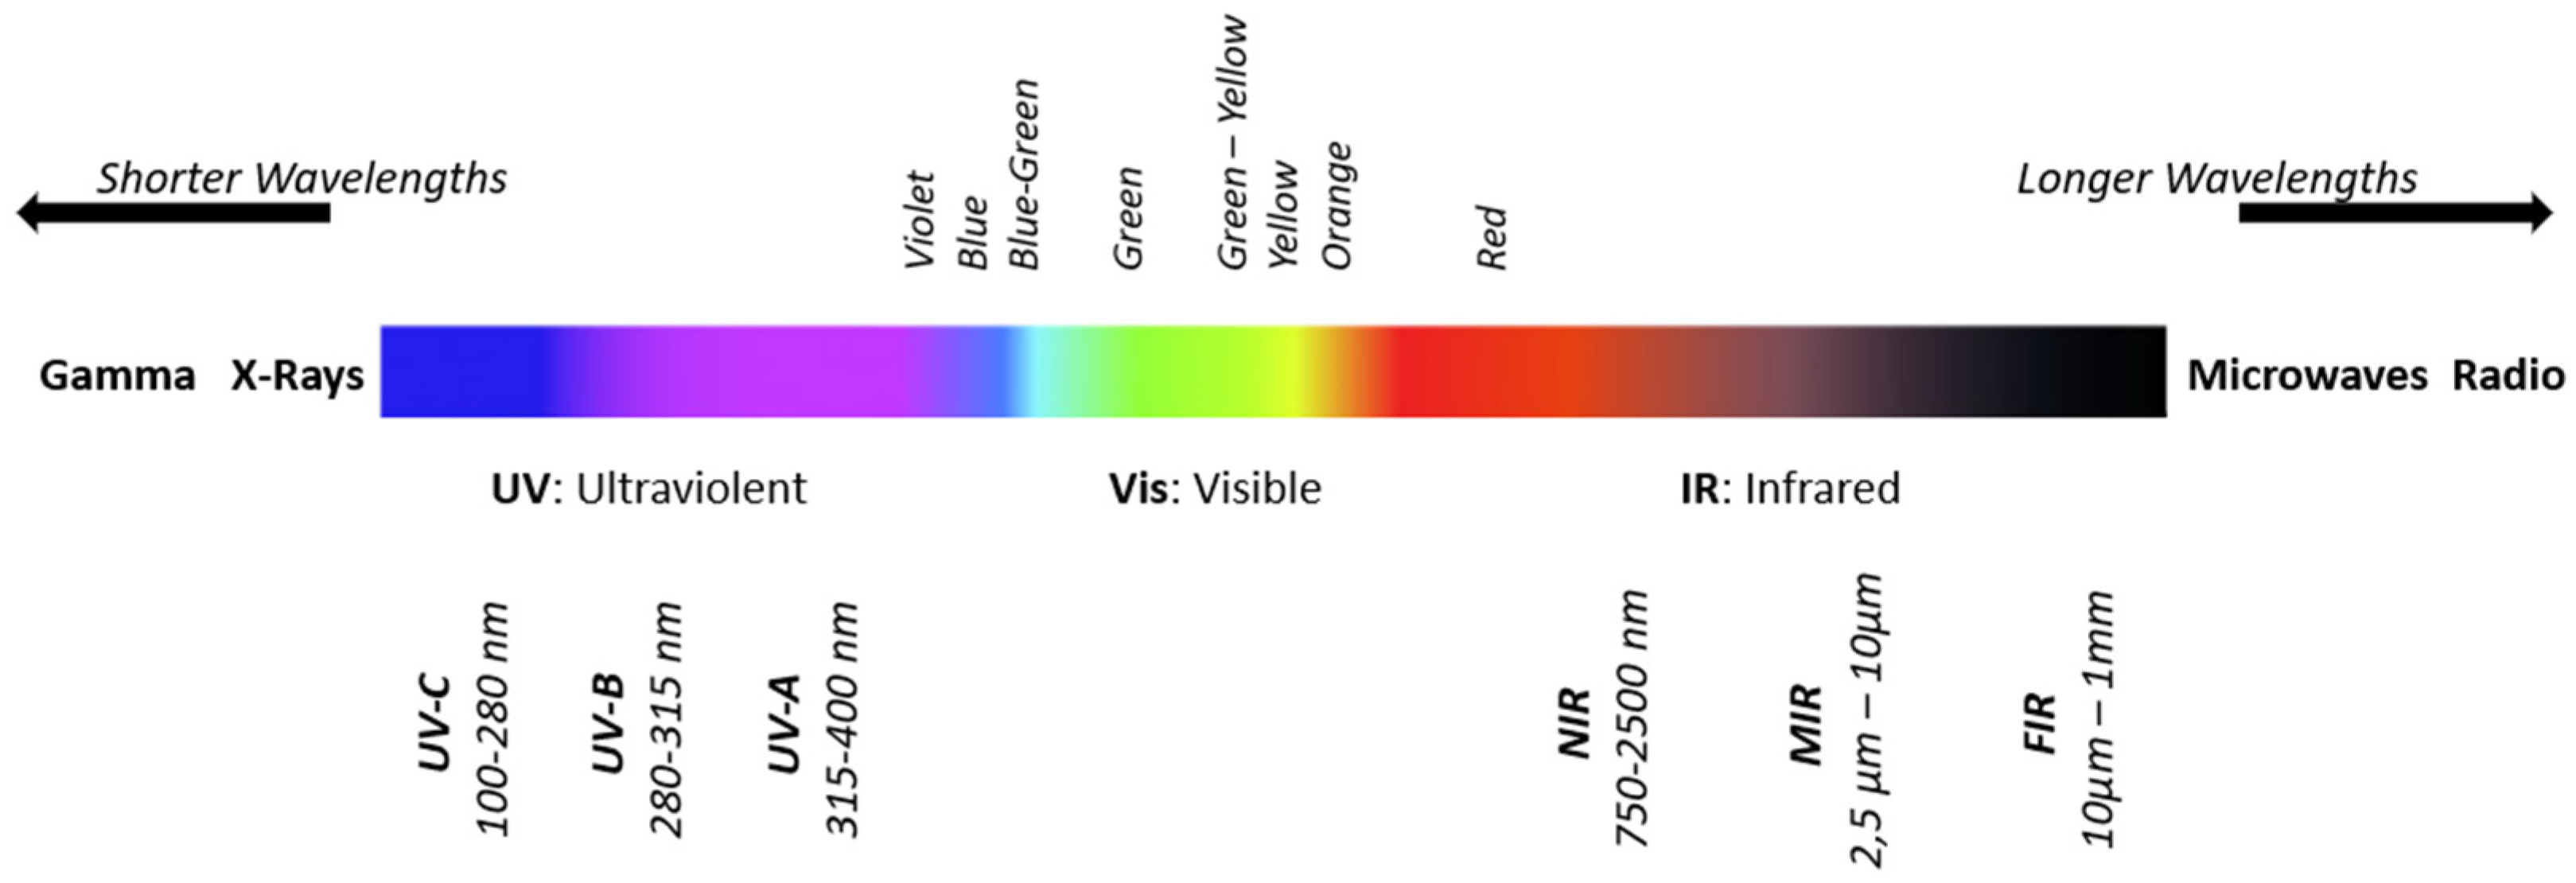
2.2. The Infrared Region of the Electromagnetic Spectrum

Located in the middle of the electromagnetic spectrum, the infrared (IR) region is divided into three main subregions: Far-Infrared (FIR), with wavelengths ranging from 1 mm to 10 μm, Mid-Infrared (MIR), from 10 μm to 2.5 μm, and Near-Infrared (NIR), which refers to the portion of the electromagnetic spectrum closest to the visible region, with its wavelengths ranging from approximately 750 nm to 2500 nm [15]. Figure 1 illustrates the electromagnetic spectrum including the Visible (Vis) region from 380 nm to 750 nm and Ultraviolet (UV) region from 10 nm to 400 nm. William Herschel is credited with discovering near-infrared radiation in 1800. Herschel observed that light temperature rose from the blue (450–475 nm) to the red (620–750 nm) end of the spectrum while using a thermometer in his experiments. The temperature increased even after the thermometer was positioned beyond the visible red region, suggesting existence of energy beyond the visible spectrum [15,16]. The development of NIR spectroscopy, a potent analytical tool for analyzing the chemical and physical properties of materials, was made possible by this discovery.

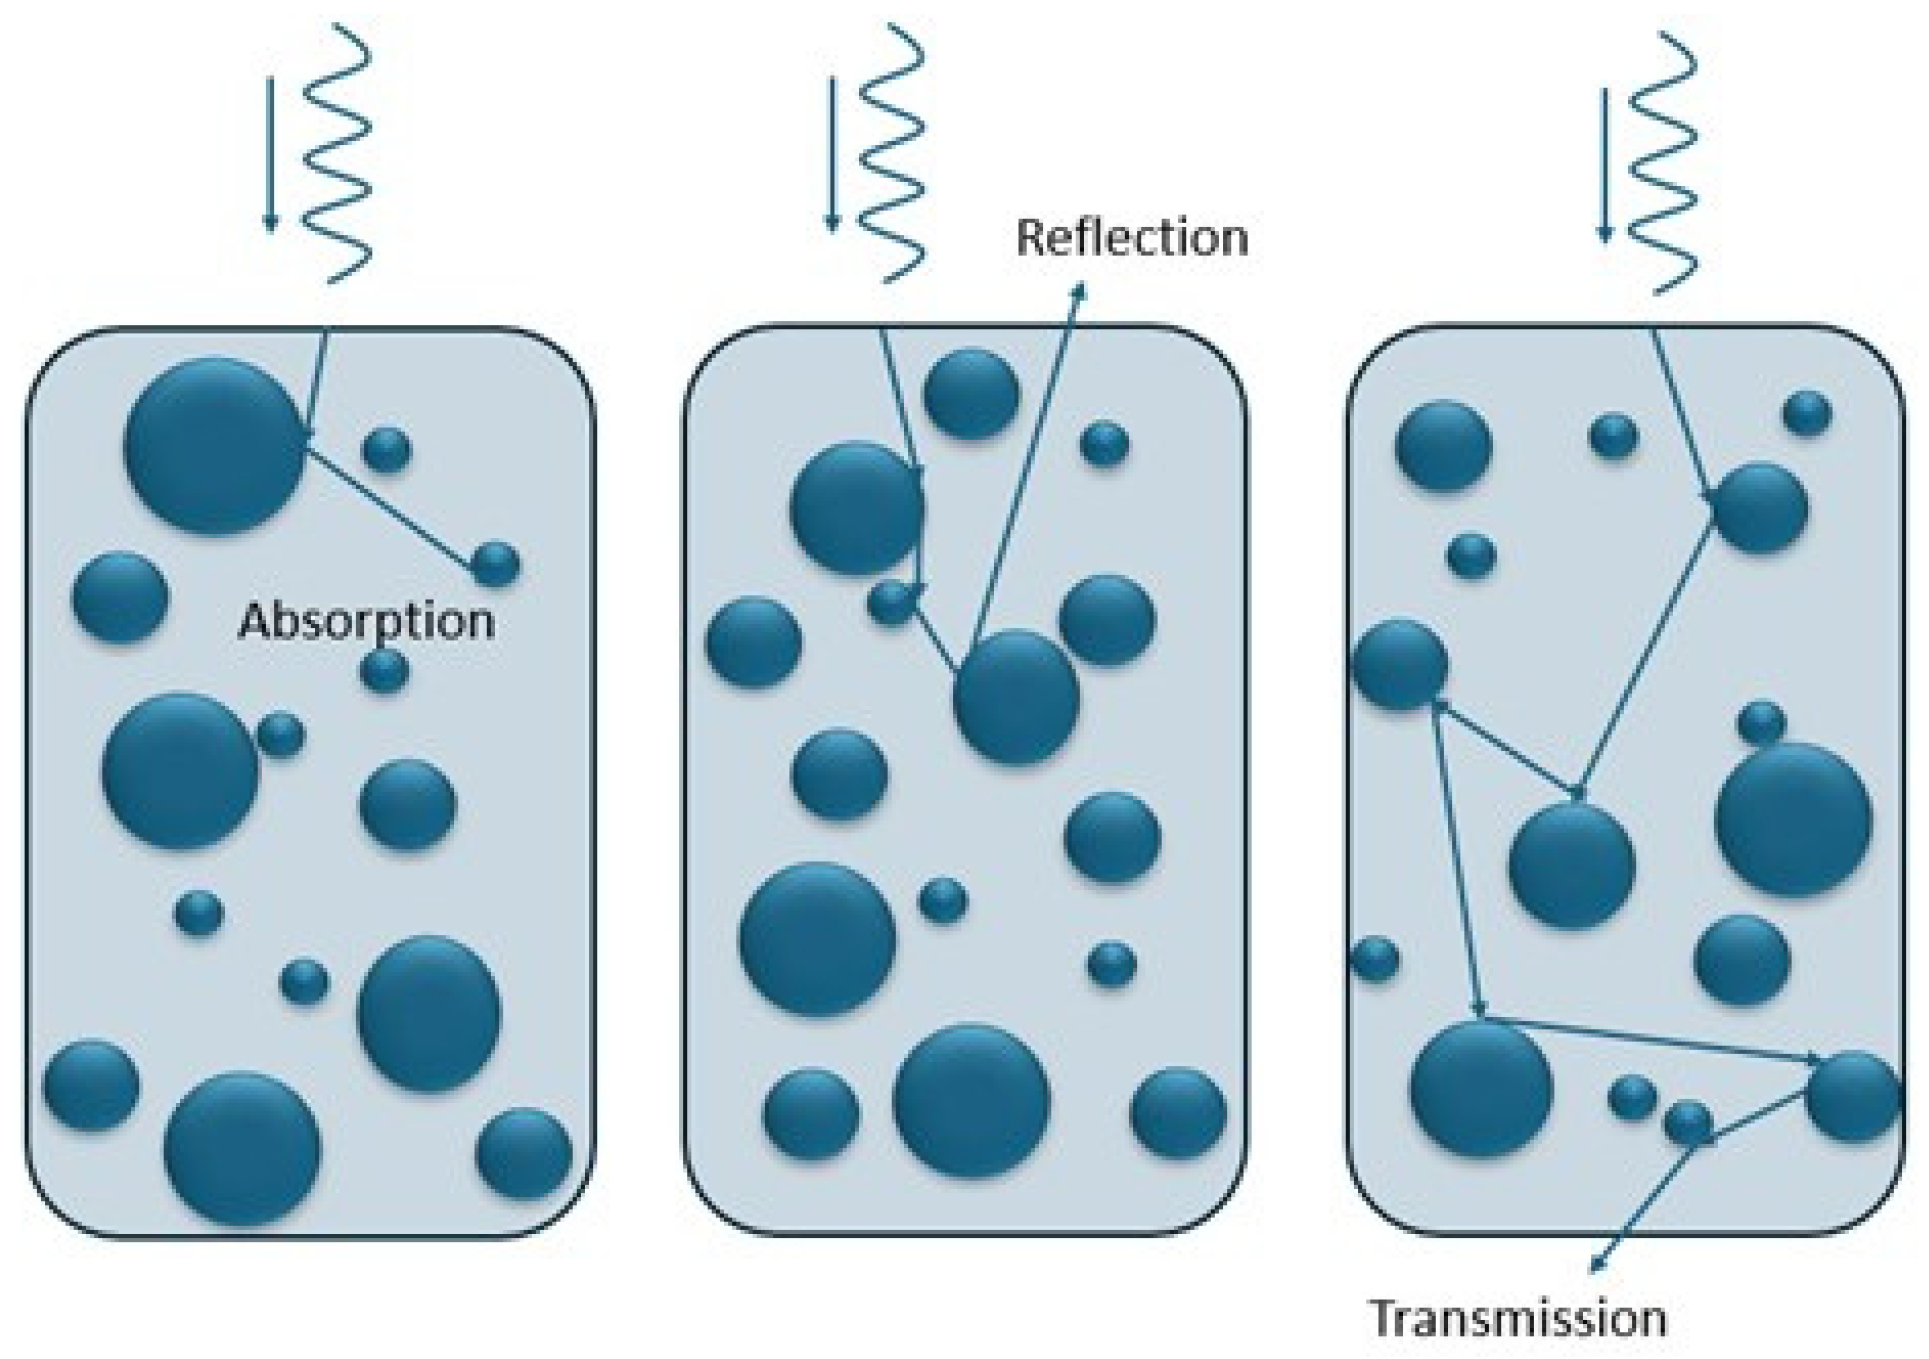
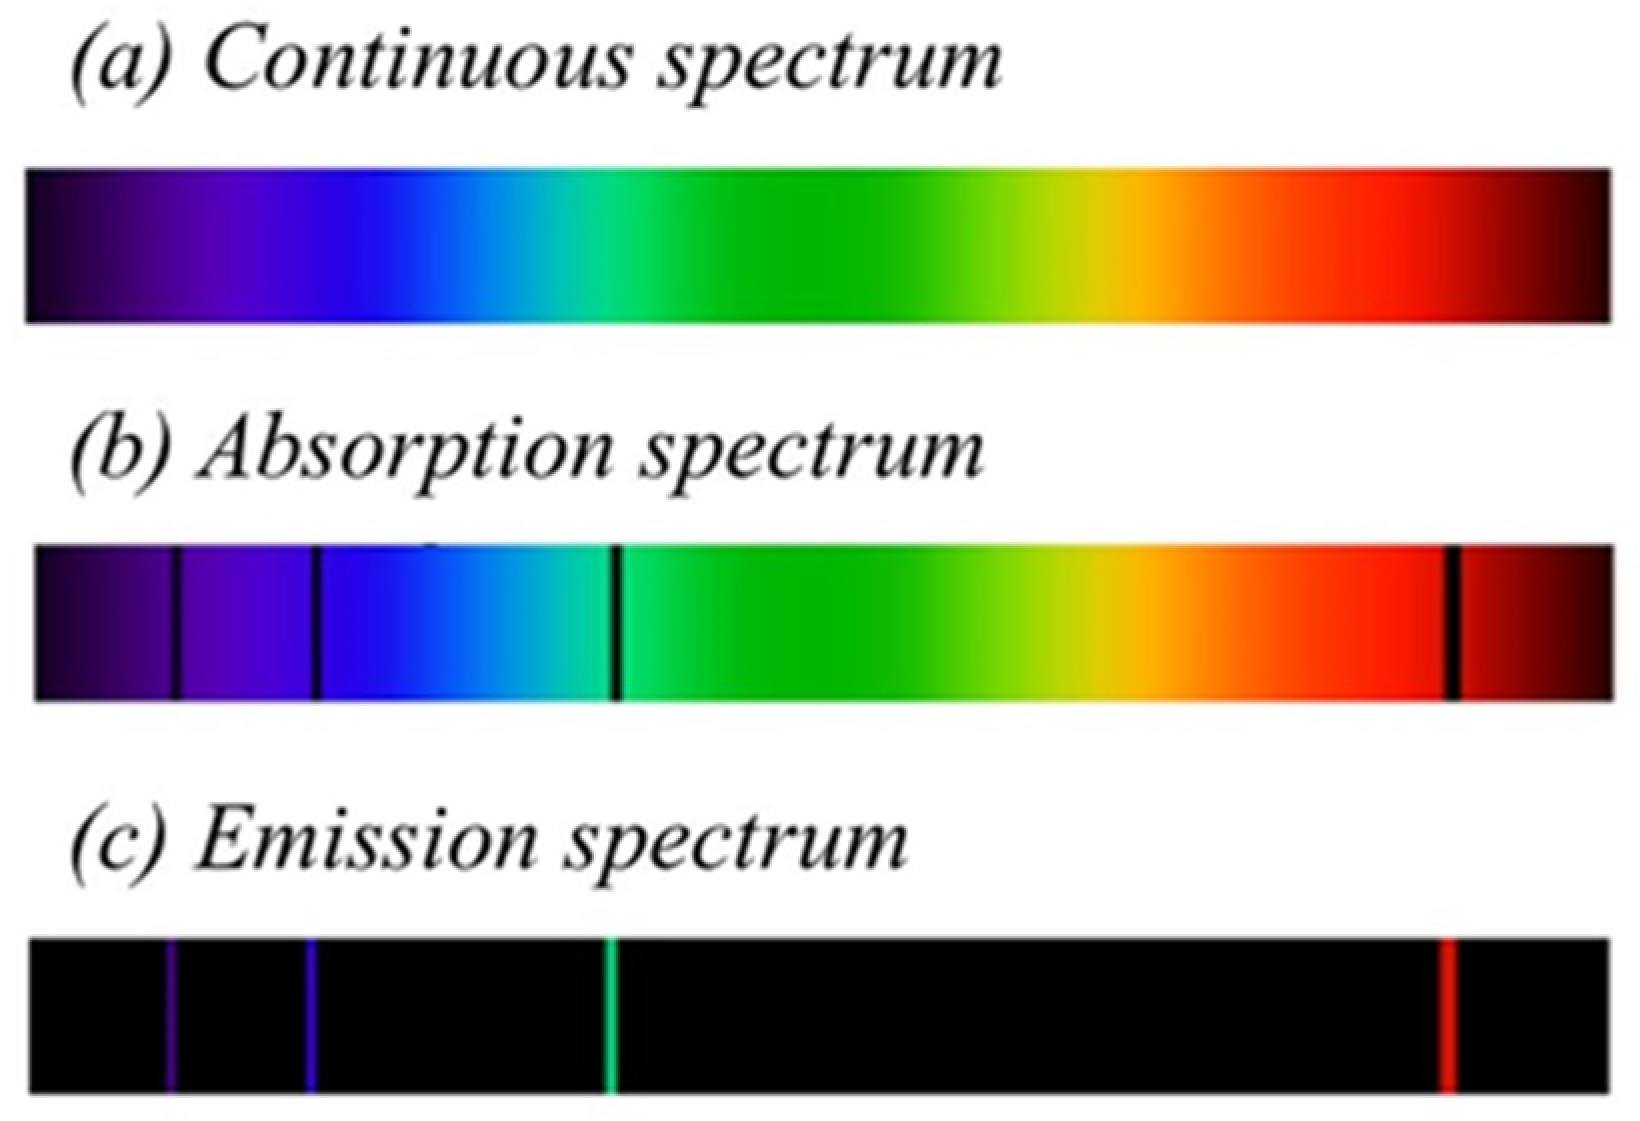
2.3. Transmittance, Reflectance, Absorption, and Emission of Light

Transmittance ( T ) indicates the amount of incident light that can pass through a material. Reflectance R is defined as the amount of incident light reflected by the material’s surface, while absorbance is defined as the amount of incident light not reflected or transmitted but absorbed by the material (Figure 2). The conservation of energy requires that
T + R + A = 1
where ( T ) is the transmittance, R is the reflectance, and A the absorbance.
The natural frequency of an atom is the frequency at which its electrons vibrate spontaneously. When atoms of a material vibrate at the same frequency with a light wave, their electrons absorb the wave’s energy and start to vibrate as well. Objects vary in color because the electrons of different materials’ atoms vibrate at different frequencies and therefore absorb different light frequencies. Electrons in atoms are confined to distinct energy levels or electron shells.
The lowest possible energy state is known as the ground state. According to the quantization of energy levels, electrons can move from a lower energy state to a higher one only by absorbing a discrete amount (quanta) of energy described by the laws of quantum mechanics. The difference between the two energy levels must be represented by the absorbed energy. When an electron absorbs energy, it is excited to a higher energy state and moves away from the nucleus of the atom. Electrons, however, do not remain excited for very long. After briefly being in this higher energy state, they return to their original ground state, releasing the absorbed energy in the form of photons. As stated in Kirchoff ’s radiation law, the energy of the emitted photons corresponds precisely to the amount of energy initially absorbed by the electrons. This process of light emission is called fluorescence and is a subcategory of luminescence.
Fluorescence is a rapid form of luminescence that starts very shortly after light absorption and ends almost immediately when the light source is removed. Luminescence is the general term for light emission without heat.

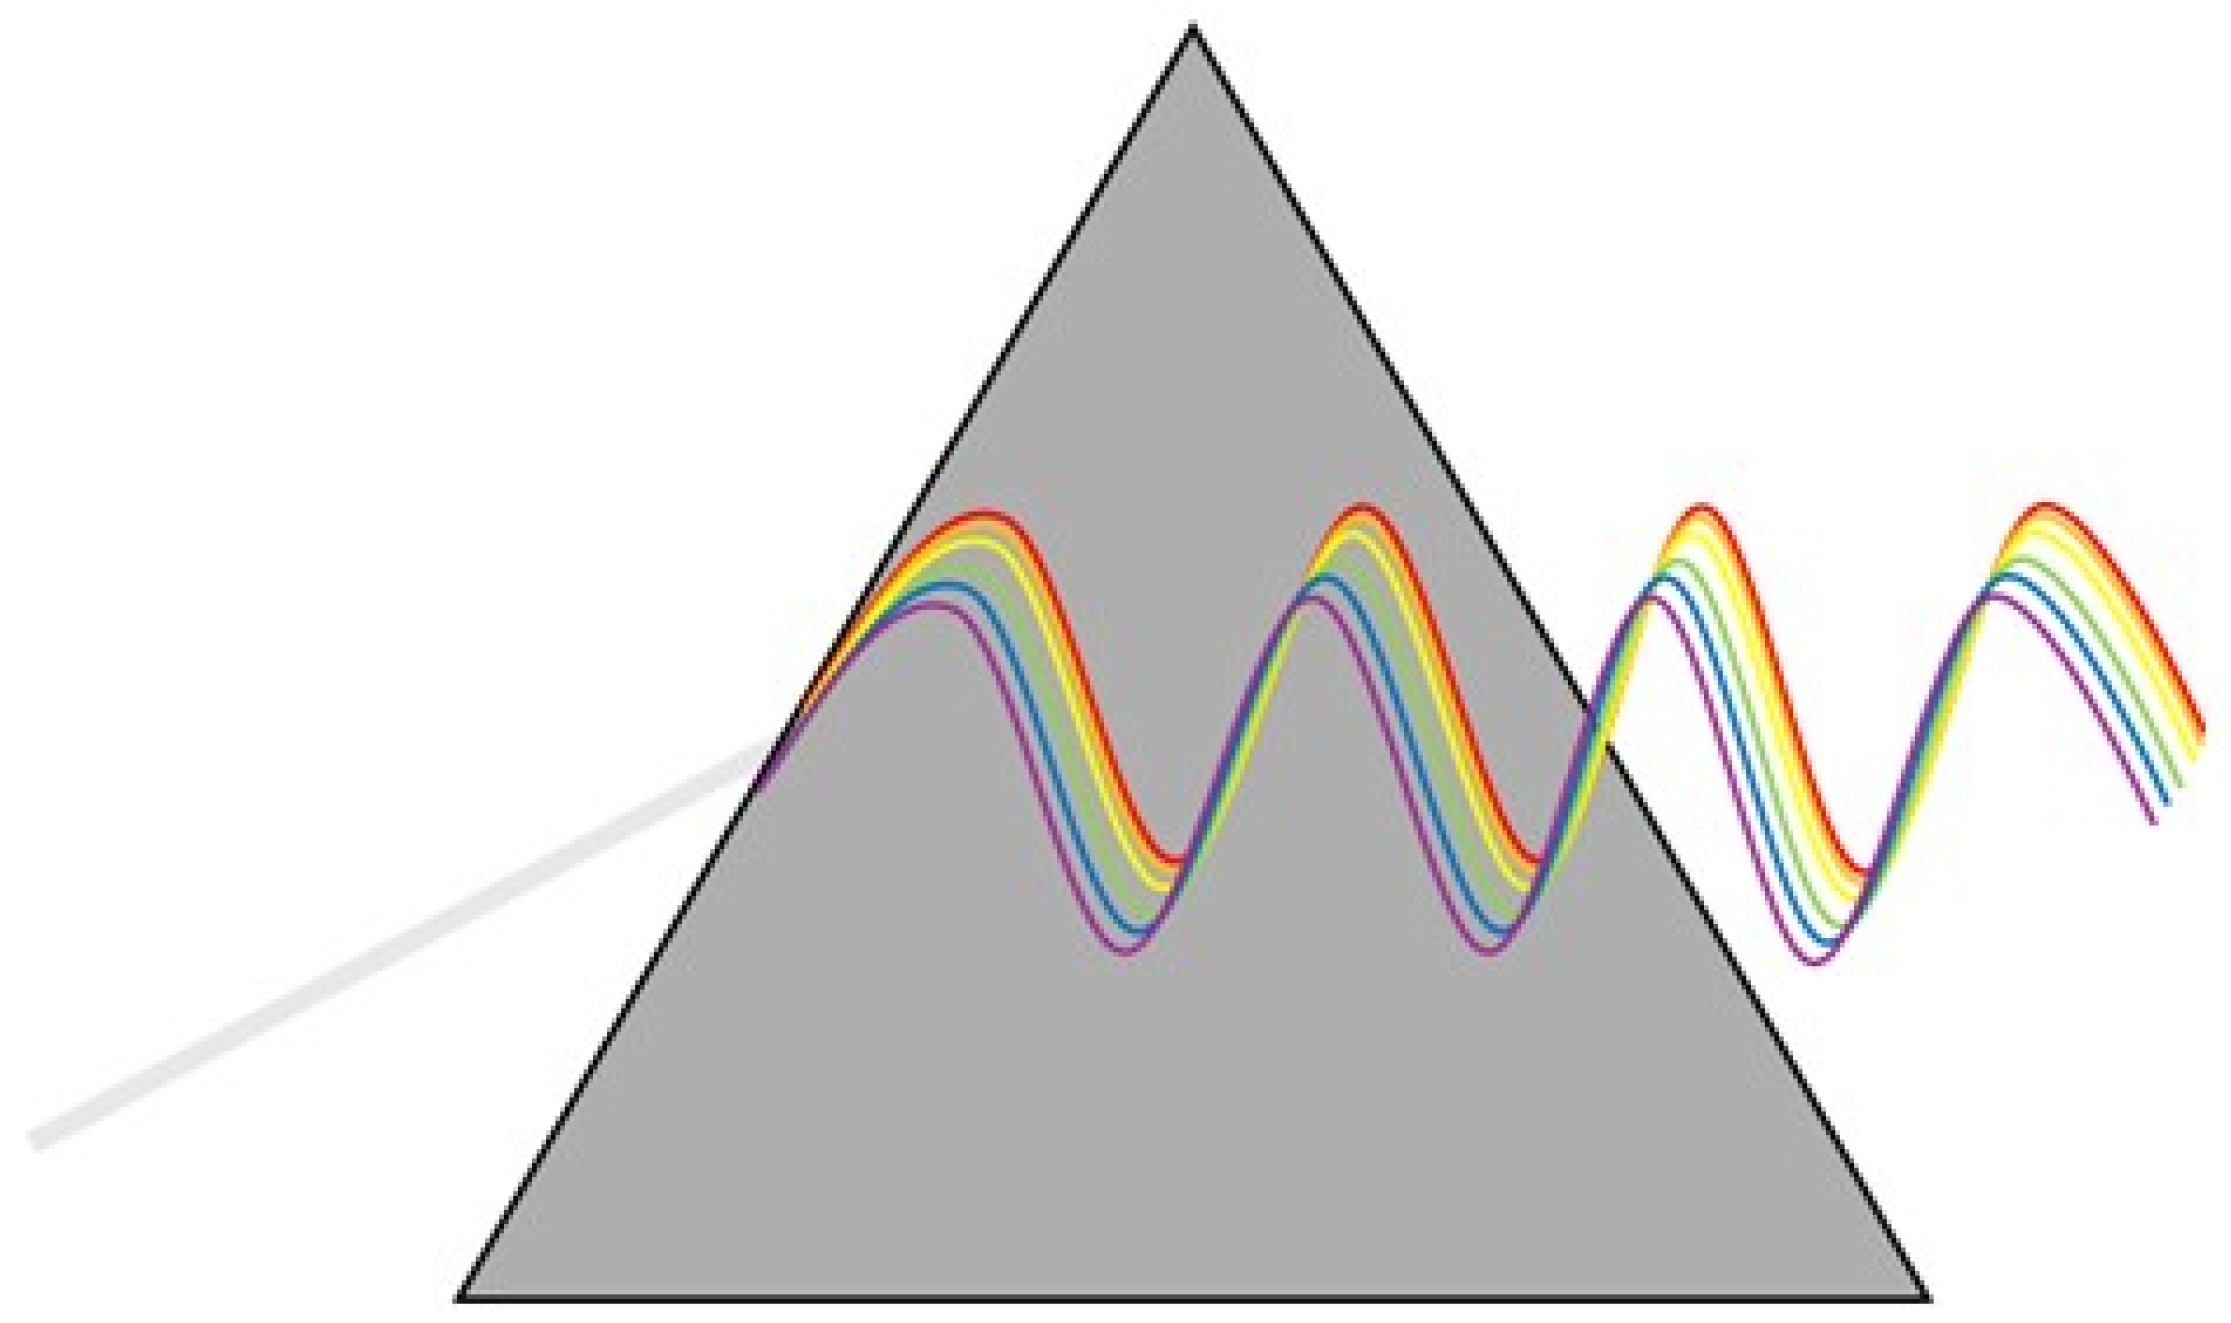
2.4. Light Scattering

Photons or light particles interact with matter in a process known as light scattering. When a light source illuminates a medium, its parties scatter light in different directions, causing it to deviate from its original optical path. Fundamentally, light scattering is the result of the interaction between matter and photons or light particles. Light can disperse when photons encounter particles or irregularities in a medium. These particles or irregularities can absorb photons and reemit them in different directions. A decrease in the intensity of the light that passes through a medium can be caused by absorption or scattering; this is a basic phenomenon in optics since it gives rise to a variety of optical effects. Figure 3 demonstrates the scatter light effects in milk, caused by fat and protein particles.

2.5. Other Optical Properties

Dispersion or refraction is defined as the process during which different colors bend at slightly different angles, (e.g., the formation of a rainbow) and is linked to the refractive index, which is affected by the wavelength (color) of the light and indicates how much the light bends and slows down (Figure 4).
Refractive-index-based sensors measure variations in a medium (such as gases, liquids, or solids) by measuring the refraction of the light that passes through the medium. Variations in the refractive index indicate changes in the material’s composition, temperature, or density. In some spectroscopic techniques, the refractive index itself can be used as a tool to identify or characterize samples. Different materials have different refractive indices at different wavelengths, so measuring a material’s refractive index spectrum can provide information about its composition and structure.
When light is absorbed by a material, causing a localized increase in temperature, it is referred to as the optothermal effect. The substance increases in temperature when it absorbs light energy and converts it to thermal energy or heat. This effect is widely used in optothermal spectroscopy and other fields where the heat generated by light absorption is essential for material manipulation or detection. The distinct heat conductivity properties of graphene have been discovered through the application of the optothermal effect, and more precisely, the optothermal Raman technique, which measures the local temperature of the sample using Raman spectroscopy and uses the excitation laser as a heat source.

2.6. Optical Chemosensors

The devices that are specially designed to detect, identify, and quantify chemical compounds are defined as chemical sensors. Their operation is based on the exploitation of chemical reactions or physical changes to acquire measurable signals (e.g., optical signals) and achieve the quantification of the desired compounds [19]. Optical chemosensors are considered a subclass of chemical sensors, and they can be divided based on the optical properties used in the sensors to detect compounds [20], as illustrated in Figure 5.
The same optical properties that govern the operation of optical chemosensors are also employed in a range of spectroscopic methods. Despite most of these methods being applied in the laboratory, they all operate on the same principles. Therefore, these types of optical sensors can also be utilized in portable spectroscopy sensors or analyzers. As technology advances, portable spectroscopic sensors are expected to be increasingly exploited for milk analyses in the dairy ruminant industry.

3. Milk Composition and Quantification Techniques

Milk is a complex biological fluid. In ruminants, its composition varies depending on the species of origin and several other physiological, genetic, and environmental factors, consisting of approximately 80–87% water, 3.6–7.9% fat, 3.2–6.2% proteins, and 4.1–4.9% lactose [17]. These chemical compounds are key determinants of milk quality, influencing both its nutritional value and technological properties [22]. The composition of milk for different animals of origin is shown in Table 1.
Among milk components, milk fat is important as it affects the cheese-making capacity and the nutritional value of milk. Moreover, the fat content and the fatty acids (FAs) profile thereof contribute to important organoleptic traits such as taste, density, appearance, and flavor [22], while polyunsaturated FAs, such as oleic acid, trans-11, C18:2, cis-9, and α-linolenic acid, offer various health benefits including reinforcement of the immune system, hormone production, and cognitive health [24]. Proteins are also vital components of milk in terms of their nutritional and economic value. Among the main proteins in milk, the casein fraction is significantly related to the cheese-making capacity of milk and the functional and technological properties of dairy products, while it is a significant source of amino acids [25]. Except for being a source of essential amino acids, milk proteins exhibit a range of biological functions supporting growth and maintenance, metabolic reactions, hormonal and immune system functions, energy storage, and antioxidant and antimicrobial activities. Lactose is another main component of milk and the main carbohydrate in it, directly associated with the milk yield capacity of ruminants; it is a disaccharide made up of glucose and galactose and is vital as an energy source [24], while it is widely referred to as “milk sugar” and it is the sole common sugar of animal origin. Urea is a metabolic product of proteins and amino acids. It is the primary source of non-protein nitrogen in milk. Its concentration above the physiological threshold may be indicative of renal diseases or imbalanced nutrition, while it plays a significant role in overall milk quality, as it can also be an indicator of milk adulteration [22]. Somatic cells in milk refer to all the cells that can be found in milk and have nuclei (e.g., white blood cells, epithelial cells, etc.). Somatic cell count, or SCC, is a crucial indicator of the milk quality and the animals’ welfare. The determination of milk price, regulatory compliance monitoring, udder health, and genetic assessment are some of the uses of SCC estimation in milk [26].
The concentration of certain compounds can provide insights into udder health status and other nutritional and physiological parameters of ruminants. For example, elevated SCC is one of the most reliable indicators of intramammary infections and mastitis [27], while the protein and urea contents of milk can be used to assess the balance between protein intake and energy supply in ruminants’ diets [28]. The concentration of these milk compounds can be quantified through various analytical techniques, with spectroscopic methods gaining increasing popularity. Figure 6 illustrates the spectroscopy methods used for various milk applications.

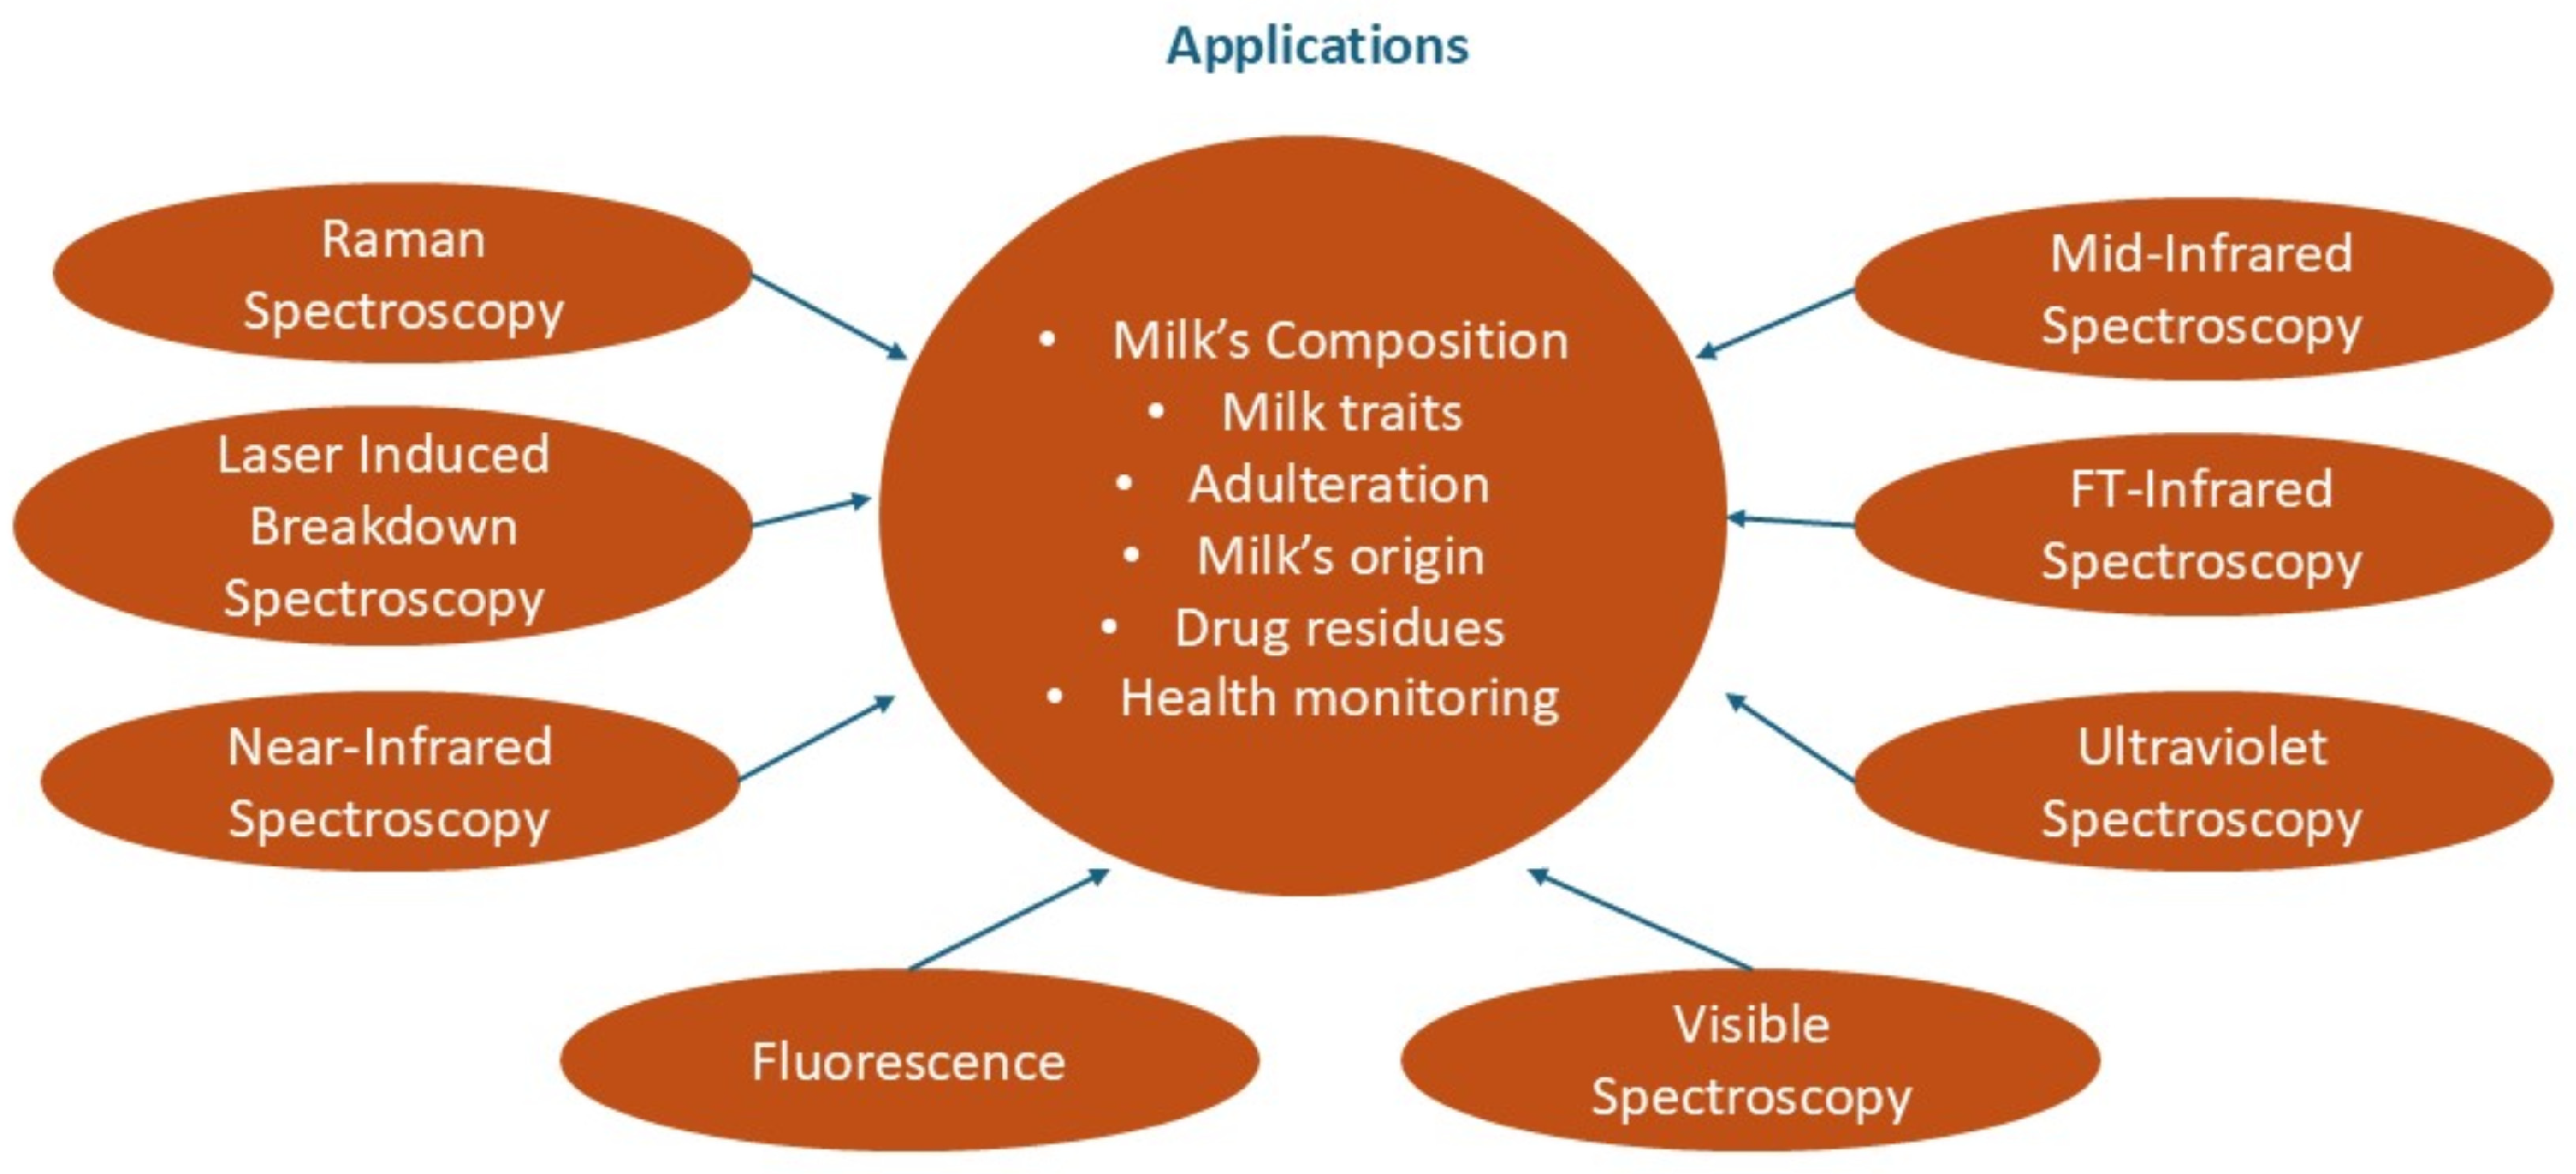
4. Spectroscopy Applications

Conventional methods used for the estimation of milk compounds, as well as for the detection of adulterants and drug residues and the microbiological assessment of milk, usually involve labor-intensive and time-consuming procedures performed by specialized staff. Considering the growing demand for real-time non-invasive analyses, spectroscopy-based techniques have emerged as promising tools for ensuring the production of high-quality and safe milk across the value chain, before, during, and after the milk processing, on the farm, in the lab, and at the market, respectively. Various technologies, including Raman spectroscopy, LIBS, NIRS, and MIRS, have been shown to be effective in providing rapid and reliable assessment of the milk composition and its microbiological status in dairy farms. Although in this review the chemical analysis of milk is examined, it should be noted that spectroscopy methods are also widely used for the identification of microbial and bacterial contamination in milk [29,30,31]. The application of the aforementioned spectroscopy methods can be used to collect data and, in combination with a variety of multivariate analysis techniques, to extract analytical information and predict milk quality (Figure 7); this is achieved by correlating multiple analytical variables (as derived from the spectrum analysis) with the properties of the studied analytes content, such as milk components, adulterants, and drug residues [32].
In this section, the definitions and principles of various spectroscopy methods are summarized along with their application in milk chemical analyses. Also, studies that primarily utilized Raman, LIBS, NIR, and MIR spectroscopy are presented and discussed, regarding their spectral ranges, calibration models, and predictive capacity when applied for the measurement of milk components, the detection of adulterants, and drug residues, as well as the discrimination of milk origin (different ruminant species, organic from non-organic milk, etc.).

4.1. Reflectance, Absorption, and Emission Spectroscopy

Reflectance spectroscopy is defined as the study of the light reflected from a solid, liquid, or gas material, as a function of its wavelength. It is a process that quantifies the light or electromagnetic radiation that is reflected off the surface of the material of interest. By analyzing the spectrum of the reflected light, information about the material’s composition, structure, and surface properties can be obtained.
The process of measuring light absorption in materials is carried out through absorption spectroscopy. A continuous band of color with black lines connecting them displays the material’s absorption spectrum (Figure 8). Colored portions depict the entire amount of light directed onto the substance, while the areas of the spectrum where the electrons absorbed the light photons are indicated by the black lines, which depict the absence of the directed light. Absorption spectroscopy is further divided into molecular and atomic absorption spectroscopy. Atomic absorption spectroscopy is the process of generating a spectrum when free atoms absorb various light wavelengths; it is a method commonly used to analyze gases. Molecular absorption spectroscopy is the process of generating a spectrum when entire molecules absorb various light wavelengths, usually at the Vis or the UV region of the spectrum.
Emission spectroscopy counts the photons released when excited electrons return to their ground state. An emission spectrum is shown as a black background with distinct colored lines that represent the wavelengths of photons emitted as electrons release energy. Emission spectra can be categorized as either line emission spectra, which display discrete colored lines separated by black spaces, or continuous emission spectra, which show a continuous range of colors across wavelengths (Figure 8). Since different substances release energy in characteristic patterns, emission spectroscopy is a powerful tool for analyzing complex materials to identify their components. Figure 9, Figure 10 and Figure 11 show indicative NIR, FT-IR, and LIBS spectral images acquired by milk sample analyses.

4.2. Raman Spectroscopy

Raman spectroscopy is an analytical method that uses scattered light to quantify a sample’s vibrational energy modes. It is named after C. V. Raman, an Indian physicist who, in 1928, together with K. S. Krishnan, made the first observation of Raman scattering [37]. Raman spectroscopy is a vibrational spectroscopic technique that uses a substance’s distinctive “fingerprint”, through which it can identify and provide structural and chemical information of any kind of material [23]. This information is extracted by Raman spectroscopy by detecting Raman scattering in the sample.
Raman spectroscopy is used in milk analysis for a variety of purposes, including the assessment of the content of the major milk compounds, as well as for the detection of drug residues (Table 2) [24]. It does not require any special sample pretreatment, enabling real-time in situ monitoring of milk components. Vaskova et al. [23] used Raman spectroscopy to measure lactose content in dried milk droplets, after the addition of lactose, demonstrating the broad applicability of this technique, while Mazurek et al. [38] used Raman spectroscopy to analyze 64 bovine milk samples for the quantification of the fat, protein, lactose, and dry matter contents. The same technique was used by El-Abassy et al. [39] to determine milk fat content in different types of untreated milk samples; in their study, measurements were made using the 514.5 nm emission line of an argon ion laser, specifically the Coherent Innova 308 Series, with 30 s recording time; the results regarding the liquid milk fat content prediction capacity of the method were promising, showing low root mean square errors (0.16 and 0.06) and high correlation coefficients (0.97 and 0.97) for milk samples with fat from 0.3 to 1.55% and from 0.3 to 3.8%, respectively. Concerning dried milk samples, the results were also very promising with R 2 = 0.97 and R M S E = 0.18 . In a study by Rodrigues Júnior et al. [40], a combination of chemometric analysis and Raman spectroscopy was utilized to detect adulterants and to assure the quality of milk powder with regard to fraud involving the addition of maltodextrin and the classification of milk powder samples according to their lactose content. The detection of adulteration via Raman spectroscopy was also investigated by Khan et al. [41]; in that study, recording of the liquid samples’ spectra, with 27 different values of urea concentrations, was performed using a 785 nm diode laser (CL-2000, CrystalLaser, Reno, NV, USA). The samples were prepared by adding urea in concentrations ranging from 10 to 1000 mg/dL. It was found that urea concentration could be accurately predicted (>97% accuracy) for concentrations above 100 mg/dL. However, the accuracy of the method decreases with the urea concentration (90–95% for 50–100 mg/dL and <60% for 50 mg/dL).
Raman spectroscopy’s non-destructive nature and its capacity to quickly and accurately analyze ruminants’ milk demonstrates its potential application in routine milk quality assessment and dairy management systems [23]. Milk components can be efficiently identified and quantified due to the method’s sensitivity, which makes Raman spectroscopy a useful tool for the systematic evaluation of milk quality status in a variety of applications, even in raw milk samples collected on-site in dairy ruminant farms [23]. Nevertheless, despite its advantages, most applications of Raman spectroscopy in dairy systems are still under development, and there are still theoretical and technological issues that need to be resolved, such as the enhancement of its accuracy for different milk types and the minimization of sample preparation. Furthermore, the high cost of Raman systems limits their accessibility, particularly for small and medium-sized dairy farms, for which the initial investment cost may be prohibitive [24].

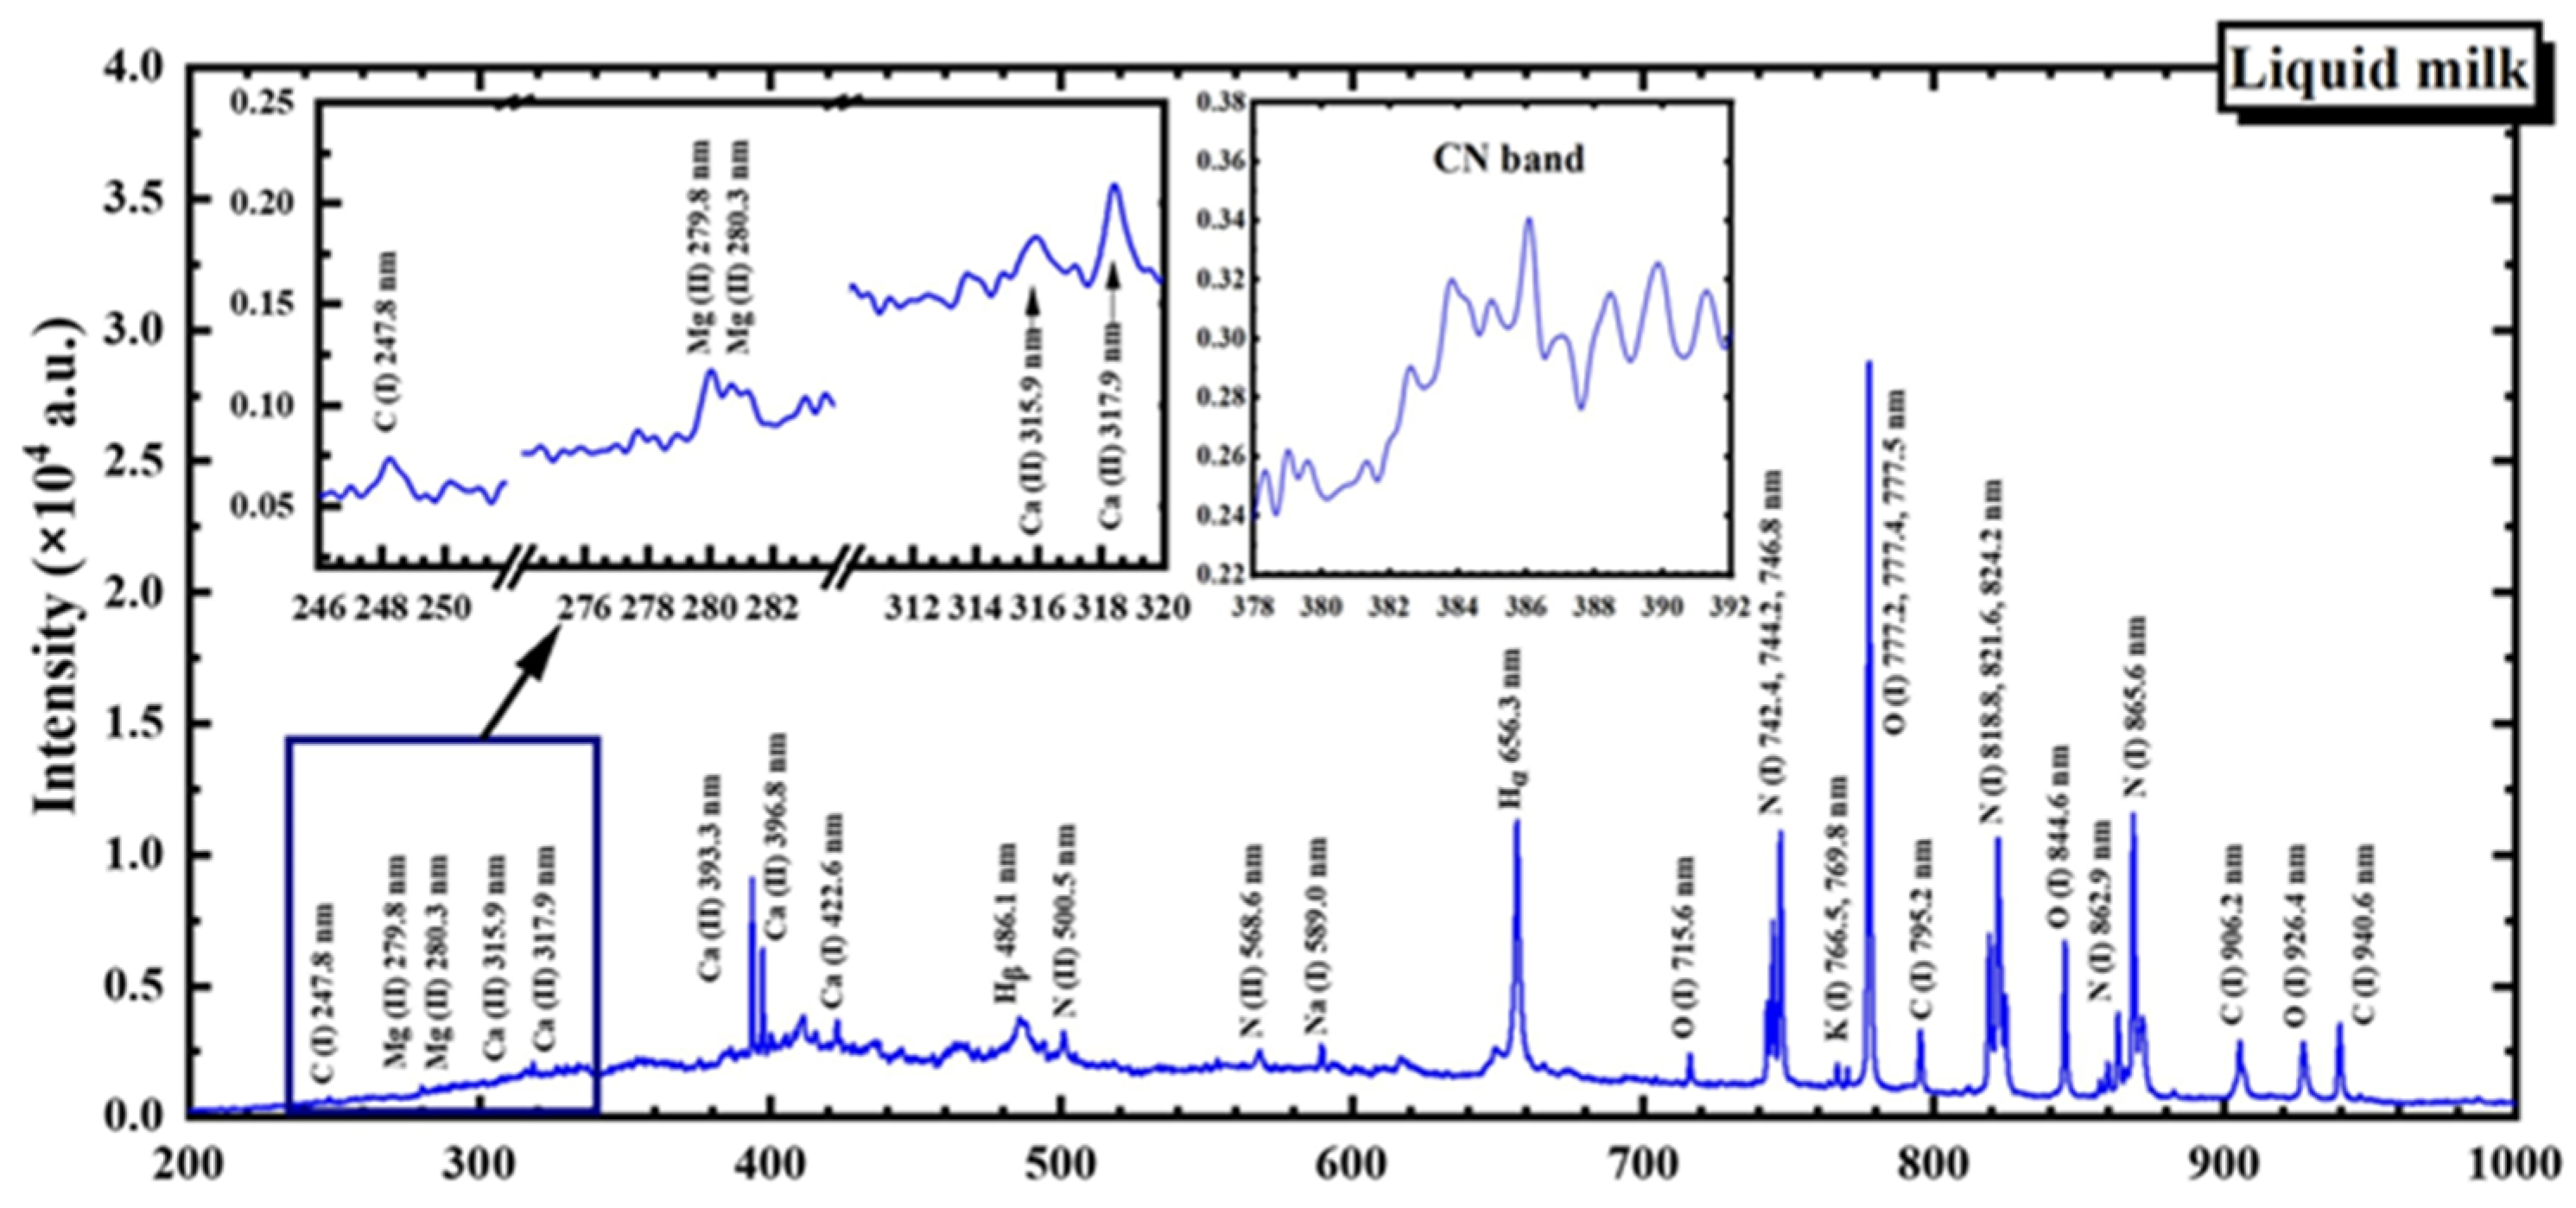
4.3. Laser-Induced Breakdown Spectroscopy (LIBS)

The optical emission method known as LIBS is used to ascertain the elemental composition of materials [44]. This process involves directing a focused pulsed laser onto a sample, generating plasma that results from the ionization of the material’s atoms. As the plasma cools, the recombination of atoms with free electrons produces light across the UV, Vis, and IR regions [45]. A small amount of the target material (solid, liquid, or gas) is vaporized by the high-energy laser pulses, and the light emitted from the excited atomic and ionic species in the plasma is gathered for spectroscopic analysis to determine the elemental composition of the sample [46].
Laser-Induced Breakdown Spectroscopy is a relatively new optical method that holds great promise for milk analysis. Indeed, it has become increasingly popular due to its potential to provide quick multi-elemental analyses, with high sensitivity and accuracy, in a variety of complex matrices, including liquid and solid milk samples, as well as due to its quick and easily adaptable methodology [36,47,48]. This method requires minimal to zero sample preparation, offers real-time analysis, and operates as a non-contact technique, making it suitable for POC applications [48]. Laser-Induced Breakdown Spectroscopy has been utilized for the detection of minerals, trace elements, and adulterants in milk, to support quality control and nutritional evaluation processes in the dairy value chain. To fully unravel its potential for widespread industrial application in dairy quality assurance systems, further optimization is needed, especially with regard to the calibration models and the improvement in precision within complex milk matrices [48].
Liquid bovine, ovine, and caprine milk samples were analyzed, without pretreatment, using LIBS in the studies by Nanou et al. [36,49], resulting in unique spectral lines of specific milk compounds (Table 3) and accurate elemental profiles of milk. In particular, the spectral characteristics of major elements such as magnesium (Mg), calcium (Ca), sodium (Na), and potassium (K), as well as minor minerals like phosphorus (P), zinc (Zn), copper (Cu), and silicon (Si), were accurately detected and identified [36]. Notably, Nanou et al. [49] used milk ash for the analysis of minor minerals content in order to improve the trace element detection accuracy, while key inorganic spectral lines and LIBS spectra were utilized in the same study to differentiate milk samples based on the animal species of origin. A variety of ML algorithms were exploited to classify the samples with remarkable precision; classification accuracy of up to 95.5% using the full LIBS spectra was achieved. Even when focusing on five specific spectral lines—magnesium Mg(II) at 279.8 and 280.3 nm, calcium Ca(I) at 422.6 nm, ionic calcium Ca(II) at 315.9, 317.9, 393.3, and 396.8 nm, sodium Na(I) at 589.0 nm, and potassium K(I) at 766.5 and 769.8 nm—the classification accuracy remained at approximately 93%. These results indicate that rapid and accurate milk origin assessment can be achieved by the combined implementation of LIBS and the appropriate ML algorithms.
In the study by Moncayo et al. [50], LIBS was combined with NN for both qualitative and quantitative analysis of milk adulteration. The authors applied chemometric tools, NNs, and Principal Component Analysis (PCA), alongside LIBS data, which were collected using a Q-switched Neodymium-doped (Nd): Yttrium Aluminium Garnet (YAG) laser (Quantel Brio model) operating at 1064 nm. The application of NN on the LIBS data enabled the development of predictive models with high accuracy in detecting adulterated milk samples and for the estimation of the melamine content. Neural network incorporation significantly enhances LIBS utility as a non-invasive real-time technique for milk quality assessment and fraud detection, offering a powerful tool for dairy industry applications. Adulteration in whey milk powder was also investigated by Bilge et al. [51]; an 80.5% discrimination rate between powdered milk, whey, and demineralized whey was achieved, while the correlation coefficients ( R 2 ) for adulteration with sweet and acid whey were 0.981 and 0.985, respectively. In the study by Abdel-Salam et al. [52], the quality of maternal milk and commercial infant formulas were evaluated using samples of maternal milk and formula samples from six popular commercial products. Using the acquired spectra and by comparing the intensities of the spectral lines in the samples, the authors concluded that maternal milk had higher overall nutritional value compared to the formulas, while it was found that younger mothers produced higher quality milk.
In a more recent study by Abdel-Salam et al. [53], quality traits of 300 milk samples, derived from 99 dairy cows (with and without mastitis), were assessed using LIBS. From these samples, 40 samples were selected, based on the SCC measurements, to be further used for in-depth LIBS analysis. It was found that subclinical and clinical mastitis was associated with lower milk quality, particularly regarding the protein and lactose content. Furthermore, a robust positive correlation between the LIBS spectral scores and SCC was observed, underpinning the potential exploitation of LIBS as a quick and efficient way to monitor milk quality on-site and as a diagnostic tool for the early detection of mastitis-induced changes in milk. Table 4 provides a summary of LIBS application across various cases.

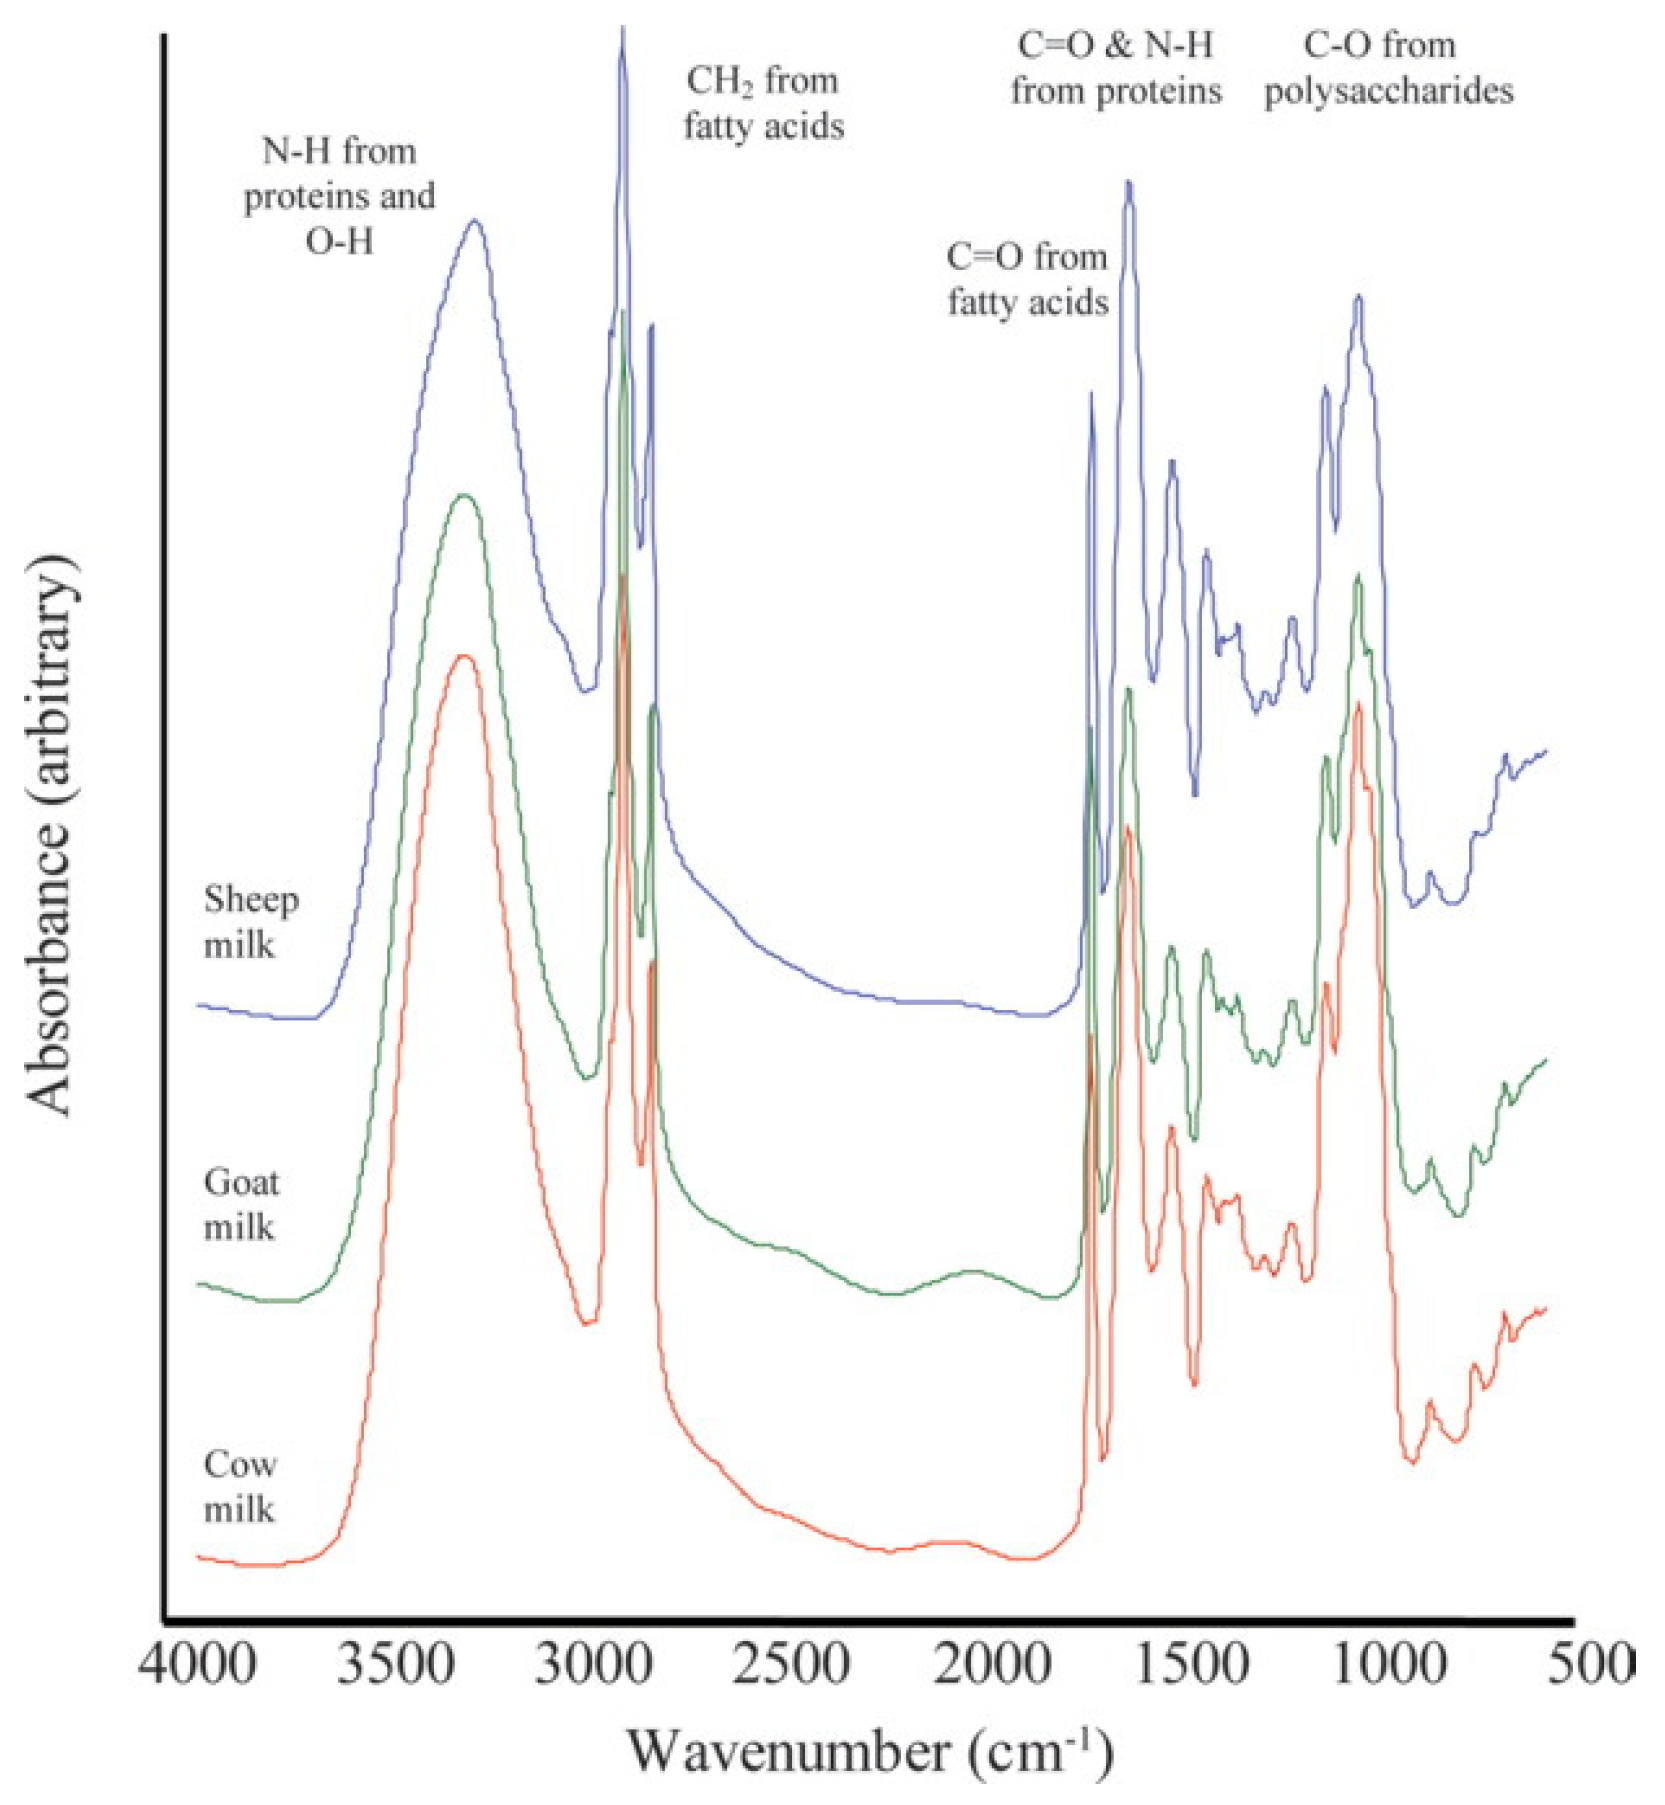
4.4. Infrared (IR) Spectroscopy

Since the physicochemical properties of milk determine its spectrum, affect its intrinsic quality and nutritional value, and are related to the health and welfare of ruminants, IR spectroscopy provides a rapid and cost-effective method for measuring/predicting/diagnosing the above [58]. Over the past few decades, simple visible and NIR spectroscopy have been widely utilized to measure milk composition, as well as to monitor milk quality in dairy farms and milk-processing plants [59,60]; in particular, they have been proven as valuable technologies in laboratory settings for the evaluation of the fat, protein, and lactose content in raw milk [61]. Moreover, infrared thermography has been used as a diagnostic tool for udder health assessment and mastitis detection in dairy ruminants [62].
Milk exhibits absorption when it is illuminated; this phenomenon is governed by the Beer-Lambert’s law (4) and is explained by Swinehart [63] as follows below:
A = l o g 10 I 0 I = d × ε × c
The absorbance (A) depends on the optical path length (d) in ( c m ) , molar absorptivity (ε) in ( L / ( m o l c m )), and analyte concentration (c) in ( m o l / L ) . The output of these elements can also be estimated by the logarithm response (log10) of the ratio between the intensity of incident light (Io) and the intensity-transmitted light (I). Then, the concentration of different milk components (fat, protein, lactose, etc.) can be estimated by computing the absorbance. Absorption properties of milk in the IR region of the spectrum are determined by the presence of certain chemical groups, such as the methylene group (-CH), hydroxyl group (-OH), and amino group (-NH), which are responsible for the vibration spectra in the NIR part of the spectrum; primary components of milk, such as fat (2340, 2310, 2270, 1780, 1730, 1720 nm), casein (2790, 2340, 2310, 2100, 1980, 1820, 1780, 1730, 1720, 1680, 1450 nm), and lactose (2340, 2100, 1820, 1450 nm), demonstrate distinct bands [59].

4.4.1. Near-Infrared Spectroscopy (NIRS)

Near-infrared spectroscopy is the study of the light’s emission, absorption, and reflection at the NIR region of the spectrum. This non-destructive technique uses the IRportion of the electromagnetic spectrum (which is approximately between 750 and 2500 nm), to analyze the physical, chemical, and other properties of various materials. Through a multi-analytical approach, NIRS allows the simultaneous and accurate prediction of multiple elements [8,64]. Thus, NIRS applications have increased significantly in the last few years compared to other traditional laboratory analytical methods due to its higher speed and accuracy, as well as its non-destructive nature and affordability [65].

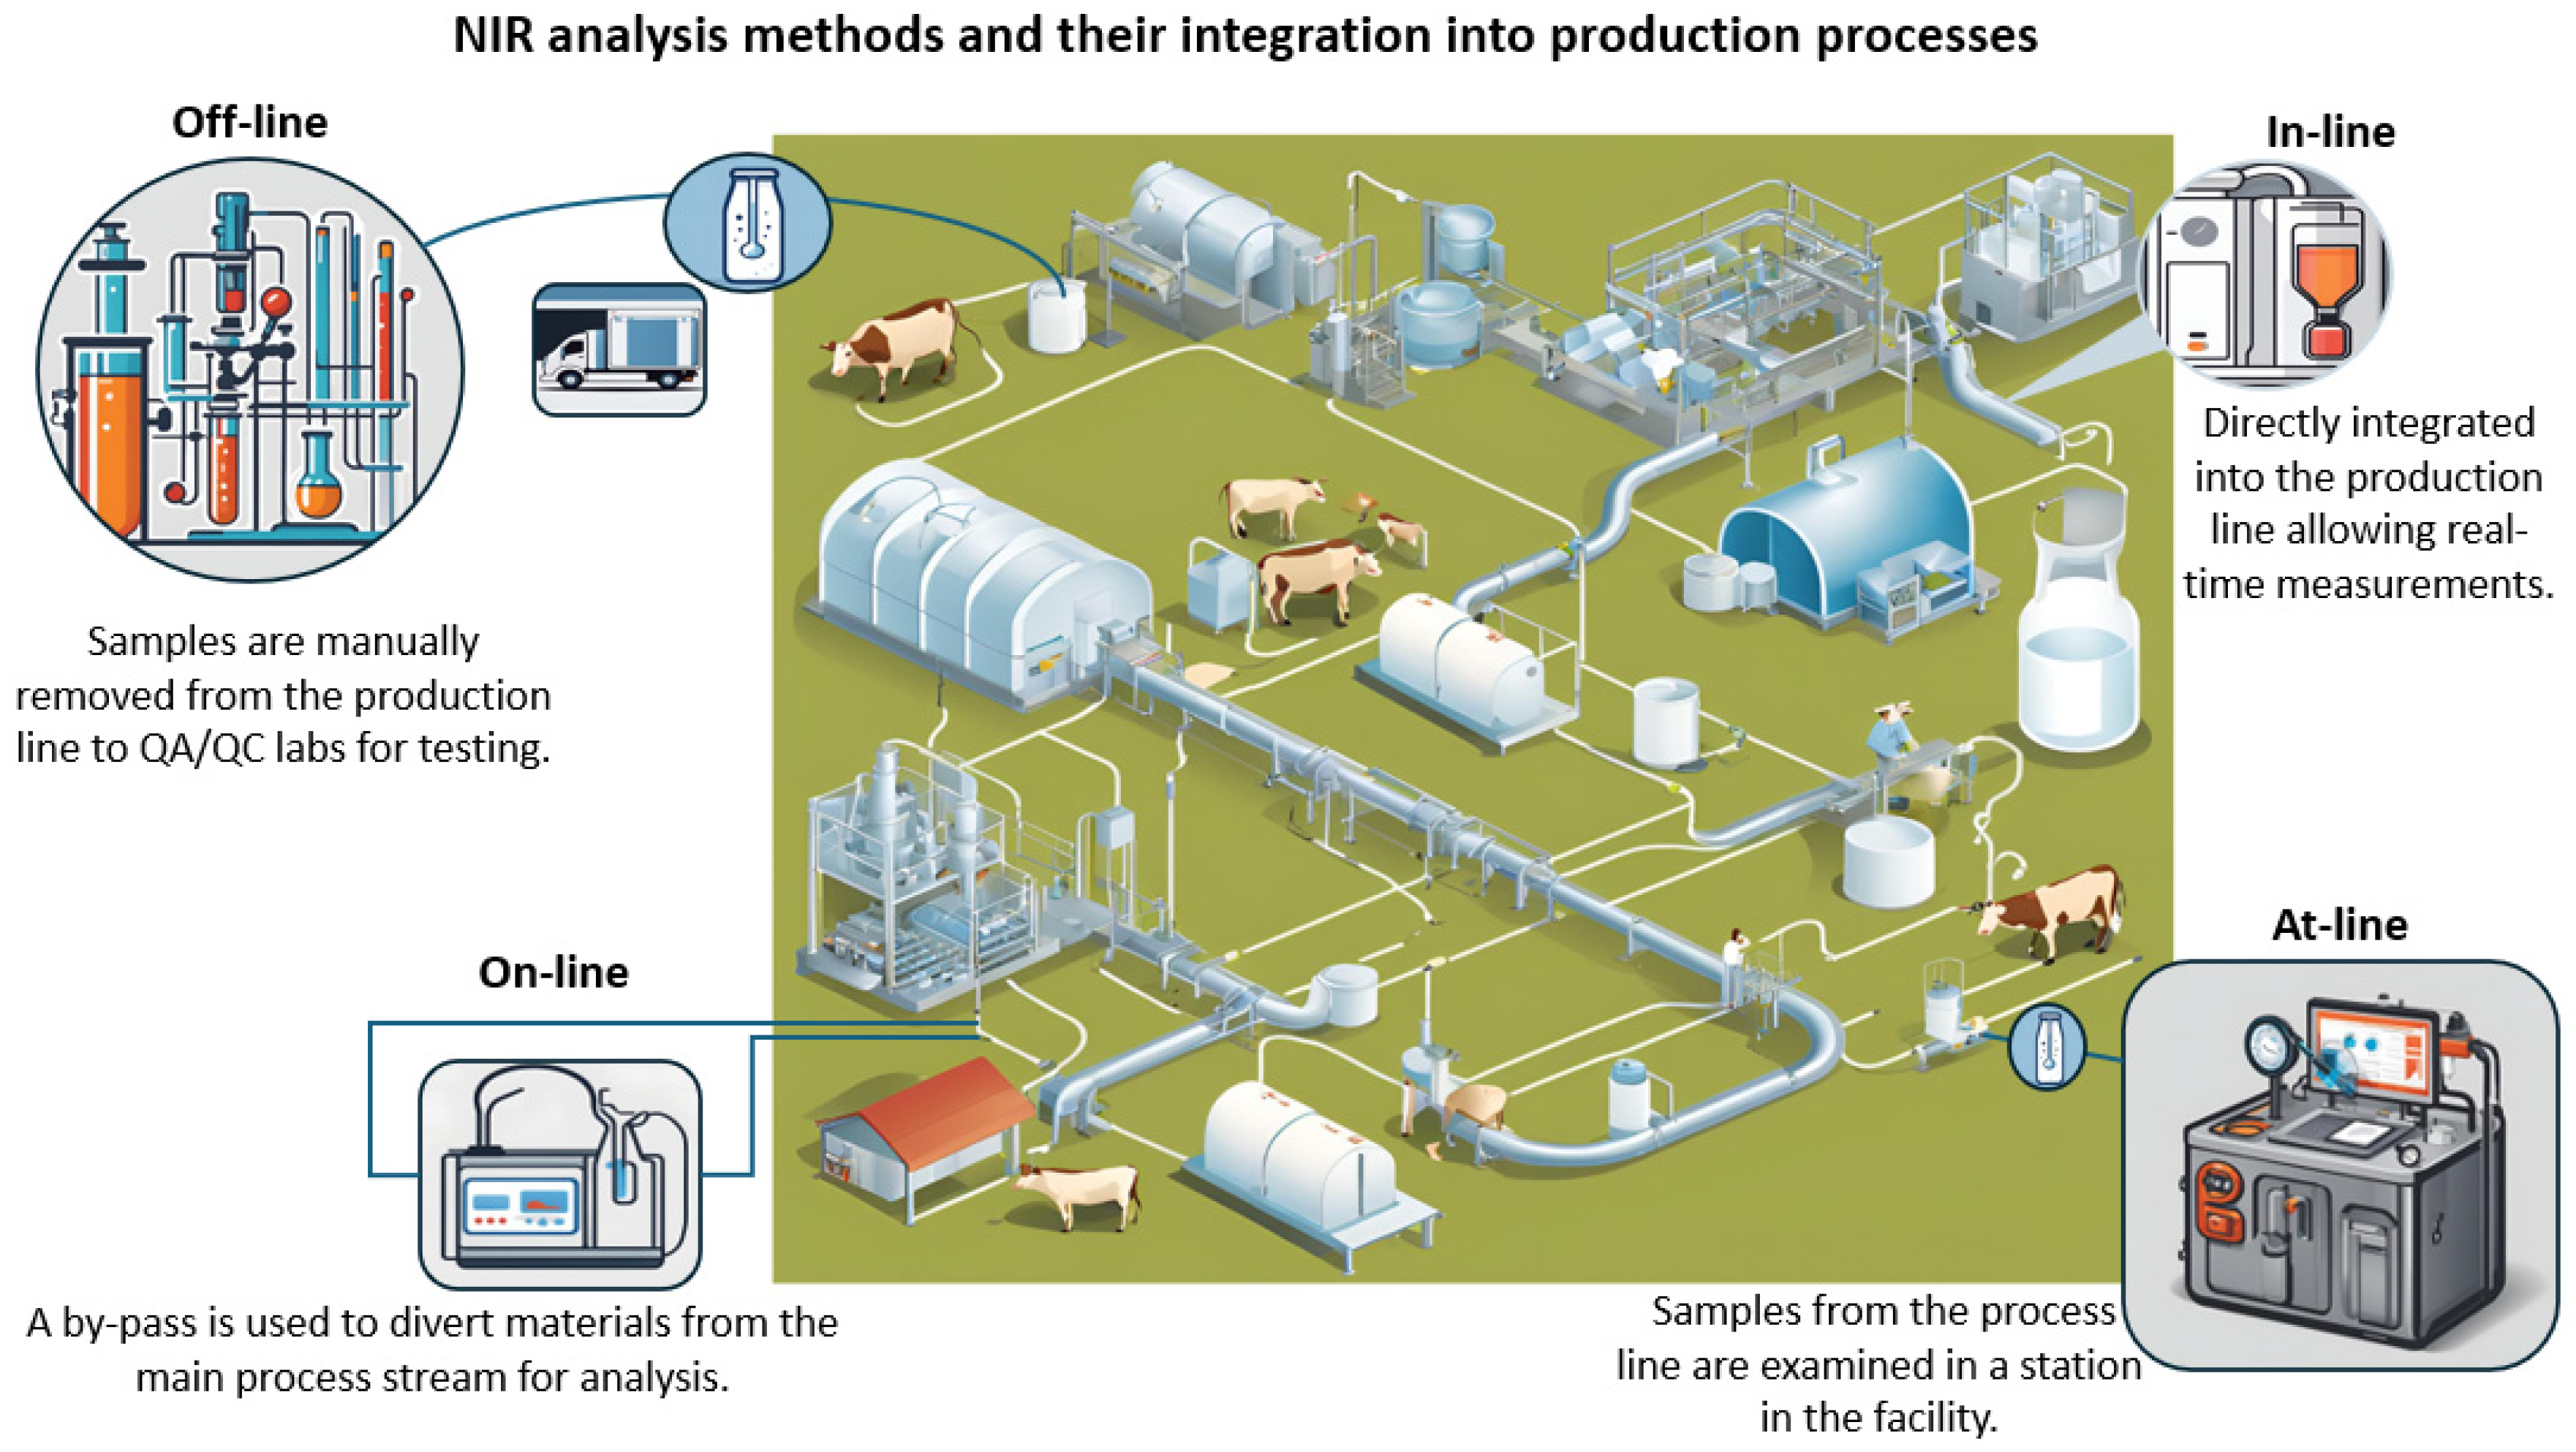
Applications of Near-Infrared Spectroscopy in the Dairy Industry

Guidelines for utilizing NIRS as an offline analytical tool for the evaluation of milk quality were published in 2006 by the International Dairy Federation (IDF) and the International Organization for Standardization (ISO) [66]. These guidelines were updated in 2020 to cover a broader range of milk and dairy products, including liquid, semi-solid, and solid forms thereof [67]. Near-infrared spectroscopy applications across the milk chain are divided into four categories, namely off-line (laboratories), at-line, on-line, and in-line installations (Figure 12) [14].
  • Off-line: NIRS systems are located in quality assurance/quality control (QA/QC) labs; samples are manually collected from the production line for testing;
  • At-line: Samples are collected from the milk-processing line and tested using NIRS systems, which are positioned near the line;
  • On-line: NIRS systems are located at the sampling point; a sample bypass is used to divert materials from the main process stream to be analyzed by the NIRS systems;
  • In-line: The NIRS system is directly incorporated into the production line, utilizing various sampling techniques that allow real-time measurements.
In contrast to off-line and at-line methods, which involve manual sampling and subsequently delays between sampling and measurement [14], on-line and in-line installations of NIRS provide real-time automatic data collection, reducing manual handling and enabling continuous monitoring and data recording. Real-time NIRS systems can also be integrated into industrial control platforms like Supervisory Control and Data Acquisition (SCADA) systems, enabling the continuous optimization of the processes; however, this integration may encounter technical and cost-related challenges [14].
This review focuses mainly on off-line (benchtop) techniques and in-line (portable/handheld instruments).

Near-Infrared Spectroscopy Systems for Milk Analysis

Near-infrared spectroscopy systems have been studied and extensively used in laboratories for analyzing key milk components. For instance, Albanell et al. [68] employed NIR reflectance spectroscopy to predict quality parameters in goat milk, analyzing 166 samples to determine fat, protein, casein, total solids (TS), and SCC. Similarly, Revilla et al. [69] evaluated the content of different FAs and vitamins A and E using NIR reflectance spectroscopy on 219 ovine milk samples while Holroyd et al. [70] summarized the NIR bands linked to distinct chemical components in a range of dairy products. Table 5 shows the corresponding wavelengths for the measurement of specific compounds in liquid milk.
Aernouts et al. [61] evaluated two distinct spectroscopy measurement modes, reflectance and transmittance, as well as a range of Vis and NIR wavelengths to analyze raw cow’s milk composition in fat, protein, lactose, and urea. Based on their findings it was concluded that reflectance outperforms for measuring crude protein and fat, with R 2 reaching 0.997 and 0.959, respectively. The prediction capacity of lactose was weaker in the case of reflectance, R 2 = 0.706, while in transmittance mode, the prediction reached R 2 = 0.883. However, neither mode provided acceptable predictions for the urea content. In another study, Coppa et al. [75] employed NIRS in reflectance mode to predict milk FA profiles in both liquid and dried milk samples, originating from 419 individual cows. The spectra were obtained by a Foss NIRSystems 6500 NIR scanning spectrometer (Foss NIRSystems, Silver Spring, MD, USA) and the scans were conducted in 2 nm intervals from 400 to 2498 nm. The total saturated fatty acids (SFA), total mono-unsatturated fatty acids (MUFA), and total unsaturated fatty acids (UNSAT) were predicted with success for liquid and dried milk samples. In that study, values of coefficient of determination in cross-validation ( R 2 C V ), coefficient of determination in external validation ( R 2 V ), and ratio of standard deviation of reference data in the calibration set to residual predictive deviation (RPD) ranged from 0.89 to 0.97, 0.86 to 0.95, and 2.93 to 6.25, respectively. Núñez-Sánchez et al. [76] used both the reflectance and tranflectance mode of NIRS to determine the milk fatty acid profile in goats. In the reflectance mode, 805 oven-dried samples were used, with the fatty acids’ coefficients of determination of cross-validation ranging from 0.80 to 0.47. On the other hand, for the transflectance mode, 220 liquid and equal number of oven-dried milk samples were used. In that case, the coefficients of determination of cross validation ranged from 0.11 to 0.79 for liquid samples and from 0.23 to 0.78 for oven-dried samples, with the spectra for reflectance and tranflectance in spectral regions ranging from 400 to 2500 nm. Table 6 summarizes the implementation of NIRS in different applications.

Handheld and Portable Near-Infrared Spectroscopy Systems

Handheld and portable NIRS systems have enabled real-time milk analysis in dairy farms, facilitating the rapid non-destructive monitoring of milk composition at the POC. They are small-sized portable devices with a remarkable analytical capacity of critical milk compounds such as fat, protein, and lactose (Table 7), without requiring sample pretreatment or extensive laboratory testing. For example, the Polychromix PHAZIR™ (PhIR, Phazir 1624, Polychromix Inc., Wilmington, MA, USA) is a MEMS (micro-electro-mechanical system) incorporating a digital transform spectrometer that operates in reflectance mode within the wavelength range of 1600 to 2400 nm. Llano Suárez et al. [82] used this spectrometer to monitor the FA content in 108 raw untreated cow milk samples at room temperature. The standard normal variate and Savitzky–Golay derivatives (first and second) were used as mathematical pretreatment, while spectral pretreatment was applied and PCA was employed to eliminate outliers. Partial least squares (PLS) were used to build the regression model and the highest R 2 values for external validation were obtained by linoleic and capric acids (0.92 and 0.87, respectively). Another application of the portable NIRS devices refers to their capacity to discriminate between organic and non-organic milk; for this purpose, Liu et al. [83] used an ultra-compact spectrometer (Micro-NIR 1700, JDSU, Milpitas, CA, USA) operating between 908 and 1676 nm, with a sampling step of 6 nm. Although the results were useful for an initial on-site analysis, they were outperformed by the Fourier transform (FT)-NIR spectral data produced by benchtop NIRS instruments like the NIRFlex N-500 (Buchi AG, Flawil, Switzerland). Nevertheless, portable NIRS instruments exhibited promising performance for rapid evaluation of the composition and quality of milk at the POC. In another study, de la Roza-Delgado et al. [84] utilized a similar handheld spectrometer (MicroPHAZIR™ from Thermo Scientific, Waltham, MA, USA) to measure protein, fat, and solids-non-fat (SNF) in cow milk with no pretreatment. The calibration models, based on 552 milk samples, showed excellent predictive accuracy for fat, protein, and SNF content. A significant output of this research was the capability to successfully share calibration data between various operation units, demonstrating the suitability of portable NIRS instruments for applications related to the dairy industry. During an 8-week study, on a cattle farm, Diaz-Olivarez et al. [85] collected over 1000 NIR transmittance spectra demonstrating the technology’s feasibility for extensive real-time milk analyses; for that study, an online analyzer, operating between 960 and 1690 nm, was used. Each milk sample was measured 100 times with 100-ms integration time, while an average spectrum was used for predictions. Two predictive models were developed: a post-hoc model trained on a representative set of samples (n = 319) and a real-time model using the first week’s samples for training and the remaining seven weeks for testing the model’s performance. For the post-hoc and the real-time models, the root-mean-squared error of prediction (RMSEP) was less than 0.080% and 0.092%, respectively. The post-hoc R 2 values for fat, protein, and lactose were 0.989, 0.689, and 0.947, respectively, while the real-time R 2 values were 0.989, 0.644, and 0.894, respectively. The integration of this system into automated milking systems appears promising, as it allows for the monitoring of each individual cow’s milk quality during milking.

4.4.2. Mid-Infrared Spectroscopy (MIRS)

Mid-infrared spectroscopy was one of the first methods employed for the analysis of milk to detect trace amounts of adulterants like urea and synthetic milk [87], due to its high predictive accuracy. Mid-infrared spectroscopy principles are similar to the ones described for NIRS with regard to absorption, emission, and reflection; however, they refer to the mid-infrared region of the electromagnetic spectrum, from 10 μm to 2.5 μm. Mid-infrared spectroscopy estimates the vibrational modes of molecules for the identification and measurement of a broad range of chemical compounds. It is based on the absorption of light energy by the molecular bonds, which makes them vibrate, bend, or stretch in the MIR spectrum in a process that reveals precise details about the chemical composition and structure of the tested substance.
Since MIRS was introduced as a useful tool for the chemical analysis of milk, several studies have exploited it for analytical purposes (Table 8). For example, Etzion et al. [88] investigated the protein content in raw cow milk using MIR total reflectance spectroscopy; for their experiments, they used the 235 spectra of raw milk, the Foss Milkoscan 605/255 as “gold standard”, and a Vector 22 spectrophotometer (Bruker, Inc., Ettlingen, Germany) to obtain their measurements. Finally, they used two statistical methods for protein content estimation, i.e., (i) PLS and (ii) PCA followed by a NN. Their tests resulted in 0.22% prediction error using PLS and 0.20% using the NN based exclusively on the PCA, while they managed to reduce this error to 0.08% when they included the fat and lactose concentrations in the model. Moreover, Dabrowska et al. [89] utilized MIRS and an experimental setup to estimate the intensity reduction in the light transmitted through a milk sample at different frequencies; the goal was to identify and quantify proteins in the sample. A tunable quantum cascade laser was used (Hedgehog, Daylight Solutions Inc., San Diego, CA, USA) to record the broadband absorption spectra in the region between 1470 and 1730 cm−1. Finally, PLS was performed for the multivariate quantification of protein. The R 2 values obtained were >0.98, indicating a satisfying overall performance of the laser. Another study that used MIRS and specifically transmittance data points obtained by Milkoscan FT6000 (Foss Electronics, Hilleroed, Denmark) was performed by Frizzarin et al. [90]. The main objective of this research was to examine various technological properties of milk, such as detailed protein fraction, casein micelle size (CMS), and pH, with a particular emphasis on the utilization and assessment of ML techniques (NNs, SVM, Random Forest, etc.). The prediction accuracy was 0.62 with R 2 = 0.08 and 0.80 with R 2 = 0.65 for CMS and pH, respectively. For protein traits, the accuracy and R 2 measurements ranged from 0.42 and 0.19 for β-lactoglobulin A (β-LG A) to 0.48 and 0.47 for α 21 -CN, respectively. Mid-infrared spectroscopy was also employed by De Marchi et al. [91] to predict coagulation properties, the titratable acidity, and pH of bovine milk. Spectral data were acquired from 1064 liquid samples in the spectral range of 900 to 4000 cm−1 using a Milko-Scan FT120 FTIR interferometer. The predictive models developed through this work were able to discriminate between high and low values of pH ( R 2 = 0.59) and rennet coagulation time (RCT) ( R 2 = 0.62). Finally, an approximate prediction was also given by the titratable acidity models ( R 2 = 0.66).
In their review, De Marchi et al. [92] focused on the ability of MIRS to predict a variety of phenotypes by milk analysis such as the (i) milk FAs profile, (ii) coagulation properties and acidity of milk, (iii) milk protein fraction and mineral composition, and (iv) health and energy status through ketosis prediction. Furthermore, the importance of chemometric analysis (e.g., PLS) is underlined for the successful prediction of the above-mentioned traits. Finally, the potential use of MIRS in the future for the prediction of additional traits is discussed, as well as the likelihood of being utilized for milk recording protocols integrated into selective breeding programs. In another review by Ceniti et al. [93], the use of MIRS for the determination of adulterants in milk as well as the plethora of other applications such as the identification of milk origin, detection of toxins, and detection of drug residuals and other chemicals are thoroughly presented and discussed.

4.5. Other Spectroscopy Methods

Beyond the above-mentioned methods, there are more spectroscopic methods that have been utilized for milk analyses such as Fourier transform infrared (FTIR), fluorescence, and UV absorption (Table 9). As noted by Fox et al. [94], milk absorbs light between 200 and 380 nm due to its protein content. Furthermore, there is a correlation between the percentage of fat in the milk and the light absorption measured between 400 and 520 nm. These wavelengths are in the UV/Vis region of the electromagnetic spectrum and consist of a primary example of how different techniques can be applied to milk analyses.
Similar to other IR spectroscopy methods, FTIR spectroscopy is used to measure the IR spectrum of materials’ absorption or emission. It is a type of MIRS that enables the quick scanning of the MIR region of the spectrum [93]. The technique is called FTIR spectroscopy due to the Fourier transformation used to convert the raw data into the actual spectrum. This method has been used by several researchers for the study of milk compounds. Among them, Nicolaou et al. [35] used FTIR to detect and quantify milk originating from different ruminant species. In that study, a Bruker Equinox 55 infrared spectrometer was used to acquire approximately 400 spectra of milk mixtures; after developing a set of multivariate analyses, FTIR demonstrated promising results with regard to the measurement of milk compounds such as casein and urea [95].
In the study by Fragkoulis et al. [96], FTIR reflectance, fluorescence, and UV absorption were applied to determine the milk fat content and the ruminant species of milk origin in 23 commercial milk samples, including 11, 9, and 3 bovine, caprine, and ovine samples, respectively. The study achieved 96% accuracy in determining milk fat content using UV absorption and 91% accuracy when combining UV absorption and fluorescence for identifying the ruminant species the milk originated from.
Fluorescence has a variety of applications in the dairy industry mainly on dairy products rather than in raw milk analyses [97,98]; for example, an application on the determination of melamine used to reveal adulteration in milk has been studied by Barreto et al. [99]. Melamine’s use as milk adulterant for testing specifically targets to evaluate the performance of milk protein adulteration, due to the melamine’s high nitrogen content and water solubility.
Visible spectroscopy has also been exploited by Aernouts et al. to evaluate milk’s composition [61], while in a relevant study by Bogomolov et al. [100], visible light scatter was applied to quantify milk fat and protein content; RMSE values equal to 0.05% and 0.03% were observed for milk fat and protein contents, respectively, concluding that visible spectroscopy could be successfully applied in both laboratory and in-line/POC measurements to replace traditional NIR methods.
Moreover, Yang et al. [101] designed and evaluated a portable milk analyzer using a miniature UV/Vis spectrometer. The UV/Vis absorption spectra were collected, and PLS algorithms were developed for the prediction of fat, protein, lactose, and TS contents in high-pressure homogenized and raw milk samples. Concerning raw milk, the results were promising but obviously less accurate compared to the ones achieved by homogenized samples.
Table 9. Applications and performance of other spectroscopic methods.
Spectroscopy MethodWavelength
(nm)
Type of
Milk
Sample
No of
Samples
Origin of MilkSamples
Preparation
ApplicationR2RMSEAccuracy
(%)
Ref.
FT-IR 600–4000 (cm−1)oven-dried63cow R,
goat R,
sheep R
mixed samplescomposition0.92
0.93
0.96
6.40 *p
5.61 * p
3.98 * p
-[35]
FT-IR 400–4000 (cm−1)liquid23cow R, goat R, sheep Runtreated
samples
fat content
animal of origin
--78.0
74.0
[96]
Ultraviolent 220–400liquid23cow R, goat R, sheep Rdiluted samplesfat content
animal of origin
--96.0
91.0
[96]
Fluorescence 240–500 exc
290–750 em
liquid23cow R, goat R, sheep Runtreated
samples
fat content
animal of origin
--70.0
91.0
[96]
Fluorescence250–380 exc
280–640 em
liquid 40cowuntreated
samples
milk origin clss.--76.9
70.4 ††
[102]
Fluorescence 250–550 excliquid242cowhomogenized
samples
carotenoid
vitamins
FAs
0.01–0.54
0.03–0.17
0.01–0.50
0.01–0.17 μg/mL SEP
0.17 μg/mL–918.32 pg/mL SEP
0.15–13.76 g/100 g SEP
-[78]
Fluorescence 240–260 exc
320–440 exc
liquid12retailspiked, diluted samplesmelamine A0.97 †††
0.95 †††
PARAFAC: 68.6 ppm p
U-PLS/RBL: 81.9 ppm p
-[99]
Fluorescence330 exc
420 em
liquid23NDskimmed, mixed, heated, homogenized samplesheat treatment
discrimination
>0.95--[103]
Fluorescence 250–350 exc
260–500 em
liquid30cowpasteurized
samples
characterization of pasteurized milk---[104]
Visible400–1000 refl
400–1000 trans
liquid300cowuntreated
samples
fat
crude protein
lactose
urea
refl
0.978
0.861
0.557
-
trans
0.395
0.687
0.111
-
refl
0.11% p
0.18% p
0.22% p
-
trans
0.629% p
0.274% p
0.317% p
-
-[61]
Visible light scatter400–1000liquid21retailmixed, spiked,
diluted samples
fat
protein
0.973
0.964
0.047%
0.032%
-[100]
UV/Vis183–667liquid FR
liquid HPH
240
240
cowheated, homogenized, diluted or untreated
samples
fat, protein, lactose, TSC-Liquid FR 0.13% p–0.46% p
HPH FR 0.09% p–0.27% p
-[101]
Fusion
NIRS-LIBS
≈185–2500powder50vetch rootpelleted samplesmilk origin--95.8[55]
R2: Coefficient of determination, RMSE: Root Mean Square Error, ND: Not Defined, FR: Fresh Raw, HPH: High-pressure Homogenized, TSC: Total Solids Concentration FAs: Fatty Acids, clss: classification, R: retail, * percentage volume, p: RMSEP (root mean square error of prediction), exc: excitation, em: emission, refl: Visible reflectance, trans: Visible transmittance, A: adulteration, : based on aromatic amino acids and nucleic acids fluorescence spectra, ††: based on rivoflavin fluorescence spectra, †††: predicted x reference concentration correlation coefficient.

4.6. Benchmarking of Spectroscopy Methods

Accurately assessing the efficiency of each spectroscopy method benchmarking on the same implementation is critical. For instance, in their paper, Domingo et al. reviewed [105] the capacity to detect melamine in milk using MIR, NIR, and Raman spectroscopy; they concluded that Raman must be further studied, as it is likely to effectively detect and quantify melamine content but there is still a demand for further work to elucidate its diagnostic value. Concerning MIRS and NIRS, they both produced similar results with the PLS being the most used method for analyzing the data and comparing the methods. Similarly, melamine detection using MIRS and NIRS has been examined by Balabin et al. [80], who also concluded that both techniques are suitable for this application resulting in a limit of detection lower (LOD) than 1 ppm (0.76 ± 0.11 ppm), while Wu et al. [77] found NIRS and MIRS to have very similar performance when utilized for milk protein measurement, with R 2 being 0.966 and 0.990 and the RMSEP being 0.5473 and 0.2944, respectively.
Comparisons between NIRS, MIRS, and molecular fluorescence were the primary focus of the study by Soulat et al. [78]; in their research, they aimed to determine the best method to predict carotenoid, vitamin, and FA content in bovine milk. Fatty acids and some carotenoids (cis9-β-carotene, β-cryptoxanthin, and zeaxanthin) were more efficiently predicted using NIRS, whereas other carotenoids (13-β-carotene, the sum of β-carotenes) were better predicted by fluorescence. Nevertheless, the prediction capacity of vitamins was relatively poor, irrespective of the method used. Moreover, in the same study, MIRS outperformed the other methods when used for the prediction of lutein and α-tocopherol. A broader comparison between fluorescence, MIR, and NIR spectroscopy was presented in the review by Loudiyi et al. [95] who concluded that fluorescence spectroscopy is more sensitive compared to absorption measurements due to the zero background of the measured signal. However, it is worth noting that only one device has been developed by Spectralys Innovation (Amaltheys®) and has been proposed for the dairy industry, in contrast to IR spectroscopy where more industrial applications are available as being faster and cheaper. Indeed, as Loudiyi et al. [95] discussed, the objective of many of the available studies was to create a real-time milk analysis system, rather than actually testing its capacity to perform the measurements under real-world conditions.
The idea of combining spectroscopy methods is an innovative approach that expands the applicability of spectroscopy and marks new research pathways to explore, with the fusion of spectroscopy techniques being already exploited in some cases. A successful example is described by Eum et al. [55] who combined NIRS and LIBS to identify the origin of milk, with remarkably positive results. When the two methods were individually considered, the accuracy values were 91.5% and 73.1% for NIRS and LIBS, respectively, whereas when the two methods were jointly considered, the accuracy reached 95.8%. In Table 10, all the spectroscopic methods examined in this paper are listed and evaluated in terms of cost (initial setup and operational expenses), adaptability (variety of analyzed parameters, adaptation in different applications and under various circumstances), convenience (user-friendly and easy to integrate), accuracy (precision and reliability of the results), speed (time of results acquisition), portability (on-site applications), authority (acceptance by regulatory bodies, scientific community, etc.), and promotion (recognition of the technology).

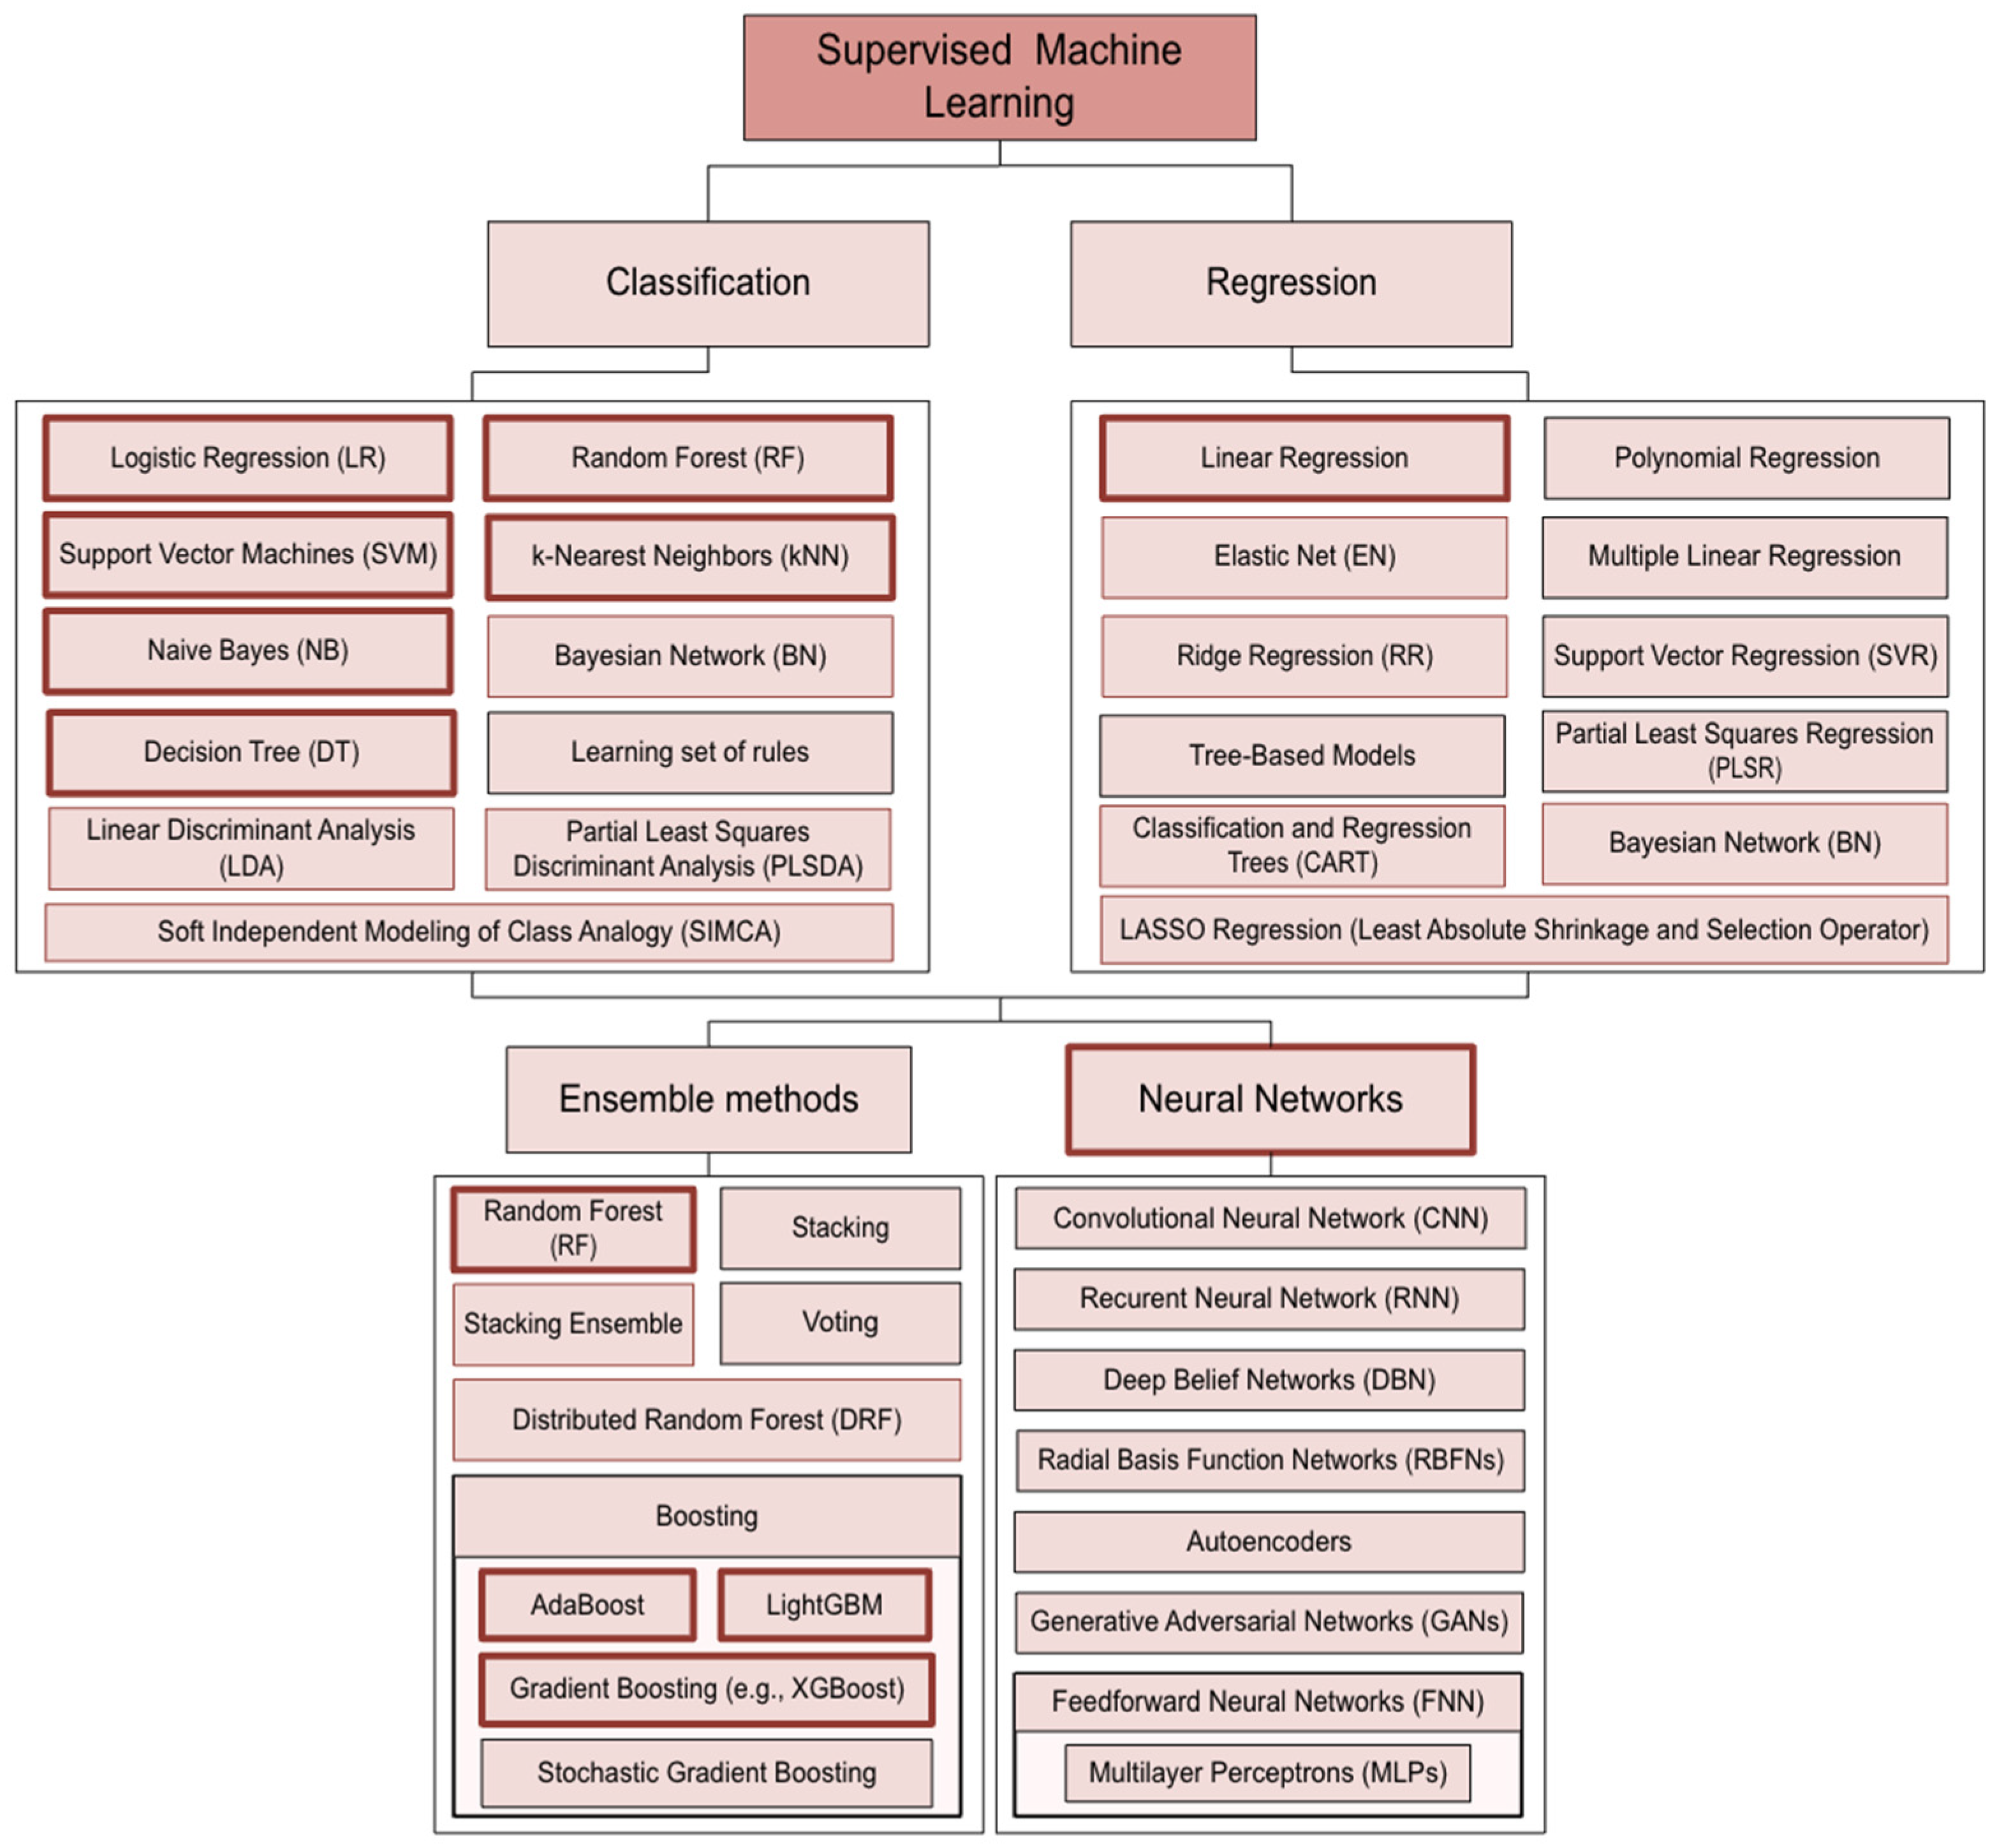
5. Machine Learning Principles

Sophisticated analytical tools are necessary to extract meaningful insights from the massive amount of data generated by spectroscopy techniques such as Raman, LIBS, NIRS, and MIRS. Among them, ML algorithms have been efficiently utilized for the improvement in these spectroscopic techniques’ predictive capacity. Indeed, with the integration of ML models, including regression analysis, NN, and SVM in spectroscopy systems, scientists have achieved more precise and effective predictions for milk composition, quality, and adulteration. The following sections will explore how ML algorithms are applied to the data acquired from spectroscopy techniques, offering new potential for the precision management of dairy farms and real-time milk analysis.
Automated monitoring and recording tools and AI are basic components of the PLF systems and can be used to efficiently address production, health, and welfare challenges by indicating early signs of potential production challenges, management errors, and diseases in dairy farms [106]. Artificial intelligence is defined by Kaplan and Haenlein as ‘the ability of a system to accurately interpret external data, learn from it, and apply that knowledge to achieve specific goals and tasks through flexible adaptation’ [107]. Therefore, AI employs knowledge-based rules (supplied by developers) or recognizes the rules and patterns that underpin the application of ML to drive systems to predefined objectives. It also acts on external information from Internet of Things (IoT) platforms and other big data sources [108].
The two types of data modeling currently utilized by PLF systems as AI components are the predictive and the exploratory ones. Predictive models use data to forecast future events based on predefined criteria, while exploratory models analyze past events to identify key determinants [3].
Modeling-based approaches that involve the collection and analysis of data, risk assessment, and ML are frequently seen, and ML algorithms have been extensively integrated into modeling and simulation modules for the analysis of data collected by livestock sensors. Therefore, the volume of data being collected by livestock farms via PLF monitoring systems has significantly increased lately, necessitating the training of ML algorithms to automatically generate efficient DSS [108].
Data processing and analysis techniques are divided into two primary categories: (1) modeling and simulation-based techniques and (2) ML and data analytics algorithm-based techniques. Combining these techniques significantly improves the efficiency and reliability of DSS. In fact, the integration of data analysis, ML, simulation, and modeling tools broadens the scope of this data-driven strategy; once data are collected, they are appropriately analyzed to produce information about the current state of the farm and support relevant management interventions (Figure 13). The process begins with simulating a ruminant farm in a controlled environment. However, simulation on its own is insufficient because of the complexity of actual ruminant farms [109]. In order to bridge the gaps and provide holistic and targeted solutions, ML and other data analysis techniques are used [108].
Digital livestock farming systems support evidence-based animal production, as well as the health and welfare of farm animals, relying on data, collected from biometric and biological sensors, which are then appropriately analyzed to create predictive models [3]. Farmers may increase the health status of their animals and the sustainability of their farms by using real-time data analysis to make informed decisions based on the processing of large-scale sensor-derived data [110]. These datasets function as the foundation for ML algorithms, which analyze them to improve the diagnostic and predictive system performance and enable the development of automated DSS [3,111,112].
In PLF, the main categories of ML refer to supervised learning, unsupervised learning, active learning, generative adversarial networks (GANs), and few-shot learning. Among these ML categories, supervised learning has been mostly utilized in dairy ruminant and milk analysis applications. This is associated with the capacity of the supervised models to be trained on a dataset that includes both inputs and their corresponding outputs (labels), aiming to achieve the correct interrelation mapping between them.
Supervised learning comprises various methods concerning model training with labeled data. Regarding milk analysis, the most applied methods are linear regression, LR, DTs, Random Forest (RF), SVM, k-NN, Naive Bayes (NB), GBM, AdaBoost, NN, Linear Discriminant Analysis (LDA), PLS, and Partial Least Square Regression (PLSR). The main supervised ML algorithms used in dairy ruminant research are illustrated in Figure 14, with those framed in red being the focus of the following sections.

5.1. Logistic Regression (LR)

Logistic regression is a statistical method used for building ML models that predict the probability of a discrete outcome, typically a binary one, based on a set of independent (explanatory) variables [116]. It estimates the relationship between a categorical dependent variable and the explanatory factors, allowing for the prediction of the likelihood of an event’s occurrence. As a supervised ML algorithm for solving classification problems, LR aims to find the minimum value of the loss function to enhance the accuracy of the prediction function, thereby solving the classification problem [117].

5.2. Decision Trees (DTs)

Decision trees are a non-parametric supervised learning method that can be applied in both classification and regression tasks. It has a tree-like and hierarchical structure, with internal, leaf, branch nodes, and a root node [118]. Decision tree algorithms do not require much data preprocessing and can work with both numerical and categorical features. Additionally, while DTs are useful in many different applications, they are frequently insufficient for properly predicting continuous values in regression analyses, and their training can be a challenging and expensive task. Moreover, although DTs can automatically handle feature selections and inference, they can be sensitive to small data variations, which may lead to significant changes in the tree structure, affecting its stability [116].

5.3. Random Forest (RF)

The RF method is an ensemble learning method used for both regression and classification tasks. By choosing random subsets of covariates, it constructs multiple DTs, improving the predictive accuracy and reducing overfitting. The final prediction arises from the weighted average or the majority vote of these trees [116]. Random Forest accomplishes implicit feature selection to generate uncorrelated DTs, making it this way an effective method, especially in datasets with numerous features [90,119]. In contrast to linear regression, RF offers insights into features’ importance but does not provide thorough coefficient analysis; however, it can be computationally demanding for big datasets. Random forest demonstrates great performance when both numerical and categorical data are analyzed and usually does not require scaling or variable transformation. Despite its complexity, RF is characterized by strong resistance to noise and overfitting [120].

5.4. Support Vector Machine (SVM)

The Support Vector Machine is a discriminative ML method that may be equally applied to regression and classification problems. It works by building a hyper-plane to reduce errors and performs effectively in high-dimensional feature spaces, particularly when there is a distinct separating boundary between the data classes. This makes SVM suitable for problems where the decision boundary is well-defined. Since it uses a subset of training points in the decision function, known as support vectors, it is also memory-efficient. However, due to the longer required training period, it performs poorly with large datasets, particularly when there is extra noise in them, such as target class overlap [115,116].

5.5. k-Nearest Neighbor (k-NN)

K-nearest neighbors is a commonly used classification algorithm characterized by its simple implementation and flexibility. It is based on the principle of proximity, where the most common category among the nearest neighbors in the feature space defines the classification of a studied sample [121]. K-nearest neighbors assume that class conditional probabilities are locally constant, which can introduce bias, particularly in high-dimensional spaces [9]. A key benefit of k-NN is that it does not require any preprocessing of the training data, providing both space and speed advantages when applied in very big datasets. Nonetheless, k-NN usually assumes an equal distribution of training samples among different classes [122]. In numerous practical scenarios, datasets present an imbalanced distribution, where the major class is represented by a large number of observations while the minority class by a few [123]. The imbalanced distribution highlights the significance of choosing the k parameter thoroughly since it has a direct impact on the classification performance. If the k parameter has a predefined value, it may lead to bias in favor of the major class, especially in cases of uneven distribution of observations assigned to different classes [121,124].

5.6. Naïve Bayes (NB)

Naive Bayes is an efficient incremental ML classifier known for its strong performance in everyday applications since it can handle both discrete and continuous variables. Despite the assumption of feature independence, an often unrealistic condition that may result in poor performance in domains where attributes are highly interdependent, NB can still effectively compete with more sophisticated classifiers, particularly in scenarios with minimal feature interdependencies [125]. Since it explains its decisions through the total amount of information acquired, the algorithm is especially useful for its transparency. When employed iteratively, NB can solve non-linear problems while retaining its inherent advantages [126]. Due to its efficiency and simplicity, this method is particularly used in behavioral models within livestock [118].

5.7. Linear Regression

Linear regression is a statistical and ML method where the value of a dependent variable y is predicted by one or more independent variables x i (where i = 1 , 2 , 3 , etc.) and a.
A simple linear regression model is expressed as follows below:
y = a 0 + a 1 x + e
where ( y ) is the dependent variable and ( x ) is the independent variable. The constant term a 0 represents the vertical axis intercept of the regression line, a 1 is the regression coefficient that refers to the slope of the regression line, and e is the random residual error [127].

5.8. Linear Discriminant Analysis (LDA)

Linear Discriminant Analysis is a frequently used method for reducing dimensionality problems as a preprocessing step for ML and pattern classification applications. The objective of the LDA technique is to project the original data matrix onto a lower dimensional space. When high dimensional feature vectors from various classes are reduced to a lower dimensional feature space, the LDA technique identifies an orientation W that allows the projected feature vectors of one class to be clearly distinguished from those of other classes. For example, two-dimensional feature vectors are reduced to a one-dimensional feature vector [128]. Despite the fact that LDA is one of the most commonly used data reduction techniques, small sample size (SSS) and linearity emerge as the two main disadvantages. A linear transformation that discriminates between various classes is found using the LDA technique. Nonetheless, if the classes are not separated linearly, LDA cannot find a lower dimensional space. Thus, when the discriminatory information is not in the means of classes, LDA fails to find its space. Also, SSS, as one of the big problems of the LDA technique, results from high-dimensional pattern classification tasks or a low number of training samples available for each class compared with the dimensionality of the sample space. Due to the high number of features or dimensionality, the LDA technique has been applied in biometric applications, agriculture applications, medical applications, etc. [129]. Linear Discriminant Analysis constitutes a specific type of Discriminant Analysis (DA) [130].

5.9. Boosting

Boosting is an ML method based on the idea that a combination of simple classifiers (obtained by a weak learner) can achieve a better performance than any other of the simple classifiers alone. A weak learner is a learning algorithm able to produce classifiers with error probability strictly less than that of random guessing, while a strong learner is able (given enough training data) to produce classifiers with arbitrarily small error probability [131]. Boosting is a general method for improving the accuracy of any given learning algorithm, focusing primarily on the AdaBoost algorithm [132].

Adaptive Boosting/Adaboost

Adaptive Boosting or AdaBoost is a ML algorithm introduced by Freund and Schapire in 1996 and marked a significant enhancement in boosting techniques [133]. The algorithm repeatedly combines weak learners, typically decision stumps, to create a strong classifier. Each time, the weights of the data points are adjusted to provide misclassified cases, a higher weight and support direct learning toward more demanding cases [134,135,136]. The algorithm’s classification performance is improved in a variety of applications by using this adaptive weighting mechanism. Regression tasks are another area in which Adaboost outweighs the alternative, highlighting its ability to efficiently adjust [137]. The mathematical formulation includes calculating a weight for each instance of Equation (6), as shown by w i = 1 n [138], of n pieces of x data. The algorithm splits input values into binary classes, which are commonly represented by the numbers −1 and 1. AdaBoost’s strong classification ability has made it a popular ML method in many fields including livestock farming [139].
x i , x i + 1 , x i + 2   and   y n 1,1
Although AdaBoost is a well-established boosting technique, it has been used less frequently in dairy applications compared to GBM.

5.10. Gradient Boosting Machine (GBM)

The gradient boosting machine is an upgraded extension of the AdaBoost method, supporting any differentiable loss function. Fitting the tree models to the negative gradient of the loss function yields the difference between the expected and actual values of the outcome variable. According to Friedman [140], this enables GBM to optimize any differential loss function. By utilizing an ensemble model called gradient boosting, a set of poor prediction models is “boosted” to produce a more trustworthy model, with its current base learner being trained primarily on the mistakes that prior base learners have made [135,141].

5.11. Neural Networks (NN)

A NN is an ML method that enables computers to process data in a manner inspired by the human brain’s functioning. Five basic components are usually used to analyze a NN: the activation function, weight coefficients, bias (constant term), input values, and output values. The mathematical form for an artificial neuron j can be expressed as
y j = φ ( b j + i = 1 n w i , j x i )
where φ is the activation function (typically involves a threshold value θ j ), y j is the output value for the j -th neuron, w i , j is the weight connecting the i -th input to the j -th neuron, x i represents the i -th input feature, and b j is the bias term for the j -th neuron. An example of a fully-connected feed-forward artificial neural network with a single hidden layer is depicted in Figure 15 [139,142].

5.12. Partial Least Square (PLS)

Partial least square analysis is a multivariate statistical method that allows comparison between multiple response variables and multiple explanatory variables. It is considered especially useful for constructing prediction equations when there are many explanatory variables but comparatively small sample data. Partial least squares analysis was designed to deal with multiple regression when the data have a small sample, missing values, or multicollinearity. It has been widely used in fields like chemistry and chemometrics, where there is a big problem with a high number of intercorrelated variables and a limited number of observations [143].
The intention of PLS is to form components that capture most of the information in the X variables that are useful for predicting Y1, …, Yl, while reducing the dimensionality of the regression problem by using fewer components than the number of X variables [144].
Despite its benefits, it cannot provide significance testing unless bootstrapping is used, while there is a lack of model test statistics [143].

5.13. Partial Least Square Regression (PLSR)

Partial Least Square Regression is the PLS approach in its simplest and most commonly used form. Partial Least Square Regression is a method that advances beyond common regression by modeling the structure of X and Y. For this purpose, it uses two-block predictive PLS models to describe the relationship between two data matrices, X and Y, through a linear multivariate model. The ability of PLSR to analyze data with numerous, noisy, collinear, and even incomplete variables in both X and Y makes it a useful method, with its precision improving with the increasing number of relevant variables and observations [145]. The PLSR method is commonly used for the construction of rapid online spectroscopic and image analysis systems in food quality and safety evaluation and control applications. Compared to other linear methods, PLSR is a simpler easier-to-fit model and allows for determining statistical properties; compared to nonlinear methods, it is more suitable and efficient for analyzing complex problems. However, PLSR is less powerful for predicting complex problems compared to other linear methods, while it has higher computational complexity compared to nonlinear methods [146].

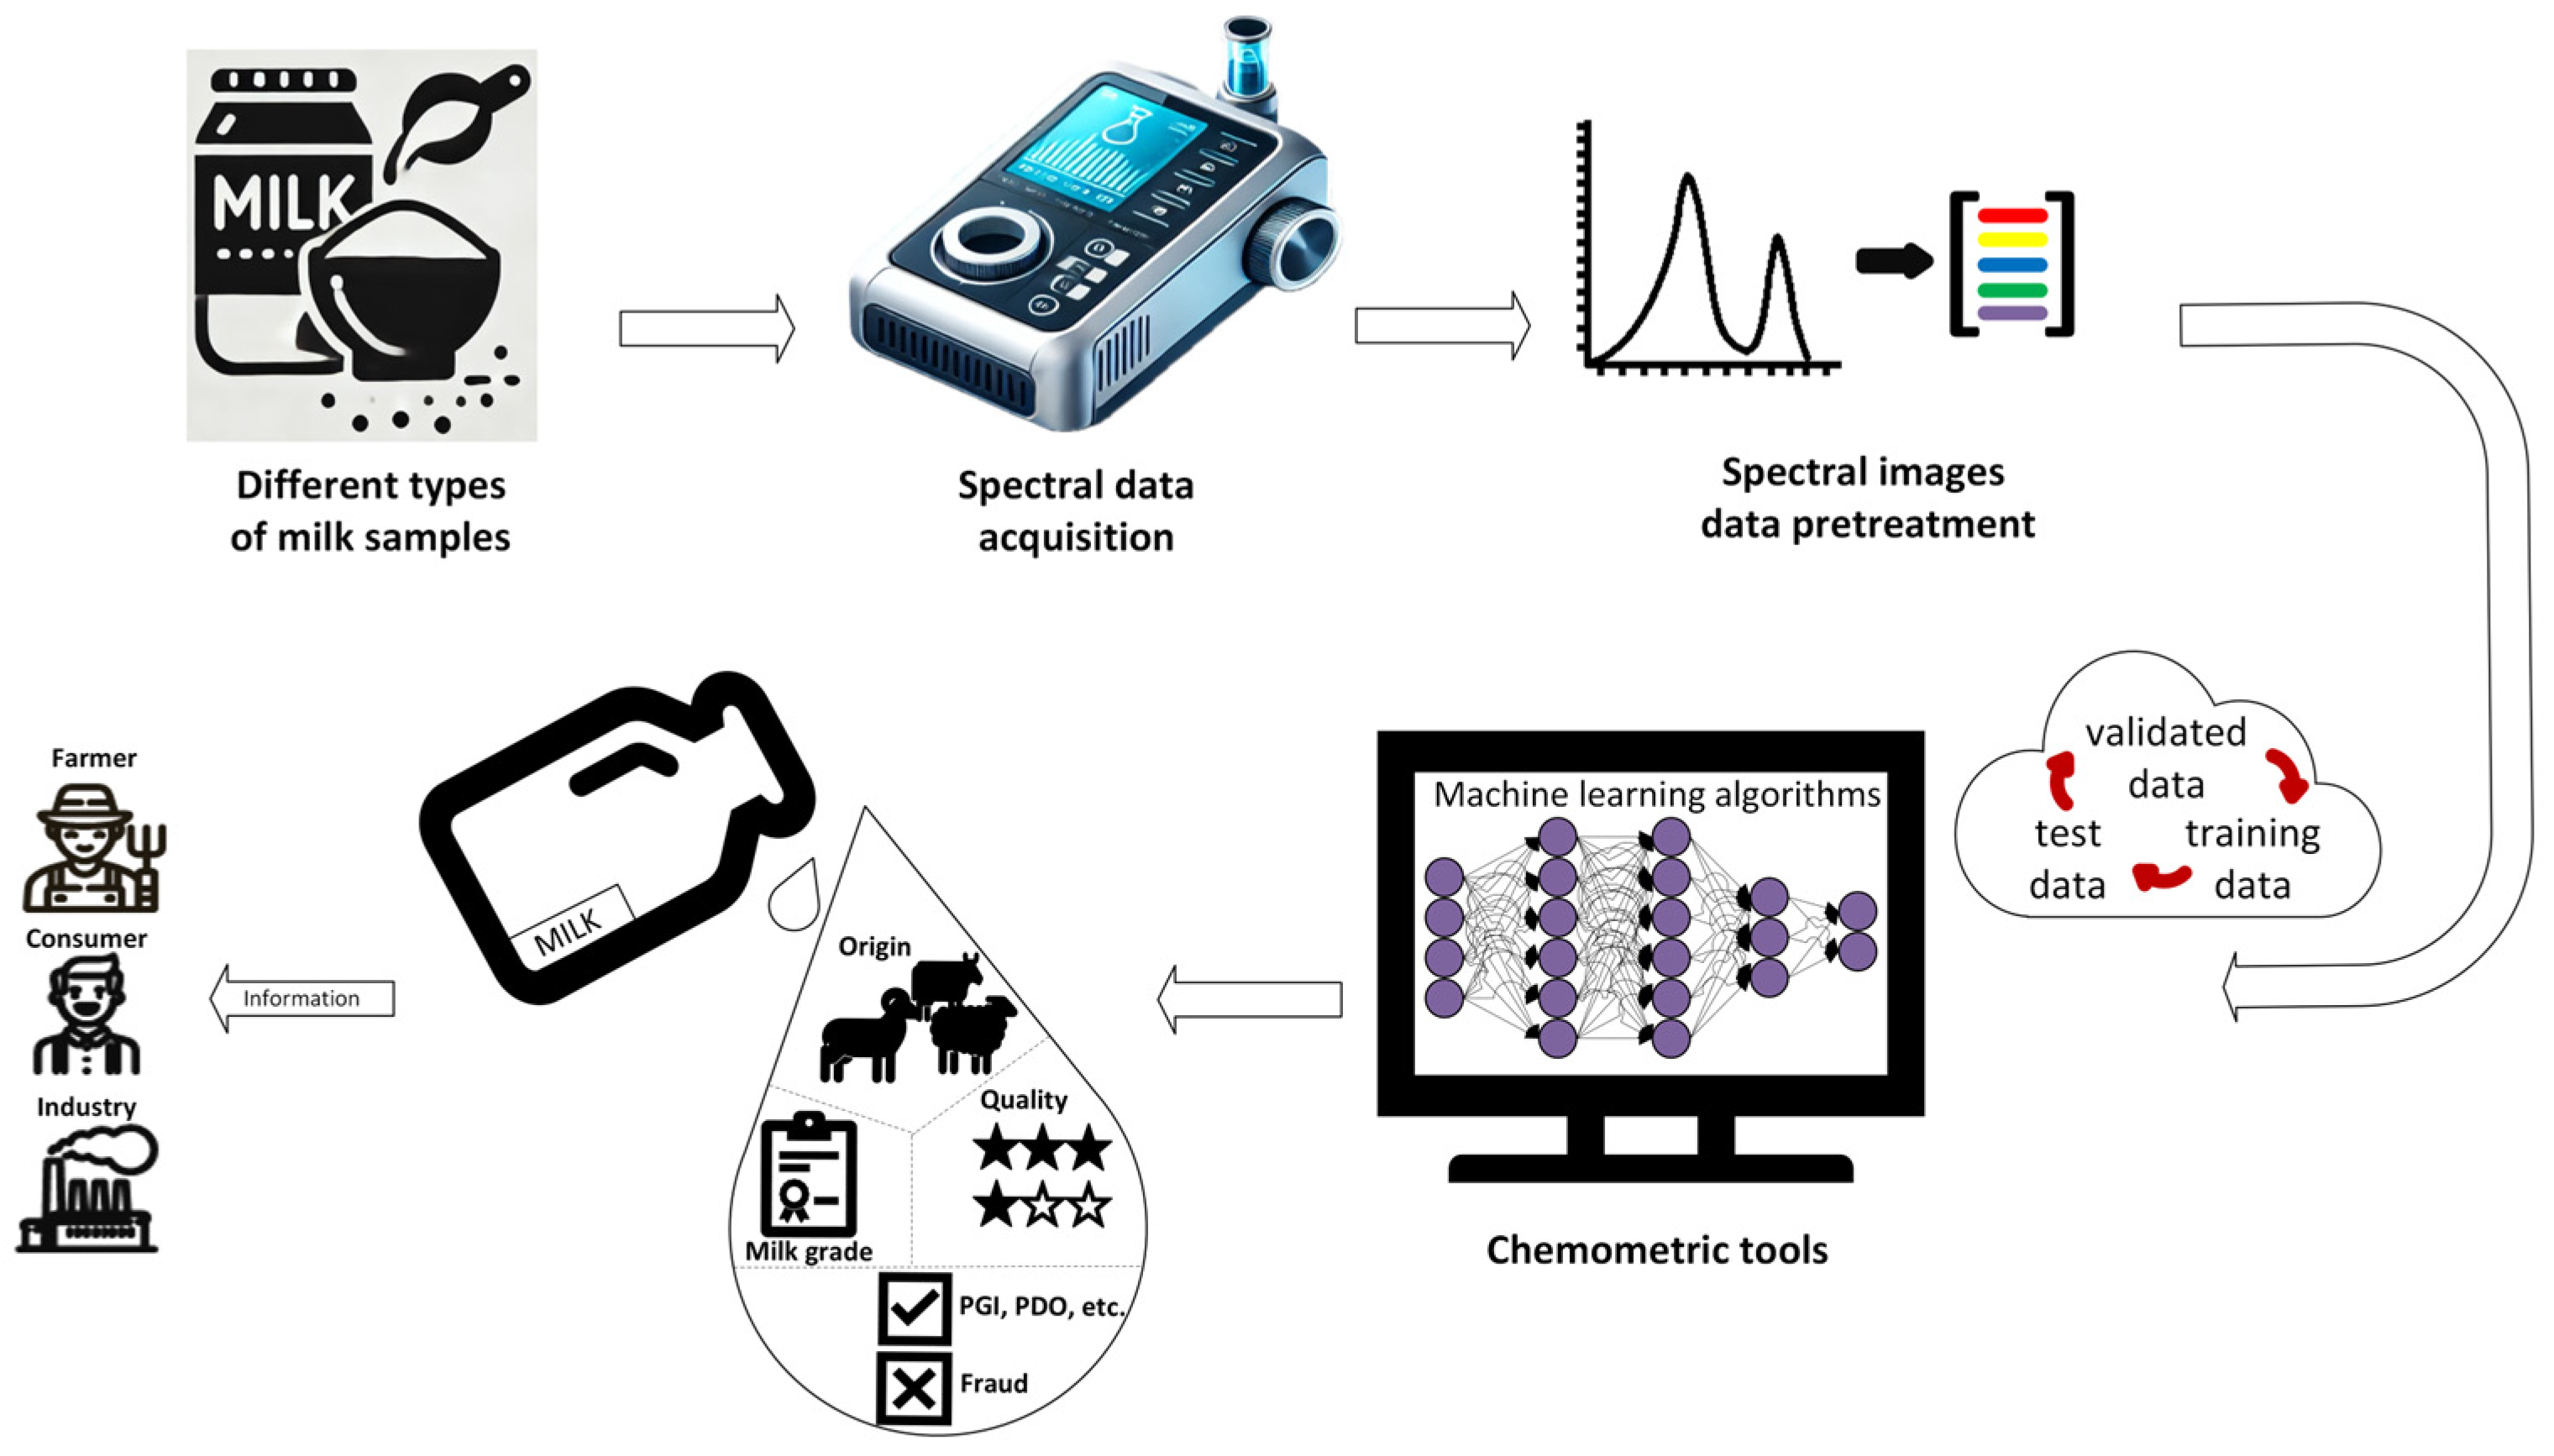
6. Application of Machine Learning Methods in Milk Quality Assessment

Lately, ML methods have been increasingly exploited in the dairy ruminant sector with various applications developed within the framework of the PLF. Among these applications, the ones exploited to assess milk quality and properties are emerging as valuable tools for both farms and the dairy industry (Figure 16). In the current review, we focus on examples of milk chemical analyses, but it is worth mentioning that machine learning techniques have also shown promise in detecting microbiological contaminants such as Brucella spp., E. coli O157, Bacillus cereus, and Listeria spp. in milk samples, illustrating their potential in microbiological safety assessments, although we will not address this aspect further [31,147]. Research studies using milk chemical analysis applications are summarized and discussed in the following sub-sections.

6.1. Milk Quality and Composition Assessment

The predictive ability of different regression and classification techniques documented by Frizzarin et al. [90] involved testing 730 milk samples (Table 11) from 622 individual crossbred cows to estimate the protein content, technological properties, and the produced MIR spectra. Samples were collected from animals at different lactation stages and of various parties. The milk technological properties assessed in this study were CMS, heat stability, RCT, curd-firming time (k20), curd firmness at 30 and 60 min (a30, a60), and pH, while milk protein fraction was also analyzed to estimate the αS1-casein (αS1CN), αS2-casein (αS2-CN), β-casein (β-CN), κ-casein (κ-CN), α-lactalbumin (α-LA), β-LG A, and β-lactoglobulin B (β-LG B) contents. For the statistical analyses, both regression-based and classification methods were used. Utilizing regression-based approaches, a total of 11 different ML methods were employed, with RF, Boosting, and NN being the most pertinent to this study. Besides regression methods, several classification approaches were also applied, with RF, Boosting Decision Trees, and SVM being the most significant ones. The key results of the regression-based methods showed that NN had the best performance concerning RCT, k20, and heat stability. LASSO (Least Absolute Shrinkage and Selection Operator) and Ridge Regression (RR) showed exceptional performance in forecasting distinct proteins. RF, along with PLSR and RR, assigned the highest coefficients to key wavelength space regions, which were crucial for several traits, including RCT, pH, and α-LA. Based on the classification output by Frizzarin et al. [90], it was evidenced that SVM was the most accurate model to assess binary technological attributes, whereas RF and Partial Least Squares Discriminant Analysis (PLSDA) performed in a similar way in predicting protein fractions. In terms of sensitivity, Boosting performed well but exhibited lower specificity. In particular, SVM achieved the highest accuracy in six out of the seven binary technological traits, including RCT, k20, a30, CMS, pH, and heat stability. For RCT, pH, and heat stability, SVM’s accuracy was similar to that of PLSDA’s. Moreover, SVM showed the highest accuracy for the prediction of α-LA and β-CN contents. On the other hand, RF was the most accurate method to predict αS1CN and κ-CN contents. For the recognition of coagulating properties, Boosting Decision Trees demonstrated a good sensitivity of 0.98 but poor specificity (0.50), indicating that Boosting could identify coagulating samples with satisfying accuracy but struggled with false positives [90].
By applying various ML techniques and PLSR, Mota et al. [148] examined the use of FTIR spectroscopy to predict different milk κ-CN phenotypes in Holstein cattle. The research aimed to evaluate the predictive power of RF, GBM, and EN, in comparison to PLSR. The study used phenotypic data from 471 cows, and two cross-validation techniques were applied to evaluate the models’ performance (Table 11). The κ-CN phenotype was evaluated in terms of predictive performance across the four different models. In the training set, the average predictive ability across 10 replicates was 0.96 for EN, 0.97 for GBM, 0.96 for RF, and 0.90 for PLS. Similarly, for the validation set, the average predictive ability across 10 replicates was 0.79 for EN, 0.81 for GBM, 0.80 for RF, and 0.77 for PLS; the respective RMSE values in the validation set were 1.25, 1.08, 1.18, and 1.41. The study’s main findings demonstrated that the GBM continuously produced the best predictions across all phenotypes, with predictive capacities ranging from 0.58 to 0.77 in the herd/date-out cross-validation and from 0.63 to 0.81 in the samples-out random cross-validation. Random forest followed this closely, with similar accuracy levels but slightly higher bias. In terms of accuracy, GBM performed better than PLS, RF, and EN (by 7%, 1%, and 4%, respectively). In comparison to PLS, GBM reduced predictive errors by 33%, RF by 26%, and EN by 25%, according to the RMSE analysis. The gradient boosting machine and RF significantly outperformed PLS in predictive accuracy (p < 0.05), especially in the samples-out random cross-validation, according to the Hotelling–Williams test. While both ML models outperformed PLS in the herd/date-out scenario, the difference was not statistically significant due to increased variability [148].
The study of Frizzarin et al. [149], provides a comprehensive evaluation of MIR spectra and the effectiveness of various ML methods to evaluate and discriminate milk samples derived from grazing and non-grazing cows. Various performance metrics, including F1 score, accuracy, sensitivity, specificity, and Cohen’s kappa coefficient, were estimated. Over a three-year period, the authors collected and analyzed 4320 milk samples (Table 11), which served as the basis for the comparisons between ML methods. The study tested 11 ML and statistical methods, namely, RR, LASSO, EN, LDA, model-based Discriminant Analysis (MB-DA), PLSDA, variable-selection Discriminant Analysis (VarSel-DA), RF, boosting, principal components linear regression (PC-LR), and SVM. Linear Discriminant Analysis and PLSDA emerged as the top-performing models accomplishing the highest accuracy (0.968) and F1 score (0.975); LDA had the highest specificity (0.980), while PLSDA had the highest sensitivity (0.962). Additionally, MB-DA had also a good performance, with high accuracy (0.968), sensitivity (0.959), and specificity (0.972), indicating its strong discriminatory power, with VarSel-DA closely following, with an accuracy of 0.961 and a strong F1 score (0.971). Principal Components Linear Regression yielded the lowest accuracy (0.667) and specificity (0.117), making it the least effective method. It also had the second-lowest F1 score (0.790), after RF which had the lowest one (0.781), and the lowest sensitivity (0.827), indicating a poor performance on identifying milk from grazing cows. While they did not match the top-performing models in terms of overall accuracy and sensitivity, other techniques like SVM and EN performed quite well [149].
Strong evidence in favor of combining NIR spectroscopy with Artificial Neural Networks (ANN) and Stacking Ensemble to predict blood metabolites from milk samples has been provided by Giannuzzi et al. [150]. Several ML methods were tested to build prediction models for blood metabolites including RF, GBM, ANN, PLS, and the Stacking Ensemble model. A total of 385 Holstein dairy cows made up the studied animal population. The AfiLab device was used to analyze the NIR spectra of milk samples collected by the cows. Among the studied ML methods, Stacking Ensemble and Multi-Layer Feedforward ANN outperformed other methods in predicting blood metabolites from milk samples. In that study, moderate correlations between observed and predicted values for key metabolites, like γ-glutamyl transferase (r = 0.58), haptoglobin (r = 0.66), and total reactive oxygen metabolites (r = 0.60), were observed (Table 11) [150].
Another piece of research by Giannuzzi et al. [151] aimed to predict 29 blood metabolites by using FTIR spectra and ML algorithms applied to milk samples of dairy cows. Primarily, 1204 Holstein cows made up the dataset, but the sample size increased to 2701 cows for β-hydroxybutyrate (BHB) (Table 11). The authors used an automatic ML algorithm that tested various prediction methods, including the EN, distributed random forest (DRF), GBM, ANN, and Stacking Ensemble. Additionally, the ML algorithms were comparatively assessed with PLSR. Two types of cross-validation (CV) scenarios were used; in the first, data were randomly split into five parts (CVr), while the second set of data were split by herds (CVh). The Stacking Ensemble method outperformed most of the blood metabolites studied across both CVr and CVh scenarios. In particular, EN and Stacking Ensemble showed up to 75% and 150% improvement in prediction accuracy for CVr and CVh, respectively, compared to PLS. The Stacking Ensemble model had the best R² values for glucose, urea, total reacting oxygen metabolites, globulins, Na, and ceruloplasmin. However, EN achieved the best R² values for albumin and total proteins. The CVh scenario had lower prediction abilities than the CVr, suggesting that herd-specific factors might have influenced the model’s performance [151].
In their study, Mota et al. [58] evaluated the potential use of the AfiLab real-time NIR milk analyzer measurements for the prediction of key cheese-making traits in Holstein cows, namely, k20, CFp (curd firmness peak), CYCurd (cheese yield from curd), CYWater (percentage cheese yield based on water content), and a45 (curd firmness in millimeters at 45 min) [58]. The study involved 499 cows from two farms. Several ML methods were applied and compared, including ANN, EN, GBM, XGBoost (eXtreme Gradient Boosting), and Stacking Ensemble (Table 11). Artificial Neural Networks achieved the highest predictive capacity, with R² values ranging from 0.45 (CFp) to 0.71 (CYCurd). The gradient boosting machine followed by R² values ranged from 0.45 (%CYWater) to 0.70 (CYCurd), while EN was the last one with satisfying results, with R² values ranging from 0.46 (CFp) to 0.70 (CYCurd). XGBoost exhibited the lowest R² values, ranging from 0.43 (a45) to 0.63 (k20) [58].
In their study, Samad et al. [9] evaluated milk quality using the k-NN algorithm. Milk samples were classified into three categories based on their quality status (low, medium, and high). The dataset included a total of 1059 entries, but the method of the milk analysis was not defined (Table 11). To detect milk quality, traits such as pH, temperature, taste (acceptable or poor), odor (foul or no foul), color, fat, and turbidity (high or low) were recorded and forced into the algorithm. As shown by the confusion matrices, the standard k-NN classifier achieved a high overall accuracy of 98.58%, with a particularly strong performance in detecting high-quality milk [9].
Soyeurt et al. [152] utilized four ML algorithms on data collected by MIR spectroscopy for the prediction of lactoferrin (LF) in bovine milk. They collected 6619 milk samples from various herds, breeds, and regions, creating a large dataset consisting of 5541 and 836 records for the training and the validation sets, respectively (Table 11). Each ML model was evaluated using RMSE and R² metrics for both calibration and validation sets. Partial least squares regression, PLS with linear support vector regression (PLS + SVR), PLS with polynomial support vector regression (PLS + Polynomial SVR), and PLS + ANN were the ML methods applied. Among them, PLS + ANN was the most appropriate and reliable model to predict LF content, demonstrating the highest R2 value (0.60), the lowest RMSE (162.17 mg/L), and the best residual distribution. Moreover, the PLS + ANN model predicted expected LF trends related to milk yield, somatic cell score, and lactation stage; however, it tended to underestimate LF values above 600 mg/L. It was concluded that the PLS + ANN model provided the best balance between prediction accuracy and robustness, particularly when predicting extreme values of LF, showcasing its realistic potential to be applied for LF monitoring as an udder health indicator [152].
Table 11. Milk quality and composition prediction according to the utilized ML method.
MLToolsNo and Type of Milk SamplesApplicationR2RMSEAccSeSpRef.
NNMIRS730 bRCT
k20
heat stability
κ-CN
0.50
0.36
0.45
0.42
(1) 6.397 min
(1) 2.770 min
(1) 5.464 min
(1) 1.095 g/L
---[90]
MFFANNNIRS385 bblood metabolites -----[150]
ANNNIRS499 bmilk technological properties (CFp, CYcurd, Recprotein, etc.)0.45 to 0.71(2) 0.02% to 0.84 mm---[58]
FTIR2701 bblood metabolites (hematocrit, myeloperoxidase, globulins, etc.)0.09 to 0.81 0.03 L/L to 80.59 U/L---[151]
k-NNsensors1059 NDmilk quality- -98.58%--[9]
PLSFTIR2701 b blood metabolites (hematocrit, myeloperoxidase, globulins, etc.)0.08 to 0.83 0.03 L/L to 106.37 U/L ---[151]
FTIR471 bκ-casein
BCS
BHB
(3) 0.90 tr 0.77 v
(3) 0.95 tr 0.57 v
(3) 0.88 tr 0.76 v
(1) 1.41 g/L
(1) 0.35
(1) 0.10
---[148]
PLS-DAMIRS730 btechnological and protein properties of milk--0.40–0.800.44-[90]
MIRS4320 bgrass-fed/non-grass-fed milk classification--0.9680.9770.962[149]
LDAMIRS4320 bgrass-fed/non-grass-fed milk classification--0.9680.9800.961[149]
SVMMIRS730 btechnological and protein properties of milk--0.43–0.800.44 (overall)1.00 (overall)[86]
MIRS4320 bgrass-fed/non-grass-fed milk classification--0.9470.9620.938[149]
BoostingMIRS4320 bgrass-fed/non-grass-fed milk classification- -0.7540.5870.842[149]
Boosting DTMIRS730 bcoagulation---0.500.98[90]
MB-DAMIRS4320 bgrass-fed/non-grass-fed milk classification--0.9640.9720.959[149]
GBMNIRS499 bmilk technological properties (CFp, CYcurd, Recprotein, etc.)0.45 to 0.70 (2) 0.02% to 0.87 mm---[58]
FTIR471 bκ-casein
BCS
BHB
(4) 0.97 tr 0.81 v
(4) 0.91 tr 0.63 v
(4) 0.90 tr 0.77 v
(1) 1.08
(1) 0.25
(1) 0.09
---[148]
FTIR2701 b blood metabolites (hematocrit, myeloperoxidase, globulins, etc.)0.10 to 0.83 0.03 L/L to 75.69 U/L---[151]
XGBNIRS499 bmilk technological properties (CFp, CYcurd, Recprotein, etc.)0.43 to 0.63(2) 0.02% to 0.90 mm---[58]
FTIR2701 bblood metabolites (hematocrit, myeloperoxidase, globulins, etc.)0.08 to 0.780.03 L/L to 80.23 U/L---[151]
RFMIRS730 bαS1-CN,
κ-CN
--0.48
0.45
0.44-[90]
FTIR471 bκ-casein
BCS
BHB
(3) 0.96 tr 0.80 v
(3) 0.95 tr 0.61 v
(3) 0.90 tr 0.79 v
(1) 1.18
(1) 0.26
(1) 0.10
---[148]
MIRS4320 bgrass-fed/non-grass-fed milk classification--0.6960.4470.827[149]
DRFFTIR2701 b blood metabolites (hematocrit, myeloperoxidase, globulins, etc.)0.09 to 0.79 0.03 L/L to 82.49 U/L ---[151]
ENNIRS 499 b milk technological properties (CFp, CYcurd, Recprotein, etc.)0.46 to 0.71 (2) 0.02% to 0.78 mm---[58]
FTIR471 bκ-casein
BCS
BHB
(3) 0.96 tr 0.79 v
(3) 0.92 tr 0.59 v
(3) 0.89 tr 0.78 v
(1) 1.25
(1) 0.27
(1) 0.10
---[148]
MIRS4320 bgrass-fed/ non-grass-fed milk classification--0.9510.9600.946[149]
FTIR2701 bblood metabolites (hematocrit, myeloperoxidase, globulins, etc.)0.12 to 0.87 0.03 L/L to 82.99 U/L ---[151]
LASSOMIRS730 nCMS,
κ-CN
0.08
0.42
(1) 25.286 mm
(1) 1.095 g/L
---[90]
MIRS4320 bgrass-fed/non-grass-fed milk classification--0.9590.9700.953[149]
PC-LRMIRS4320 bgrass-fed/non-grass-fed milk classification--0.6670.1170.956[149]
RRMIRS730 ba30,
β-CN,
β-LG A
0.37
0.35
0.19
12.495 mm
1.759 g/L
1.050 g/L
---[90]
MIRS4320 bgrass-fed/non-grass-fed milk classification--0.8800.7790.933[149]
Stacking EnsembleNIRS385 bblood metabolites-----[149]
FTIR2701 bblood metabolites (hematocrit, myeloperoxidase, globulins, etc.)0.13 to 0.87 0.03 L/L to 76.33 U/L---[151]
VarSel-DAMIRS4320 bgrass-fed/non-grass-fed milk classification--0.8900.8450.913[149]
PLS + ANNMIRS6619 b LF in milk0.60 c
0.55 cv
0.60 v
130.59 c mg/L
139.01 cv mg/L
162.17 v mg/L
---[152]
PLSRMIRS6619 bLF in milk0.53 c
0.51 cv
0.61 v
140.94 c mg/L
144.31 cv mg/L
163.76 v mg/L
---[152]
PLS + SVMMIRS6619 bLF in milk0.53 c
0.53 cv
0.63 v
144.32 c mg/L
144.60 cv mg/L
174.92 v mg/L
---[152]
PLS + Polynomial SVMMIRS6619 bLF in milk0.64 c
0.56 cv
0.62 v
125.89 c mg/L
138.40 cv mg/L
166.75 v mg/L
---[152]
(1) RMSEV: root mean square error from the cross-validation data, (2) RMSLE: root mean squared logarithmic error, (3) r: average of predictive ability, c: calibration, cv: cross-validation, v: validation, tr: training, b: bovine, MFFANN: multi-layer feedforward artificial neural network, NIRS: Near-Infrared Spectroscopy, Acc: accuracy, Sp: specificity, Se: sensitivity, ND: not defined, ML: Machine Learning, NN: Neural Networks, MIRS: mid-infrared spectroscopy, CMS: casein micelle size, RCT: rennet coagulation time, k20: curd-firming time, CN: casein, RMSE: root mean square error, ANN: artificial neural network, FTIR: Fourier transform infrared, CYcurd: weight of fresh curd, PLS: Partial least squares, k-NN: k-Nearest Neighbors, PLS-DA: Partial least squares discriminant analysis, LDA: Linear Discriminant Analysis, SVM: Support Vector Machines, DT: Decision Tree, MB-DA: model-based discriminant analysis, GBM: gradient boosting machines, XGB: extreme gradient boosting, BCS: body condition score, BHB: blood β-hydroxybutyrate, RF: random forest, DRF: distributed random forest, EN: Elastic Net, CFp: curd firmness peak, LASSO: least absolute shrinkage and selection operator, PC-LR: principal components linear regression, RR: ridge regression, VarSel-DA: variable-selection discriminant analysis, a30: curd firmness at 30 min, PLSR: Partial least squares regression, LF = lactoferin.
Also, Bai et al. [136], in their research, proposed an algorithm that was based on multi-feature extraction and gradient boosting decision trees (GBDT)-Adaboost fusion model to identify different types of bovine milk somatic cells. For the identification and classification of bovine milk somatic cells, 392 cell images from four types of cells were initially identified; 65 were identified as epithelial cells, 112 as lymphoid cells, 81 as macrophages, and 134 as neutrophils (Table 11). After that, the images were preprocessed using the K-means clustering method. Afterward, the extracted cell features were entered into the GBDT model for optimization and the optimized features were forced into the AdaBoost classifier for cell recognition. The model with the best recall rate across all cell types and F1-Score was the GBDT-AdaBoost. The model achieved 98.0%, 96.8%, 97.5%, and 97.0% in classification accuracy, accuracy, recall rate, and F-value of the comprehensive evaluation index, respectively. In the same study, the classification accuracy values for RF, ET, DTs, and LightGBM models were 79.9%, 71.1%, 67.3%, and 77.2%, respectively [136].

6.2. Fraud Detection and Adulteration Identification

To detect fraud in caprine milk, Teixeira et al. [153] developed multivariate classification models using milk analyses performed by a NIRS system. The study focused on building models to classify authentic and adulterated goat milk samples and to recognize some fraudulent ingredients like water, urea, bovine milk, and whey (classes). A total of 300 authentic caprine milk samples and 300 adulterated ones were created by adding the studied adulterants to the authentic samples in five concentrations, namely, 1%, 5%, 10%, 15%, and 20% (Table 12). It was found that multivariate classification models could successfully identify fraud in caprine milk. Indeed, k-NN for a 2-class model (authentic goat milk and adulterated goat milk) achieved 95% to 99% sensitivity and 94% to 96.5% specificity, successfully distinguishing adulterated samples from authentic ones. For a 5-class model (authentic goat milk and four for the types of adulterants added (water, urea, bovine whey, and milk), k-NN achieved sensitivity and specificity, ranging from 76% to 100% depending on the adulterant type. Additionally, soft independent modeling of class analogies (SIMCA) sensitivity and specificity values ranged from 93.0% to 98.9%, for the 2-class model, and for the 5-class model SIMCA, they achieved slightly less consistent classification performance than PLSDA, with sensitivity and specificity ranging between 90.4% to 100.0%. In general, PLSDA outperformed the other methods, producing the most consistent results, with 100% sensitivity and specificity in distinguishing between authentic and adulterated samples for both the 2-class and the 5-class models [153].
In another study, a prediction model for the detection of cow and buffalo milk adulteration using synchronous front-face fluorescence spectroscopy and PLSR was developed by Ullah et al. [154]. In that study, 10 raw cow and buffalo milk samples were collected and 30 distinct mixtures (0–100%) of cow with buffalo milk were prepared (Table 12). The model using PLSR achieved a high R2 value (0.99), with a satisfactory performance for adulteration levels above 20%. The RMSE for CV was 1.16, showing low error for the validation phase, while the RMSE for the prediction phase was 6.24, underpinning the poor performance of the model for adulteration levels below 20%. For further quantification of the model’s sensitivity, Ullah et al. evaluated three detection limits, with Limit of Blank (LOB), Limit of Detection (LOD), and Limit of Quantification (LOQ) being equal to 9.22%, 18.45%, and 55.9%, respectively [154].
In a recent study, Sowmya and Ponnusamy [155] developed a spectroscopy-based sensor system for IoT applications to detect adulterants in milk. Ultraviolet, visible, and IR spectra were used as spectroscopic methods to enhance the adulterant’s detection accuracy. By using DTs, NB, LDA, SVM, and NN, the adulteration detection problem was formulated as a classification task. The dataset consisted of 16200 spectral data samples, with 70% being selected for the training, 15% for the validation, and 15% for the testing of the models (Table 12). The accuracy values of the utilized ML models were 92.7%, 91.7%, 90%, 90%, and 88.1%, for NN, DTs, SVM, NB, and LDA, respectively. Since NN outperformed the rest of the ML methods, a genetic algorithm was used to adjust the hyperparameters, increasing the accuracy from 92.7% to 100%. Additionally, two ΝΝ models were developed in the same study; a binary model to determine the presence of adulterants and a multiclass model to categorize samples as pure milk or as milk containing one of the four studied adulterants (ammonium sulfate, sodium salicylate, dextrose, and hydrogen peroxide). After the hyperparameter tuning, the binary classification model produced 100% accurate results, which were verified with a confusion matrix. Furthermore, regarding the multiclass classification problem, which involved five classes (pure milk and four adulterants), the ΝΝ model also achieved 100% accuracy. Similar to the binary classification, the confusion matrix and ROC (Receiver Operating Characteristics) curve demonstrated the model’s excellent performance in classifying adulterants in milk. In comparison to other methods, the proposed system was found to be superior due to its ability to (i) work across multiple spectral wavelengths, (ii) achieve absolute accuracy, (iii) detect multiple adulterants, and (iv) offer a portable, cost-effective, and rapid solution for real-time milk adulterant detection [155].
Machine learning methods, such as classification and regression trees (CART) and multilayer perceptron (MLP) NN combined with FTIR spectroscopy, were used to detect the addition of cheese whey to milk by Lima et al. [156]. In total, 520 milk samples, adulterated with cheese whey in concentrations ranging from 1% to 30%, were tested and comparatively assessed with 65 control samples (Table 12). The CART model identified lactose as being the most significant predictor with 100% relative importance. Moreover, the CART model demonstrated a remarkable predictive performance of the addition of cheese whey using compositional features like lactose and protein, achieving 96.2% and 0.994 and 97.2% and 0.980 accuracy and area under the curve (AUC) values for the training and the test sample, respectively. The MLP model, which employed inputs like protein, casein, lactose, SNF, TS, and freezing point, achieved an overall accuracy of 97.8% (97.4% and 97.8% for the training and the testing sample, respectively). Despite the satisfying accuracy in detecting adulterated samples from both approaches, MLP was the model with the best performance, in terms of prediction accuracy and misclassification rate [156].
Wang et al. [157] used FTIR absorption profiles along with ML techniques to determine the amount of heat treatment applied to milk. This study evaluated four ML classifiers, namely, RF, SVM, k-NN, and LDA. Random forest outperformed the other methods, achieving a mean accuracy of 0.92 ± 0.03, followed by SVM with a mean accuracy of 0.90 ± 0.04, k-NN with 0.86 ± 0.10, and LDA with 0.84 ± 0.10 (Table 12). Similarly, RF demonstrated the highest precision (0.90 ± 0.03), indicating fewer false positives, and wit the F1-score (0.90 ± 0.03) indicating an overall better classification performance. Further evidence that RF was the better model was derived from the statistically significant (p < 0.001) differences in the performance between the models [157].
Moncayo et al. [50] utilized NN for both qualitative analysis of milk blends and the detection and quantification of melamine in adulterated toddler milk powder, using LIBS. An aggregate of 10 pure milk samples was used (4 bovine, 4 caprine, and 2 ovine), alongside 12 mixtures of these pure samples (9 binary mixtures and 3 ternary mixtures) (Table 12). The neural networks method demonstrated increased accuracy in distinguishing between different types of milk and identifying adulteration in the mixtures; it also exhibited a strong generalization capacity, while avoiding overfitting and successfully classifying 100% of the pure and adulterated milk samples. Samples with melamine concentrations ranging from 1% to 6% were used for the melamine adulteration study, and a calibration curve was created using these samples. The NN model provided exceptional results, with a regression coefficient of 0.999, indicating almost perfect accuracy in predicting the melamine adulterated samples [50].
Table 12. Fraud detection and adulteration identification according to the utilized ML method.
MLToolsNo and Type of Milk SamplesApplicationR2RMSESe
(%)
Sp
(%)
AccuracyRef.
NNLIBS22 b, c, omelamine in toddler milk powder0.999---Acc: 100%[50]
UV, Vis, IRNDadulterants in milk----Acc: 100%[155]
CNNLIBS25 rprotein adulteration in milk powder----Acc: 97.8%[57]
PLS-DANIRS600 b, cfraud in goat milk:
water
urea
bovine whey
milk
authentic
--100 in all cases100 in all cases-[153]
PLSRFluorescence40 badulteration in milk0.99(1) 1.16 (2) 6.24---[154]
NBUV, Vis, IRNDadulterants in milk----90%[155]
DTUV, Vis, IRNDadulterants in milk----91.7%[155]
LDAUV, Vis, IRNDadulterants in milk----88.1%[155]
FTIR NDheat treatment to milk ----0.84[157]
RFFTIR NDheat treatment to milk ----0.92[157]
LIBS25 rprotein adulteration in milk powder-- 0.886 (train) 0.871 (test)[57]
k-NNNIRS600 b, cfraud in goat milk:
water
urea
bovine whey
milk
authentic
--76.0
80.0
96.0
80.0
99.0
96.6
95.4
100
100
88.0
-[153]
FTIR NDheat treatment to milk ----0.86[157]
LIBS25 r protein adulteration in milk powder----0.884 (train) 0.867 (test)[57]
SVMUV, Vis, IRNDadulterants in milk----90%[155]
LIBS25 rprotein adulteration in milk powder----0.961 (train) 0.938 (test)[57]
FTIR NDheat treatment to milk ----0.90[157]
CARTFTIR520 bfraud of cheese whey to milk----96.2% (train), 97.2% (test)[156]
MLPFTIR520 bfraud of cheese whey to milk----97.8% [156]
(1) RMSECV: root mean square error in cross validation, (2) RMSECP: root mean square error in prediction, r: retail, c: caprine, o: ovine, b: bovine, ND: not defined, NN: Neural Networks, LIBS: laser-induced breakdown spectroscopy, UV: Ultraviolet, Vis: visible, IR: Infrared, CNN: convolutional neural network, PLS-DA: Partial least squares discriminant analysis, NIRS: near-infrared spectroscopy, PLSR: Partial Least Square Regression, RMSE: root mean square error, NB: Naive Bayes, DT: Decision Tree, FTIR: Fourier transform infrared, LDA: Linear Discriminant Analysis, RF: random forest, k-NN: k-Nearest Neighbors, SVM: Support Vector Machines, CART: classification and regression trees, MLP: multilayer perceptron, acc: accuracy, sp: specificity, se: sensitivity.

6.3. Milk Source and Origin Classification

In their study, Nanou et al. [49], utilized ML on the spectra obtained by LIBS to identify the species the milk originated from (cow, goat, or sheep). For this reason, 683 lyophilized milk powder samples and 1296 raw liquid milk samples were examined by LIBS (Table 13). The accompanying spectra were then examined using various ML algorithms to classify milk samples according to the species of origin. The trained models’ parameters were adjusted to achieve reliable results when applying the NN algorithm. The key parameters selected for evaluation in a single-layer MLP NN included the activation function of the hidden layer and the number of neurons it contains. For the LIBS spectra of liquid milk, the best results were obtained with 500 neurons in the hidden layer and the logistic sigmoid activation function, achieving a training (classification) accuracy of 97.2% (±0.6%) and a testing (predictive) accuracy of 86.3%. For the LIBS spectra of powder milk, the optimal parameters were 300 neurons in the hidden layer with the hyperbolic tangent (tanh) activation function, resulting in a training accuracy of 97.5% (±0.4%) and a testing accuracy of 94.5%. Using only the spectral lines of Mg(II), Ca(II), Ca(I), Na(I), and K(I) for liquid milk, the NN achieved a training accuracy of 98.0% (±0.1%) and a testing accuracy of 87.4%. Similarly, for milk powder, the training accuracy was 98.6% (±0.1%) and the testing accuracy was 92.7% when the same spectral lines were considered. For liquid milk, the best performance for mineral spectra was achieved with 60 neurons and the sigmoid logistic activation function, while for milk powder, the optimum parameters were 90 neurons and the ReLU activation function. In addition, the key results for SVM, LR, and Gradient Boosting (GB) are summarized as follows: the SVM method with a linear kernel accomplished a training accuracy of approximately 96.6% (± 0.2%) concerning liquid milk and 96.2% (±0.2%) for milk powder, with relevant test accuracy of 91.3% and 93.1%, respectively. The Support Vector Machine carried out satisfying results when using specific spectral lines (Mg, Ca, Na, K) instead of the entire LIBS spectra, showing its efficiency in classifying milk samples. Similarly, LR showed excellent accuracy in samples of both liquid and powdered milk; it exhibited a training accuracy of 95.2% (±0.3%) and a testing accuracy of 92.8% for liquid milk, while the respective values for milk powder were 95.4% (±0.2%) and 93.5%, respectively. Furthermore, GB demonstrated satisfying performance, achieving a training accuracy of 96.7% (±0.2%) and a testing accuracy of 83.0% for liquid milk samples and a training accuracy of 97.4% (±0.3%) with a testing accuracy of 91.4% for milk powder samples, surpassing the performance of other models. Finally, comparable classification outcomes were achieved by utilizing the Mg, Ca, Na, and K spectral lines rather than the complete LIBS spectra in the SVM, LR, and GB algorithms [49].
In their study, Amjad et al. [43], focused on the development of an ML-based classification system using Raman spectroscopy to distinguish human, cow, buffalo, and goat milk samples by investigating the spectral differences. A total of 602 milk samples were used in the study, 210 from humans, 152 from cows, 120 from buffaloes, and 120 from goats (Table 13). Principal Component Analysis was applied for the reduction in data dimensionality. Based on the transformed data from PCA, RF was employed to classify the milk samples into one of the four species. Moreover, several performance measures were estimated, including true positive, true negative, false positive, false negative, accuracy, sensitivity, and specificity. The average classification accuracy during the training phase was 94.3%, compared to 94.0% in the testing phase. The overall accuracy of the testing data was approximately 93.6%. The classification performance was the highest for human milk, achieving sensitivity and specificity values of 1.00 and 0.99, respectively. Compared to human milk, cow, buffalo, and goat milk showed some overlapping features, resulting in a higher misclassification rate. Indeed, sensitivity values were 0.95, 0.88, and 0.90 for cow, buffalo, and goat milk, respectively, whereas, the relevant values regarding specificity ranged from 0.96 to 0.99 [43].
The determination of milk origin was also studied by Behkami et al. [158], who utilized ANN to classify the geographical origin of raw cow milk based on spectral data obtained from two instruments: UV–Vis/NIR, with three detectors, and FT-NIR, with a single detector. Principal component analysis and ANN were applied to reduce the dimensionality of spectral data, making it suitable for the ANN classification process. A total of 63 raw cow milk samples were separated into training (60%), testing (25%), and validation (15%) sets (Table 13). The ANN architecture involved input, hidden, and output layers. Boosting was used to integrate models’ performance by combining smaller models into a larger additive model, where 10 boosting models, 2 base models, and learning rates of 0.1 and 1 were the boosting parameters. One hidden layer with 10 neurons, 1 output node, and 7 input nodes made up the best model architecture, managing to achieve a learning rate of 1. This model reached 100% classification accuracy and using only two principal components (PCs), with a learning rate of 1, resulted in a 100% classification rate, explaining 95% of the training data and 92% of the validation data variance. Also, the best model with 10 input nodes, one hidden layer of 10 neurons, and one output node achieved a 100% prediction rate. Reducing the input variables (PCs) to four still gave 100% classification accuracy, especially with a higher learning rate of 1. Additionally, model performance was not adversely affected by the reduction in the number of PCs, indicating that the approach is strong even in the presence of fewer inputs [158].

7. Future Research

Future studies could aim to prove that the systems developed for milk analysis are operational in real-time applications in the dairy industry. One of the biggest challenges for long-term monitoring systems is how to develop flexible systems that can adapt to different sets of conditions (i.e., different conditions, animals, terrain, dirt), which might have a significant effect on the performance of the monitoring systems [106]. Even though a great deal of computational and analytic techniques have been developed for dairy farms, relatively few of them have been field-tested.
Even though spectroscopy has long been a research focus, recent developments in hardware and software offer a plethora of opportunities for future research. These advancements, including the wide use of AI and ML techniques, have opened a wide range of applications in milk analysis, while simultaneously improving the precision and efficiency of spectroscopic methods. With knowledge of the successful results of techniques fusion (ex. NIRS with LIBS [55]), another interesting suggestion is to combine different spectroscopy methods in order to fully exploit their strengths, for instance, to combine NIR, MIR, or UV spectroscopy with fluorescence spectroscopy. This initiates a wide range of research opportunities where extraordinary results can be achieved by combining complementary spectroscopy methods with the right ML techniques. Furthermore, since some of the methods (like Raman spectroscopy [105]) have not been extensively tested in conjunction with ML techniques, there is also room for more research.
Future research should combine data obtained directly from the source (farm, animals, etc.) with data analyzed from related datasets to optimize the use of all available information. Additionally, the integration of blockchain technology can ensure data integrity and transparency across the milk supply chain, providing sealed records for milk quality, efficient safety management systems, and safety parameters [159,160]. Another emerging tool is the digital twin, which can simulate real-world dairy production environments, allowing for real-time virtual testing of system adaptations and sensor behaviors before physical implementation, addressing the challenges of different conditions, animals, and terrains [160]. Also, there are certain difficulties with dairy production data management, such as the volume and complexity of these massive datasets, real-time data processing, especially for farms with limitations on internet access, and data quality and accuracy based on the conditions of the sensors and data integration, which involves data from different systems [118]. Currently, farmers can only invest in multiple systems for maximum benefit, despite manufacturers’ claims to provide complete solutions. No single sensor system can accomplish everything that could be accomplished by utilizing all of the systems working together [161].

8. Conclusions

It is essential to comprehend the complex composition of milk and measure its key components accurately to optimize dairy production and ensure high product quality. As dairy producers and researchers continue to explore novel technologies and refine existing methods, the integration of sophisticated analytical tools and a deep understanding of milk’s biochemical and optical properties will drive improvements in both dairy farming practices and product development. Precision livestock farming tools assist farmers in their decision-making by optimizing the management of daily tasks and herd supervision. This review underlines the importance of the application of innovative technologies in dairy ruminants. The use of spectroscopy-based methods for milk analysis combined with a variety of ML methods for real-time data analysis has proven the optimal approach in numerous cases.
This review was a comparative study of multiple spectroscopy and ML techniques. Different methods might be the best option depending on the application. In general, IR methods are more popular, with wide use in milk analysis. Particularly, NIRS gaining popularity due to its speed, reliability, environmental friendliness, and applicability in real-time applications. As seen in the comparison of the various methods, however, in most cases, NIRS and MIRS have approximately the same predictive accuracy. On the other hand, LIBS has been proven suitable for applications like animal origin identification. Another interesting observation was that the fusion of spectroscopy techniques that are complementary to each other such as NIRS and LIBS, in some cases, results in very successful results. It was established that no specific classifier has the best fit for all problems and no classifier is always better than another one. However, ML techniques have proven to be powerful methods for advancing and understanding dairy production, giving us, among other benefits, efficient solutions for milk traits, metabolic status, and dairy cow durability, to identify milk origins and detect rigging. Among the studies, NN had most of the time, in both regression and classification, the best performance, as much in predicting milk composition, technological properties, and blood metabolites, as in fraud detection and species identification. Additionally, SVM also excelled in specific applications such as milk quality classification. Concerning the regression-based methods, NN and RR were the ones that demonstrated high accuracy for predicting milk characteristics. Regarding classification tools, SVM excelled, particularly in predicting binary traits. Also, PLSDA showed excellent performance in milk classification and adulterant classification. Artificial neural networks, especially when combined with dimensionality reduction techniques, proved robust for regional origin classification and for other health metrics of dairy ruminants related to milk analysis. In fact, algorithms like RF, GB, and k-NN also appeared to have competitive results in certain contexts but in most cases were outperformed by SVM and NN. Taking everything into account, major factors in higher yield or production are the better identification and management of animal health problems as well as adherence to medical guidelines. Finally, this review’s underlying conclusion is that combining ML techniques with spectroscopy-based methods plays an increasingly important role in real-time milk analysis.

Author Contributions

Conceptualization, A.-A.A., M.P.N., A.I.G. and T.B.; methodology, A.-A.A., M.P.N., T.B., N.C., K.D. and A.I.G.; investigation, A.-A.A. and M.P.N.; writing—original draft preparation, A.-A.A. and M.P.N.; writing—review and editing, A.I.G., T.B., N.C. and K.D.; supervision, A.I.G. and T.B., funding acquisition: A.I.G. and T.B. All authors have read and agreed to the published version of the manuscript.

Funding

This research is implemented within the framework of the National Recovery and Resilience Plan «Greece 2.0» funded by the European Union—NextGenerationEU: ΥΠ1TA-0558858 & ΥΠ1TA-0558937.Chemosensors 12 00263 i001

Acknowledgments

The authors would like to thank TCB Avgidis Automations S.A. and Telefarm S.A. for their invaluable support in the preparation of this review. The resources, administrative assistance, and access to relevant materials provided by TCB Avgidis Automations S.A. and Telefarm S.A. were essential in enabling the authors to thoroughly analyze and compile the information presented in this manuscript. This support is gratefully acknowledged.

Conflicts of Interest

A.-A.A. was employed by TCB Avgidis Automations S.A. and M.P.N. was employed by Telefarm S.A. The remaining authors declare that the research was conducted in the absence of any commercial or financial relationships that could be construed as a potential conflict of interest.

References

  1. McLeod, A. World Livestock 2011: Livestock in Food Security; FAO: Rome, Italy, 2011; ISBN 978-92-5-107013-0. [Google Scholar]
  2. UN (United Nations) Department of Economic and Social Affairs, Population Division. World Population Prospects. 2019. Available online: https://population.un.org/wpp/publications/files/wpp2019_highlights.pdf (accessed on 29 April 2024).
  3. Neethirajan, S.; Kemp, B. Digital Livestock Farming. Sens. Bio-Sens. Res. 2021, 32, 100408. [Google Scholar] [CrossRef]
  4. Halachmi, I.; Guarino, M.; Bewley, J.; Pastell, M. Smart Animal Agriculture: Application of Real-Time Sensors to Improve Animal Well-Being and Production. Annu. Rev. Anim. Biosci. 2019, 7, 403–425. [Google Scholar] [CrossRef] [PubMed]
  5. Ochs, D.S.; Wolf, C.A.; Widmar, N.J.O.; Bir, C. Consumer Perceptions of Egg-Laying Hen Housing Systems. Poult. Sci. 2018, 97, 3390–3396. [Google Scholar] [CrossRef]
  6. Anestis, V.; Bartzanas, T.; Kittas, C. Life Cycle Inventory Analyis for the Milk Produced in a Greek Commercial Dairy Farm—The Link to Precision Livestock Farming. ResearchGate. Available online: https://www.researchgate.net/publication/310005326_Life_cycle_inventory_analysis_for_the_milk_produced_by_a_Greek_commercial_dairy_farm (accessed on 15 September 2024).
  7. Pereira, P.C. Milk Nutritional Composition and Its Role in Human Health. Nutrition 2014, 30, 619–627. [Google Scholar] [CrossRef]
  8. Evangelista, C.; Basiricò, L.; Bernabucci, U. An Overview on the Use of Near Infrared Spectroscopy (NIRS) on Farms for the Management of Dairy Cows. Agriculture 2021, 11, 296. [Google Scholar] [CrossRef]
  9. Samad, A.; Taze, S.; Kürsad Uçar, M. Enhancing Milk Quality Detection with Machine Learning: A Comparative Analysis of KNN and Distance-Weighted KNN Algorithms. Int. J. Innov. Sci. Res. Technol. (IJISRT) 2024, 9, 2021–2029. [Google Scholar] [CrossRef]
  10. Tullo, E.; Finzi, A.; Guarino, M. Review: Environmental Impact of Livestock Farming and Precision Livestock Farming as a Mitigation Strategy. Sci. Total Environ. 2019, 650, 2751–2760. [Google Scholar] [CrossRef] [PubMed]
  11. Helwatkar, A.; Riordan, D.; Walsh, J. Sensor Technology for Animal Health Monitoring. Int. J. Smart Sens. Intell. Syst. 2014, 7, 1–6. [Google Scholar] [CrossRef]
  12. Neethirajan, S. Recent Advances in Wearable Sensors for Animal Health Management. Sens. Bio-Sens. Res. 2017, 12, 15–29. [Google Scholar] [CrossRef]
  13. Spectroscopy | Definition, Types, & Facts | Britannica. Available online: https://www.britannica.com/science/spectroscopy (accessed on 12 September 2024).
  14. Pu, Y.-Y.; O’Donnell, C.; Tobin, J.T.; O’Shea, N. Review of Near-Infrared Spectroscopy as a Process Analytical Technology for Real-Time Product Monitoring in Dairy Processing. Int. Dairy J. 2020, 103, 104623. [Google Scholar] [CrossRef]
  15. Agelet, L.E.; Hurburgh, C.R. A Tutorial on Near Infrared Spectroscopy and Its Calibration. Crit. Rev. Anal. Chem. 2010, 40, 246–260. [Google Scholar] [CrossRef]
  16. Herschel, W. Investigation of the Powers of the Prismatic Colours to Heat and Illuminate Objects; With Remarks, That Prove the Different Refrangibility of Radiant Heat. To Which Is Added, an Inquiry into the Method of Viewing the Sun Advantageously, with Telescopes of Large Apertures and High Magnifying Powers. Philos. Trans. R. Soc. Lond. 1800, 90, 255–283. [Google Scholar]
  17. Gastélum-Barrios, A.; Soto-Zarazúa, G.M.; Escamilla-García, A.; Toledano-Ayala, M.; Macías-Bobadilla, G.; Jauregui-Vazquez, D. Optical Methods Based on Ultraviolet, Visible, and Near-Infrared Spectra to Estimate Fat and Protein in Raw Milk: A Review. Sensors 2020, 20, 3356. [Google Scholar] [CrossRef]
  18. Dispersion (Optics). Wikipedia. 2024. Available online: https://en.wikipedia.org/wiki/Dispersion_(optics) (accessed on 9 December 2024).
  19. Ma, W.; Ji, X.; Ding, L.; Yang, S.X.; Guo, K.; Li, Q. Automatic Monitoring Methods for Greenhouse and Hazardous Gases Emitted from Ruminant Production Systems: A Review. Sensors 2024, 24, 4423. [Google Scholar] [CrossRef] [PubMed]
  20. Fazio, E.; Spadaro, S.; Corsaro, C.; Neri, G.; Leonardi, S.G.; Neri, F.; Lavanya, N.; Sekar, C.; Donato, N.; Neri, G. Metal-Oxide Based Nanomaterials: Synthesis, Characterization and Their Applications in Electrical and Electrochemical Sensors. Sensors 2021, 21, 2494. [Google Scholar] [CrossRef] [PubMed]
  21. Hulanicki’, A.; Geab, S.; Ingman, F.O.L.K.E. Chemical sensors: Definitions and classification. Pure Appl. Chem. 1991, 63, 1247–1250. [Google Scholar] [CrossRef]
  22. Kunes, R.; Bartos, P.; Iwasaka, G.K.; Lang, A.; Hankovec, T.; Smutny, L.; Cerny, P.; Poborska, A.; Smetana, P.; Kriz, P.; et al. In-Line Technologies for the Analysis of Important Milk Parameters during the Milking Process: A Review. Agriculture 2021, 11, 239. [Google Scholar] [CrossRef]
  23. Vaskova, H.; Buckova, M. Measuring the Lactose Content in Milk. MATEC Web Conf. 2016, 76, 05011. [Google Scholar] [CrossRef]
  24. He, H.; Sun, D.-W.; Pu, H.; Chen, L.; Lin, L. Applications of Raman Spectroscopic Techniques for Quality and Safety Evaluation of Milk: A Review of Recent Developments. Crit. Rev. Food Sci. Nutr. 2019, 59, 770–793. [Google Scholar] [CrossRef]
  25. Pellegrino, L.; Cattaneo, S.; De Noni, I. Nutrition and Health: Effects of Processing on Protein Quality of Milk and Milk Products. In Encyclopedia of Dairy Sciences, 3rd ed.; Elsevier: Amsterdam, The Netherlands, 2016; pp. 1067–1074. ISBN 978-0-08-100596-5. [Google Scholar]
  26. Reference Material for Somatic Cell Counting—European Commission. Available online: https://joint-research-centre.ec.europa.eu/jrc-news-and-updates/reference-material-somatic-cell-counting-2020-02-11_en (accessed on 1 October 2024).
  27. Gelasakis, A.I.; Mavrogianni, V.S.; Petridis, I.G.; Vasileiou, N.G.C.; Fthenakis, G.C. Mastitis in Sheep—The Last 10 Years and the Future of Research. Vet. Microbiol. 2015, 181, 136–146. [Google Scholar] [CrossRef]
  28. Melfsen, A.; Hartung, E.; Haeussermann, A. Accuracy of In-Line Milk Composition Analysis with Diffuse Reflectance near-Infrared Spectroscopy. J. Dairy Sci. 2012, 95, 6465–6476. [Google Scholar] [CrossRef] [PubMed]
  29. Numthuam, S.; Hongpathong, J.; Charoensook, R.; Rungchang, S. Method Development for the Analysis of Total Bacterial Count in Raw Milk Using Near-infrared Spectroscopy. J. Food Saf. 2017, 37, e12335. [Google Scholar] [CrossRef]
  30. Nicolaou, N.; Goodacre, R. Rapid and Quantitative Detection of the Microbial Spoilage in Milk Using Fourier Transform Infrared Spectroscopy and Chemometrics. Analyst 2008, 133, 1424. [Google Scholar] [CrossRef] [PubMed]
  31. Pampoukis, G.; Lytou, A.E.; Argyri, A.A.; Panagou, E.Z.; Nychas, G.-J.E. Recent Advances and Applications of Rapid Microbial Assessment from a Food Safety Perspective. Sensors 2022, 22, 2800. [Google Scholar] [CrossRef] [PubMed]
  32. Blanco, M.; Villarroya, I. NIR Spectroscopy: A Rapid-Response Analytical Tool. TrAC Trends Anal. Chem. 2002, 21, 240–250. [Google Scholar] [CrossRef]
  33. Wikimedia Commons. Available online: https://commons.wikimedia.org/wiki/File:Spectral_lines_en.PNG?uselang=en-gb (accessed on 30 August 2024).
  34. Chen, H.; Tan, C.; Lin, Z.; Wu, T. Classification of Different Liquid Milk by Near-Infrared Spectroscopy and Ensemble Modeling. Spectrochim. Acta Part A Mol. Biomol. Spectrosc. 2021, 251, 119460. [Google Scholar] [CrossRef]
  35. Nicolaou, N.; Xu, Y.; Goodacre, R. Fourier Transform Infrared Spectroscopy and Multivariate Analysis for the Detection and Quantification of Different Milk Species. J. Dairy Sci. 2010, 93, 5651–5660. [Google Scholar] [CrossRef]
  36. Nanou, E.; Stefas, D.; Couris, S. Milk’s Inorganic Content Analysis via Laser Induced Breakdown Spectroscopy. Food Chem. 2023, 407, 135169. [Google Scholar] [CrossRef] [PubMed]
  37. Raman, C.V.; Krishnan, K.S. A new type of secondary radiation. Nature 1928, 121, 501–502. [Google Scholar] [CrossRef]
  38. Mazurek, S.; Szostak, R.; Czaja, T.; Zachwieja, A. Analysis of Milk by FT-Raman Spectroscopy. Talanta 2015, 138, 285–289. [Google Scholar] [CrossRef] [PubMed]
  39. El-Abassy, R.M.; Eravuchira, P.J.; Donfack, P.; Von Der Kammer, B.; Materny, A. Fast Determination of Milk Fat Content Using Raman Spectroscopy. Vib. Spectrosc. 2011, 56, 3–8. [Google Scholar] [CrossRef]
  40. Rodrigues Júnior, P.H.; De Sá Oliveira, K.; Almeida, C.E.R.D.; De Oliveira, L.F.C.; Stephani, R.; Pinto, M.D.S.; Carvalho, A.F.D.; Perrone, Í.T. FT-Raman and Chemometric Tools for Rapid Determination of Quality Parameters in Milk Powder: Classification of Samples for the Presence of Lactose and Fraud Detection by Addition of Maltodextrin. Food Chem. 2016, 196, 584–588. [Google Scholar] [CrossRef] [PubMed]
  41. Khan, K.M.; Krishna, H.; Majumder, S.K.; Gupta, P.K. Detection of Urea Adulteration in Milk Using Near-Infrared Raman Spectroscopy. Food Anal. Methods 2015, 8, 93–102. [Google Scholar] [CrossRef]
  42. McGoverin, C.M.; Clark, A.S.S.; Holroyd, S.E.; Gordon, K.C. Raman Spectroscopic Quantification of Milk Powder Constituents. Anal. Chim. Acta 2010, 673, 26–32. [Google Scholar] [CrossRef] [PubMed]
  43. Amjad, A.; Ullah, R.; Khan, S.; Bilal, M.; Khan, A. Raman Spectroscopy Based Analysis of Milk Using Random Forest Classification. Vib. Spectrosc. 2018, 99, 124–129. [Google Scholar] [CrossRef]
  44. Noll, R. Laser-Induced Breakdown Spectroscopy: Fundamentals and Applications; Springer Berlin Heidelberg: Berlin/Heidelberg, Germany, 2012; ISBN 978-3-642-20667-2. [Google Scholar]
  45. What Is LIBS? | SciAps. Available online: https://www.sciaps.com/products/libs/what-is-libs (accessed on 12 September 2024).
  46. Musazzi, S.; Perini, U. Laser-Induced Breakdown Spectroscopy: Theory and Applications; Springer: Berlin, Germany, 2014; ISBN 978-3-642-45085-3. [Google Scholar]
  47. Dos Santos Augusto, A.; Barsanelli, P.L.; Pereira, F.M.V.; Pereira-Filho, E.R. Calibration Strategies for the Direct Determination of Ca, K, and Mg in Commercial Samples of Powdered Milk and Solid Dietary Supplements Using Laser-Induced Breakdown Spectroscopy (LIBS). Food Res. Int. 2017, 94, 72–78. [Google Scholar] [CrossRef]
  48. Markiewicz-Keszycka, M.; Cama-Moncunill, X.; Casado-Gavalda, M.P.; Dixit, Y.; Cama-Moncunill, R.; Cullen, P.J.; Sullivan, C. Laser-Induced Breakdown Spectroscopy (LIBS) for Food Analysis: A Review. Trends Food Sci. Technol. 2017, 65, 80–93. [Google Scholar] [CrossRef]
  49. Nanou, E.; Pliatsika, N.; Stefas, D.; Couris, S. Identification of the Animal Origin of Milk via Laser-Induced Breakdown Spectroscopy. Food Control 2023, 154, 110007. [Google Scholar] [CrossRef]
  50. Moncayo, S.; Manzoor, S.; Rosales, J.D.; Anzano, J.; Caceres, J.O. Qualitative and Quantitative Analysis of Milk for the Detection of Adulteration by Laser Induced Breakdown Spectroscopy (LIBS). Food Chem. 2017, 232, 322–328. [Google Scholar] [CrossRef]
  51. Bilge, G.; Sezer, B.; Eseller, K.E.; Berberoglu, H.; Topcu, A.; Boyaci, I.H. Determination of Whey Adulteration in Milk Powder by Using Laser Induced Breakdown Spectroscopy. Food Chem. 2016, 212, 183–188. [Google Scholar] [CrossRef]
  52. Abdel-Salam, Z.; Al Sharnoubi, J.; Harith, M.A. Qualitative Evaluation of Maternal Milk and Commercial Infant Formulas via LIBS. Talanta 2013, 115, 422–426. [Google Scholar] [CrossRef] [PubMed]
  53. Abdel-Salam, Z.; El-Saeid, R.; Abdelghany, S.; Abdel-Salam, S.; Radwan, M. Assessment of Milk Quality at Farm Level Using Laser Techniques. Egypt. J. Chem. 2022, 66, 273–278. [Google Scholar] [CrossRef]
  54. Cama-Moncunill, X.; Markiewicz-Keszycka, M.; Dixit, Y.; Cama-Moncunill, R.; Casado-Gavalda, M.P.; Cullen, P.J.; Sullivan, C. Feasibility of Laser-Induced Breakdown Spectroscopy (LIBS) as an at-Line Validation Tool for Calcium Determination in Infant Formula. Food Control 2017, 78, 304–310. [Google Scholar] [CrossRef]
  55. Eum, C.; Jang, D.; Kim, J.; Choi, S.; Cha, K.; Chung, H. Improving the Accuracy of Spectroscopic Identification of Geographical Origins of Agricultural Samples through Cooperative Combination of Near-Infrared and Laser-Induced Breakdown Spectroscopy. Spectrochim. Acta Part B At. Spectrosc. 2018, 149, 281–287. [Google Scholar] [CrossRef]
  56. Sezer, B.; Durna, S.; Bilge, G.; Berkkan, A.; Yetisemiyen, A.; Boyaci, I.H. Identification of Milk Fraud Using Laser-Induced Breakdown Spectroscopy (LIBS). Int. Dairy J. 2018, 81, 1–7. [Google Scholar] [CrossRef]
  57. Huang, W.; Guo, L.; Kou, W.; Zhang, D.; Hu, Z.; Chen, F.; Chu, Y.; Cheng, W. Identification of Adulterated Milk Powder Based on Convolutional Neural Network and Laser-Induced Breakdown Spectroscopy. Microchem. J. 2022, 176, 107190. [Google Scholar] [CrossRef]
  58. Mota, L.F.M.; Giannuzzi, D.; Bisutti, V.; Pegolo, S.; Trevisi, E.; Schiavon, S.; Gallo, L.; Fineboym, D.; Katz, G.; Cecchinato, A. Real-Time Milk Analysis Integrated with Stacking Ensemble Learning as a Tool for the Daily Prediction of Cheese-Making Traits in Holstein Cattle. J. Dairy Sci. 2022, 105, 4237–4255. [Google Scholar] [CrossRef] [PubMed]
  59. Brandão, M.C.M.P.; Carmo, A.P.; Bell, M.J.V.; Anjos, V.C. Characterization of milk by infrared spectroscopy. Rev. Do Inst. De Laticínios Cândido Tostes 2010, 65, 30–33. [Google Scholar]
  60. Aernouts, B.; Van Beers, R.; Watté, R.; Huybrechts, T.; Lammertyn, J.; Saeys, W. Visible and Near-Infrared Bulk Optical Properties of Raw Milk. J. Dairy Sci. 2015, 98, 6727–6738. [Google Scholar] [CrossRef] [PubMed]
  61. Aernouts, B.; Polshin, E.; Lammertyn, J.; Saeys, W. Visible and Near-Infrared Spectroscopic Analysis of Raw Milk for Cow Health Monitoring: Reflectance or Transmittance? J. Dairy Sci. 2011, 94, 5315–5329. [Google Scholar] [CrossRef]
  62. Korelidou, V.; Simitzis, P.; Massouras, T.; Gelasakis, A.I. Infrared Thermography as a Diagnostic Tool for the Assessment of Mastitis in Dairy Ruminants. Animals 2024, 14, 2691. [Google Scholar] [CrossRef] [PubMed]
  63. Swinehart, D.F. The beer-lambert law. J. Chem. Educ. 1962, 39, 333. [Google Scholar] [CrossRef]
  64. Givens, D.I.; De Boever, J.L.; Deaville, E.R. The Principles, Practices and Some Future Applications of near Infrared Spectroscopy for Predicting the Nutritive Value of Foods for Animals and Humans. Nutr. Res. Rev. 1997, 10, 83–114. [Google Scholar] [CrossRef] [PubMed]
  65. Yakubu, H.G.; Kovacs, Z.; Toth, T.; Bazar, G. The Recent Advances of Near-Infrared Spectroscopy in Dairy Production—A Review. Crit. Rev. Food Sci. Nutr. 2022, 62, 810–831. [Google Scholar] [CrossRef] [PubMed]
  66. 14:00-17:00 ISO 21543:2006; Milk Products—Guidelines for the Application of Near Infrared Spectrometry. ISO: Geneva, Switzerland, 2006. Available online: https://www.iso.org/standard/40318.html (accessed on 12 September 2024).
  67. 14:00-17:00 ISO 21543:2020; Milk and Milk Products—Guidelines for the Application of Near Infrared Spectrometry. ISO: Geneva, Switzerland, 2020. Available online: https://www.iso.org/standard/77606.html (accessed on 13 September 2024).
  68. Albanell, E.; Caja, G.; Such, X.; Rovai, M.; Salama, A.A.K.; Casals, R. Determination of Fat, Protein, Casein, Total Solids, and Somatic Cell Count in Goat’s Milk by Near-Infrared Reflectance Spectroscopy. J. AOAC Int. 2003, 86, 746–752. [Google Scholar] [CrossRef]
  69. Revilla, I.; Escuredo, O.; González-Martín, M.I.; Palacios, C. Fatty Acids and Fat-Soluble Vitamins in Ewe’s Milk Predicted by near Infrared Reflectance Spectroscopy. Determination of Seasonality. Food Chem. 2017, 214, 468–477. [Google Scholar] [CrossRef]
  70. Holroyd, S.E. The Use of near Infrared Spectroscopy on Milk and Milk Products. J. Near Infrared Spectrosc. 2013, 21, 311–322. [Google Scholar] [CrossRef]
  71. Coppa, M.; Martin, B.; Agabriel, C.; Chassaing, C.; Sibra, C.; Constant, I.; Graulet, B.; Andueza, D. Authentication of Cow Feeding and Geographic Origin on Milk Using Visible and Near-Infrared Spectroscopy. J. Dairy Sci. 2012, 95, 5544–5551. [Google Scholar] [CrossRef]
  72. Al-Qadiri, H.M.; Lin, M.; Al-Holy, M.A.; Cavinato, A.G.; Rasco, B.A. Monitoring Quality Loss of Pasteurized Skim Milk Using Visible and Short Wavelength Near-Infrared Spectroscopy and Multivariate Analysis. J. Dairy Sci. 2008, 91, 950–958. [Google Scholar] [CrossRef]
  73. Cattaneo, T.M.P.; Cabassi, G.; Profaizer, M.; Giangiacomo, R. Contribution of Light Scattering to near Infrared Absorption in Milk. J. Near Infrared Spectrosc. 2009, 17, 337–343. [Google Scholar] [CrossRef]
  74. Tsenkova, R.; Meilina, H.; Kuroki, S.; Burns, D.H. Near Infrared Spectroscopy Using Short Wavelengths and Leave-One-Cow-Out Cross-Validation for Quantification of Somatic Cells in Milk. J. Near Infrared Spectrosc. 2009, 17, 345–351. [Google Scholar] [CrossRef]
  75. Coppa, M.; Ferlay, A.; Leroux, C.; Jestin, M.; Chilliard, Y.; Martin, B.; Andueza, D. Prediction of Milk Fatty Acid Composition by near Infrared Reflectance Spectroscopy. Int. Dairy J. 2010, 20, 182–189. [Google Scholar] [CrossRef]
  76. Núñez-Sánchez, N.; Martínez-Marín, A.L.; Polvillo, O.; Fernández-Cabanás, V.M.; Carrizosa, J.; Urrutia, B.; Serradilla, J.M. Near Infrared Spectroscopy (NIRS) for the Determination of the Milk Fat Fatty Acid Profile of Goats. Food Chem. 2016, 190, 244–252. [Google Scholar] [CrossRef]
  77. Wu, D.; He, Y.; Feng, S.; Sun, D.-W. Study on Infrared Spectroscopy Technique for Fast Measurement of Protein Content in Milk Powder Based on LS-SVM. J. Food Eng. 2008, 84, 124–131. [Google Scholar] [CrossRef]
  78. Soulat, J.; Andueza, D.; Graulet, B.; Girard, C.L.; Labonne, C.; Aït-Kaddour, A.; Martin, B.; Ferlay, A. Comparison of the Potential Abilities of Three Spectroscopy Methods: Near-Infrared, Mid-Infrared, and Molecular Fluorescence, to Predict Carotenoid, Vitamin and Fatty Acid Contents in Cow Milk. Foods 2020, 9, 592. [Google Scholar] [CrossRef] [PubMed]
  79. Coppa, M.; Revello-Chion, A.; Giaccone, D.; Ferlay, A.; Tabacco, E.; Borreani, G. Comparison of near and Medium Infrared Spectroscopy to Predict Fatty Acid Composition on Fresh and Thawed Milk. Food Chem. 2014, 150, 49–57. [Google Scholar] [CrossRef]
  80. Balabin, R.M.; Smirnov, S.V. Melamine Detection by Mid- and near-Infrared (MIR/NIR) Spectroscopy: A Quick and Sensitive Method for Dairy Products Analysis Including Liquid Milk, Infant Formula, and Milk Powder. Talanta 2011, 85, 562–568. [Google Scholar] [CrossRef]
  81. Henn, R.; Kirchler, C.G.; Grossgut, M.-E.; Huck, C.W. Comparison of Sensitivity to Artificial Spectral Errors and Multivariate LOD in NIR Spectroscopy—Determining the Performance of Miniaturizations on Melamine in Milk Powder. Talanta 2017, 166, 109–118. [Google Scholar] [CrossRef] [PubMed]
  82. Llano Suárez, P.; Soldado, A.; González-Arrojo, A.; Vicente, F.; De La Roza-Delgado, B. Rapid On-Site Monitoring of Fatty Acid Profile in Raw Milk Using a Handheld near Infrared Sensor. J. Food Compos. Anal. 2018, 70, 1–8. [Google Scholar] [CrossRef]
  83. Liu, N.; Parra, H.A.; Pustjens, A.; Hettinga, K.; Mongondry, P.; Van Ruth, S.M. Evaluation of Portable Near-Infrared Spectroscopy for Organic Milk Authentication. Talanta 2018, 184, 128–135. [Google Scholar] [CrossRef]
  84. De La Roza-Delgado, B.; Garrido-Varo, A.; Soldado, A.; González Arrojo, A.; Cuevas Valdés, M.; Maroto, F.; Pérez-Marín, D. Matching Portable NIRS Instruments for in Situ Monitoring Indicators of Milk Composition. Food Control 2017, 76, 74–81. [Google Scholar] [CrossRef]
  85. Diaz-Olivares, J.A.; Adriaens, I.; Stevens, E.; Saeys, W.; Aernouts, B. Online Milk Composition Analysis with an On-Farm near-Infrared Sensor. Comput. Electron. Agric. 2020, 178, 105734. [Google Scholar] [CrossRef]
  86. Kalinin, A.; Krasheninnikov, V.; Sadovskiy, S.; Yurova, E. Determining the Composition of Proteins in Milk Using a Portable near Infrared Spectrometer. J. Near Infrared Spectrosc. 2013, 21, 409–415. [Google Scholar] [CrossRef]
  87. Santos, P.M.; Pereira-Filho, E.R.; Rodriguez-Saona, L.E. Rapid Detection and Quantification of Milk Adulteration Using Infrared Microspectroscopy and Chemometrics Analysis. Food Chem. 2013, 138, 19–24. [Google Scholar] [CrossRef]
  88. Etzion, Y.; Linker, R.; Cogan, U.; Shmulevich, I. Determination of Protein Concentration in Raw Milk by Mid-Infrared Fourier Transform Infrared/Attenuated Total Reflectance Spectroscopy. J. Dairy Sci. 2004, 87, 2779–2788. [Google Scholar] [CrossRef]
  89. Dabrowska, A.; David, M.; Freitag, S.; Andrews, A.M.; Strasser, G.; Hinkov, B.; Schwaighofer, A.; Lendl, B. Broadband Laser-Based Mid-Infrared Spectroscopy Employing a Quantum Cascade Detector for Milk Protein Analysis. Sens. Actuators B Chem. 2022, 350, 130873. [Google Scholar] [CrossRef]
  90. Frizzarin, M.; Gormley, I.C.; Berry, D.P.; Murphy, T.B.; Casa, A.; Lynch, A.; McParland, S. Predicting Cow Milk Quality Traits from Routinely Available Milk Spectra Using Statistical Machine Learning Methods. J. Dairy Sci. 2021, 104, 7438–7447. [Google Scholar] [CrossRef]
  91. De Marchi, M.; Fagan, C.C.; O’Donnell, C.P.; Cecchinato, A.; Dal Zotto, R.; Cassandro, M.; Penasa, M.; Bittante, G. Prediction of Coagulation Properties, Titratable Acidity, and pH of Bovine Milk Using Mid-Infrared Spectroscopy. J. Dairy Sci. 2009, 92, 423–432. [Google Scholar] [CrossRef]
  92. De Marchi, M.; Toffanin, V.; Cassandro, M.; Penasa, M. Invited Review: Mid-Infrared Spectroscopy as Phenotyping Tool for Milk Traits. J. Dairy Sci. 2014, 97, 1171–1186. [Google Scholar] [CrossRef]
  93. Ceniti, C.; Spina, A.A.; Piras, C.; Oppedisano, F.; Tilocca, B.; Roncada, P.; Britti, D.; Morittu, V.M. Recent Advances in the Determination of Milk Adulterants and Contaminants by Mid-Infrared Spectroscopy. Foods 2023, 12, 2917. [Google Scholar] [CrossRef] [PubMed]
  94. Fox, P.F.; Uniacke-Lowe, T.; McSweeney, P.L.H.; O’Mahony, J.A. Dairy Chemistry and Biochemistry; Springer International Publishing: Cham, Switzerland, 2015; ISBN 978-3-319-14891-5. [Google Scholar]
  95. Loudiyi, M.; Temiz, H.T.; Sahar, A.; Haseeb Ahmad, M.; Boukria, O.; Hassoun, A.; Aït-Kaddour, A. Spectroscopic Techniques for Monitoring Changes in the Quality of Milk and Other Dairy Products during Processing and Storage. Crit. Rev. Food Sci. Nutr. 2022, 62, 3063–3087. [Google Scholar] [CrossRef] [PubMed]
  96. Fragkoulis, N.; Samartzis, P.C.; Velegrakis, M. Commercial Milk Discrimination by Fat Content and Animal Origin Using Optical Absorption and Fluorescence Spectroscopy. Int. Dairy J. 2021, 123, 105181. [Google Scholar] [CrossRef]
  97. Andersen, C.M.; Mortensen, G. Fluorescence Spectroscopy: A Rapid Tool for Analyzing Dairy Products. J. Agric. Food Chem. 2008, 56, 720–729. [Google Scholar] [CrossRef]
  98. Shaikh, S.; O’Donnell, C. Applications of Fluorescence Spectroscopy in Dairy Processing: A Review. Curr. Opin. Food Sci. 2017, 17, 16–24. [Google Scholar] [CrossRef]
  99. Barreto, M.C.; Braga, R.G.; Lemos, S.G.; Fragoso, W.D. Determination of Melamine in Milk by Fluorescence Spectroscopy and Second-Order Calibration. Food Chem. 2021, 364, 130407. [Google Scholar] [CrossRef] [PubMed]
  100. Bogomolov, A.; Dietrich, S.; Boldrini, B.; Kessler, R.W. Quantitative Determination of Fat and Total Protein in Milk Based on Visible Light Scatter. Food Chem. 2012, 134, 412–418. [Google Scholar] [CrossRef]
  101. Yang, B.; Guo, W.; Liang, W.; Zhou, Y.; Zhu, X. Design and Evaluation of a Miniature Milk Quality Detection System Based on UV/Vis Spectroscopy. J. Food Compos. Anal. 2022, 106, 104341. [Google Scholar] [CrossRef]
  102. Karoui, R.; Martin, B.; Dufour, É. Potentiality of Front-Face Fluorescence Spectroscopy to Determine the Geographic Origin of Milks from the Haute-Loire Department (France). Lait 2005, 85, 223–236. [Google Scholar] [CrossRef]
  103. Birlouez-Aragon, I.; Sabat, P.; Gouti, N. A New Method for Discriminating Milk Heat Treatment. Int. Dairy J. 2002, 12, 59–67. [Google Scholar] [CrossRef]
  104. Hougaard, A.B.; Lawaetz, A.J.; Ipsen, R.H. Front Face Fluorescence Spectroscopy and Multi-Way Data Analysis for Characterization of Milk Pasteurized Using Instant Infusion. LWT—Food Sci. Technol. 2013, 53, 331–337. [Google Scholar] [CrossRef]
  105. Domingo, E.; Tirelli, A.A.; Nunes, C.A.; Guerreiro, M.C.; Pinto, S.M. Melamine Detection in Milk Using Vibrational Spectroscopy and Chemometrics Analysis: A Review. Food Res. Int. 2014, 60, 131–139. [Google Scholar] [CrossRef]
  106. Vázquez-Diosdado, J.A.; Paul, V.; Ellis, K.A.; Coates, D.; Loomba, R.; Kaler, J. A Combined Offline and Online Algorithm for Real-Time and Long-Term Classification of Sheep Behaviour: Novel Approach for Precision Livestock Farming. Sensors 2019, 19, 3201. [Google Scholar] [CrossRef]
  107. Kaplan, A.; Haenlein, M. Siri, Siri, in My Hand: Who’s the Fairest in the Land? On the Interpretations, Illustrations, and Implications of Artificial Intelligence. Bus. Horiz. 2019, 62, 15–25. [Google Scholar] [CrossRef]
  108. Niloofar, P.; Francis, D.P.; Lazarova-Molnar, S.; Vulpe, A.; Vochin, M.-C.; Suciu, G.; Balanescu, M.; Anestis, V.; Bartzanas, T. Data-Driven Decision Support in Livestock Farming for Improved Animal Health, Welfare and Greenhouse Gas Emissions: Overview and Challenges. Comput. Electron. Agric. 2021, 190, 106406. [Google Scholar] [CrossRef]
  109. Norton, T.; Berckmans, D. Developing Precision Livestock Farming Tools for Precision Dairy Farming. Anim. Front. 2017, 7, 18–23. [Google Scholar] [CrossRef]
  110. VanderWaal, K.; Morrison, R.B.; Neuhauser, C.; Vilalta, C.; Perez, A.M. Translating Big Data into Smart Data for Veterinary Epidemiology. Front. Vet. Sci. 2017, 4, 110. [Google Scholar] [CrossRef]
  111. Benjamin, M.; Yik, S. Precision Livestock Farming in Swine Welfare: A Review for Swine Practitioners. Animals 2019, 9, 133. [Google Scholar] [CrossRef] [PubMed]
  112. Morota, G.; Ventura, R.V.; Silva, F.F.; Koyama, M.; Fernando, S.C. Big data analytics and precision animal agriculture symposium: Machine learning and data mining advance predictive big data analysis in precision animal agriculture. J. Anim. Sci. 2018, 96, 1540–1550. [Google Scholar] [CrossRef] [PubMed]
  113. Muhammad, I.; Yan, Z. Supervised Machine Learning Approaches: A Survey. Ictact. J. Soft Comput. 2015, 5, 946–952. [Google Scholar] [CrossRef]
  114. Soofi, A.A.; Awan, A. Classification techniques in machine learning: Applications and issues. J. Basic Appl. Sci. 2017, 13, 459–465.112. [Google Scholar] [CrossRef]
  115. Montesinos López, O.A.; Montesinos López, A.; Crossa, J. Multivariate Statistical Machine Learning Methods for Genomic Prediction; Springer International Publishing: Cham, Switzerland, 2022; ISBN 978-3-030-89009-4. [Google Scholar]
  116. Nasir, N.; Kansal, A.; Alshaltone, O.; Barneih, F.; Sameer, M.; Shanableh, A.; Al-Shamma’a, A. Water Quality Classification Using Machine Learning Algorithms. J. Water Process Eng. 2022, 48, 102920. [Google Scholar] [CrossRef]
  117. Akalin, A. 5.13 Logistic Regression and Regularization | Computational Genomics with R. Available online: https://compgenomr.github.io/book/logistic-regression-and-regularization.html (accessed on 18 September 2024).
  118. García, R.; Aguilar, J.; Toro, M.; Pinto, A.; Rodríguez, P. A Systematic Literature Review on the Use of Machine Learning in Precision Livestock Farming. Comput. Electron. Agric. 2020, 179, 105826. [Google Scholar] [CrossRef]
  119. Breiman, L.; Friedman, J.; Stone, C.J.; Olshen, R.A. Classification and Regression Trees; Taylor & Francis: New York, NY, USA, 2017; ISBN 978-0-412-04841-8. [Google Scholar]
  120. Mu, F.; Gu, Y.; Zhang, J.; Zhang, L. Milk Source Identification and Milk Quality Estimation Using an Electronic Nose and Machine Learning Techniques. Sensors 2020, 20, 4238. [Google Scholar] [CrossRef]
  121. Sun, S.; Huang, R. An Adaptive K-Nearest Neighbor Algorithm. In 2010 Seventh International Conference on Fuzzy Systems and Knowledge Discovery; IEEE: Yantai, China, 2010; Volume 1, pp. 91–94. [Google Scholar]
  122. Japkowicz, N. Learning from imbalanced data sets: A comparison of various strategies. In AAAI Workshop on Learning from Imbalanced Data Sets; AAAI Press: Menlo Park, CA, USA, 2000; Volume 68, pp. 10–15. [Google Scholar]
  123. Tan, S. Neighbor-Weighted K-Nearest Neighbor for Unbalanced Text Corpus. Expert Syst. Appl. 2005, 28, 667–671. [Google Scholar] [CrossRef]
  124. Zeng, Y.; Yang, Y.; Zhao, L. Pseudo Nearest Neighbor Rule for Pattern Classification. Expert Syst. Appl. 2009, 36, 3587–3595. [Google Scholar] [CrossRef]
  125. Shinde, T.A.; Prasad, J.R. IoT based animal health monitoring with naive Bayes classification. Int. J. Eng. Trends Technol. 2017, 1, 252–257. [Google Scholar]
  126. Rish, I. An empirical study of the naive Bayes classifier. In IJCAI 2001 Workshop on Empirical Methods in Artificial Intelligence; International Joint Conferences on Artificial Intelligence: Seattle, WA, USA, 2001; Volume 3, pp. 41–46. [Google Scholar]
  127. Rong, S.; Bao-wen, Z. The Research of Regression Model in Machine Learning Field. MATEC Web Conf. 2018, 176, 01033. [Google Scholar] [CrossRef]
  128. Sharma, A.; Paliwal, K.K. Linear Discriminant Analysis for the Small Sample Size Problem: An Overview. Int. J. Mach. Learn. Cyber. 2015, 6, 443–454. [Google Scholar] [CrossRef]
  129. Tharwat, A.; Gaber, T.; Ibrahim, A.; Hassanien, A.E. Linear Discriminant Analysis: A Detailed Tutorial. Agric. Ind. Confed. 2017, 30, 169–190. [Google Scholar] [CrossRef]
  130. Johnson, R.A.; Wichern, D.W. Applied Multivariate Statistical Analysis, 6th ed.; Pearson Prentice Hall: Upper Saddle River, NJ, USA, 2007; ISBN 978-0-13-187715-3. [Google Scholar]
  131. Ferreira, A.J.; Figueiredo, M.A.T. Boosting Algorithms: A Review of Methods, Theory, and Applications. In Ensemble Machine Learning; Zhang, C., Ma, Y., Eds.; Springer New York: New York, NY, USA, 2012; pp. 35–85. ISBN 978-1-4419-9325-0. [Google Scholar]
  132. Schapire, R.E. The Boosting Approach to Machine Learning: An Overview. In Nonlinear Estimation and Classification; Denison, D.D., Hansen, M.H., Holmes, C.C., Mallick, B., Yu, B., Eds.; Lecture Notes in Statistics; Springer New York: New York, NY, USA, 2003; Volume 171, pp. 149–171. ISBN 978-0-387-95471-4. [Google Scholar]
  133. Ganaie, M.A.; Hu, M.; Malik, A.K.; Tanveer, M.; Suganthan, P.N. Ensemble Deep Learning: A Review. Eng. Appl. Artif. Intell. 2022, 115, 105151. [Google Scholar] [CrossRef]
  134. Freund, Y.; Schapire, R.E. A Decision-Theoretic Generalization of On-Line Learning and an Application to Boosting. J. Comput. Syst. Sci. 1997, 55, 119–139. [Google Scholar] [CrossRef]
  135. Pence, I.; Kumaş, K.; Cesmeli, M.S.; Akyüz, A. Future Prediction of Biogas Potential and CH4 Emission with Boosting Algorithms: The Case of Cattle, Small Ruminant, and Poultry Manure from Turkey. Environ. Sci. Pollut. Res. 2024, 31, 24461–24479. [Google Scholar] [CrossRef] [PubMed]
  136. Bai, J.; Xue, H.; Jiang, X.; Zhou, Y. Recognition of Bovine Milk Somatic Cells Based on Multi-Feature Extraction and a GBDT-AdaBoost Fusion Model. Mol. Biol. Evol. 2022, 19, 5850–5866. [Google Scholar] [CrossRef] [PubMed]
  137. Wang, F.; Li, Z.; He, F.; Wang, R.; Yu, W.; Nie, F. Feature Learning Viewpoint of Adaboost and a New Algorithm. IEEE Access 2019, 7, 149890–149899. [Google Scholar] [CrossRef]
  138. Sun, Y.; Kamel, M.; Wang, Y. Boosting for Learning Multiple Classes with Imbalanced Class Distribution. In Proceedings of the Sixth International Conference on Data Mining (ICDM); IEEE: Hong Kong, China, 2006; pp. 592–602. [Google Scholar]
  139. Çelik, A. Using Machine Learning Algorithms to Detect Milk Quality. Eurasian J. Food Sci. Technol. 2022, 6, 76–87. [Google Scholar]
  140. Friedman, J.H. Greedy Function Approximation: A Gradient Boosting Machine. Ann. Stat. 2001, 29, 1189–1232. [Google Scholar] [CrossRef]
  141. Otchere, D.A.; Ganat, T.O.A.; Ojero, J.O.; Tackie-Otoo, B.N.; Taki, M.Y. Application of Gradient Boosting Regression Model for the Evaluation of Feature Selection Techniques in Improving Reservoir Characterisation Predictions. J. Pet. Sci. Eng. 2022, 208, 109244. [Google Scholar] [CrossRef]
  142. Forecasting: Principles and Practice (2nd Ed) 11.3 Neural Network Models. Available online: https://otexts.com/fpp2/nnetar.html (accessed on 3 December 2024).
  143. Pirouz, D.M. An Overview of Partial Least Squares. SSRN J. 2006. [Google Scholar] [CrossRef]
  144. Garthwaite, P.H. An Interpretation of Partial Least Squares. J. Am. Stat. Assoc. 1994, 89, 122–127. [Google Scholar] [CrossRef]
  145. Wold, S.; Sjöström, M.; Eriksson, L. PLS-Regression: A Basic Tool of Chemometrics. Chemom. Intell. Lab. Syst. 2001, 58, 109–130. [Google Scholar] [CrossRef]
  146. Cheng, J.-H.; Sun, D.-W. Partial Least Squares Regression (PLSR) Applied to NIR and HSI Spectral Data Modeling to Predict Chemical Properties of Fish Muscle. Food Eng. Rev. 2017, 9, 36–49. [Google Scholar] [CrossRef]
  147. Meisel, S.; Stöckel, S.; Elschner, M.; Melzer, F.; Rösch, P.; Popp, J. Raman Spectroscopy as a Potential Tool for Detection of Brucella Spp. in Milk. Appl. Environ. Microbiol. 2012, 78, 5575–5583. [Google Scholar] [CrossRef]
  148. Mota, L.F.M.; Pegolo, S.; Baba, T.; Peñagaricano, F.; Morota, G.; Bittante, G.; Cecchinato, A. Evaluating the Performance of Machine Learning Methods and Variable Selection Methods for Predicting Difficult-to-Measure Traits in Holstein Dairy Cattle Using Milk Infrared Spectral Data. J. Dairy Sci. 2021, 104, 8107–8121. [Google Scholar] [CrossRef]
  149. Frizzarin, M.; O’Callaghan, T.F.; Murphy, T.B.; Hennessy, D.; Casa, A. Application of Machine-Learning Methods to Milk Mid-Infrared Spectra for Discrimination of Cow Milk from Pasture or Total Mixed Ration Diets. J. Dairy Sci. 2021, 104, 12394–12402. [Google Scholar] [CrossRef]
  150. Giannuzzi, D.; Mota, L.F.M.; Pegolo, S.; Gallo, L.; Schiavon, S.; Tagliapietra, F.; Katz, G.; Fainboym, D.; Minuti, A.; Trevisi, E.; et al. In-Line near-Infrared Analysis of Milk Coupled with Machine Learning Methods for the Daily Prediction of Blood Metabolic Profile in Dairy Cattle. Sci. Rep. 2022, 12, 8058. [Google Scholar] [CrossRef] [PubMed]
  151. Giannuzzi, D.; Mota, L.F.M.; Pegolo, S.; Tagliapietra, F.; Schiavon, S.; Gallo, L.; Marsan, P.A.; Trevisi, E.; Cecchinato, A. Prediction of Detailed Blood Metabolic Profile Using Milk Infrared Spectra and Machine Learning Methods in Dairy Cattle. J. Dairy Sci. 2023, 106, 3321–3344. [Google Scholar] [CrossRef] [PubMed]
  152. Soyeurt, H.; Grelet, C.; McParland, S.; Calmels, M.; Coffey, M.; Tedde, A.; Delhez, P.; Dehareng, F.; Gengler, N. A Comparison of 4 Different Machine Learning Algorithms to Predict Lactoferrin Content in Bovine Milk from Mid-Infrared Spectra. J. Dairy Sci. 2020, 103, 11585–11596. [Google Scholar] [CrossRef]
  153. Teixeira, J.L.D.P.; Caramês, E.T.D.S.; Baptista, D.P.; Gigante, M.L.; Pallone, J.A.L. Vibrational Spectroscopy and Chemometrics Tools for Authenticity and Improvement the Safety Control in Goat Milk. Food Control 2020, 112, 107105. [Google Scholar] [CrossRef]
  154. Ullah, R.; Khan, S.; Ali, H.; Bilal, M. Potentiality of Using Front Face Fluorescence Spectroscopy for Quantitative Analysis of Cow Milk Adulteration in Buffalo Milk. Spectrochim. Acta Part A Mol. Biomol. Spectrosc. 2020, 225, 117518. [Google Scholar] [CrossRef]
  155. Sowmya, N.; Ponnusamy, V. Development of Spectroscopic Sensor System for an IoT Application of Adulteration Identification on Milk Using Machine Learning. IEEE Access 2021, 9, 53979–53995. [Google Scholar] [CrossRef]
  156. Lima, J.S.; Ribeiro, D.C.S.Z.; Neto, H.A.; Campos, S.V.A.; Leite, M.O.; Fortini, M.E.D.R.; De Carvalho, B.P.M.; Almeida, M.V.O.; Fonseca, L.M. A Machine Learning Proposal Method to Detect Milk Tainted with Cheese Whey. J. Dairy Sci. 2022, 105, 9496–9508. [Google Scholar] [CrossRef] [PubMed]
  157. Wang, Y.-T.; Ren, H.-B.; Liang, W.-Y.; Jin, X.; Yuan, Q.; Liu, Z.-R.; Chen, D.-M.; Zhang, Y.-H. A Novel Approach to Temperature-Dependent Thermal Processing Authentication for Milk by Infrared Spectroscopy Coupled with Machine Learning. J. Food Eng. 2021, 311, 110740. [Google Scholar] [CrossRef]
  158. Behkami, S.; Zain, S.M.; Gholami, M.; Khir, M.F.A. Classification of Cow Milk Using Artificial Neural Network Developed from the Spectral Data of Single- and Three-Detector Spectrophotometers. Food Chem. 2019, 294, 309–315. [Google Scholar] [CrossRef]
  159. Nychas, G.-J.E.; Panagou, E.Z.; Mohareb, F. Novel Approaches for Food Safety Management and Communication. Curr. Opin. Food Sci. 2016, 12, 13–20. [Google Scholar] [CrossRef]
  160. Nychas, G.-J.; Sims, E.; Tsakanikas, P.; Mohareb, F. Data Science in the Food Industry. Annu. Rev. Biomed. Data Sci. 2021, 4, 341–367. [Google Scholar] [CrossRef] [PubMed]
  161. Knight, C.H. Review: Sensor Techniques in Ruminants: More than Fitness Trackers. Animal 2020, 14, s187–s195. [Google Scholar] [CrossRef] [PubMed]
Figure 1. The electromagnetic spectrum and wavelength ranges of electromagnetic radiation.
Chemosensors 12 00263 g001
Figure 2. Example of light’s interaction with matter [14] (modified).
Chemosensors 12 00263 g002
Figure 3. Scatter light effects are generated by fat and protein particles in milk. The incident wavelength is smaller than the diameter of the particles, resulting in Mie scattering, which is demonstrated in the zoomed view [17].
Chemosensors 12 00263 g003
Figure 4. Different colors refract at different angles in a dispersive prism due to material dispersion; a wavelength-dependent refractive index divides white light into a spectrum [18].
Chemosensors 12 00263 g004
Figure 5. Optical sensors classification from the International Union of Pure and Applied Chemistry (IUPAC) [21].
Chemosensors 12 00263 g005
Figure 6. Milk application and spectroscopy methods [22].
Chemosensors 12 00263 g006
Figure 7. Illustration of the spectroscopy procedure.
Chemosensors 12 00263 g007
Figure 8. (a) Continuous spectrum: contains all wavelengths emitted by a light source, (b) Absorption spectrum: black lines where the electrons have absorbed the light photons, (c) Emission spectrum: color lines where photons have been released from the electrons when they fall to a lower energy level. The different colors correspond to specific wavelengths, representing distinct photon energies released when electrons transition to a lower energy state. These colors depend on the material and the energy transitions within the atoms or molecules [33].
Chemosensors 12 00263 g008
Figure 9. Near-infrared spectra of milk samples, each color represents a distinct sample. [34].
Chemosensors 12 00263 g009
Figure 10. Fourier transform infrared spectra of sheep (blue line), goat (green line), and cow milk (orange line) samples [35].
Chemosensors 12 00263 g010
Figure 11. Laser-induced breakdown spectroscopy spectra from liquid milk samples, illustrating the unique spectral lines for major elements (Mg, Ca, Na, etc.) [36].
Chemosensors 12 00263 g011
Figure 12. Near-infrared spectroscopy analytical methods and their integration into production processes.
Chemosensors 12 00263 g012
Figure 13. Supervised ML process of data.
Chemosensors 12 00263 g013
Figure 14. Supervised ML methods applied in dairy ruminants and milk analysis research [113,114,115].
Chemosensors 12 00263 g014
Figure 15. Example representation of a neural network model.
Chemosensors 12 00263 g015
Figure 16. Overview of the application of spectral technologies and machine learning for milk analysis.
Chemosensors 12 00263 g016
Table 1. Composition of bovine, sheep, and goat milk [7,23].
BovineSheepGoat
Fat (%)3.67.93.8
Lactose (%)4.74.94.1
Protein (%)3.26.23.4
Calcium (mg/100 g)122193134
Phosphorus (mg/100 g)119158121
Vitamin A (IU)126146185
Vitamin D (IU)2.00.182.3
Table 2. Raman spectroscopy applications and performance.
Wavelength
(cm−1)
Type of Milk
Sample
No of
Samples
Origin of
Milk
Samples
Preparation
ApplicationR2RMSEDiagnostic
Performance
Ref.
300–1700powderNDretailspiked sampleslactose0.91--[23]
250–3500powder136retailuntreated
samples
fat
protein
-0.21–0.31% w/w p
0.14–0.35% w/w p
-[42]
800–3050liquid *
liquid **
powder *
13retailuntreated
samples
fat0.97 v
0.97 v
0.97 v
0.16% v
0.06% v
0.18% v
-[39]
8, 16, 32liquid75retailmixed/diluted
samples
fat
protein
carbohydrates
dry matter
-5.3–5.8% sp
5.6–6.1% sp
3.5–4.8% sp
3.4–4.8% sp
-[38]
400–3500powder 45retailspiked sampleslactose high/low
classification
maltodextrin
adulteration
--Se: 98.6%
Sp: 100.0%
Se: 88.6%
Sp: 100.0%
[40]
750–1800liquid10 batchesretailspiked samplesurea
adulteration
>0.95-Acc +
100 mg/dL: >97%
50–100 mg/dL: 90–95%
<50 mg/dL: ≈60%
[41]
600–1800liquid602cow
human
buffalo
goat
untreated
samples
milk origin--Se: 93.0%
Sp: 97.0%
Acc: 93.7%
[43]
R2: Coefficient of determination, RMSE: root mean square error, ND: Not Defined, p: RMSEP (root mean square error of prediction), sp: RSEP (relative standard errors of prediction), *: 0.3–3.8%, **: 0.3–1.55%, v: RMSEV (root mean square error of validation), +: depending on urea concentration, Se: Sensitivity, Sp: Specificity, Acc: Accuracy.
Table 3. Observed spectral lines of the major minerals in Laser-Induced Breakdown Spectroscopy spectra and their corresponding wavelengths [36].
ElementWavelength (nm)
H 486.1   ( H β ) ,   656.3   ( H α )
N (I)742.4, 744.2, 746.8, 818.8, 821.6, 824.2, 862.9, 865.6
N (II)500.5, 568.6
O (I)715.6, 777.2, 777.4, 777.5, 844.6, 926.4
C (I)247.8, 795.2, 906.2, 940.6
Mg (II)279.8, 280.3
Ca (I)422.6, 428.3 *, 428.9 *, 430.2 *, 431.9 *, 442.5 *, 443.6 *,
445.5 *, 559.4 *, 612.2 *, 616.2 *, 643.9 *, 646.3 *, 649.4 *
Ca (II)315.9, 317.9, 393.3, 396.8
Na (I)589.0
K (I)766.5, 769.8
* Spectral lines observed only in lyophilized powder milk; I: Atomic; II: Ionic.
Table 4. Laser-induced breakdown spectroscopy (LIBS) applications and performance.
Wavelength
(nm)
Type of Milk
Sample
No of
Samples
Origin of MilkSamples
Preparation
ApplicationR2RMSE/SEPAccuracy
(%)
Ref.
534.9
766.5
285.2
powder23retaildigested
samples
Ca
K
Mg
0.92
0.80
0.91
2614 mg kg−1 SEP
1549 mg kg−1 SEP
91 mg kg−1 SEP
-[47]
Laser excitation:
1064 and 532
liquid, ashed
L/ph powder
NDcow R, goat R, sheep Runtreated
samples
major minerals
minor minerals ††
---[36]
181–904powder5infant formulaspiked samplesCa0.85 pr0.68 mg/g p-[54]
200–700dried60
ND
maternal
infant formula
untreated
samples
composition quality
(Mg, Ca, Fe, Na)
---[52]
200–900liquid300cowuntreated
samples
fat, protein,
lactose, SNF,
density, SCC
---[53]
200–1000liquid
L/ph powder
1296
683
cow, goat, sheepuntreated
samples
milk origin--92.8
95.5
[49]
Mg, Ca, Na, K spectral linesliquid
L/ph powder
1296
683
cow, goat, sheepuntreated
samples
milk origin--87.6
92.9
[49]
≈185–1048powder50vetch rootpelleted
samples
milk origin--73.1[55]
190–450blended powder12cow R, goat R, sheep Rpelleted
samples
melamine A,
p/b clss.
0.99
(melamine)
-98
(clss. rate)
[50]
540–900powder36cowlyophilized, pasteurized, spiked,
centrifuged
sweet whey A
acid whey A
0.981
0.985
--[51]
186–900gel13
13
14
cow
goat
sheep
homogenized,
gel formed
caprine adult. with bovine
ovine adult. with bovine
0.993
0.995
4.53 μg mL−1 p
3.56 μg mL−1 p
-[56]
196–874powder25infant formulaspiked samplesexogenous protein--93.9 (SVM)
97.8 (CNN)
[57]
R2: Coefficient of determination, RMSE: Root Mean Square Error, SEP: Standard error of prediction, ND: Not Defined, L/ph: Lyophilized, SNF: Solids-Not-Fat, SCC: Somatic Cell Counts, SVM: Support Vector Machines, CNN: Convolutional Neural Network, p/b: pure/blended, clss: classification, Major minerals: (Ca, Na, Mg, K), †† Minor minerals: (P, Zn, Cu, Si), R: retail, p: RMSEP (root mean square error of prediction), pr: prediction, A: adulteration.
Table 5. Liquid milk NIR band assignments [70].
Compound AssignmentWavelength (nm)
N-H, protein904, 1014, 1031, 1720, 1758, 2196, 2296, 2334 [71,72]
O-H, C-H lipids2076, 2376 [71]
Carotenoids400–700 [71]
O-H, water1454, 1984, 1953 [73]
O-H, N-H1953, 2048 [73]
Attributed to high somatic cell count782, 788, 908, 980, 1068 [74]
Table 6. Near-infrared spectroscopy (NIRS) applications and performance.
Wavelength
(nm)
Type of
Milk Sample
No of
Samples
Origin
of Milk
Samples
Preparation
ApplicationR2RMSE/SEPAccuracy
(%)
Ref.
1000–1700 refl
1000–2500 tranms
liquid300cowuntreated
samples
fat
crude protein
lactose
urea
refl
0.997
0.959
0.300
-
tranms
0.997
0.927
0.768
-
refl
0.047% p
0.099% p
0.282% p
-
tranms
0.043% p
0.133% p
0.162% p
-
-[61]
1445–2348liquid HM
liquid UM
166goatmixed samplesfat
protein
casein
total solid
SCC
0.98 HM, R
0.96 HM, R
0.91 HM, R
0.94 HM, R
0.79 HM, R
0.98 UM, R
0.95 UM, R
0.92 UM, R
0.95 UM, R
0.74 UM, R
--[68]
851–1649liquid785cowuntreated
samples
fat
protein
lactose
urea
SCClog
0.998
0.98
0.92
0.82
0.85
0.09% SEP
0.05% SEP
0.06% SEP
19.3 mg/L SEP
0.18 SEP
-[28]
1500–2500powder409retailspiked, tableted samplesprotein0.966 p0.547% p-[77]
700–1100liquid384cowheated samplesSCC0.76--[74]
400–2500oven-dried242cowhomogenized samplescarotenoids
vitamins
FAs
0.09–0.63
0.01–0.69
0.07–0.96
0.01–0.15 μg/mL SEP
0.15 μg/mL–611.82 pg/mL SEP
0.12–4.13 g/100 g SEP
-[78]
400–2498 refloven-dried805goatuntreated
samples
FAs0.80–0.470.06–2.99 g/100 g SEP-[76]
400–2498 transliquid
oven dried
220
220
goatuntreated
samples
FAs0.11–0.79
0.23–0.78
0.05–2.81 g/100 g SEP
0.05–3.35 g/100 g SEP
-[76]
400–2498liquid
oven-dried
468cow, bulklyophilized or untreated
samples
FAs0.00–0.91 v
0.20–0.95 v
0.11–3.93 g/100 g SEP
0.03–3.25 g/100 g SEP
-[75]
400–2498liquid
oven-dried
215cowuntreated
samples
FAs0.29–0.92 v
0.46–0.97 v
0.08–2.34 g/100 g SEP
0.05–1.00 g/100 g SEP
-[79]
600–1100liquidNDretaildiluted samplespH-0.031 pH unit88.0–93.0[72]
≈1100–2500powder50vetch rootpelleted
samples
milk origin--91.5[55]
1100–2500liquid
powder
infant formula
690
660
660
retailhomogenized, spiked samplesmelamine A---[80]
1000–2500powder110infant
formula
mixed, spiked,
homogenized samples
melamine A-0.28–0.31% p-[81]
1000–2500liquid150cowcentrifuged
samples
scattering in NIR absorption---[73]
1100–2498liquid
dried
219sheepthawed, heated, homogenized samplessummer milk
winter milk
--liquid: 79.0
dried: 89.0
liquid: 78.0
dried: 93.0
[69]
400–2498oven-dried486cowuntreated
samples
cow feeding-type classification--91.5–95.5[71]
R2: Coefficient of determination, RMSE: Root Mean Square Error, ND: Not Defined, SCC: Somatic Cell Count, FAs: Fatty Acids. HM: Homogenized milk, UM: Unhomogenized milk, R: correlation coefficient, SEP: Standard Error of Prediction, p: RMSEP (root mean square error of prediction), refl: NIRS reflectance, trans: NIRS transflectance, tranms: NIRS transmittance, v: validation, A: adulteration.
Table 7. Handheld near-infrared spectroscopy (NIRS) applications and performance.
Wavelength
(nm)
Type of
Milk Sample
No of
Samples
Origin of MilkSamples
Preparation
ApplicationR2RMSE/SEPDiagnostic
Performance
Ref.
1600–2400liquid108cowuntreated
samples
FAs0.01–0.920.01–1.57 g/100 g SEP-[82]
908–1676liquid87retailuntreated
samples
O/NO
classification
--Se: 59.0%
Sp: 81.0%
Acc: 73.0%
[83]
1600–2400liquid542cowuntreated
samples
fat
protein
SNF
0.971
0.758
0.612
0.126% SEP
0.124% SEP
0.221% SEP
-[84]
≈1600–2400powder110infant
formula
mixed, spiked,
homogenized
samples
melamine A-0.33–0.35% p-[81]
≈1100–2200powder110infant
formula
mixed, spiked,
homogenized
samples
melamine A-0.27–0.30% p-[81]
960–1690liquid1270cowuntreated
samples
fat
protein
lactose
0.989 p_rl
0.894 p_rl
0.644 p_rl
0.989 p_ph
0.947 p_ph
0.689 p_ph
0.083 p_rl *
0.110 p_rl *
0.092 p_rl *
0.078 p_ph *
0.080 p_ph *
0.077 p_ph *
-[85]
800–1060liquid81cowmixed, diluted, homogenized samplesfat
casein
whey
0.88
0.89
0.91
0.08% wt p
0.13% wt p
0.07% wt p
-[86]
R2: Coefficient of determination, RMSE: Root Mean Square Error, O: Organic, NO: Non-Organic, Se: Sensitivity, Sp: Specificity, Acc: Accuracy, SNF: Solids-Not-Fat, FAs: Fatty Acids, p: RMSEP (root mean square error of prediction), SEP: Standard Error of Prediction, p_rl: prediction real-time, p_ph: prediction post-hoc, A: adulteration, *: % wt/wt.
Table 8. Mid-infrared spectroscopy (MIRS) applications and performance.
Wavelength
(cm−1)
Type of
Milk
Sample
No of
Samples
Origin of MilkSamples
Preparation
ApplicationR2RMSE/SEPAccuracy
(%)
Ref.
1000–4000liquid235cowheated, spiked, mixed or
untreated
samples
protein-PLS: 0.22%
NN: 0.08%
-[88]
1470–1730L/ph
powder
NDcowspiked, diluted
samples
protein0.974 c0.765 mg mL−1 cv-[89]
400–4000powder409retail spiked, tableted
samples
protein0.990 pr0.294% p-[77]
All MIR excluding:
1600–1710
2990–3690
>3822
liquid730cowuntreated
samples
CMS
pH
protein traits
RCT
0.08
0.65
0.19–0.47
0.50
25.286 mm cv
0.061 pH unit cv
0.255–1.759 g/L cv
6.397 min cv
0.62
0.80
0.41–0.48
0.75
[90]
525–4000liquid242cowheated,
homogenized
samples
carotenoids
vitamins
FAs
0.01–0.50
0.02–0.40
0.01–0.34
0.01–0.19 μg/mL SEP
0.15 μg/mL–907.3 pg/mL SEP
0.13–12.63 g/100 g SEP
-[78]
1000–5000liquid215cowuntreated
samples
FAs0.33–0.94 v0.06–1.14 g/100 g SEP-[79]
900–4000liquid1064cowspiked, diluted
samples
RCT
titratable acidity
pH
0.62
0.66
0.59
2.36 min cv
0.26 SHo/50 mL cv
0.08 Ph unit cv
-[91]
500–4000liquid
powder
infant
formula
690
660
660
retailhomogenized, spiked samplesmelamine A---[80]
1450–1600liquid310retailcentrifuged, spiked samples(w, sm, su, u, hp) A0.96, 0.94, 0.98, 0.98, 0.90(2.33, 0.06, 0.41, 0.30, 0.01) g/L SEP-[87]
R2: Coefficient of determination, RMSE: Root Mean Square Error, ND: Not Defined, PLS: Partial Least Squares, NN: Neural Networks, L/ph: Lyophilized, FAs: Fatty Acids, CMS: Casein Micelle Size, RCT: Rennet Coagulation Time, p: RMSEP (root mean square error of prediction, cv: RMSE of cross validation, SEP: Standard Error of Prediction, c: cross-validation, v: validation, pr: prediction, w: whey, sm: synthetic milk, su: synthetic urea, u: urea, hp: hydrogen peroxide, A: adulteration.
Table 10. Comparison of spectral techniques for milk analysis.
Spectral TechniqueCostAdaptabilityConvenienceAccuracySpeedPortabilityAuthorityPromotion
Raman+++++++++++++++++++++
LIBS++++++++++++++++++++
NIRS (Benchtop)++++++++++++++++++++
NIRS (Portable)+++++++++++++++++++++++++++
MIRS+++++++++++++++++++
FT-IR++++++++++++++++
UV+++++++++++++++++
Fluorescence++++++++++++++++++
UV/Vis+++++++++++++++++
LIBS: Laser-induced breakdown spectroscopy, NIRS: near-infrared spectroscopy, MIRS: Mid-infrared spectroscopy, FT-IR: Fourier transform infrared, UV: Ultraviolet, Vis: Visible, +: Low, ++: Moderate, +++: High, ++++: Very High.
Table 13. Milk source and regional origin classification according to the utilized ML method.
MLToolsNo and Type of Milk
Samples
ApplicationAccuracy
(%)
Ref.
NNLIBS683 lyophilized
1296 liquid
b, c, o
animal origin:
liquid milk
powdered milk
Mg, Ca, Na, K
97.2 (train), 86.3 (test)
97.5 (train), 94.5 (test),
98.6 (train), 92.7 (test)
[49]
ANNUV-Vis/NIR, FT-NIR63 bgeographic origin of cow milk 100 classification
95 train
92 validation
[158]
SVMLIBS683 lyophilized
1296 liquid
b, c, o
animal origin:
liquid milk
powdered milk
96.6 (train), 91.3 (test)
96.2 (train), 93.1 (test)
[49]
GBMLIBS683 lyophilized
1296 liquid
b, c, o
animal origin:
liquid milk
powdered milk
96.7 (train), 83.0 (test)
97.4 (train), 91.4 (test)
[49]
RFRaman602 b, c, o, hclassify milk (cow, human, buffalo, goat) 93.63 [43]
h: human, c: caprine, o: ovine, b: bovine, NN: Neural Networks, ANN: artificial neural network, LIBS: laser-induced breakdown spectroscopy, UV: Ultraviolet, Vis: visible, NIR: Near-Infrared, SVM: Support Vector Machines, FT-NIR: Fourie Transform Near-Infrared, GBM: gradient boosting machines, RF: random forest.
Disclaimer/Publisher’s Note: The statements, opinions and data contained in all publications are solely those of the individual author(s) and contributor(s) and not of MDPI and/or the editor(s). MDPI and/or the editor(s) disclaim responsibility for any injury to people or property resulting from any ideas, methods, instructions or products referred to in the content.

