Article

Investigation of Long-Term Performance of a Proposed Cost-Effective HCl Non-Dispersive Infrared Analyzer at Real Stationary Sources

by
Byeong-Gyu Park
1,
Trieu-Vuong Dinh
2,*,
Sang-Woo Lee
1,
In-Young Choi
1,
Byung-Chan Cho
3,
Da-Hyun Baek
1,
Jong-Choon Kim
1 and
Jo-Chun Kim
1,*
1
Department of Civil and Environmental Engineering, Konkuk University, Seoul 05029, Republic of Korea
2
International Climate and Environmental Research Center, Konkuk University, Seoul 05029, Republic of Korea
3
Senko Co., Ltd., Osan 18111, Republic of Korea
*
Authors to whom correspondence should be addressed.
Chemosensors 2024, 12(12), 262; https://doi.org/10.3390/chemosensors12120262
Submission received: 10 November 2024 / Revised: 7 December 2024 / Accepted: 12 December 2024 / Published: 13 December 2024
(This article belongs to the Section Analytical Methods, Instrumentation and Miniaturization)

Abstract

:
The zero drift, interference, and sensitivity of an HCl analyzer based on a non-dispersive infrared (NDIR) technique can be improved to develop a cost-effective solution for continuous emission monitoring systems (CEMSs). To achieve these improvements, the same bandpass filter technique, negligible interference bandpass filter, and optimal path length are applied to the analyzer. Laboratory inspections and long-term field trials are conducted to evaluate the performance of the analyzer. A metalworking factory and a cement factory are selected for field trials. In laboratory inspections, the relative error of the analyzer is less than 1%, aligning closely with the results obtained from standard ion chromatography methods. Moreover, the basic specifications of the proposed analyzer are comparable to those of commercial HCl analyzers. In field trials, the NDIR analyzer shows a significant bias compared to the standard method. However, when considering the difference between HCl emission levels and HCl emission standards, the relative errors are less than 10%. These results suggest the proposed NDIR analyzer is a practical option for the CEMS of metalworking and cement factories. However, seasonal variations should be considered when the temperatures of gas emissions are low.

Graphical Abstract

1. Introduction

Hydrogen chloride (HCl, CAS number 7647-01-0) is a colorless, corrosive gas with an acrid smell at room temperature [1]. HCl negatively impacts human health. Exposure to HCl typically results in irritation of the respiratory tract, eyes, and skin [2]. Inhalation of high concentrations of HCl (1000–2000 ppm) can cause death [2]. Particulate Cl and gaseous hydrogen chloride (HCl) are important in atmospheric chemistry [3]. Particulate Cl can form through the process of equilibrium redistribution from gaseous HCl [3]. Gaseous HCl is a precursor to ozone and particulate matter (PM), which are closely related to human health [3,4]. Moreover, similar to SO2 and NOX, HCl is a contributor to not only boiler corrosion but also acid rain [5,6]. Therefore, gaseous HCl must be regulated.
Gaseous HCl is emitted from industrial sources, including the combustion of chloride-containing fuels (such as waste, biomass, and coal) and chemical production [4,7]. The primary emissions of HCl are from waste incineration (38%), biomass burning (19%), energy production (19%), and residential (13%) sectors [8]. Current regulations generally do not recommend the continuous monitoring of HCl in most plants [9]. The level of HCl in plants with well-controlled stack emissions is expected to be much less than 5 ppm [9,10]. Therefore, monitoring the emissions of gaseous HCl is essential in managing and controlling its emissions from stationary sources [4,7,11]. Air quality depends on monitoring anthropogenic sources, and accurate measurements are essential for monitoring emissions [7,12,13]. The critical component of an effective monitoring system is an instrument capable of maintaining accuracy under diverse operating conditions [13].
For measuring gaseous HCl, methods such as tunable diode laser absorption spectroscopy (TDLAS), Fourier-transform infrared (FTIR) spectroscopy, and the non-dispersive infrared analyzer integrated with gas filter correlation (GFC/NDIR) have been widely used to develop an HCl analyzer [4,10,13]. On the other hand, HCl sensor-types have been recently developed based on electrochemical and optical technologies [14,15,16,17,18,19,20,21,22,23,24]. Electrochemical sensors detect the variations of electrical signals generated by chemical reactions of gas compounds [25], whereas optical sensors measure the variations of light intensity due to the interaction between light and gas compounds [26].
Tunable diode laser absorption spectroscopy (TDLAS) consists of a tunable diode laser, transmission optics, an optical gas chamber, and a detector. This technique, based on a tunable diode laser, adjusts the diode laser’s injection current or temperature to align the emission wavelength with the absorption lines of a specific gas [9,27,28]. TDLAS is relatively simple in its experimental setup and capable of performing online in situ measurements using cross-stack configurations [10,27,29]. It exhibits high sensitivity and can achieve a specific detection limit to meet measurement requirements by selecting appropriate gas absorption lines [27,30]. The limitations of TDLAS include its high cost, the requirement for line-of-sight—which prevents spatially resolved measurements—limited detection bandwidth, and limited adaptability of detectors in severe environments [29,31].
Fourier-transform infrared (FTIR) spectroscopy consists of an infrared source, a beam splitter, a detector, and an interferometer [13,32]. By using a broad range of IR frequencies, the FTIR light source can simultaneously acquire comprehensive infrared spectrum information rather than being limited to a few frequencies at a time [33,34,35]. The Fourier transformation significantly enhanced IR spectrometry’s ability to solve a wide range of analytical issues, converting raw data into an actual spectrum [13,36]. FTIR is a susceptible sensitive analytical technique that can identify trace substances in a sample within a few minutes. It can also be applied to a quantitative analysis to determine the concentration of a compound in a sample [37]. FTIR’s main drawbacks include its high cost, primarily due to computer requirements, potential spectrum interference from complex sample mixtures or other molecules, and water sensitivity, necessitating drying materials before analysis [38,39]. Due to FTIR spectroscopy’s water sensitivity, materials must be thoroughly dried before analysis to prevent contamination [40].
A non-dispersive infrared (NDIR) technology, which is a type of optical technology based on the infrared absorption of an analyte, is another potential approach for HCl measurement because of its precise accuracy, long life, fast response, and high selectivity [41,42,43]. Recently, NDIR sensors have been widely developed to measure gaseous compounds because of their compact and low cost, such as NO2 emitted from diesel engines [42], CO2, CO, and C3H8 emitted from automobiles [44], CO2 in air [45,46,47,48], CH4 in air [49], SF6 emitted from the power industry [50], and CO2 and CH4 emitted from the thermal runaway process of lithium-ion batteries [51]. However, NDIR-based HCl sensors have not been extensively documented. Furthermore, while an NDIR sensor represents a potential approach for developing an HCl sensor suitable for a CEMS, its durability and the interference effects of complex emission gases in flue gas from industrial stacks must be carefully considered. Notably, to date, no sensor of this type has been approved or regulated for use in CEMS applications [52,53,54,55,56].
An NDIR analyzer, integrated with a gas filter correlation (GFC), consists of a gas chamber, an infrared source, a detector equipped with a bandpass filter (BPF), and a filter wheel with GFC [57,58]. A single infrared source and detector allow monitoring numerous gases simultaneously by using different BPFs [32,33]. Three components make up the GFC wheel: (1) a high concentration of the gas to be detected, (2) a neutral gas (usually N2), and (3) a window for background signal determination [58,59]. The GFC technique improves the NDIR analyzer’s sensitivity and selectivity by introducing a significant volume of sample gas. In addition, the GFC offers spectral resolution and a high degree of multiplexing, with performance requirements for zero drift and resolution [58,59]. Because IR sources with a wide range of wavelengths can run at a lower temperature than other sources, NDIR benefits energy usage [32]. Water vapor interference is one of its disadvantages, which is important since stack gases contain a considerable quantity of water vapor and can lead to the formation of artifacts for target gases [60]. Although the NDIR used a GFC to mitigate interference, the GFC indicated that elevated concentrations of interfering gases at specific levels decreased the analyzer’s accuracy, ultimately causing bias in the analytical results [59]. Although NDIR is simpler and cheaper than TDLAS and FTIR, it is used less commonly due to this issue. Therefore, the NDIR analyzer for HCl needs improving.
In terms of other HCl sensor technologies, the recent sensor development is shown in Table 1.
As shown in Table 1, HCl sensors have been significantly developed in recent years. However, many of these are colorimetric-type sensors, which are primarily suitable for safety applications. Some proposed sensors can measure HCl in real time within practical operational ranges and detection limits. However, these sensors were designed for ambient air monitoring rather than monitoring emission gases from industrial stacks. The photoacoustic sensor based on near-infrared technology is also a potential method, but its sensitivity to vibration [62] is a disadvantage for industrial applications. In addition, ensuring consistent performance over a long period leaves a critical concern for these sensors because the CEMS regulations require the durable and consistent performance of analyzers to pass a yearly quality inspection [52,53,54,55,56]. Notably, as mentioned earlier, sensor-type devices have not yet been approved for CEMS applications. Therefore, an HCl analyzer type should be considered to be practically and immediately applicable for CEMS. However, there is limited documentation on the development of HCl analyzers specifically for CEMS. Instead, several HCl analyzers have been developed for ambient air monitoring using techniques such as tunable infrared laser differential absorption spectroscopy (TILDAS) [63] and cavity ring-down spectroscopy [64]. While these technologies are also suitable for HCl analyzers in CEMS applications, their high manufacturing cost is a significant concern.
Accordingly, a highly accurate cost-effective NDIR with low zero drift was developed in this study, offering a promising solution for the continuous HCl monitoring of industrial emissions. An optimal path length, a correction factor of humidity interference, and a negligible zero-drift method [57] were applied. Long-term field trials at a metalworking factory and a cement factory were conducted to investigate the performance of the analyzer.

2. Materials and Methods
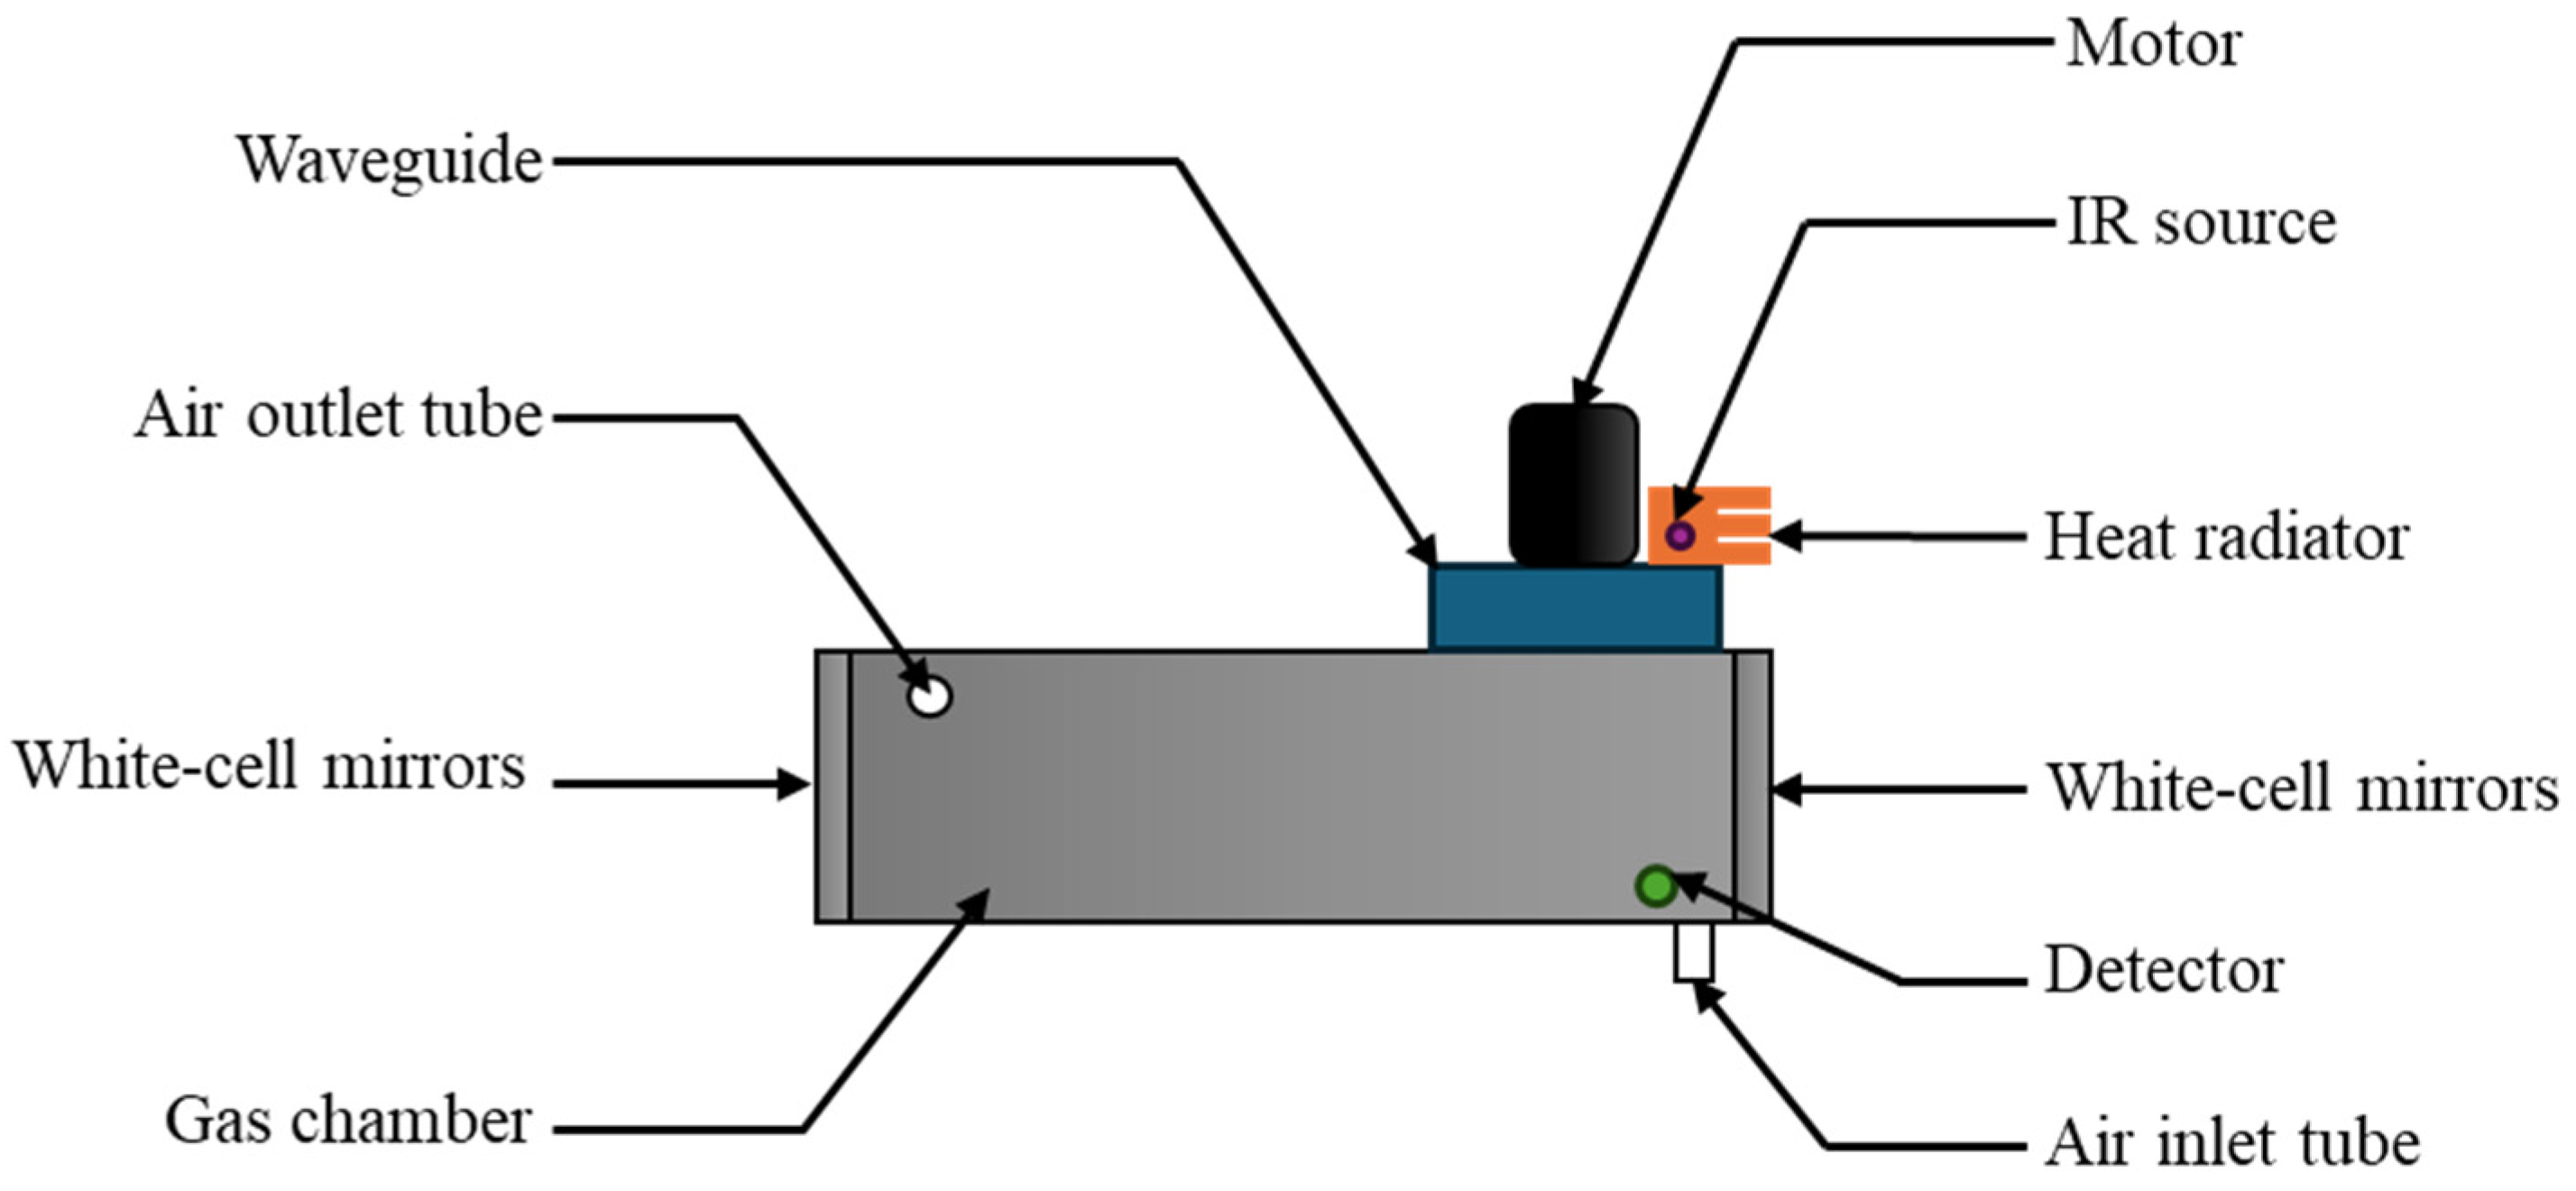
2.1. Apparatus

The NDIR analyzer comprised a 14 W infrared source (PL-314K, Hawkeye Technologies Inc., Milford, CT, USA), a pyroelectric detector (LME-335, Infratec GmbH, Dresden, Germany), an aluminum anodized gas chamber with gold-coated mirrors, and a waveguide connected to a motor (PKP566FMN24A, Oriental Motor Co., Ltd., Tokyo, Japan). The general schematic diagram of the analyzer is shown in Figure 1. The reference BPF center wavelength was 3.95 μm with a 90 nm half-bandwidth (Seoul Precision Optics Co., Ltd., Seoul, Republic of Korea) applied as a reference channel. The initial cost of the analyzer was approximately 10,000 USD, which can be cost-effective for a CEMS analyzer compared to high-cost commercial analyzers.

2.2. Development of HCl Analyzer

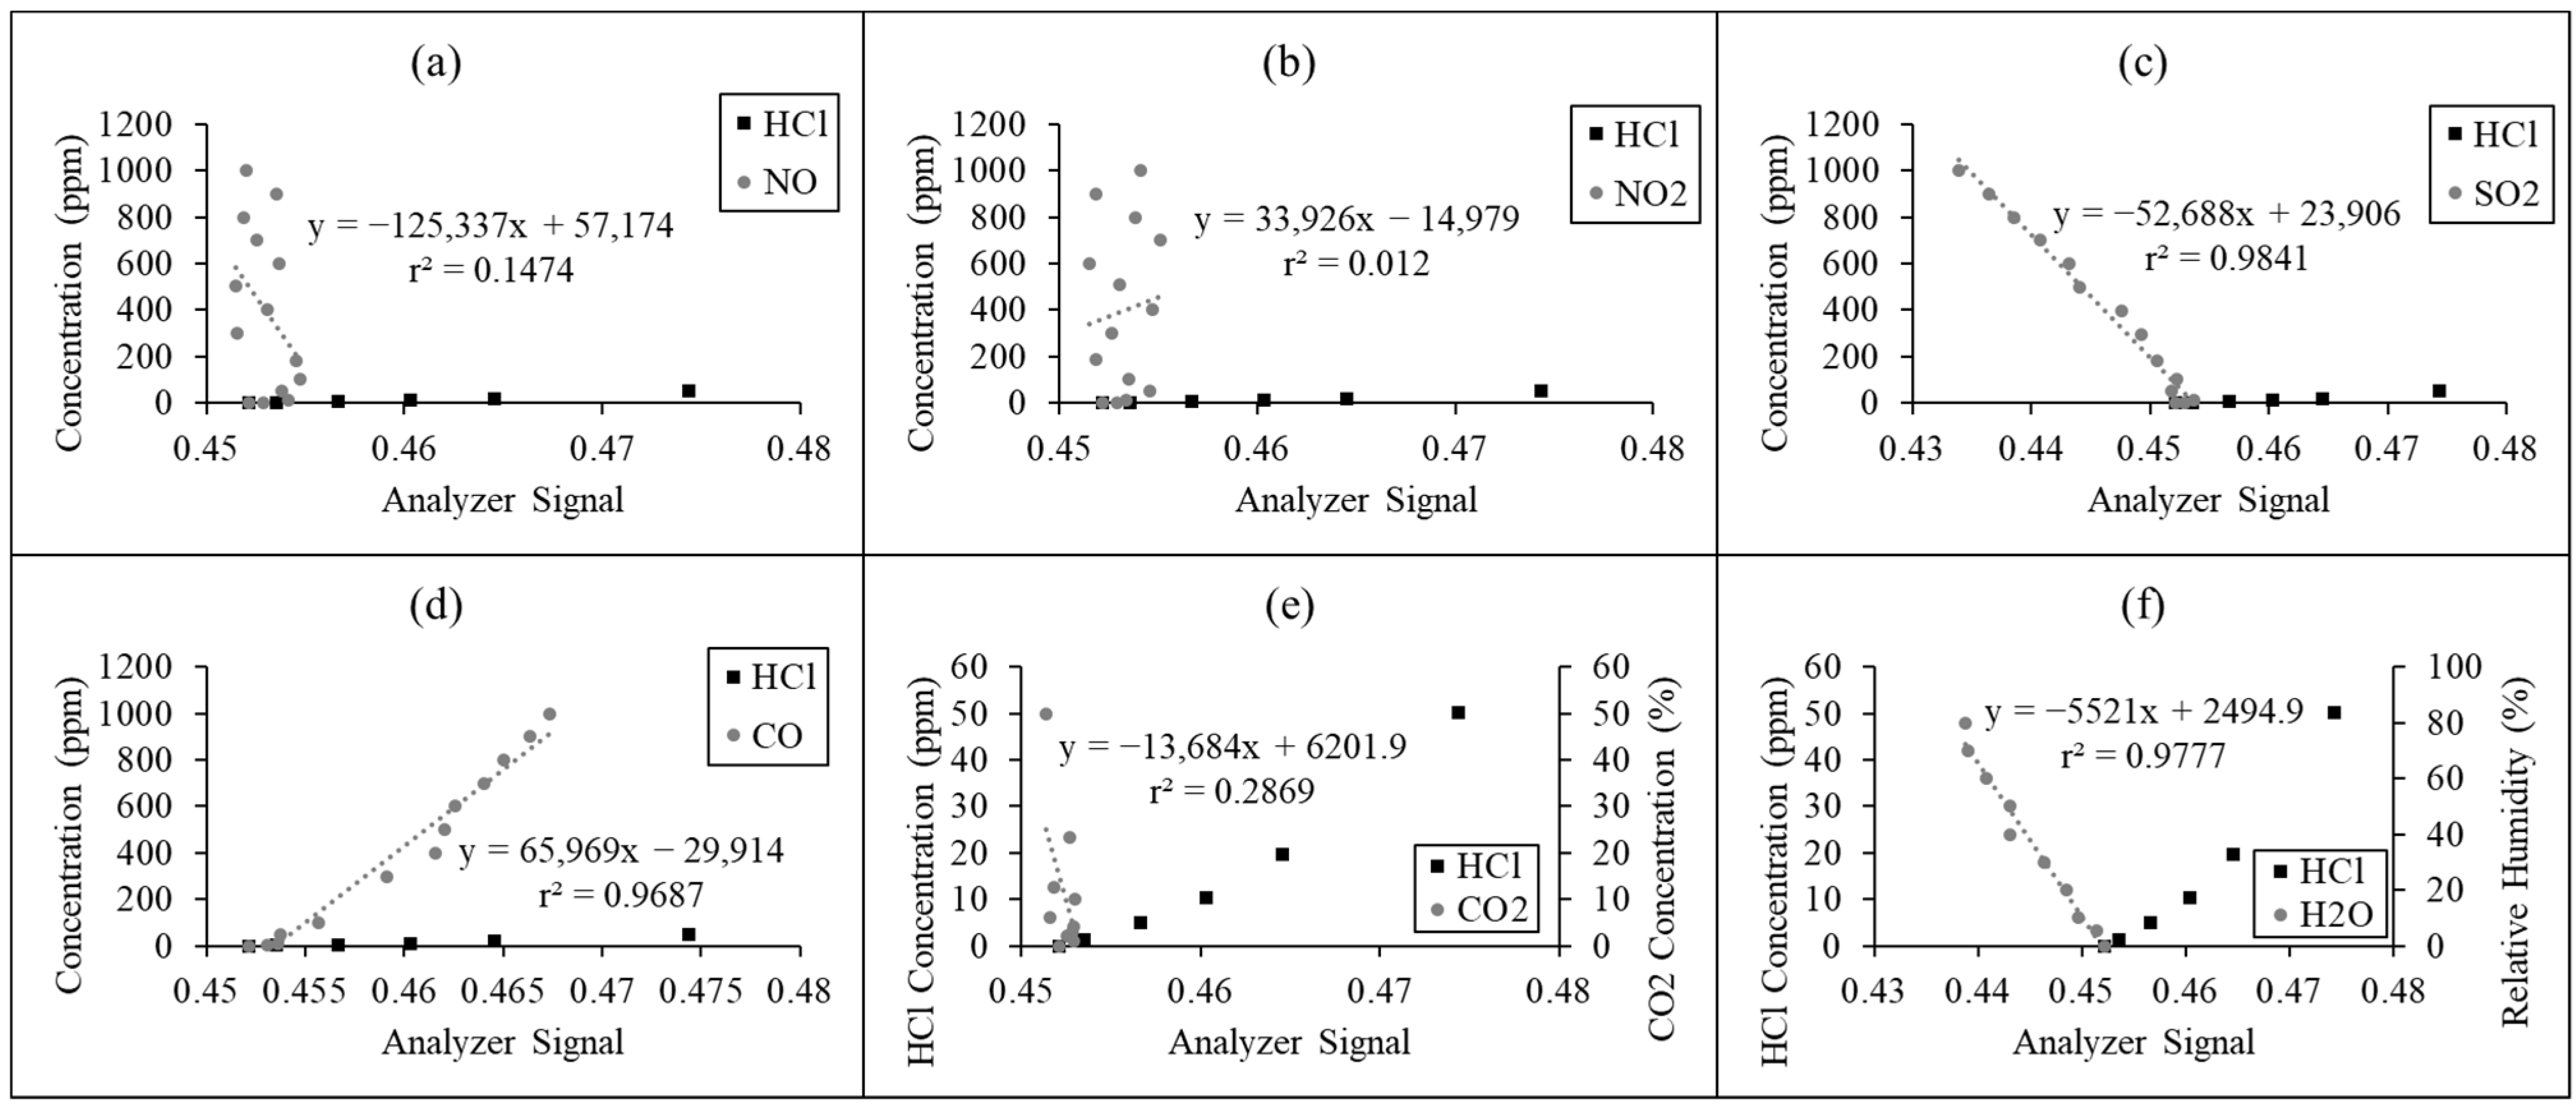
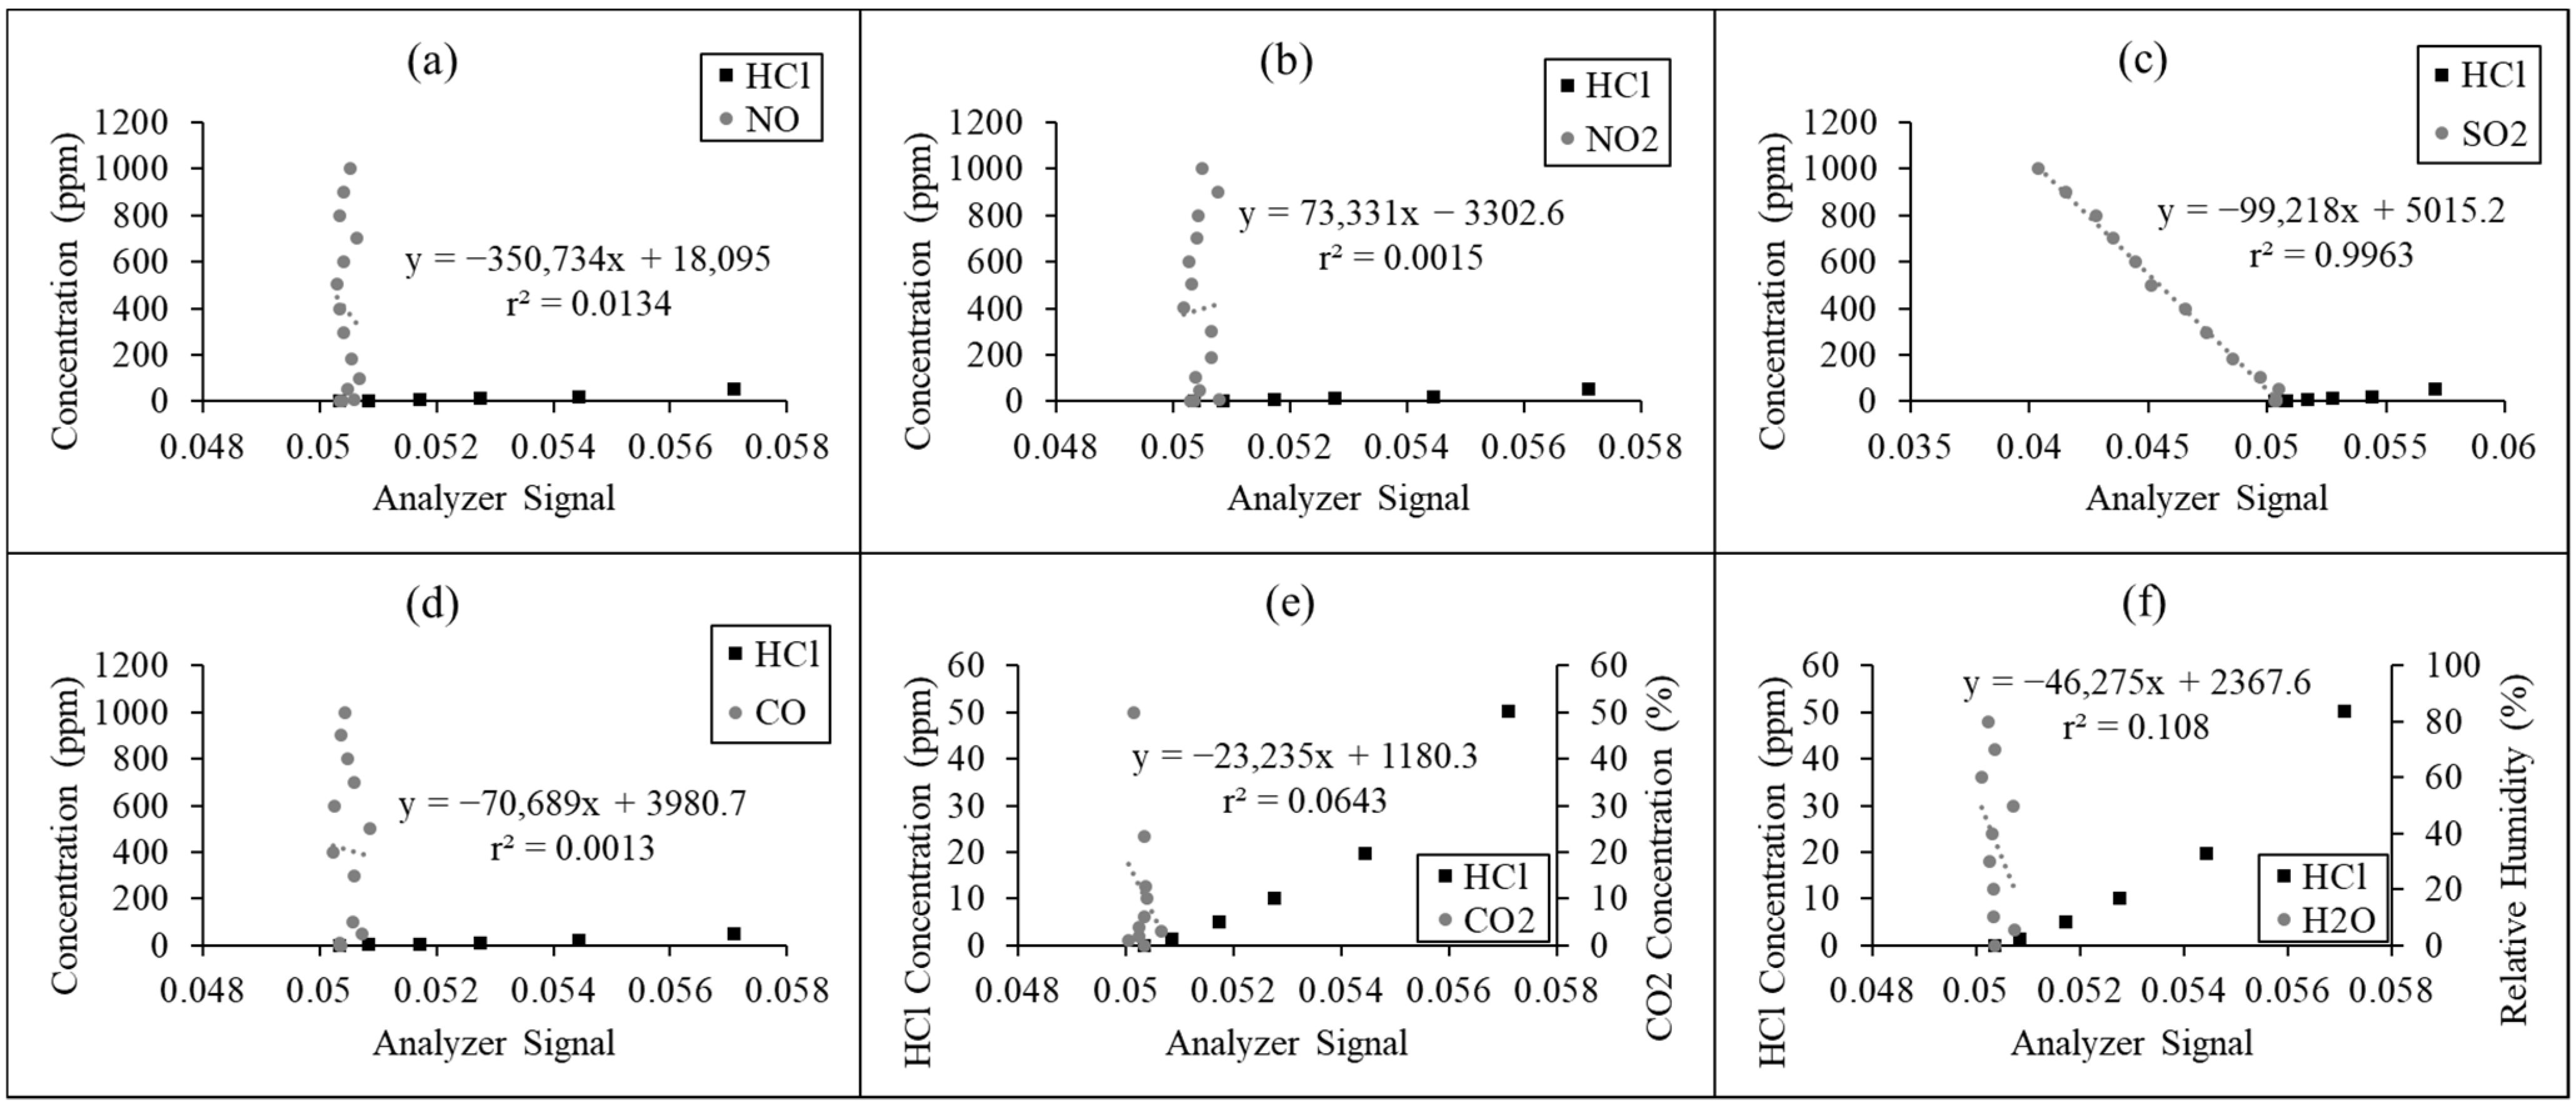
2.2.1. Negligible-Interference Bandpass Filter

The HITRAN database [65] was used to analyze the spectral characteristics of various chemicals, a method adapted from previous research [33,34]. As illustrated in Figure 2, the infrared absorption spectra of HCl gas extend from 3.2 µm to 3.9 µm. Within this spectral range, SO2 and H2O present significant spectral overlap (refer to dashed circle in Figure 2), thereby interfering with the accurate detection of HCl. In particular, H2O introduces substantial interference due to its high concentration in the stack emission gas. A new HCl-specific bandpass filter (BPF) was developed to mitigate this challenge by targeting spectral regions exhibiting minimal cross-sensitivity to other compounds. The BPF features a center wavelength (CWL) of 3.60 μm and an 80 nm half-bandwidth (HBW).
To test the performance of the new BPFs, a comparison test was conducted with a commercial product, a BPF with 3.55 μm of CWL, and 70 nm of HBW (Seoul Precision Optics Co., Ltd., Seoul, Republic of Korea). The experimental setup is presented in Figure 3.
The IR intensity at a specific wavelength decreased in the gas chamber due to the gas’ absorption of IR light at that wavelength. The detector reported the infrared intensity and produced an electrical (detector) signal. The signal-processing algorithm transformed logarithmically the ratio of the signal detected by the analyzer. The logarithm of the ratio (R:M) of the analyzer signal (R is the signal from the reference BPF channel, and M is the signal from the target gas BPF channel) was calculated. N2 (99.999%, DongA Co., Ltd., Gwangju, Republic of Korea) was used to calibrate the zero point. Then, HCl and other standard gases were used to calibrate the span points of the NDIR. The standard gas concentration is shown in Table 2. H2O (vapor) was generated using the bubble method [66,67]. Humidity was measured by a humidity sensor (645, Testo SE & Co. KgaA, Lenzkirch, Germany).
Each gas was injected into the analyzer for 15 min. The initial 5 min data, prior to reaching equilibrium, were excluded, and the average signal levels from the last 10 min were used. Relative sensitivity is a measure of the rate of change of the calibration curve y = f(x), which relates analyzer signals to concentrations of the target gas [68].

2.2.2. Improvement of the Zero-Drift Issue

Zero drift refers to a variation in the analyzer’s signal that displaces the entire calibration curve of the analyzer [69]. An HCl GFC with 99.99% HCl gas was used to reduce the drift of the analyzer. Using different wavelengths of reference BPF and measurement BPF causes zero drift [28,36]. To reduce the zero drift, the negligible zero-drift method for the NDIR analyzer was adapted from a previous study [57]. HCl GFC coupled with HCl BPF was used as a reference channel. This method was compared with a typical reference channel using a 3.95 µm BPF. HCl BPF was used as a measurement channel. To evaluate the stability of the NDIR analyzer, it was operated continuously for 14 days, during which continuous analytical signals were recorded for each of the three channels. Zero drift was calculated using the logarithm of the ratio (R:M) of the analyzer signal.

2.2.3. Investigation of Optimal Path Length

The analyzer needs a long optical path length to achieve sensitivity and improve the limit of detection [32,70]. Therefore, the feasible path length that can provide linear calibration curves must be determined. The analyzer signal was defined as the logarithm of the ratio between the HCl BPF measurement signal and the HCl GFC reference signal. The correlation between the analyzer signal and the target gas concentration was evaluated with respect to various optical path lengths, including 6, 10, and 12 m. An experimental setup is presented in Figure 3.

2.3. Performance of Proposed HCl NDIR Analyzer at Laboratory-Scale Inspection

To investigate the performance of the proposed HCl NDIR analyzer, its operation specifications, including detection limit, zero drift, span drift, reproductivity, linearity, and response time, were first demonstrated following the national standard (REF). N2 gas (99.99%, Rigas Co., Ltd., Daejeon, Republic of Korea) was used for the detection limit and zero test. HCl standard gas of 39.5 ppm (Rigas Co., Ltd., Daejeon, Republic of Korea) was used as a span gas because the analyzer measurement range was developed as 0~50 ppm. HCl standard gases of 15.6, 29.5, and 39.5 ppm (Rigas Co., Ltd., Daejeon, Republic of Korea) were applied to investigate the analyzer’s linearity.
Second, the analyzer’s performance was determined using nine gas mixes chosen based on the emission pattern of a combustion process. The concentrations of mixed gases are shown in Table 3. We selected concentrations of interference gases using data from CleanSYS [71], a continuous emission monitoring system for combustion in the Republic of Korea. HCl concentrations ranged from 0 to 13.5 ppm [71]. Consequently, the HCl concentrations in the mixes were 1, 5, and 10 ppm. The other compounds were also mixed at concentrations based on CleanSYS data [71]. The relative humidity (RH) of the flue gas was assumed at 10, 20, and 50%, since water pretreatment equipment was typically used to remove water vapor in the flue gas before entering the analyzer [72,73]. A 25 L Tedlar bag (232-25, SKC Inc., Eighty Four, PA, USA) was used to prepare each mixture. The experimental setup is shown in Figure 3. The ion chromatography method was used to measure the amounts of HCl [74].

2.4. Long-Term Field Trials of the Proposed HCl NDIR Analyzer

The first field trial was conducted in a metalworking factory in Incheon, Republic of Korea. Since the factory used HCl solvent for the coating process of metals, HCl gas was found in the emission gas. The factory is appropriate for NDIR performance evaluation because its HCl concentration was between 0 and 4 ppm. The field experiment was conducted by installing a shelter next to the stack according to the standard for installing continuous emission monitoring systems (CEMSs) [75], and was operated for four seasons from June 2022 to May 2023. The emission gas from the factory was collected and treated with a wet scrubber before being released into ambient air through a stack. The average flue gas temperature in the stack was approximately 15.5 ± 7.5 °C. The emission flow rate was approximately 1200 ± 100 m3/min. The HCl emission standard of the factory was 4 ppm. The second field trial was conducted at a cement factory in Gwangyang City, Republic of Korea. The emission gas from the factory’s kiln process was considered. The average flue gas temperature in the stack was approximately 56 ± 6 °C. The emission flow rate was approximately 870 ± 50 m3/min. Its HCl emission standard was 5 ppm. In accordance with the factory’s permission, the field trials at the cement factory were conducted for 6 months from November 2022 to April 2023.
The experimental setup for the field trial is shown in Figure 4.
The measurement hole is approximately 30 m high, and a probe is connected to the chimney to collect the sample. A conduit heated to 140 °C [74] is used to transfer the flue gas to the analyzer so that the emission gas can be transported without condensation. To remove the high moisture levels in the flue gas, a humidity pretreatment device based on the NafionTM membrane [74] was used before its introduction into the analyzer. The humidity was sustained below 40% relative humidity at 25 °C. A data logger was connected to the NDIR to collect data at 30 min intervals for analysis based on the national standard [74]. The test bed and the NDIR analyzer were checked and calibrated every two weeks.
Since there were no standard CEMS data for HCl at these factories, to evaluate the NDIR analysis data from the site, random samples were collected [76] and analyzed using the ion chromatography (IC) method [74]. It was repeated 12 times randomly during the field experiment at the metalworking factory and six times at the cement factory. Each time, three samples were collected and compared. The relative mean squared error (RMSE), mean normalized error (MNE), and mean normalized bias (MNB) were evaluated using Equation (1), Equation (2), and Equation (3), respectively, to assess the bias of the proposed analyzer compared relatively to results from the IC. If RMSE and MNE are lower, the HCl concentration observed by the proposed NDIR analyzer is closer to that obtained by the ion chromatography method. An MNB of zero indicates no systematic bias between the HCl concentration obtained from the proposed analyzer and the IC method [77,78]. A positive MNB indicates that the HCl concentration measured by the NDIR analyzer is higher than that measured by the IC method and vice versa [77,78].
R M S E = 1 n i = 1 n ( C N D I R C I C ) 2
  M N E = 1 n i = 1 n C N D I R C I C C I C × 100
M N B = 1 n i = 1 n C N D I R C I C C I C × 100
where CNDIR is the HCl concentration measured by the proposed HCl NDIR analyzer, CIC is the HCl concentration measured by the IC method, and n is the number of values.
In addition, the relative percentage difference between the proposed NDIR analyzer and the IC standard method was also calculated based on Equation (4) to relatively compare the performance of the analyzer at a field performance [79].
R P D = C N D I R C I C E m i s s i o n   s t a n d a r d × 100
Microsoft Office Excel (version 2307, Microsoft Cooperation, Redmond, WA, USA) was used to create the charts.

3. Results and Discussion

3.1. Development of HCl Analyzer

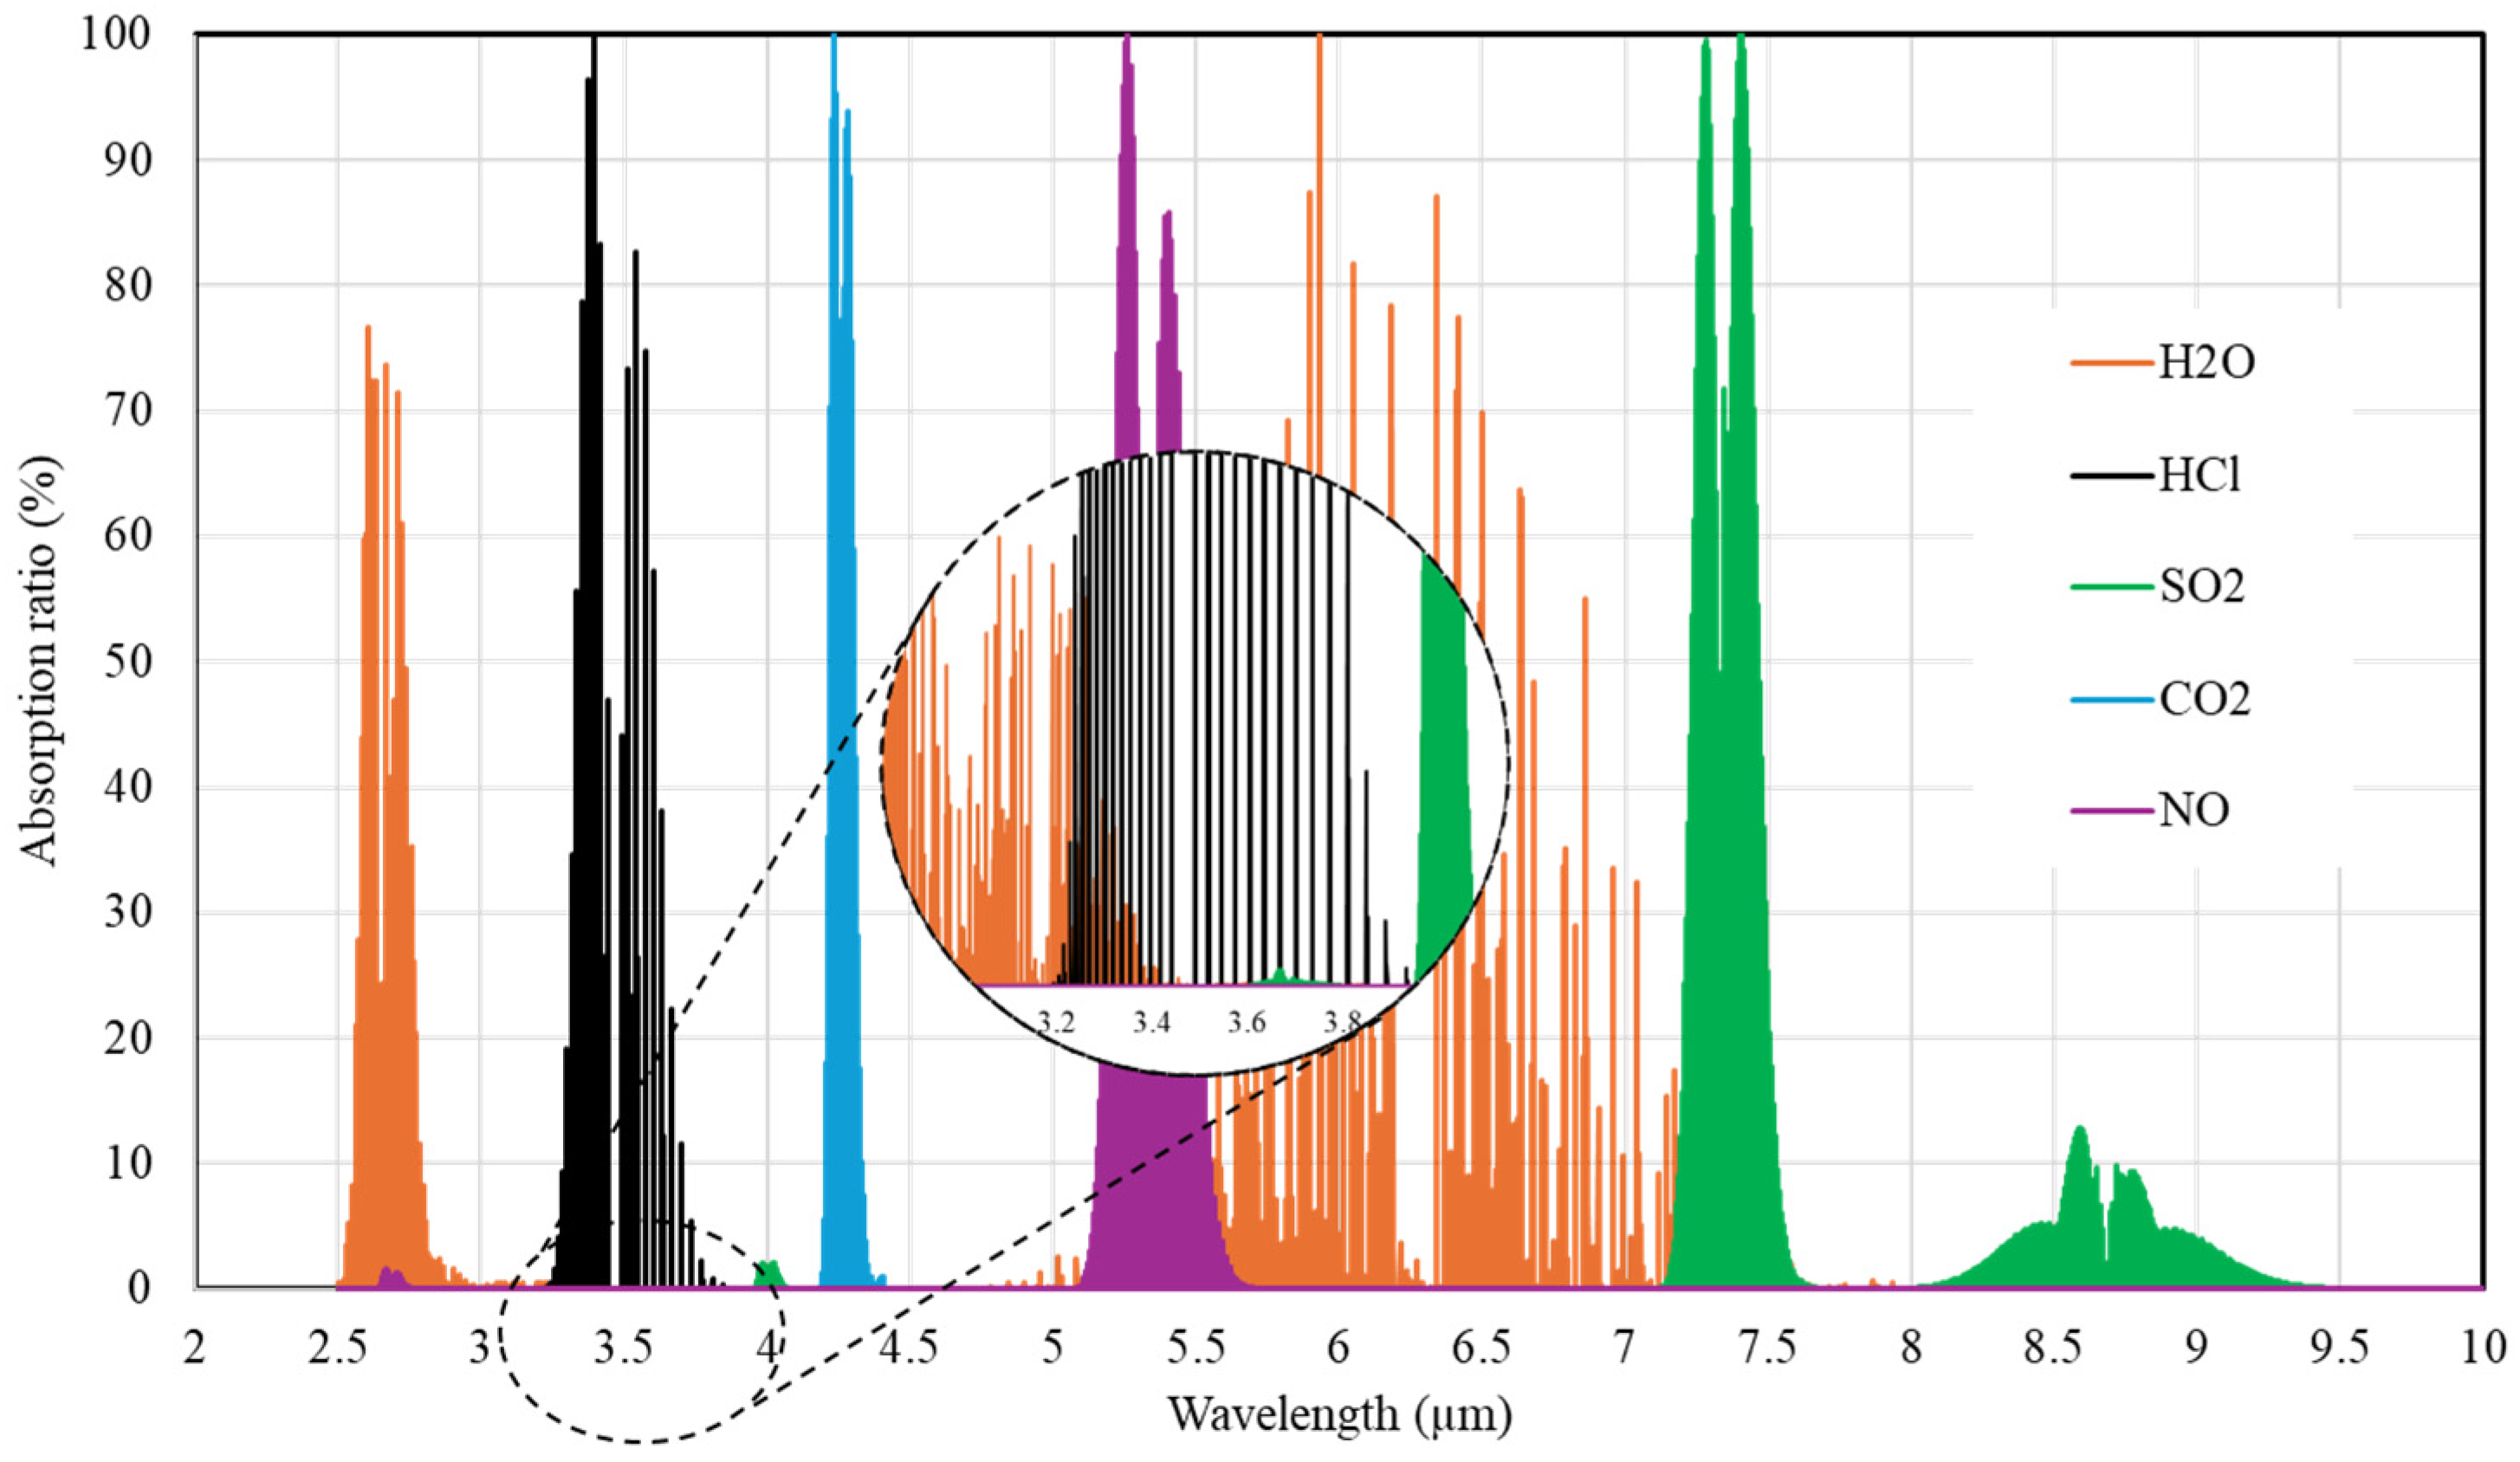
3.1.1. Negligible-Interference Bandpass Filter

The interference effects in the new HCl BPF and the commercial BPF were measured using varying concentrations of target gases. The effects of NO, NO2, SO2, CO, CO2, and H2O interference on the HCl BPFs are shown in Figure 5 and Figure 6.
As shown in Figure 5, commercial BPF was not substantially affected by NO, NO2, and CO2. On the other hand, SO2, CO, and H2O demonstrated significant effects on the commercial BPF (r2 > 0.9). In flue gas, humidity is usually high. Therefore, H2O has a significant impact on low HCl concentrations.
As reflected in Figure 6, SO2 showed significant effects on the new HCl BPF (r2 > 0.9), while other gases showed no interference effects on the new BPF. Both the new and commercial HCl BPF were significantly affected by SO2. Flue gas desulfurizer (FGD) is widely applied to treat SO2 emitted from the stack, and its removal efficiency is over 95% [80]. Consequently, SO2 is discharged from the stack at a low concentration (Table 4) [71]. As shown in Table 4, most SO2 emissions were less than 10 ppm. Thus, SO2 cannot cause a significant effect on the NDIR analyzer. A cross-interference factor could compensate for interference to improve the accuracy of the analyzer [81]. These results indicate that the new HCl BPF has less interference with other gases than the commercial BPF.

3.1.2. Improvement of the Zero-Drift Issue

Commercial reference BPF and HCl GFC coupled with HCl BPF were compared for the reference channel. The zero drift of the HCl NDIR analyzer was measured continuously for 14 days, as shown in Figure 7. It was found that zero drift with the reference BPF over 14 days was approximately 0.35%. This result is a small percentage, but it is about a 1.6 ppm drift when converted to concentration (Figure 8a). On the other hand, 0.03% of zero drift with HCl GFC occurred, which is approximately 0.3 ppm at a concentration (Figure 8b). Since the HCl emission from the stack is mainly discharged at low concentrations, even the smallest error can cause a significant effect. Therefore, the drift of the HCl NDIR analyzer must be reduced, which can be resolved by applying the negligible zero-drift method [57].

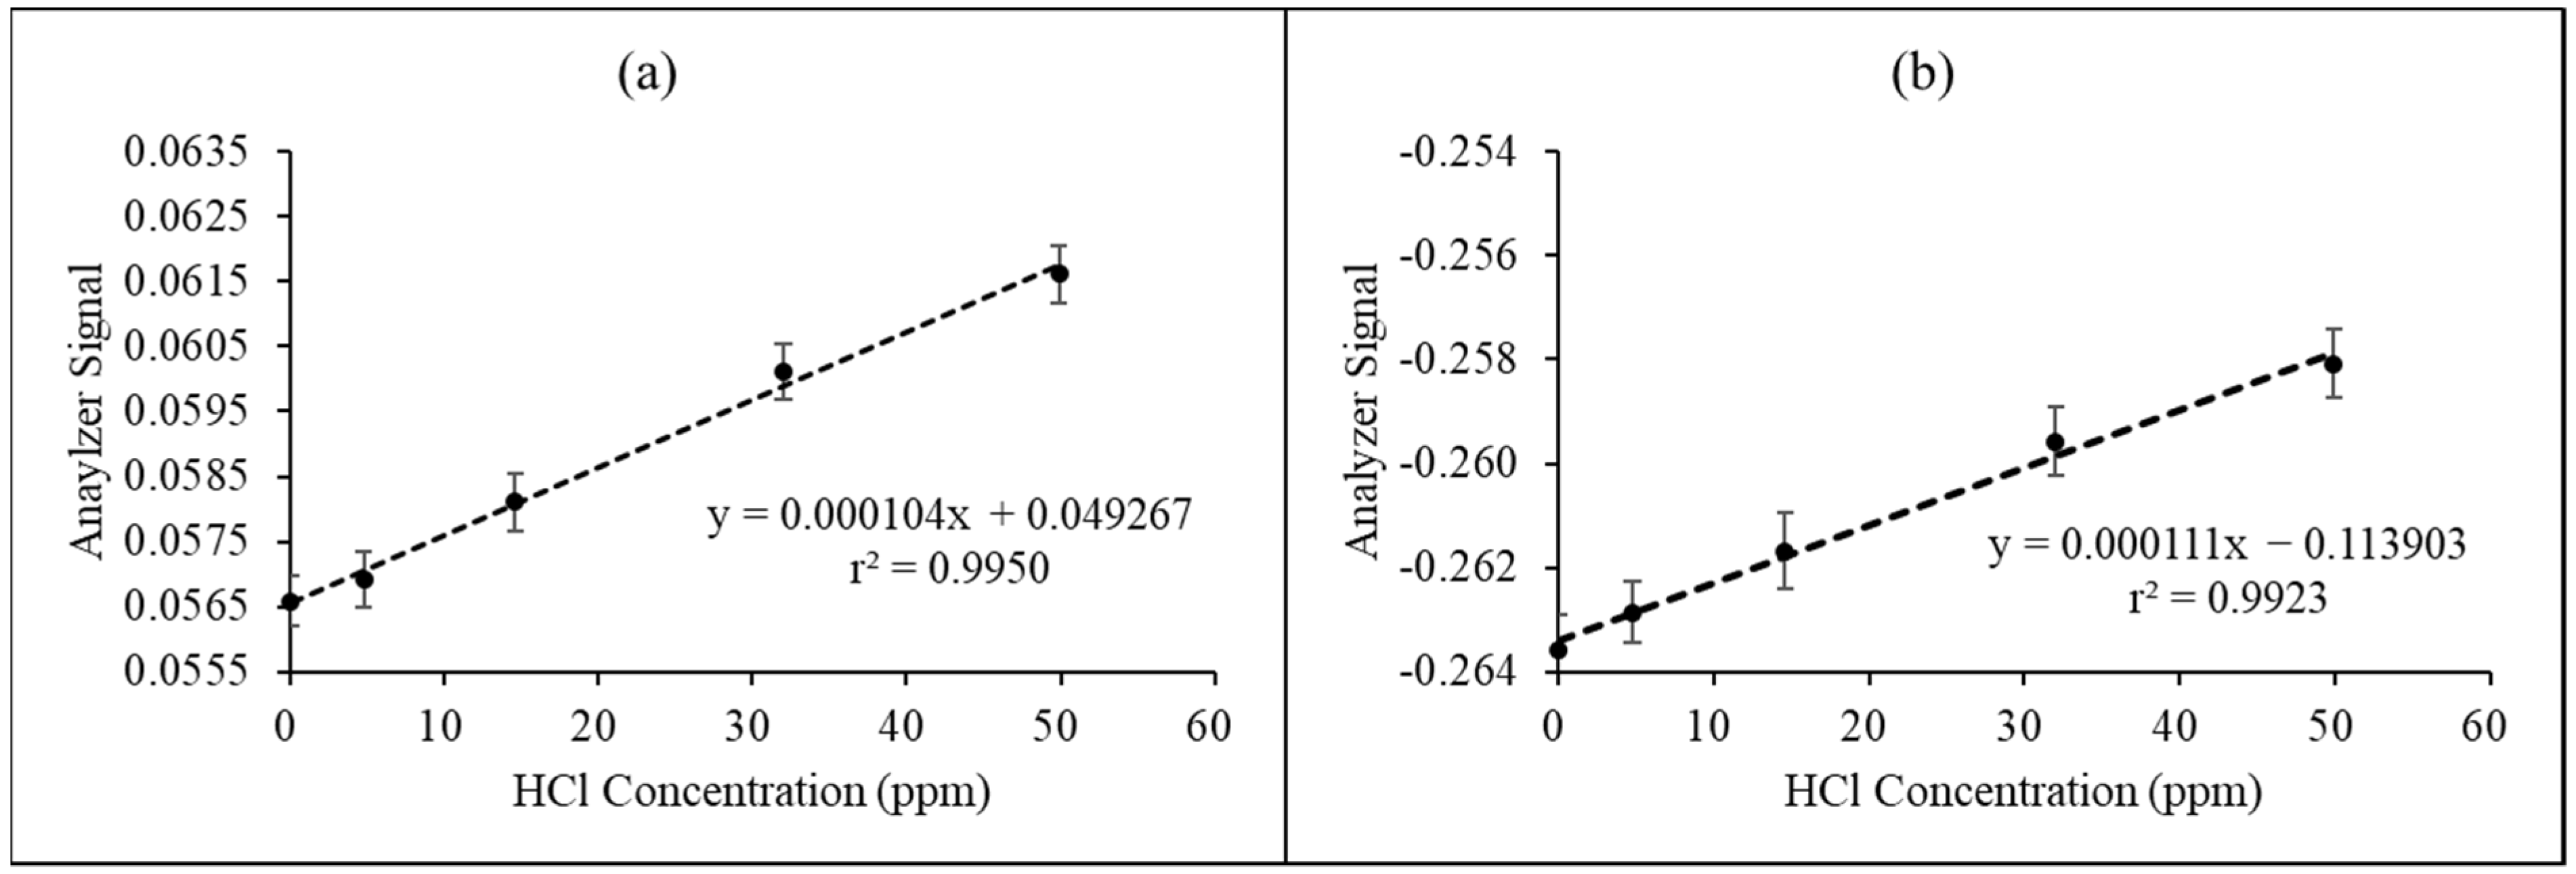
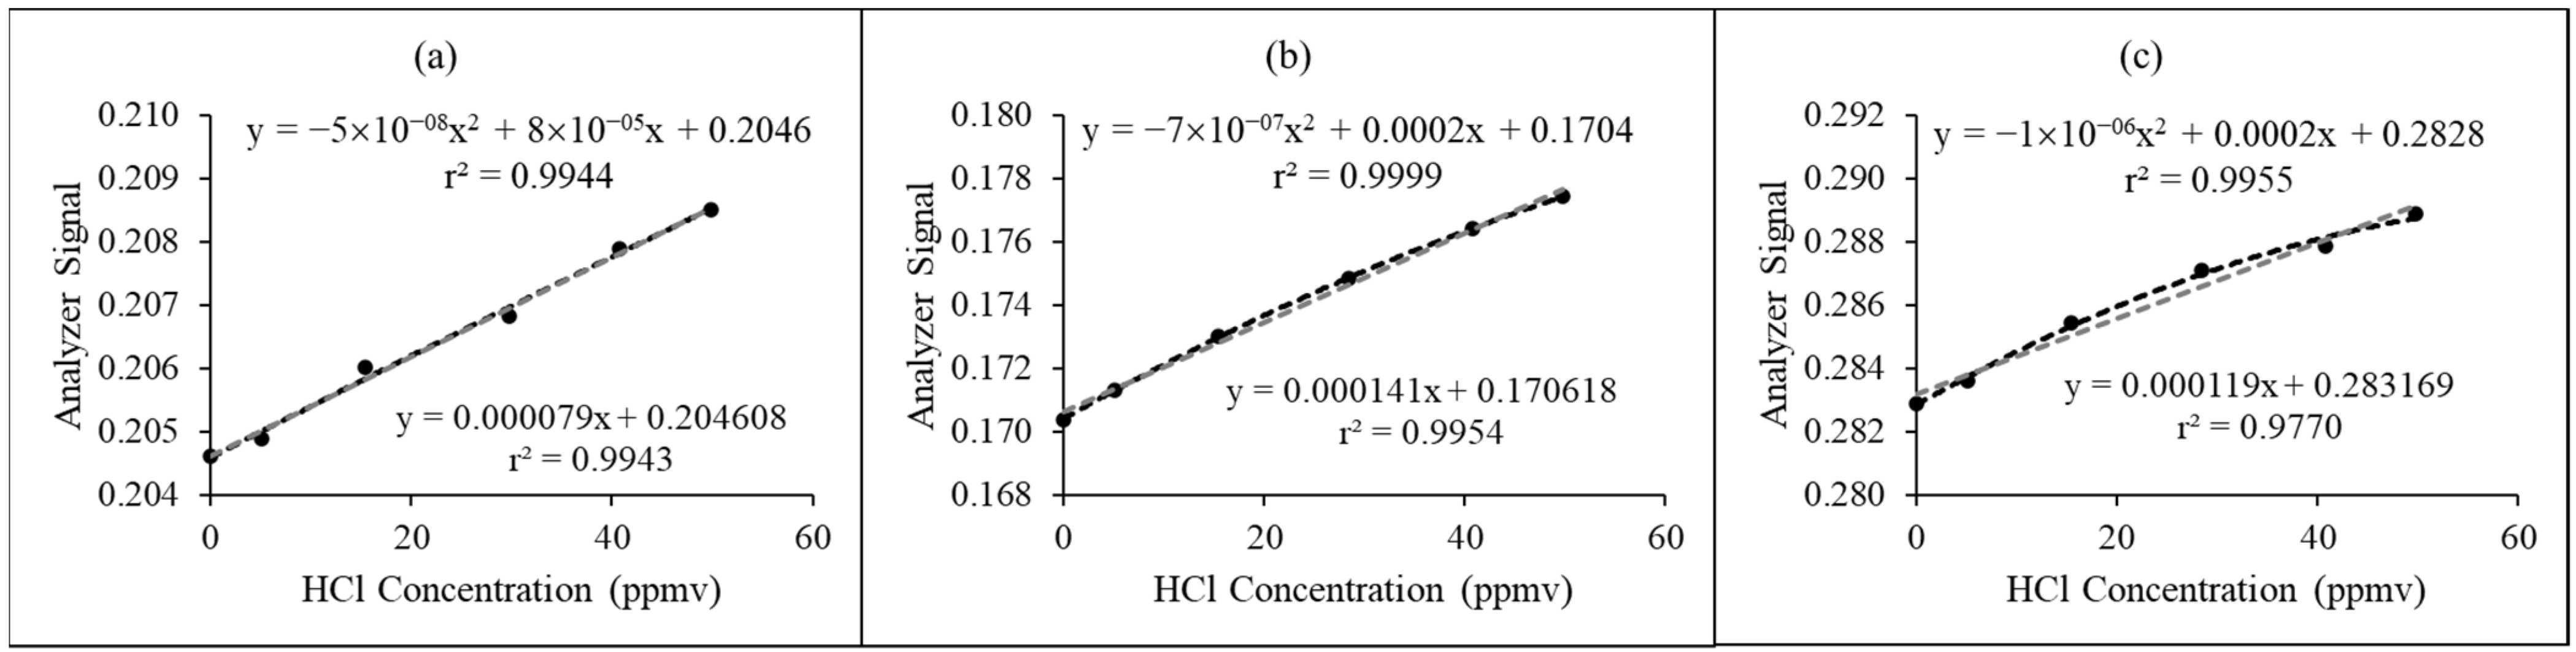
3.1.3. Investigation of Optimal Path Length

The HCl calibration curves, which present relationships between the optical path length and the analyzer signals, are shown in Figure 9. The logged ratio values between the signals from the measurement channel (i.e., BPF of HCl gas) and the reference channel (i.e., HCl GFC coupled with HCl BPF) were used to calculate the relative absorbances. The linearity of the calibration curve indicates that it is effective in measuring high concentrations. All path lengths showed a good coefficient of determination in terms of calibration (r2 > 0.97). However, for the 12 m path length, most of its infrared radiation was absorbed. Consequently, at long path lengths, there was a nonlinear relationship between the analyzer signals and HCl concentrations (Figure 9c), while it was linear for the 6 and 10 m path lengths (Figure 9a,b). Therefore, the 6 and 10 m path lengths could be used to measure a high concentration, and a 12 m path length could be used to measure a relatively low concentration. Longer path lengths may not always result in better outcomes when it comes to absorption over the entire concentration range.
As the optical path lengths increased, the analyzer’s sensitivity also increased. The increase in path length led to an increase in absorbance, based on the Beer–Lambert law. However, the longer path length can result in a slower response time or recovery speed of the analyzer. Thus, the optimal path length is an important issue. As a result, the sensitivity of the analyzer has been improved. However, the sensitivity at the 10 m path length did not significantly differ from that at 12 m, as the slope values are shown in Figure 9. Therefore, the 10 m path length was selected, considering the measurement range, cost, response, and noise.

3.2. Performance of Proposed HCl NDIR Analyzer at Laboratory-Scale Inspection

Table 5 shows the basic specifications of the proposed HCl NDIR analyzer. The 2 h zero drift and 2 h span drift were 0.02% and 0.3%, respectively. The representative performance data are presented in Figure 10.
Table 5 and Figure 10 demonstrate that the performance of the proposed HCl NDIR analyzer was comparable to other commercial HCl analyzers employing diverse technologies. Although the limit of detection and measurement range of some commercial products, such as FTIR analyzers, surpass those of the proposed analyzer, the lower cost of the proposed device offers a significant advantage in terms of cost-effectiveness. Furthermore, the proposed analyzer’s specifications meet the requirements for CEMS applications despite its relatively low price. It is worth noting that 10,000 USD is the production cost of a single device used in this study. Thus, massive production has the potential to further reduce this cost.
Since the negligible zero-drift method was employed, the 2 h zero drift and 24 h zero drift were similar. This suggests that the zero-drift issue of an NDIR analyzer was improved. Although its measurement range was 0~50 ppm, its detection limit was approximately 0.1 ppm. Therefore, the selected path length was acceptable for an NDIR analyzer.
To investigate the effect of interference gases, mixture gases that were simulated by emission compositions from a combustion process were used to examine the analyzer’s operation (Table 6). Table 6 indicates that the NDIR analyzer’s accuracy was comparable to the ion chromatography method (RPD < 1.0%). Furthermore, the NDIR analyzer demonstrated very good precision (RSD < 2%). The sensitivity of the analyzer was improved, because it could measure HCl at 1 ppm even though its full scale was 50 ppm. The HCl NDIR analyzer can be used not only in metalworking factories but also in combustion processes in which various gas components are emitted.

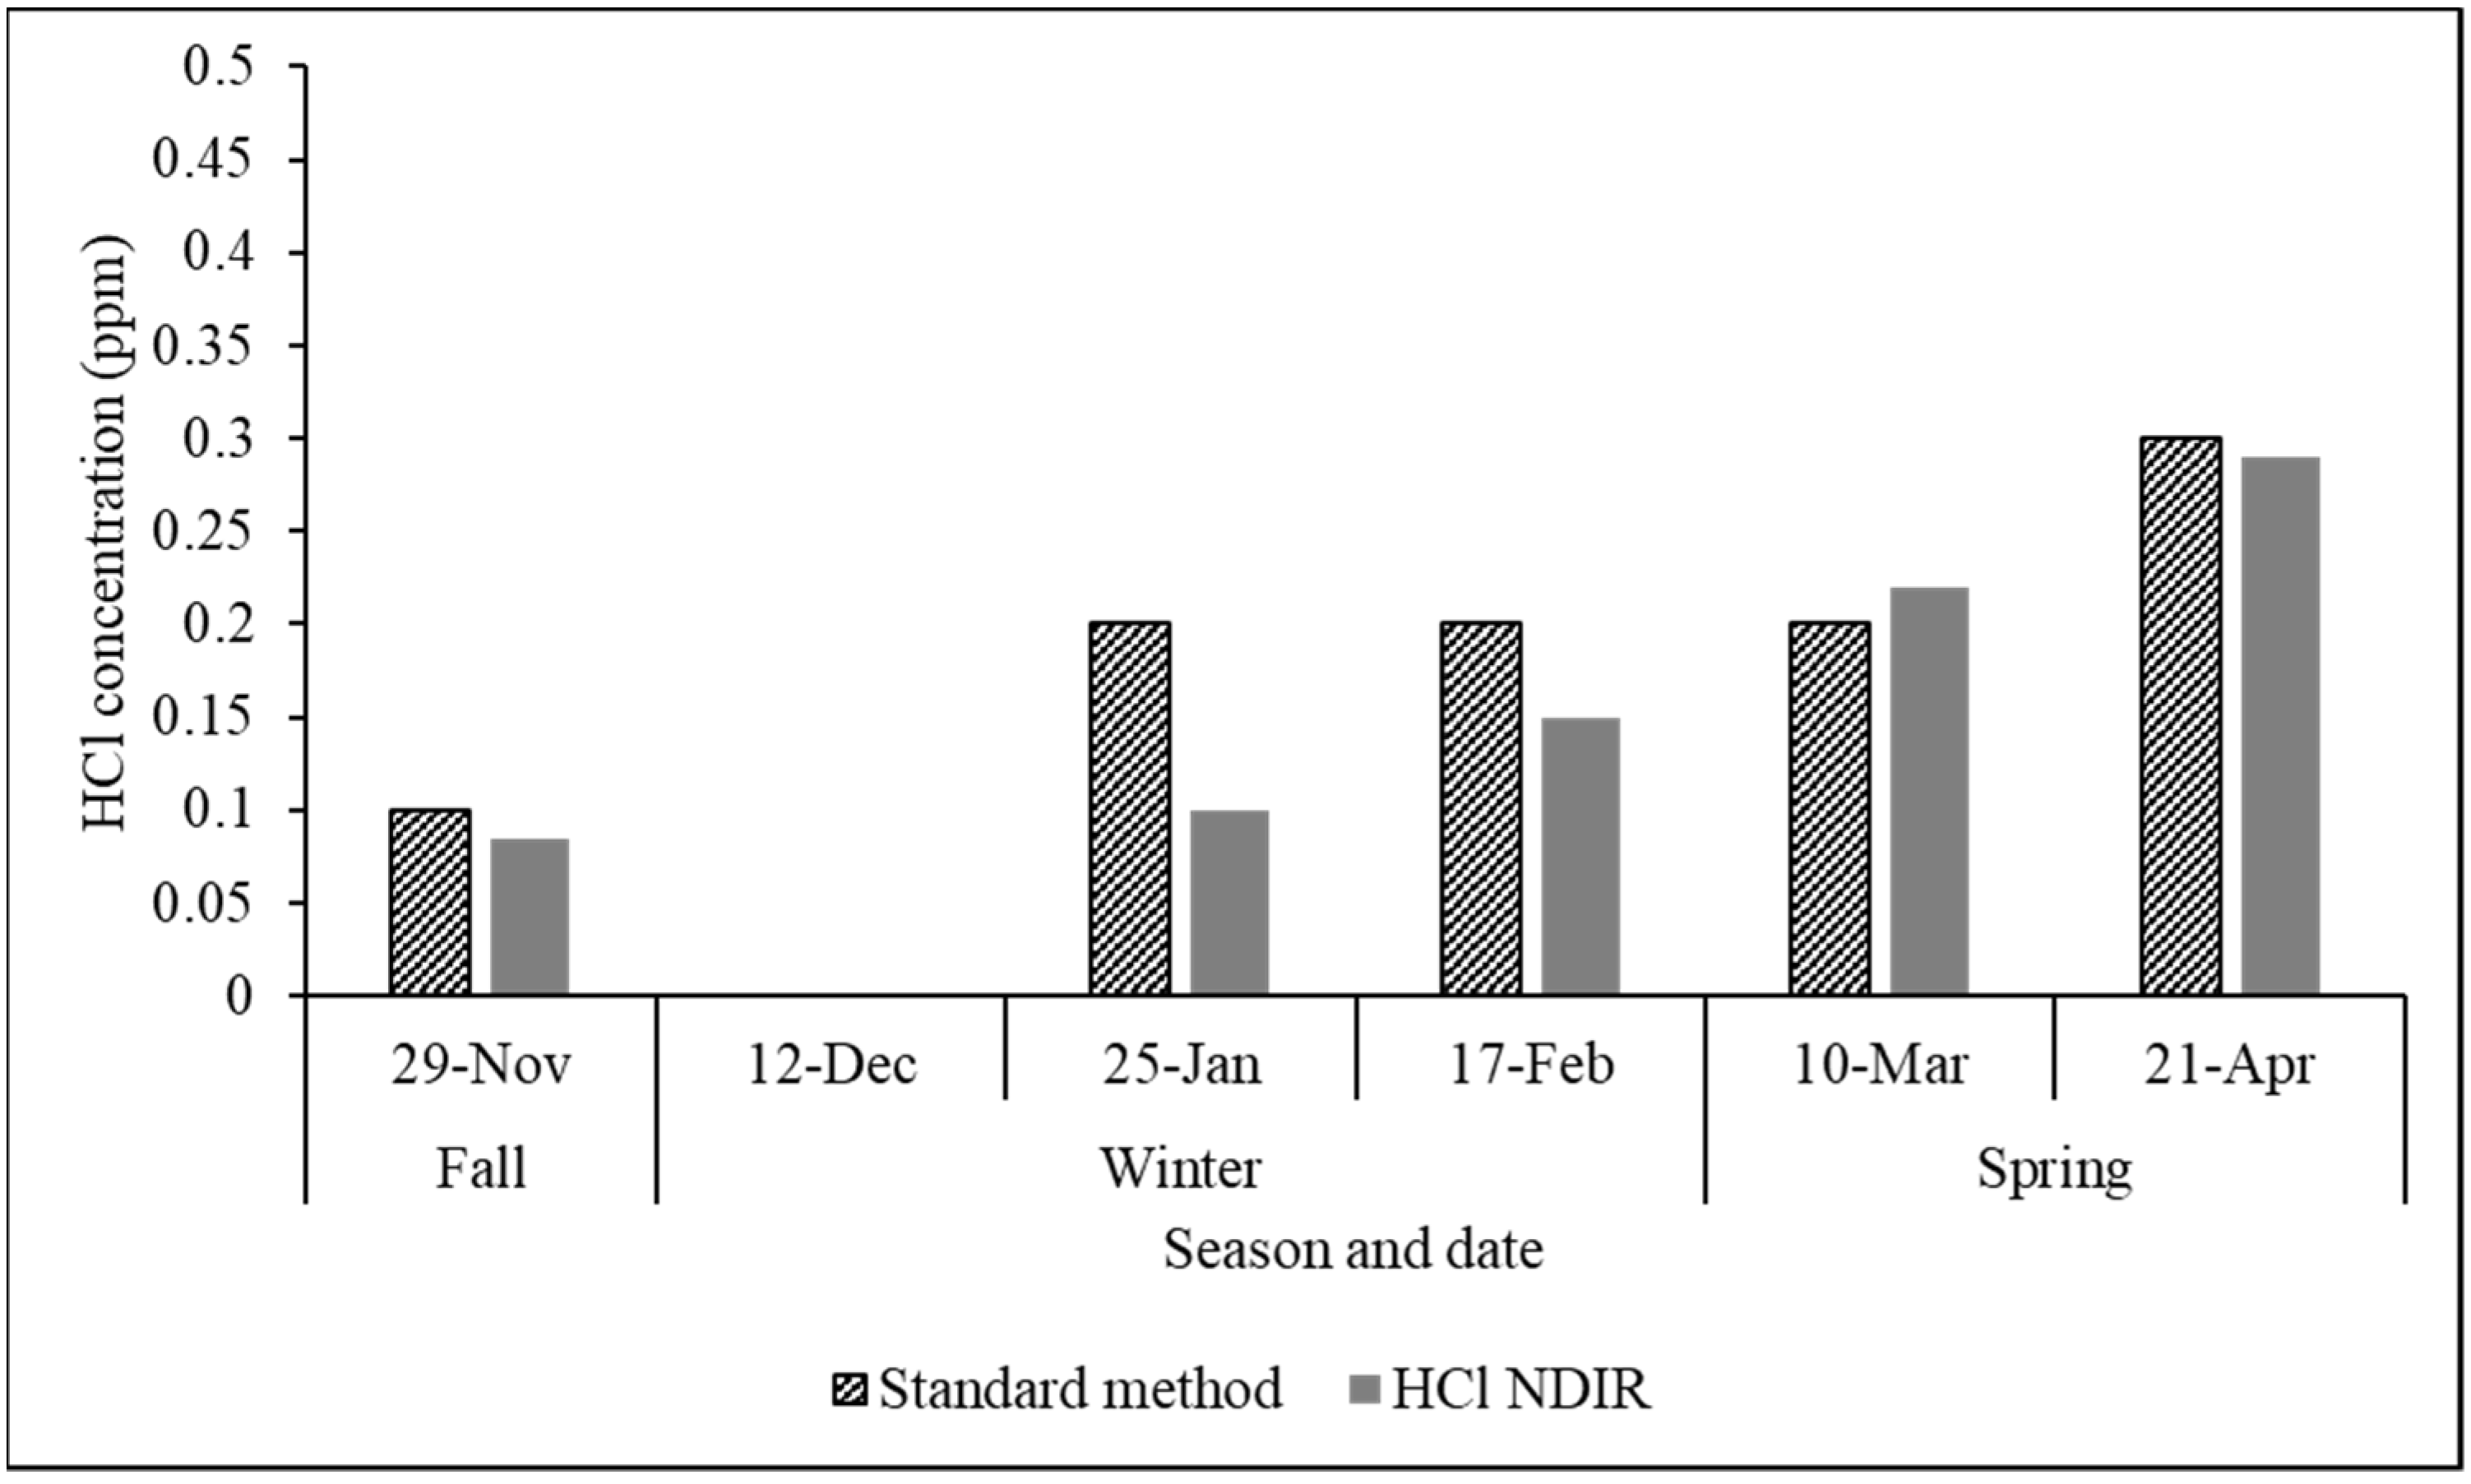
3.3. Long-Term Field Trials of the Proposed HCl NDIR Analyzer

3.3.1. Long-Term Field Trials of the Proposed Analyzer at a Metalworking Factory

For a year, the performance of the HCl NDIR analyzer was confirmed in the metalworking factory. Variations of HCl emitted from the factory stack are shown in Figure S1 (Supplementary Information). Since the metalworking factory was not a 24 h operation, it was demonstrated that the gas emission was not constant and changed depending on operating hours.
Random samples were taken each month and analyzed using the IC method to verify the NDIR performance in the field. Table 7 shows a comparison of the results of NDIR and ion chromatography methods.
As shown in Table 7, although RMSE values were lower than 1, MNE values were high in most cases. Moreover, most MNB values were negative. This suggests that the HCl concentrations measured by the HCl NDIR analyzer were relatively smaller than those using the IC method. This occurred because the HCl concentrations were less than one ppm and close to the detection limit of the NDIR analyzer of concern (i.e., 0.07 ppm). Therefore, a slight difference in concentration could also result in considerable bias based on MNE and MNB. However, the RPD based on the actual field performance considering the emission standard denoted the acceptable relative errors with all values < 6%. Note that the acceptable RPD is ≤20% [79]. Consequently, although the proposed HCl NDIR analyzer could not measure low HCl concentration perfectly at this factory based on uncertainty analysis, it was still acceptable as an analyzer for a CEMS based on the national standard in terms of cost-effectiveness.
An additional comparison was conducted using third-party inspection data. Since the factory does not have a CEMS for HCl, a standard measurement institute randomly conducted a monthly HCl inspection. Their measurement at that time was compared with the NDIR data, as depicted in Figure 11.
As shown in Figure 11, most HCl concentrations obtained from the NDIR analyzer were lower than those from the IC standard method. The RMSE values for spring, summer, fall, and winter were 0.14, 0.07, 0.32, and 0.37, respectively. The MNE values for spring, summer, fall, and winter were 15.4, 7.31, 36.1, and 47.6, respectively. Likewise, the MNB values were 4.11, 7.31, −36.1, and 47.6, respectively. This suggests that the performance of the NDIR analyzer in spring and summer was better than in fall and winter. Therefore, the performance of the analyzer might be affected by seasonal variations. The wide range of stack gas temperatures led to the variation of moisture content in the flue gas, which might explain this difference. This small humidity effect is negligible if the HCl concentration is relatively high compared to full-scale measurement. However, because the concentration of HCl was lower than 1 ppm, this slight bias could cause a significant difference between the NDIR analyzer and the IC standard method.

3.3.2. Long-Term Field Trials of the Proposed Analyzer at a Cement Factory

The variations of HCl concentrations emitted from a cement factory are presented in Figure S2 (Supplementary Information). Because the trial permission was for only 6 months, the four-season performance of the NDIR analyzer could not be conducted. Performance was assessed during a part of fall and spring and the whole winter. As shown in Figure S2, the HCl concentrations emitted from the cement factory exhibited a lower trend compared to the metalworking factory.
In contrast to the case of the metalworking factory, at the cement factory, the HCl concentrations obtained from the NDIR analyzer were higher than those obtained from the IC method based on MNB values (Table 8). Although the MNE values were high, indicating the high bias between the NDIR analyzer and the IC standard method, the RPD values, considering a significantly small concentration compared to the measurement range, were less than 10% for 6 months of field trials. Hence, the proposed HCl NDIR analyzer could also be applied in this kind of industry.
Figure 12 presents the HCl obtained from the NDIR analyzer and the standard method in comparison with third-party data using the IC standard method.
As shown in Figure 12, the HCl concentrations obtained from the NDIR analyzer were lower than those obtained using the IC method. The RMSE values in fall, winter, and spring were 0.02, 0.06, and 0.02, respectively. This suggests that the values measured by the two methods were close. In fall, winter, and spring, the MNE values were 15, 37.5, and 6.7%, respectively. The MNB values were −15, −37.5, and 3.3%, respectively. These results suggest that the effect of seasonal variations needed to be clarified in this case. This might be because the field trials were conducted for only 6 months. The stable temperature of the stack emission might also be a reason for the lower influence of the seasonal temperature.
Advancements in HCl analyzers for CEMS, aside from a few for ambient air measurement, have not been documented recently. Halfacre et al. (2023) developed a HCl-TILDAS using a 3 µm interband cascade laser for ambient air [63]. The analyzer path length was 204 m, and its detection limit was 0.5 ppt. The measurement range was 0~7 ppb. The response time of the analyzer was 4.4 s. The bias caused by humidity was −5.8% with a humidity range of 60~93% [63]. Since the HCl-TILDAS had a very long path length, its detection range was much better than the current HCl NDIR analyzer in this study. A cavity ring-down spectrometer (CRDS) was developed to measure total gas chlorine [64]. The furnace temperature of the CRDS was 825 °C to convert chlorinated compounds to HCl gas. The sampling flow rate was 2 L/min. Although this CRDS measures HCl, it was developed to measure chlorinated compounds. The measurement range of generated HCl from chlorinated compounds was 2 to approximately 500 ppb [64]. Hence, this analyzer also had a higher sensitivity than the proposed NDIR analyzer in the current study. However, in terms of the cost effectiveness of applying the analyzer for a CEMS to reduce investment costs, the proposed NDIR analyzer was used for measuring HCl emissions practically.

4. Conclusions

A cost-effective NDIR analyzer for measuring HCl emitted from stationary sources was developed in this study. To enhance its performance, a zero-drift mitigation method, an optimal path length, and a negligible-interference bandpass filter were applied. Long-term field trials at a metalworking factory and a cement factory were conducted to evaluate the performance of the analyzer in real-world conditions. Furthermore, uncertainty and bias analyses were performed to compare the measurement results of the NDIR analyzer with those obtained using the IC standard method. It was found that a negligible-interference bandpass filter at 3.6 µm could mitigate the interference effects of humidity and other gases. The optimal path length for a measurement range of 0~50 ppm was determined to be 10 m. Regarding laboratory inspection, the zero and span drift were both less than 1%. The limit of detection, reproductivity, and linearity of the analyzer were 0.07 ppm, 0.26%, and 0.96%, respectively. These specifications are comparable to those of other commercial HCl analyzers. In field trials, although the concentrations of HCl emitted from metalworking and cement factories were low, the HCl NDIR analyzer achieved a relative error of less than 6% for the metalworking factory and 10% for the cement factory. However, MNE and MNB were high due to the HCl concentration being below 1 ppm. Seasonal effects were observed when the temperature of the emission stack varied significantly across the seasons. Although MNE and MNB suggested a high bias in the NDIR analyzer’s measurements, this deviation was deemed acceptable, considering emission standards and cost-effectiveness, especially since the measured HCl concentrations during testing were below 1 ppm. Consequently, the proposed HCl NDIR analyzer shows potential for application in CEMS at metalworking and cement factories. The current study’s limitation was the HCl’s low emission range during field trials, despite the analyzer’s measurement range being 0~50 ppm. Future studies should focus on testing the analyzer at higher HCl emission levels and developing a lower measurement range for the analyzer to enhance its versatility.

Supplementary Materials

The following supporting information can be downloaded at: https://www.mdpi.com/article/10.3390/chemosensors12120262/s1, Figure S1. Seasonal data of the HCl NDIR analyzer installed in the metalworking factory. Figure S2. Seasonal data of the HCl NDIR analyzer installed in a cement factory: (a) fall, (b–d) winter, and (e–f) spring.

Author Contributions

Conceptualization: T.-V.D. and J.-C.K. (Jo-Chun Kim); data acquisition: I.-Y.C. and B.-C.C.; data analysis: D.-H.B. and J.-C.K. (Jong-Choon Kim); visualization: I.-Y.C. and D.-H.B.; resources: B.-C.C.; data interpretation: J.-C.K. (Jong-Choon Kim); writing—original draft preparation: B.-G.P. and S.-W.L.; writing—review and editing: T.-V.D. and J.-C.K. (Jo-Chun Kim). All authors have read and agreed to the published version of the manuscript.

Funding

This research received no funding.

Institutional Review Board Statement

Not applicable.

Informed Consent Statement

Not applicable.

Data Availability Statement

The data are contained within the article. More detailed data are available from the corresponding authors upon reasonable request.

Acknowledgments

This work was supported by the Korea Environment Industry & Technology Institute (KEITI) through the R&D Project for Management of Atmosphere Environment Project, funded by the Korea Ministry of Environment (MOE) (2050000167).

Conflicts of Interest

Author Byung-Chan Cho was employed by the company Senko Co., Ltd. The remaining authors declare that the research was conducted in the absence of any commercial or financial relationships that could be construed as a potential conflict of interest.

References

  1. US National Library of Medicine. Hydrochloric Acid. Available online: https://pubchem.ncbi.nlm.nih.gov/compound/Hydrochloric-acid (accessed on 16 November 2023).
  2. Pohanish, R.P. Sittig’s Handbook of Toxic and Hazardous Chemicals and Carcinogens; William Andrew: Norwich, NY, USA, 2017; ISBN 978-0-323-38968-6. [Google Scholar]
  3. Fu, X.; Wang, T.; Wang, S.; Zhang, L.; Cai, S.; Xing, J.; Hao, J. Anthropogenic Emissions of Hydrogen Chloride and Fine Particulate Chloride in China. Environ. Sci. Technol. 2018, 52, 1644–1654. [Google Scholar] [CrossRef] [PubMed]
  4. Gil, H.N.; Dinh, T.V.; Lee, J.H.; Park, B.G.; Choi, I.Y.; Lee, S.W.; Kim, I.Y.; Kim, J.C. Effects of Humidity Pretreatment Devices on the Loss of Hcl Gas Emitted from Industrial Stacks. Atmosphere 2022, 13, 33. [Google Scholar] [CrossRef]
  5. Ren, X.; Sun, R.; Chi, H.H.; Meng, X.; Li, Y.; Levendis, Y.A. Hydrogen Chloride Emissions from Combustion of Raw and Torrefied Biomass. Fuel 2017, 200, 37–46. [Google Scholar] [CrossRef]
  6. Rokni, E.; Ren, X.; Panahi, A.; Levendis, Y.A. Emissions of SO2, NOx, CO2, and HCl from Co-Firing of Coals with Raw and Torrefied Biomass Fuels. Fuel 2018, 211, 363–374. [Google Scholar] [CrossRef]
  7. Crisp, T.A.; Lerner, B.M.; Williams, E.J.; Quinn, P.K.; Bates, T.S.; Bertram, T.H. Observations of Gas Phase Hydrochloric Acid in the Polluted Marine Boundary Layer. J. Geophys. Res. 2014, 119, 6897–6915. [Google Scholar] [CrossRef]
  8. Zhang, B.; Shen, H.; Yun, X.; Zhong, Q.; Henderson, B.H.; Wang, X.; Shi, L.; Gunthe, S.S.; Huey, L.G.; Tao, S.; et al. Global Emissions of Hydrogen Chloride and Particulate Chloride from Continental Sources. Environ. Sci. Technol. 2022, 56, 3894–3904. [Google Scholar] [CrossRef] [PubMed]
  9. Dene, C.; Pisano, J.T.; Durbin, T.D.; Bumiller, K.; Crabbe, K.; Muzio, L.J. Laboratory Testing of a Continuous Emissions Monitor for Hydrochloric Acid. J. Air Waste Manag. Assoc. 2014, 64, 670–678. [Google Scholar] [CrossRef] [PubMed]
  10. Mackay, K.L.; Chanda, A.; Mackay, G.; Pisano, J.T.; Durbin, T.D.; Crabbe, K.; Smith, T. Measurement of Hydrogen Chloride in Coal-Fired Power Plant Emissions Using Tunable Diode Laser Spectrometry. J. Appl. Spectrosc. 2016, 83, 627–633. [Google Scholar] [CrossRef]
  11. Zhang, X.; Schreifels, J. Continuous Emission Monitoring Systems at Power Plants in China: Improving SO2 Emission Measurement. Energy Policy 2011, 39, 7432–7438. [Google Scholar] [CrossRef]
  12. Ahmed, N.N.; Kale, G.M.; Kumar, R.V.; Fray, D.J. Development and Testing of HCl Gas Sensor for Flue Gas Monitoring. Solid State Ion. 1996, 86–88, 1013–1016. [Google Scholar] [CrossRef]
  13. Dene, C.E.; Pisano, J.T.; Durbin, T.D.; Bumiller, K.; Crabbe, K.; Muzio, L.J. Laboratory Investigation of Three Distinct Emissions Monitors for Hydrochloric Acid. J. Air Waste Manag. Assoc. 2016, 66, 1191–1201. [Google Scholar] [CrossRef]
  14. Kim, J.G.; Bai, B.C. A Chemical Safety Assessment of Lyocell-Based Activated Carbon Fiber with a High Surface Area through the Evaluation of HCl Gas Adsorption and Electrochemical Properties. Separations 2024, 11, 79. [Google Scholar] [CrossRef]
  15. Bandgar, S.S.; Hingangavkar, G.M.; Kore, E.K.; Selvaraj, M.; Mulik, R.N.; Patil, V.B. Excellence Evaluation of Samarium Doped Mn-Zn Ferrite Nanocrystals for Room Temperature HCl Detection. Mater. Chem. Phys. 2024, 314, 128861. [Google Scholar] [CrossRef]
  16. Oh, H.J.; Park, Y.K.; Bae, J.H.; Lim, J.; Lee, S.J.; Kim, D.-k.; Jang, S.J.; Yeang, B.J.; Lee, H.D.; Lim, S.J.; et al. Durable and Washable Sheath/Core-Type Polyamide 6-RhYK/PP Colorimetric Bicomponent Fiber as Reversible Hydrogen Chloride (HCl) Gas Sensor. Sens. Actuators B Chem. 2024, 407, 135455. [Google Scholar] [CrossRef]
  17. Shokr, E.K.; Elkot, S.A.; Kamel, M.S.; Ali, H.M. Sol-Gel Spin-Coated V2O3 Thin Films for Optical HCl and Iodine Gas Sensing. Opt. Mater. 2024, 151, 115263. [Google Scholar] [CrossRef]
  18. Markina, D.I.; Anoshkin, S.S.; Masharin, M.A.; Khubezhov, S.A.; Tzibizov, I.; Dolgintsev, D.; Terterov, I.N.; Makarov, S.V.; Pushkarev, A.P. Perovskite Nanowire Laser for Hydrogen Chloride Gas Sensing. ACS Nano 2023, 17, 1570–1582. [Google Scholar] [CrossRef] [PubMed]
  19. Gleissner, C.; Mayer, P.; Bechtold, T.; Pham, T. Multifunctional Polypyrrole-Based Textile Sensors for Integration into Personal Protection Equipment. Sensors 2024, 24, 1387. [Google Scholar] [CrossRef] [PubMed]
  20. Tang, H.; Xiang, Y.; Zhan, H.; Zhou, Y.; Kang, J. DFT Investigation of Transition Metal-Doped Graphene for the Adsorption of HCl Gas. Diam. Relat. Mater. 2023, 136, 109995. [Google Scholar] [CrossRef]
  21. Huo, R.; Zeng, G.; Wang, C.; Wang, Y.F.; Xing, Y.H.; Bai, F.Y. Smart Stimulation Response of a Pyrene-Based Lanthanide(III) MOF: Fluorescence Enhancement to HX (F and Cl) or R-COOH and Artificial Applicable Film on HCl Vapor Sensing. ACS Appl. Mater. Interfaces 2023, 15, 50275–50289. [Google Scholar] [CrossRef]
  22. Wang, Y.; Gao, Y.; Wang, Z.; Yan, J.; Chen, Y. Ultra-Trace Chlorinated Gases Optical Sensor with Moisture-Resistant Based on Structural-Customizable UiO-66 3D Photonic Crystals. Sens. Actuators B Chem. 2023, 393, 134219. [Google Scholar] [CrossRef]
  23. Qiao, S.; Sampaolo, A.; Patimisco, P.; Spagnolo, V.; Ma, Y. Ultra-Highly Sensitive HCl-LITES Sensor Based on a Low-Frequency Quartz Tuning Fork and a Fiber-Coupled Multi-Pass Cell. Photoacoustics 2022, 27, 100381. [Google Scholar] [CrossRef]
  24. Li, M.; Tang, J.; Luo, Y.; Yang, J.; Liu, J.; Peng, J.; Fang, Y. Imine Bond-Based Fluorescent Nanofilms toward High-Performance Detection and Efficient Removal of HCl and NH3. Anal. Chem. 2023, 95, 2094–2101. [Google Scholar] [CrossRef] [PubMed]
  25. Kumar, S.; Tripathy, S.; Jyoti, A.; Singh, S.G. Recent Advances in Biosensors for Diagnosis and Detection of Sepsis: A Comprehensive Review. Biosens. Bioelectron. 2019, 124–125, 205–215. [Google Scholar] [CrossRef]
  26. Owojaiye, G.; Sun, Y. Focal Design Issues Affecting the Deployment of Wireless Sensor Networks for Pipeline Monitoring. Ad Hoc Netw. 2013, 11, 1237–1253. [Google Scholar] [CrossRef]
  27. Goodfellow, H.D.; Wang, Y. Industrial Ventilation Design Guidebook; Academic Press: Cambridge, MA, USA, 2021; ISBN 978-0-12-816673-4. [Google Scholar]
  28. Li, K.; Wang, B.; Yuan, M.; Yang, Z.; Yu, C.; Zheng, W. CO Detection System Based on TDLAS Using a 4.625 Μm Interband Cascaded Laser. Int. J. Environ. Res. Public Health 2022, 19, 12828. [Google Scholar] [CrossRef]
  29. Weng, W.; Larsson, J.; Bood, J.; Aldén, M.; Li, Z. Quantitative Hydrogen Chloride Detection in Combustion Environments Using Tunable Diode Laser Absorption Spectroscopy with Comprehensive Investigation of Hot Water Interference. Appl. Spectrosc. 2022, 76, 207–215. [Google Scholar] [CrossRef] [PubMed]
  30. Zhu, X.; Yao, S.; Ren, W.; Lu, Z.; Li, Z. TDLAS Monitoring of Carbon Dioxide with Temperature Compensation in Power Plant Exhausts. Appl. Sci. 2019, 9, 442. [Google Scholar] [CrossRef]
  31. Dello Russo, S.; Zifarelli, A.; Sampaolo, A.; Giglio, M.; Wei, T.; Wu, H.; Dong, L.; Patimisco, P.; Tittel, F.K.; Spagnolo, V. Quartz Tuning Forks Employed as Photodetectors in TDLAS Sensors. In Proceedings of the Photonic Instrumentation Engineering VIII, Online, 6–11 March 2021; Soskind, Y., Busse, L.E., Eds.; SPIE: Bellingham, WA, USA, 2021; p. 17. [Google Scholar]
  32. Dinh, T.V.; Lee, J.Y.; Ahn, J.W.; Kim, J.C. Development of a Wide-Range Non-Dispersive Infrared Analyzer for the Continuous Measurement of CO2 in Indoor Environments. Atmosphere 2020, 11, 1024. [Google Scholar] [CrossRef]
  33. Institute Of Clean Air Companies. White Paper: Monitoring of Hcl; Institute of Clean Air Companies, Inc.: Washington, DC, USA, 2013. [Google Scholar]
  34. Singh, M.K.; Singh, A. Characterization of Polymers and Fibres; Elsevier: Amsterdam, The Netherlands, 2022; ISBN 9780128239865. [Google Scholar]
  35. Mohamed, M.A.; Jaafar, J.; Ismail, A.F.; Othman, M.H.D.; Rahman, M.A. Fourier Transform Infrared (FTIR) Spectroscopy. In Membrane Characterization; Elsevier: Amsterdam, The Netherlands, 2017; pp. 3–29. [Google Scholar]
  36. Bacsik, Z.; Mink, J.; Keresztury, G. FTIR Spectroscopy of the Atmosphere. I. Principles and Methods. Appl. Spectrosc. Rev. 2004, 39, 295–363. [Google Scholar] [CrossRef]
  37. Griffiths, P.R.; de Haseth, J.A. Fourier Transform Infrared Spectrometry; Wiley: Hoboken, NJ, USA, 2007; ISBN 9780471194040. [Google Scholar]
  38. Nguyen, T. Applications of Fourier Transform Infrared Spectroscopy in Surface and Interface Studies. Prog. Org. Coat. 1985, 13, 1–34. [Google Scholar] [CrossRef]
  39. El Fels, L.; Zamama, M.; Hafidi, M. Advantages and Limitations of Using FTIR Spectroscopy for Assessing the Maturity of Sewage Sludge and Olive Oil Waste Co-Composts. In Biodegradation and Bioremediation of Polluted Systems—New Advances and Technologies; InTech: London, UK, 2015. [Google Scholar]
  40. Movasaghi, Z.; Rehman, S.; Rehman, I.U. Fourier Transform Infrared (FTIR) Spectroscopy of Biological Tissues. Appl. Spectrosc. Rev. 2008, 43, 134–179. [Google Scholar] [CrossRef]
  41. Liang, J.G.; Jiang, Y.; Wu, J.K.; Wang, C.; von Gratowski, S.; Gu, X.; Pan, L. Multiplex-Gas Detection Based on Non-Dispersive Infrared Technique: A Review. Sens. Actuators A Phys. 2023, 356, 114318. [Google Scholar] [CrossRef]
  42. Zhao, Y.; Zhang, C.; Ci, G.; Zhao, X.; Lv, J.; Liang, J.; Ming, A.; Wei, F.; Mao, C. Development of High-Precision NO2 Gas Sensor Based on Non-Dispersive Infrared Technology. Sensors 2024, 24, 4146. [Google Scholar] [CrossRef] [PubMed]
  43. Jha, R.K. Non-Dispersive Infrared Gas Sensing Technology: A Review. IEEE Sens. J. 2022, 22, 6–15. [Google Scholar] [CrossRef]
  44. Xu, M.; Peng, B.; Zhu, X.; Guo, Y. Multi-Gas Detection System Based on Non-Dispersive Infrared (NDIR) Spectral Technology. Sensors 2022, 22, 836. [Google Scholar] [CrossRef] [PubMed]
  45. Xu, M.; Tian, W.; Lin, Y.; Xu, Y.; Tao, J. Development of a Compact NDIR CO2 Gas Sensor for a Portable Gas Analyzer. Micromachines 2024, 15, 1203. [Google Scholar] [CrossRef]
  46. Yu, K.; Yang, X.; Wang, Y.; Zhang, P.; Zhang, L.; Tan, Q. A Temperature-Compensated CO2 Detection System Based on Non-Dispersive Infrared Spectral Technology. Rev. Sci. Instrum. 2024, 95, 085002. [Google Scholar] [CrossRef]
  47. Su, M.; Chen, Y.; Li, Q.; Wei, Y.; Liu, J.; Chang, Z.; Liu, X.; Zhang, A. Temperature Compensation Model for Non-Dispersive Infrared CO2 Gas Sensor Based on WOA-BP Algorithm. Front. Energy Res. 2024, 12, 1407630. [Google Scholar] [CrossRef]
  48. Sun, M.; Zhang, S.; Wu, D.; Han, Z. Highly-Efficient Gas Sensing Using Dielectric-Based Narrow-Band Thermal Emitters Operating in the Mid-Infrared. Infrared Phys. Technol. 2024, 137, 105132. [Google Scholar] [CrossRef]
  49. Shi, J.; Jiang, Y.; Duan, Z.; Li, J.; Yuan, Z.; Tai, H. Designing an Optical Gas Chamber with Stepped Structure for Non-Dispersive Infrared Methane Gas Sensor. Sens. Actuators A Phys. 2024, 367, 115052. [Google Scholar] [CrossRef]
  50. Liang, J.; Wang, L.; Wu, L.; Zhang, J.; Wang, Z.; Zhang, T.; Zhang, Y.; Li, G. Non-Dispersive Infrared SF6 Sensor with Temperature Compensation Using ISSA_BP Neural Network. Sens. Actuators A Phys. 2024, 373, 115434. [Google Scholar] [CrossRef]
  51. Han, Y.; Zhao, Y.; Ming, A.; Fang, Y.; Fang, S.; Bi, S.; Chen, J.; Xu, R.; Wei, F.; Mao, C. Application of an NDIR Sensor System Developed for Early Thermal Runaway Warning of Automotive Batteries. Energies 2023, 16, 3620. [Google Scholar] [CrossRef]
  52. ES 01906.1; HCl-Automated Measuring Method in Stack. National Institute of Environmental Research. Available online: https://www.law.go.kr/LSW//flDownload.do?flSeq=141390927 (accessed on 4 December 2024).
  53. Korea Ministry of Environment. Enforcement Decree of the Special Act on the Improvement of Air Environment in Air Management Areas. Available online: https://www.law.go.kr/LSW//lsInfoP.do?lsId=013722&ancYnChk=0#0000 (accessed on 4 December 2024).
  54. United States Environmental Protection Agency. Performance Specification 18-Performance Specifications and Test Procedures For Gaseous Hydrogen Chloride (Hci) Continuous Emission Monitoring Systems at Stationary Sources. Available online: https://www.epa.gov/emc/performance-specification-18-gaseous-hydrogen-chloride (accessed on 4 December 2024).
  55. ISO 10849:2022; International Organization for Standardization. Available online: https://www.iso.org/standard/79892.html?browse=ics (accessed on 4 December 2024).
  56. ISO 7935:2024; International Organization for Standardization. Available online: https://www.iso.org/standard/83052.html?browse=ics (accessed on 4 December 2024).
  57. Dinh, T.V.; Choi, I.Y.; Park, B.G.; Lee, J.H.; Kim, I.Y.; Gil, H.N.; Lee, S.W.; Kim, J.C. Development of a Negligible Zero-Drift Ndir Analyzer for Measuring Nh3 Emitted from an Urban Household Solid Waste Incinerator. Atmosphere 2021, 12, 858. [Google Scholar] [CrossRef]
  58. Martinez-Anton, J.C.; Silva-Lopez, M. Improvements in NDIR Gas Detection within the Same Optical Chamber. In Proceedings of the Optical Design and Engineering IV, Marseille, France, 6–8 September 2011; SPIE: Bellingham, WA, USA, 2011; Volume 8167, p. 816723. [Google Scholar]
  59. Dinh, T.V.; Ahn, J.W.; Choi, I.Y.; Song, K.Y.; Chung, C.H.; Kim, J.C. Limitations of Gas Filter Correlation: A Case Study on Carbon Monoxide Non-Dispersive Infrared Analyzer. Sens. Actuators B Chem. 2017, 243, 684–689. [Google Scholar] [CrossRef]
  60. Dinh, T.V.; Choi, I.Y.; Son, Y.S.; Kim, J.C. A Review on Non-Dispersive Infrared Gas Sensors: Improvement of Sensor Detection Limit and Interference Correction. Sens. Actuators B Chem. 2016, 231, 529–538. [Google Scholar] [CrossRef]
  61. Besson, J.P.; Schilt, S.; Thévenaz, L. Sub-Ppm Multi-Gas Photoacoustic Sensor. Spectrochim. Acta Part A Mol. Biomol. Spectrosc. 2006, 63, 899–904. [Google Scholar] [CrossRef]
  62. Bednyakova, A.; Erushin, E.; Miroshnichenko, I.; Kostyukova, N.; Boyko, A.; Redyuk, A. Enhancing Long-Term Stability of Photoacoustic Gas Sensor Using an Extremum-Seeking Control Algorithm. Infrared Phys. Technol. 2023, 133, 104821. [Google Scholar] [CrossRef]
  63. Halfacre, J.W.; Stewart, J.; Herndon, S.C.; Roscioli, J.R.; Dyroff, C.; Yacovitch, T.I.; Flynn, M.; Andrews, S.J.; Brown, S.S.; Veres, P.R.; et al. Using Tunable Infrared Laser Direct Absorption Spectroscopy for Ambient Hydrogen Chloride Detection: HCl-TILDAS. Atmos. Meas. Tech. 2023, 16, 1407–1429. [Google Scholar] [CrossRef]
  64. Furlani, T.C.; Ye, R.X.; Stewart, J.; Crilley, L.R.; Edwards, P.M.; Kahan, T.F.; Young, C.J. Development and Validation of a New in Situ Technique to Measure Total Gaseous Chlorine in Air. Atmos. Meas. Tech. 2023, 16, 181–193. [Google Scholar] [CrossRef]
  65. Harvard-Smithsonian Center for Astrophysics. The HITRAN Database. Available online: https://hitran.org/ (accessed on 30 April 2024).
  66. Deckwer, W.-D. On The Mechanism Of Heat Transfer In Bubble Column Reactors. Chem. Eng. Sci. 1980, 35, 1341–1346. [Google Scholar] [CrossRef]
  67. Dinh, T.V.; Ahn, J.W.; Choi, I.Y.; Kim, J.C. A Novel Bandpass Filter for the Analysis of Carbon Monoxide Using a Non-Dispersive Infrared Technique. Atmosphere 2018, 9, 495. [Google Scholar] [CrossRef]
  68. Massart, D.L.; Dijkstra, A. Leonard Kaufman Evaluation and Optimization of Laboratory Methods and Analytical Procedures, 1st ed.; Elsevier: Amsterdam, The Netherlands, 1978; Volume 1, ISBN 978-0-444-41743-5. [Google Scholar]
  69. Wong, J.Y.; Schell, M. Zero Drift NDIR Gas Sensors. Sens. Rev. 2011, 31, 70–77. [Google Scholar] [CrossRef]
  70. Dinh, T.V.; Kim, D.J.; Ahn, J.W.; Choi, I.Y.; Lee, J.Y.; Son, Y.S.; Kim, J.C. A Potential Approach to Compensate the Gas Interference for the Analysis of NO by a Non-Dispersive Infrared Technique. Anal. Chem. 2020, 92, 12152–12159. [Google Scholar] [CrossRef] [PubMed]
  71. Korea Environment Corporation. CleanSYS. Available online: https://cleansys.or.kr/index.do (accessed on 21 October 2024).
  72. James, A. Jahnke Continuous Emission Monitoring, 3rd ed.; John Wiley & Sons Inc.: Hoboken, NJ, USA, 2022; ISBN 978-1-119-43402-3. [Google Scholar]
  73. Dinh, T.V.; Kim, J.C. Moisture Removal Techniques for a Continuous Emission Monitoring System: A Review. Atmosphere 2021, 12, 61. [Google Scholar] [CrossRef]
  74. ES 01305.1e; Hydrogen Chloride in Flue Gas—Ion Chromatography. National Institute of Environmental Research. Available online: https://www.law.go.kr/LSW//flDownload.do?flSeq=141390927 (accessed on 21 October 2024).
  75. ES 01902.1a; Installation Method of Automated Measuring Instrument. National Institute of Environmental Research. Available online: https://www.law.go.kr/LSW//flDownload.do?flSeq=141390927 (accessed on 21 October 2024).
  76. ES 01114.c; Methods for Sampling of Flue Gas. National Institute of Environmental Research. Available online: https://www.law.go.kr/LSW//flDownload.do?flSeq=141390927 (accessed on 21 October 2024).
  77. Kang, Y.; Aye, L.; Ngo, T.D.; Zhou, J. Performance Evaluation of Low-Cost Air Quality Sensors: A Review. Sci. Total Environ. 2022, 818, 151769. [Google Scholar] [CrossRef] [PubMed]
  78. Giordano, M.R.; Malings, C.; Pandis, S.N.; Presto, A.A.; McNeill, V.F.; Westervelt, D.M.; Beekmann, M.; Subramanian, R. From Low-Cost Sensors to High-Quality Data: A Summary of Challenges and Best Practices for Effectively Calibrating Low-Cost Particulate Matter Mass Sensors. J. Aerosol. Sci. 2021, 158, 105833. [Google Scholar] [CrossRef]
  79. National Institute of Environmental Research. Public Notice on Type Approval, Quality Inspection, Etc. of Environmental Measuring Devices. Available online: https://www.law.go.kr/LSW//flDownload.do?flSeq=135645335 (accessed on 7 November 2024).
  80. Ning, H.; Tang, R.; Li, C.; Gu, X.; Gong, Z.; Zhu, C.; Li, J.; Wang, K.; Yu, J. Recent advances in process and materials for dry desulfurization of industrial flue gas: An overview. Sep. Purif. Technol. 2025, 353, 128425. [Google Scholar] [CrossRef]
  81. Sun, Y.W.; Liu, C.; Chan, K.L.; Xie, P.H.; Liu, W.Q.; Zeng, Y.; Wang, S.M.; Huang, S.H.; Chen, J.; Wang, Y.P.; et al. Stack Emission Monitoring Using Non-Dispersive Infrared Spectroscopy with an Optimized Nonlinear Absorption Cross Interference Correction Algorithm. Atmos. Meas. Tech. 2013, 6, 1993–2005. [Google Scholar] [CrossRef]
  82. S.FAC, Inc. TMS300-FTIR. Available online: https://www.s-fac.co.kr/kr/product/product_view.php?idx=40 (accessed on 9 November 2024).
  83. ENVEA. MIR-9000. Available online: https://www.envea.global/s/process/gas-monitors-p/ch4/mir-9000/ (accessed on 9 November 2024).
  84. Gasmet. CX4000. Available online: https://www.gasmet.com/products/category/emission-monitoring-systems/cx4000/ (accessed on 9 November 2024).
  85. Thermo. Fisher Scientific 15i. Available online: https://www.thermofisher.com/order/catalog/product/15I (accessed on 9 November 2024).
  86. Protea Ltd. AtmofFIR CEM. Available online: https://www.protea.ltd.uk/atmosfir (accessed on 9 November 2024).
  87. EcoChem. MCS. Available online: https://www.ecochem.biz/products/stack-monitoring-systems/mc3-based-cems/ (accessed on 9 November 2024).
  88. Sick. MCS200HW. Available online: https://www.sick.com/kr/ko/catalog/products/analyzers/gas-analyzers/mcs200hw/system-mcs200hw/p/p679083 (accessed on 9 November 2024).
  89. HORIBA. TX-100. Available online: https://www.horiba.com/kor/process-and-environmental/products/detail/action/show/Product/%EA%B0%80%EB%B3%80-%EB%A0%88%EC%9D%B4%EC%A0%80-%EA%B0%80%EC%8A%A4-%EB%B6%84%EC%84%9D%EA%B8%B0-tx-100-142/ (accessed on 9 November 2024).
  90. Neo Monitors. LaserGasTM II SP. Available online: https://neomonitors.com/product/lasergas-sp/ (accessed on 9 November 2024).
  91. ENVEA. LAS 5000XD. Available online: https://www.envea.global/s/process/gas-monitors-p/co/las-5000xd/ (accessed on 9 November 2024).
  92. METTLER TOLEDO. GPro 500. Available online: https://www.mt.com/in/en/home/products/Process-Analytics/gas-analyzer/Tunable-Diode-Laser-TDL/hydrogen-chloride-GPro-500.html (accessed on 9 November 2024).
Figure 1. General schematic design of HCl NDIR analyzer in the current study.
Chemosensors 12 00262 g001
Figure 2. Infrared absorption ratio of HCl, H2O, SO2, CO2, and NO gases evaluated based on HITRAN database.
Chemosensors 12 00262 g002
Figure 3. A schematic diagram (a) and a real photo (b) of the experimental setup for investigating the interference effect of HCl BPF.
Chemosensors 12 00262 g003
Figure 4. A schematic diagram (a) and a real photo (b) of experimental setup for the real stationary source and CEMS installation.
Chemosensors 12 00262 g004
Figure 5. Effects of interference gases: (a) NO, (b) NO2, (c) SO2, (d) CO, (e) CO2, and (f) H2O on commercial HCl BPF (CWL: 3.55 μm).
Chemosensors 12 00262 g005
Figure 6. Effects of interference gases: (a) NO, (b) NO2, (c) SO2, (d) CO, (e) CO2, and (f) H2O on commercial HCl BPF (CWL: 3.6 μm).
Chemosensors 12 00262 g006
Figure 7. 14-day zero drift of HCl analyzer with (a) reference BPF and (b) HCl GFC coupled with HCl BPF.
Chemosensors 12 00262 g007
Figure 8. HCl NDIR calibration curve (triplicated repeat) with (a) reference BPF and (b) HCl GFC coupled with HCl BPF.
Chemosensors 12 00262 g008
Figure 9. Variations in the analyzer signals associated with path length and HCl concentration: (a) 6 m, (b) 10 m, and (c) 12 m (black dashed line is quadratic a regression curve and grey dashed line is a linear regression curve).
Chemosensors 12 00262 g009
Figure 10. Performance of the proposed HCl NDIR analyzer: (a) 2 h zero drift, (b) 2 h span drift, (c) 24 h zero drift, (d) 24 h span drift, (e) reproductivity, and (f) linearity.
Chemosensors 12 00262 g010
Figure 11. Comparison of 30 min average HCl concentrations measured by the proposed HCl NDIR analyzer and the IC standard method in a metalworking factory.
Chemosensors 12 00262 g011
Figure 12. Comparison of 30 min average HCl concentrations measured by the proposed HCl NDIR analyzer and the IC standard method in a cement factory.
Chemosensors 12 00262 g012
Table 1. Summary of recent developments in HCl sensors.
No.TechniqueOperating RangeLimit of
Detection
ApplicationRef.
1Electrochemical sensor: lyocell-based activated carbon fibers with a high surface area for electrochemical detector0~20 ppm-Environmental and industrial gas management[14]
2Optical sensor: colorimetric sheath/core-type polyamide 6 (PA6)-RhYK/polypropylene bicomponent fiber1~100 ppm1 ppmIndustrial sites and daily life[16]
3Optical sensor: samarium-doped Smx: Mn0.8Zn0.2Fe2-xO4 (SMZFO)
(x = 0.0–0.1) nanocrystals
10~100 ppm10 ppmWorkplace safety[15]
4Optical sensor: sol–gel spin-coated V2O3 thin films0~32 ppm-Workplace safety[17]
5Optical sensor: thin, homogeneous polypyrrole layers on flexible textile polyamide fabrics20~100 ppm20 ppmPersonal
protection
[19]
6Optical sensor: Mn-doped graphene--Industry and safety[20]
7Optical sensor: tunable perovskite nanowire laser based on a CsPbBr3 nanowire integrated with a nanostructured Al2O3 substrate5~500 ppm1.12 ppmWorkplace in chemical industry[18]
8Optical sensor: UiO-66 three-dimensional photonic crystals0~2.5 ppm10.9 ppbAtmosphere[22]
9Optical sensor: fluorescent nanofilms based on imine linkage using 4,4′-[4,4′-Biphenyldiylbis (oxy)] dianiline (DAPODP) and 4,4′,4″,4‴-(ethene-1,1,2,2-tetrayl) tetrabenzaldehyde (TPE-CHO)0~96 ppm150 ppbIndustrial
workplace
[24]
10Optical sensor: 3D Ln-Metal–organic frameworks based on the H4TBAPy ligand [H4TBAPy = (1,3,6,8-tetrakis (p-benzoic acid) pyrene)]0~80 ppm0.18 ppmWorkplace in chemical industry[21]
11Optical sensor: thermoelastic spectroscopy based on a custom low-frequency quartz tuning fork0~500 ppm0.148 ppmChemical
processing
[23]
12Optical sensor: multi-gas photoacoustic sensor0~25 ppm24 ppb-[61]
Table 2. Concentrations of standard gases used in this study.
CompoundConcentration (ppm, %-CO2, %RH–H2O)
HCl0, 5, 15, 30, 40, 50
NO0, 1, 10, 50, 100, 180, 300, 400, 500, 600, 700, 800, 900, 1000
NO20, 1, 10, 50, 100, 180, 300, 400, 500, 600, 700, 800, 900, 1000
SO20, 1, 10, 50, 100, 180, 300, 400, 500, 600, 700, 800, 900, 1000
CO0, 1, 10, 50, 100, 180, 300, 400, 500, 600, 700, 800, 900, 1000
CO20, 1, 2, 3, 4, 6, 10, 12, 23, 50
H2O0, 5, 10, 20, 30, 40, 50, 60, 70, 80
Note: Standard gas was manufactured by Rigas Co., Ltd., Daejeon, Republic of Korea.
Table 3. Mixture gas information on HCl test for a combustion process.
MixtureHCl
(ppm)
NH3
(ppm)
CO
(ppm)
NO
(ppm)
NO2
(ppm)
CO2
(%)
SO2
(ppm)
H2O
(%RH)
11111110110
21525202.5152520
311050455205040
45111110110
55525202.5152520
651050455205040
710111110110
810525202.5152520
9101050455205040
Table 4. Various SO2 concentrations from different stacks in the Republic of Korea [71].
No.CityMin (ppm)Max (ppm)Emission Standard
1Sangju0.00.216
2Seoul0.34.216
3Jangheung2.15.616
4Muan0.14.124
5Yangsan0.060.05820
6Gyeongju0.0016
7Pocheon0.01124
8Seosan0.01.630
9Bucheon0.02.316
10Gochang0.01.124
Table 5. Specifications of various commercial HCl analyzers and the proposed analyzer in this study.
No.TypeManufacturerModelPrice (USD) Limit of Detection24 h Zero
Drift
24 h Span
Drift
ReproductivityLinearityResponse
Time
RangeRef.
(ppm)(%)(%)(%)(%)(s)(ppm)
1FTIRS.Fac Inc.
(Daejeon, Republic of Korea)
TMS300-FTIR>56,0000.312- 2-~100[82]
2NDIR-GFCEnvea
(Poissy, France)
MIR-9000>40,000-2121-~15/5000[83]
3FTIRGasmet
(Vantaa, Finland)
CX4000>70,000-2--2120-[84]
4 Thermo Scientific
(Waltham, MA, USA)
15i (HCP-PKI)>30,0000.20.2 ppm2-2120~5000[85]
5FTIRProtea Ltd.
(Middlewich, Cheshire, UK)
AtmosFIR CEM-0.2--12120~100[86]
6 EcoChem
(League, TX, USA)
MC3>47,0001% of scale----10~100[87]
7 SICK
(Waldkirch, Breisgau, Germany)
MCS200HW>100,0002% of scale33--200~1840[88]
8TDLASHORIBA
(Kyoto, Japan)
TX-100>59,000-22112~500[89]
9TDLASNeo Monitors AS
(Skedsmokorset, Norway)
LaserGas-II SP-0.05--1-2-[90]
10TDLASEnvea
(Poissy, France)
LAS 5000XD-1% of scale---11~10, 5000[91]
11TDLASMETTLER TOLEDO
(Columbus, OH, USA)
Gpro 500-0.6220.2514~1%[92]
12NDIRThis study-10,0000.070.020.60.260.96750~50-
Table 6. Various concentrations of HCl (ppm) with respect to the NDIR analyzer coupled with the combined method and ion chromatography (combustion process simulation).
MixSTDNDIR AnalyzerIon Chromatography
MinMaxMeanRSDRPDMinMaxMeanRSDRPD
11.000.981.021.011.500.570.981.010.991.541.00
21.000.981.011.001.220.141.001.011.000.580.00
31.000.981.031.011.890.570.991.021.001.730.00
45.024.985.105.020.820.005.005.055.020.500.00
55.024.985.105.040.890.404.985.075.030.900.20
65.024.965.045.010.630.265.005.045.020.410.00
710.09.9710.110.00.560.0410.010.1310.10.550.50
810.09.9910.110.00.430.2110.010.1210.10.400.60
910.09.9510.09.990.370.3410.010.110.00.200.20
Note: STD is the concentration of HCl standard gas in the mixture. RSD (%) is the relative standard deviation of the repeated experiments. RPD (%) is a relative percentage difference between standard gas and analytical concentrations.
Table 7. Average HCl concentrations obtained from the proposed NDIR analyzer and IC method.
No.NDIRStandard MethodRMSEMNE (%)MNB (%)RPD (%)
10.21 ± 0.160.24 ± 0.030.1551.0−5.750.66
20.21 ± 0.160.22 ± 0.030.1458.2−5.560.30
30.46 ± 0.080.39 ± 0.060.1431.931.91.64
40.33 ± 0.010.49 ± 0.160.1219.8−13.53.92
50.11 ± 0.140.24 ± 0.010.1445.3−31.23.32
60.17 ± 0.150.22 ± 0.050.0936.317.61.19
70.06 ± 0.020.29 ± 0.140.2982.2−82.25.91
80.17 ± 0.100.23 ± 0.050.1038.9−38.91.51
90.30 ± 0.090.28 ± 0.050.0413.0−13.00.50
100.59 ± 0.200.57 ± 0.260.2647.239.30.52
110.53 ± 0.200.40 ± 0.060.036.801.333.16
120.27 ± 0.260.35 ± 0.010.2462.9−62.92.03
Table 8. Average HCl concentrations obtained from the proposed NDIR analyzer and IC method.
No.NDIRStandard MethodRMSEMNE (%)MNB (%)RPD (%)
10.41 ± 0.190.39 ± 0.070.1223.93.680.45
20.84 ± 0.250.36 ± 0.020.591561569.55
30.73 ± 0.180.34 ± 0.040.3197.897.87.84
40.47 ± 0.150.32 ± 0.010.2469.269.23.06
50.59 ± 0.650.51 ± 0.370.2828.713.81.65
60.54 ± 0.660.89 ± 0.270.5249.2−41.97.07
Disclaimer/Publisher’s Note: The statements, opinions and data contained in all publications are solely those of the individual author(s) and contributor(s) and not of MDPI and/or the editor(s). MDPI and/or the editor(s) disclaim responsibility for any injury to people or property resulting from any ideas, methods, instructions or products referred to in the content.

