Article

A Portable Electronic Nose Coupled with Deep Learning for Enhanced Detection and Differentiation of Local Thai Craft Spirits

by
Supakorn Harnsoongnoen
1,*,
Nantawat Babpan
1,
Saksun Srisai
1,
Pongsathorn Kongkeaw
2 and
Natthaphon Srisongkram
1
1
The Biomimicry for Sustainable Agriculture, Health, Environment and Energy Research Unit, Department of Physics, Faculty of Science, Mahasarakham University, Kantarawichai District, Maha Sarakham 44150, Thailand
2
Program of Physics, Faculty of Science and Technology, Rajabhat Maha Sarakham University, Muang Maha Sarakham District, Maha Sarakham 44000, Thailand
*
Author to whom correspondence should be addressed.
Chemosensors 2024, 12(10), 221; https://doi.org/10.3390/chemosensors12100221
Submission received: 13 September 2024 / Revised: 12 October 2024 / Accepted: 17 October 2024 / Published: 19 October 2024
(This article belongs to the Special Issue Gas Sensors and Electronic Noses for the Real Condition Sensing)

Abstract

:
In this study, our primary focus is the biomimetic design and rigorous evaluation of an economically viable and portable ‘e-nose’ system, tailored for the precise detection of a broad range of volatile organic compounds (VOCs) in local Thai craft spirits. This e-nose system is innovatively equipped with cost-efficient metal oxide gas sensors and a temperature/humidity sensor, ensuring comprehensive and accurate sensing. A custom-designed real-time data acquisition system is integrated, featuring gas flow control, humidity filters, dual sensing/reference chambers, an analog-to-digital converter, and seamless data integration with a laptop. Deep learning, utilizing a multilayer perceptron (MLP), is employed to achieve highly effective classification of local Thai craft spirits, demonstrated by a perfect classification accuracy of 100% in experimental studies. This work underscores the significant potential of biomimetic principles in advancing cost-effective, portable, and analytically precise e-nose systems, offering valuable insights into future applications of advanced gas sensor technology in food, biomedical, and environmental monitoring and safety.

1. Introduction

The journey of artificial olfaction’s sensor technology commenced in 1982 with the creation of the inaugural gas multisensor array [1]. The seamless progression in aroma-sensor technology, electronics, biochemistry, and artificial intelligence paved the way for the creation of devices that could proficiently measure and characterize volatile aromas emanating from diverse sources, serving a multitude of applications. Crafted to emulate the mammalian olfactory system, these instruments, often referred to as electronic noses (e-noses), were intricately designed to secure consistent measurements, facilitating the identification and classification of aromas. E-nose technologies enable non-destructive measurement, are easy to use, are small and compact, can be tested in the field, enable fast analysis, and have low operating costs. The field of e-noses has continued to evolve, with applications in areas such as food quality control [2,3,4,5,6,7], environmental monitoring [8,9], and medical diagnostics [10,11]. Volatile organic compounds (VOCs), commonly referred to as VOCs, encompass a class of chemicals characterized by their pronounced vapor pressure under the conditions of room temperature and standard atmospheric pressure, as documented in reference [12]. These VOCs exhibit a comprehensive categorization as carbon-based entities (ranging from C2 to C30), thus encapsulating a wide spectrum of chemical constituents including but not limited to hydrocarbons, esters, alcohols, ketones, and aldehydes. The distinguishing hallmark of this array of compounds lies in their elevated vapor pressures and notably modest boiling points, spanning the range of 50 to 260 degrees Celsius [13]. The utilization of e-nose technology for detecting VOCs holds great promise in a wide range of applications, including the classification of human body odor [14,15], fruity odors [16,17], wine [18,19,20,21,22,23,24,25,26,27], and saffron [28]; the identification of cigarette brands [29]; the classification of coffee aroma profile and intensity [30]; the staging of colorectal cancer [31]; and the classification of malts [32], passion fruit wines [22], wine faults [25], Fusarium oxysporum infection [33], 2,4,6-Trichloroanisole discrimination [34], aromatic defects in natural cork stoppers [35], fraudulent rice [36], and alcohol [37,38,39,40,41]. The e-nose systems described above are employed for measuring various sample substances, each offering distinct advantages. However, it is clear that the proposed e-nose depends on a considerable number of sensors and involves a complex process for feature extraction. Notably, there has been insufficient examination of the most suitable sensor pairs for the measurement of each specific sample substance. To enhance the system’s efficiency, it is crucial to reduce both the number of sensors and the volume of input data, thereby minimizing the steps and time required for feature extraction.
Thailand’s distilled spirits market, despite being rooted in a rich tradition of agricultural processing and skilled craftsmanship, faces significant challenges that hinder its growth. These local spirits, known for their unique aroma, color, and taste, hold untapped potential for driving rural economic development through spirit tourism. However, negative perceptions and a lack of awareness about the health effects of alcohol have stifled market expansion. To overcome these barriers, it is crucial to enhance the quality of these products and elevate cultural awareness surrounding their production. Government support, through relaxed licensing requirements and targeted market research, is essential for identifying demand, preserving cultural heritage, and fostering a thriving community-based spirits industry [42]. Furthermore, integrating innovative technologies, such as a portable electronic nose coupled with deep learning, can significantly enhance the potential of Thai distilled spirits by providing precise and consistent aroma analysis. This technology can help improve product quality, reduce reliance on imported alcohol, and better manage cost variations, thereby positioning the industry more competitively in the market and contributing to both the local economy and the preservation of Thailand’s cultural identity.
The objective of this research is to advance the detection and differentiation of local Thai craft liquors through the use of a cost-effective, portable electronic nose integrated with deep learning for precise classification. This methodology is designed not only to establish a robust framework for future innovations in the quality control and monitoring of Thai craft spirits but also to extend its applicability to similar contexts in other countries.

2. Materials and Methods

2.1. E-Nose System

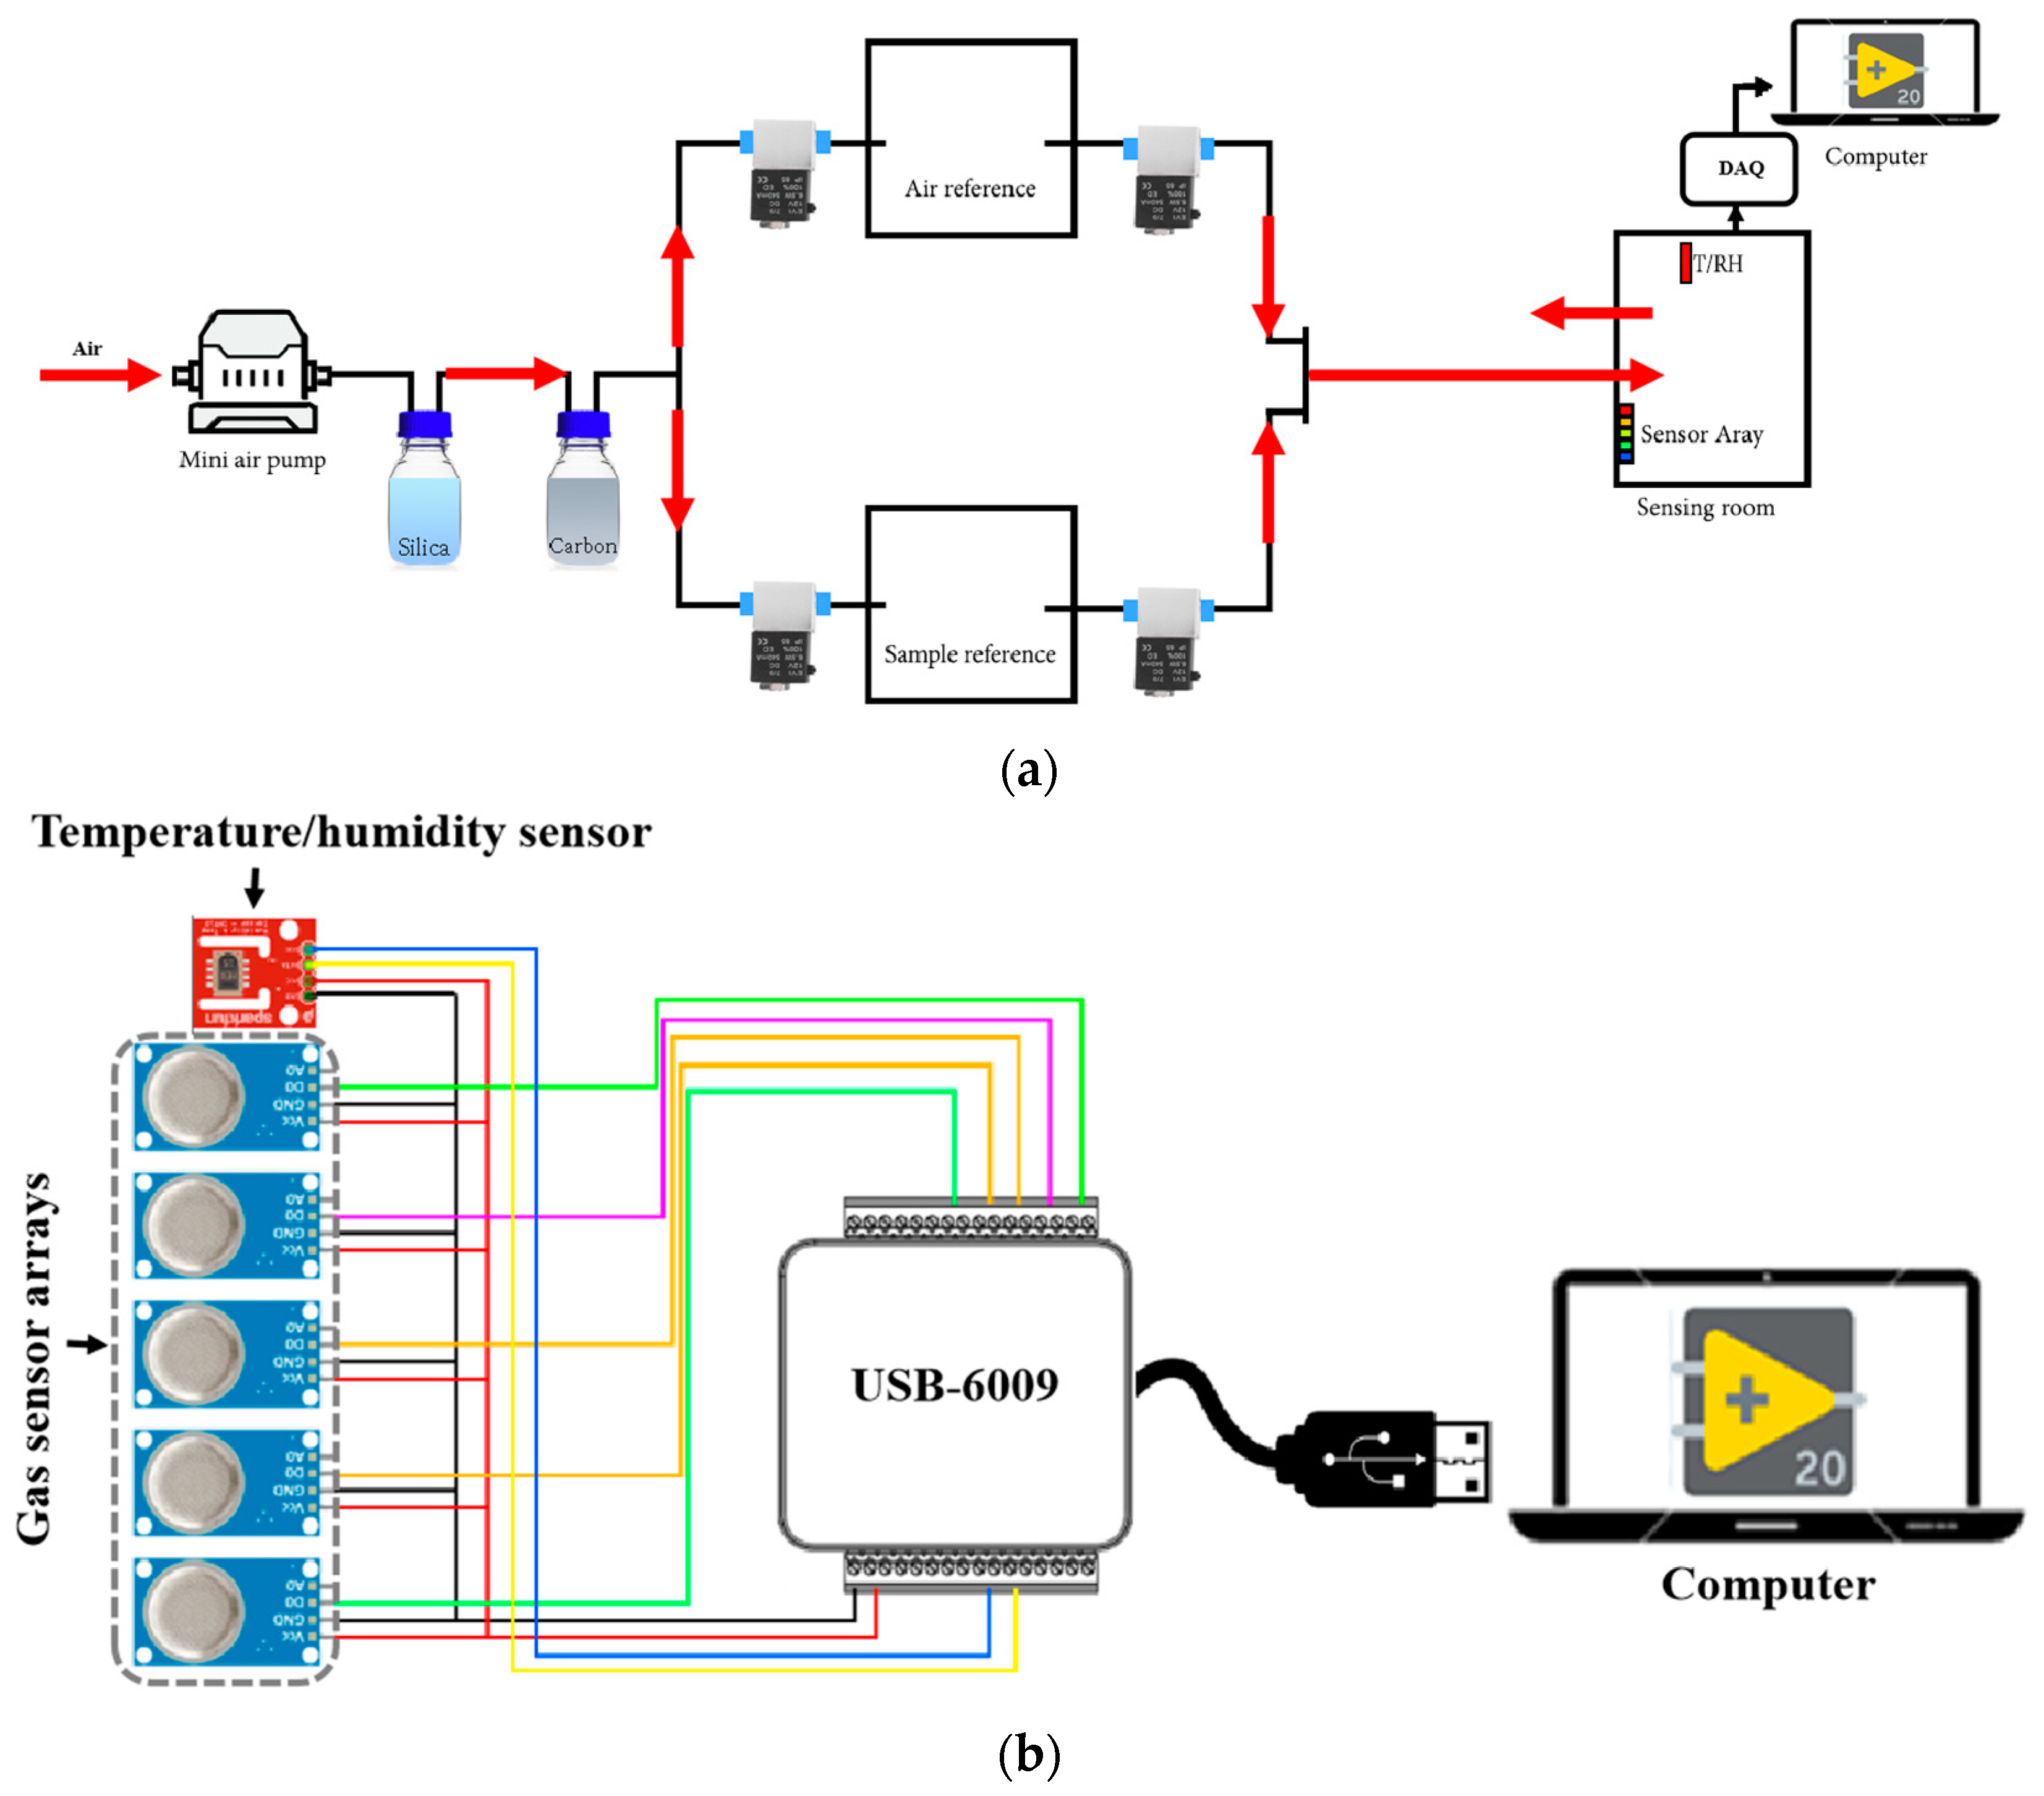
Systems for evaluating the olfactory profiles of local Thai craft spirits are meticulously designed and developed using advanced e-nose technology, as illustrated in Figure 1. The e-nose system comprises several critical components, including a mini pump, silica and carbon filters, four solenoid valves, two sample air chambers, a sensing chamber, a data acquisition (DAQ) unit, and a computer. The process involves drawing external air into the system to transport the VOCs from local Thai craft spirits into the measurement chamber. Incoming air is first filtered for moisture using silica and then for odors using charcoal. During the measurement phase, the system alternates between air samples laden with local Thai craft spirits and those without, achieved through a two-stage process. This alternation is controlled by regulating the airflow between the test chamber and the reference chamber, using solenoids. A valve regulates the direction of airflow for measurement purposes, as illustrated in Figure 2a. Inside the test chamber, both a temperature/humidity sensor and a gas sensor array are strategically positioned and linked to a DAQ system, which converts analog signals into digital format, as shown in Figure 2b. These digital signals are then transmitted to a computer for detailed processing and data recording.
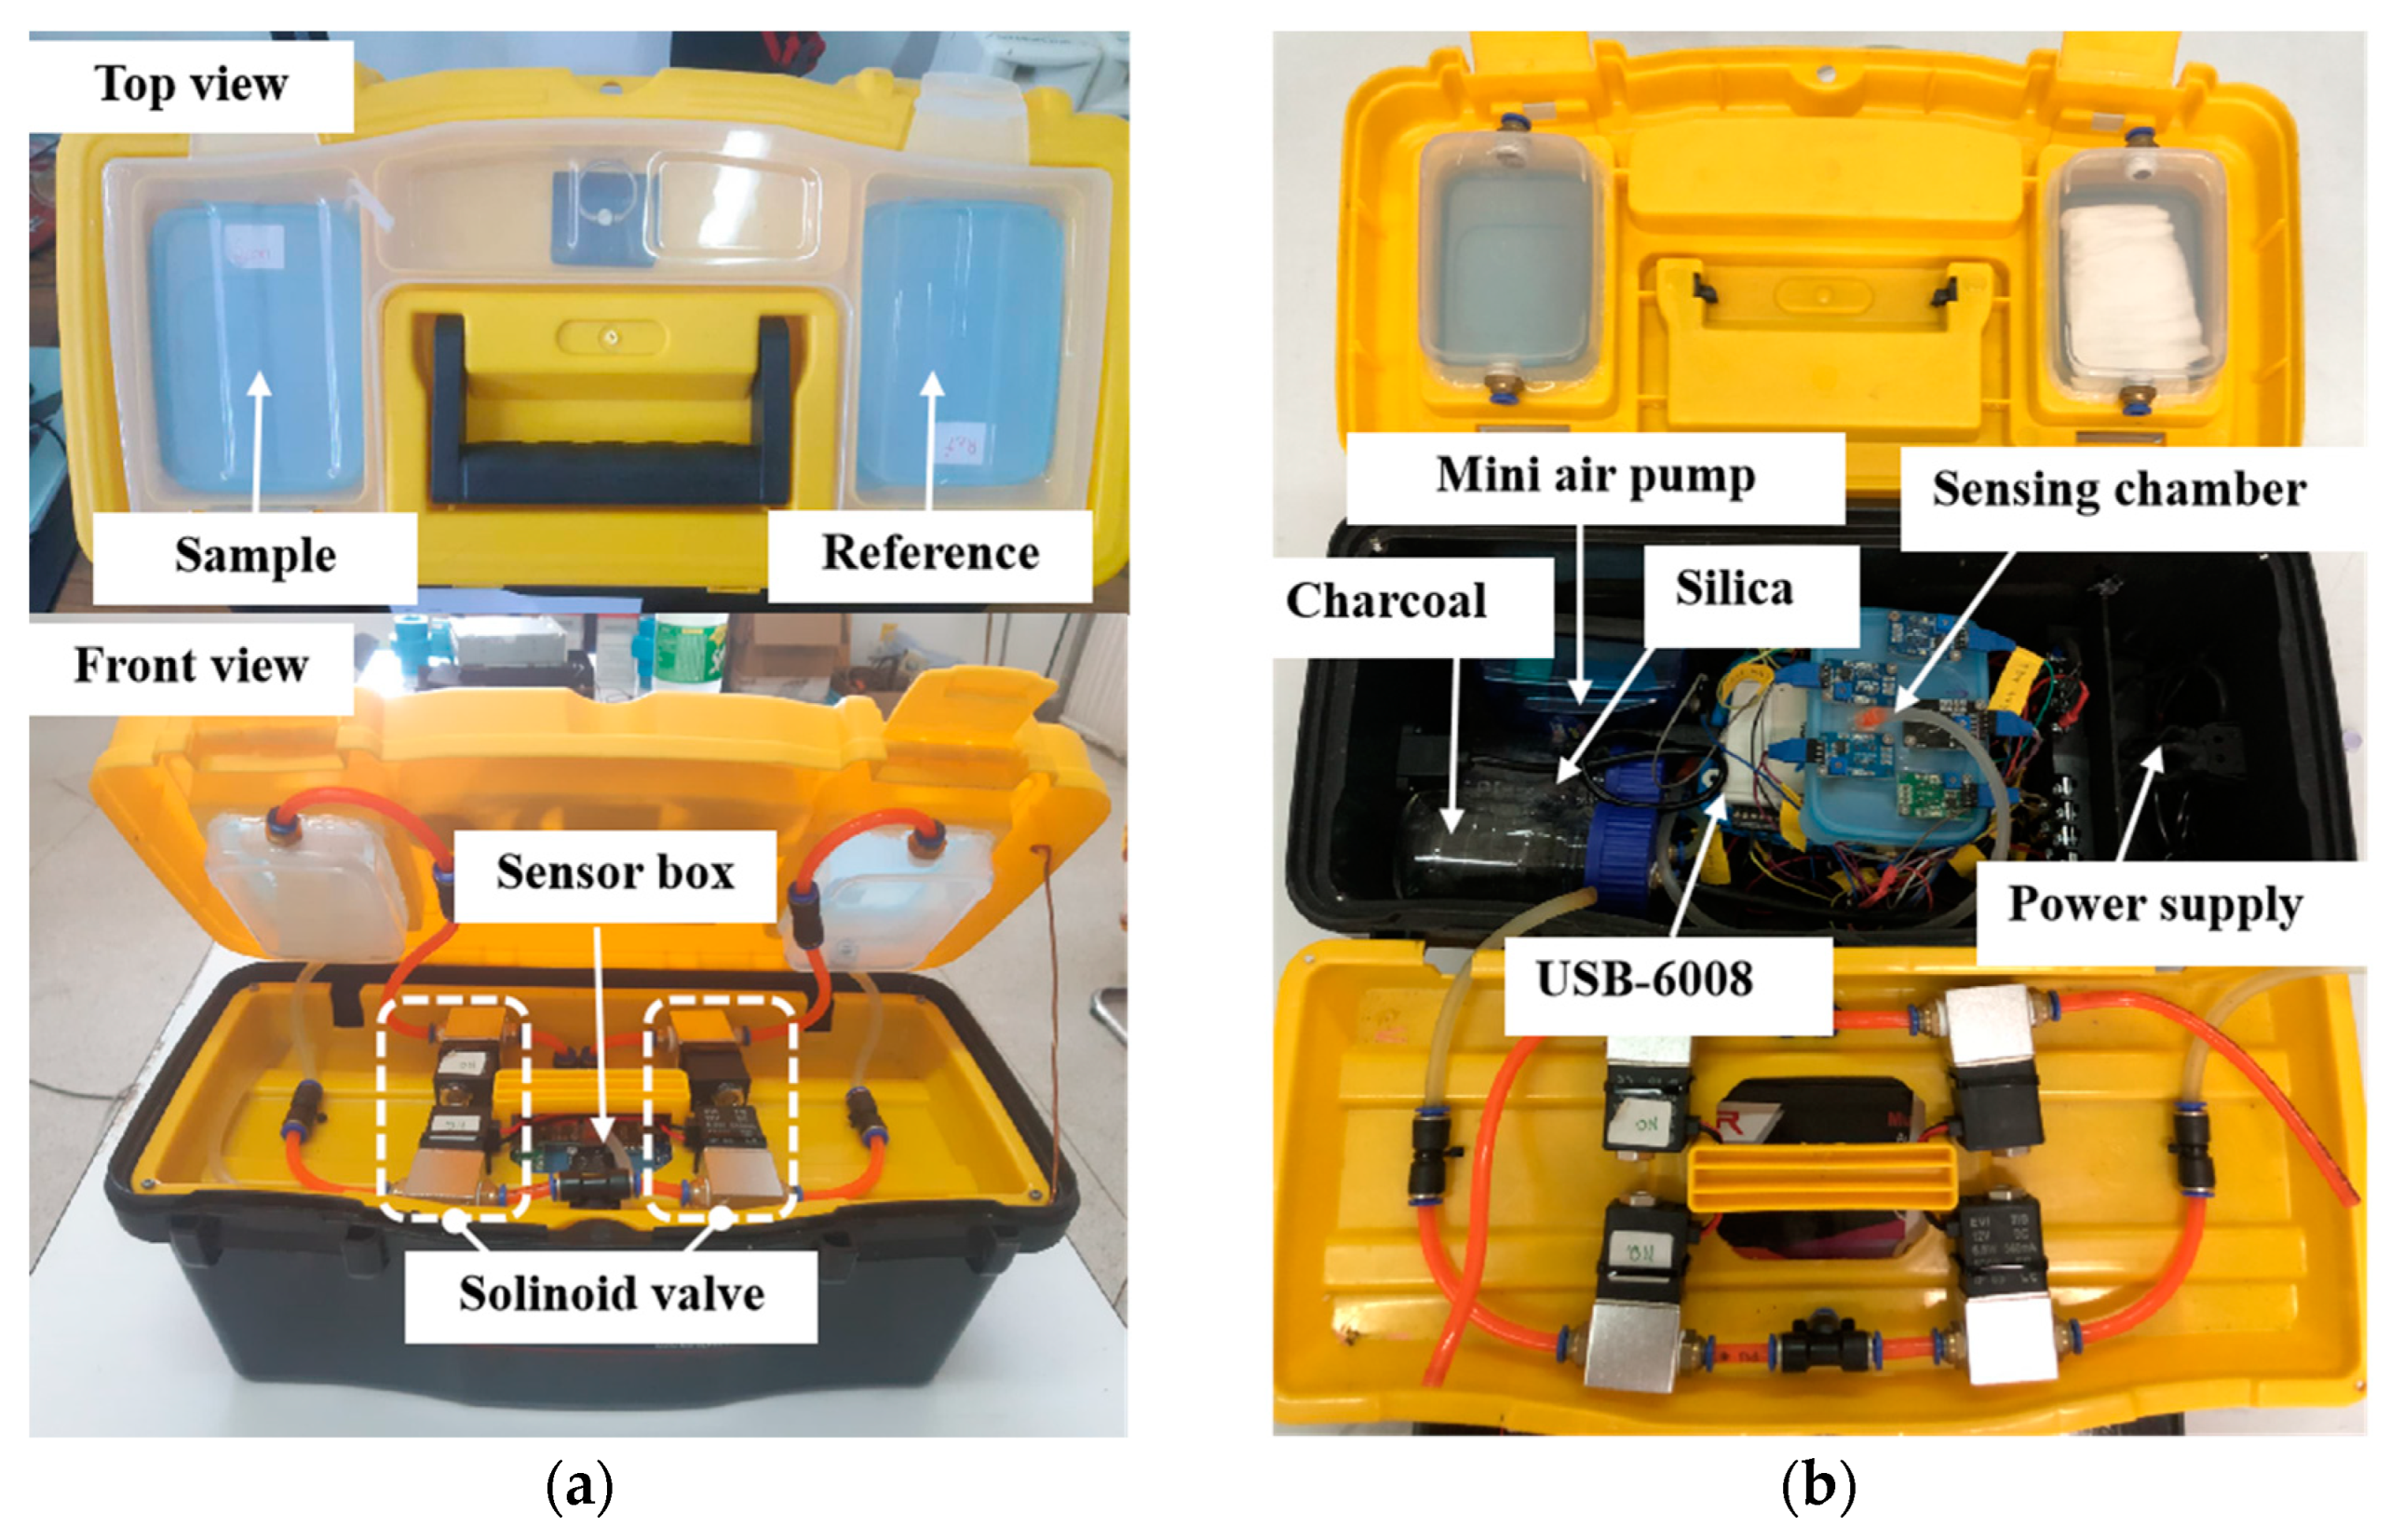
The acquired data are subsequently extracted and classified using a multilayer perceptron (MLP) algorithm. The gas sensor array comprises eight distinct MQ sensors—namely MQ-3, MQ-6, MQ-9, MQ-135, MQ-136, MQ-137, MQ-138, and MQ-139—each equipped with resistors (RLs) that vary in response to the composition of the analyzed gas mixture, as illustrated in Table 1. These sensors are Metal Oxide Semiconductor (MOS) resistive sensors, renowned for their ability to detect a range of gases based on the principle that the electrical resistance of a metal oxide material alters upon exposure to specific gases. Commonly employed in air quality monitoring, industrial safety, and gas leak detection, these sensors are integral to applications requiring precise gas detection and environmental analysis. Moreover, a temperature and humidity sensor (SHT15) has been meticulously installed in the sensing room. Each sensor is meticulously interfaced with the DAQ card (NI USB-6009), playing a pivotal role in capturing the received electrical signals and facilitating their transmission to the computing system. Figure 3a shows a top and front view of a low-cost portable electronic nose. The lid of the box will be furnished with both a reference air chamber and a test odor chamber. The interior of the box will house a meticulously installed pump, along with provisions for humidity and odor filtration, a measurement chamber, power supply units, and DAQ cards, as illustrated in Figure 3b.
The essential components of the electronic nose are housed within a meticulously designed compact carrying case. This case is equipped with an AC power supply cord, a USB port for data connectivity, and an on/off switch, all strategically positioned on the case’s exterior. To streamline the process of sample replacement for odor measurement, users can easily access the sample chamber and position the new sample directly on the lid of the carrying case, thus avoiding the need to open the case itself. Additionally, the carrying case is fitted with a securely closing cover, facilitating the effortless transport of the electronic nose while ensuring that all components are safely and effectively contained.

2.2. Materials and Analyte Solution Preparation

The samples used for testing include three distinct local Thai spirits: traditional distilled liquor from Khon Kaen Province (referred to as “Koon”), local distilled liquor from Sakon Nakhon Province (known as “Onson”), and a locally produced pandan-flavored distilled liquor from Chaiyaphum Province (designated as “Rai Fa Changes Color”). All three distinct local Thai spirits were measured using a hydrometer, confirming that they contained approximately 40% alcohol, ensuring comparable levels across the samples. Each spirit was subjected to a series of five test repetitions to determine the average results, with each measurement session lasting 20 min. This process was conducted over a total of five measurement cycles to ensure comprehensive and reliable data.

2.3. Experimental Measurement Set-Up

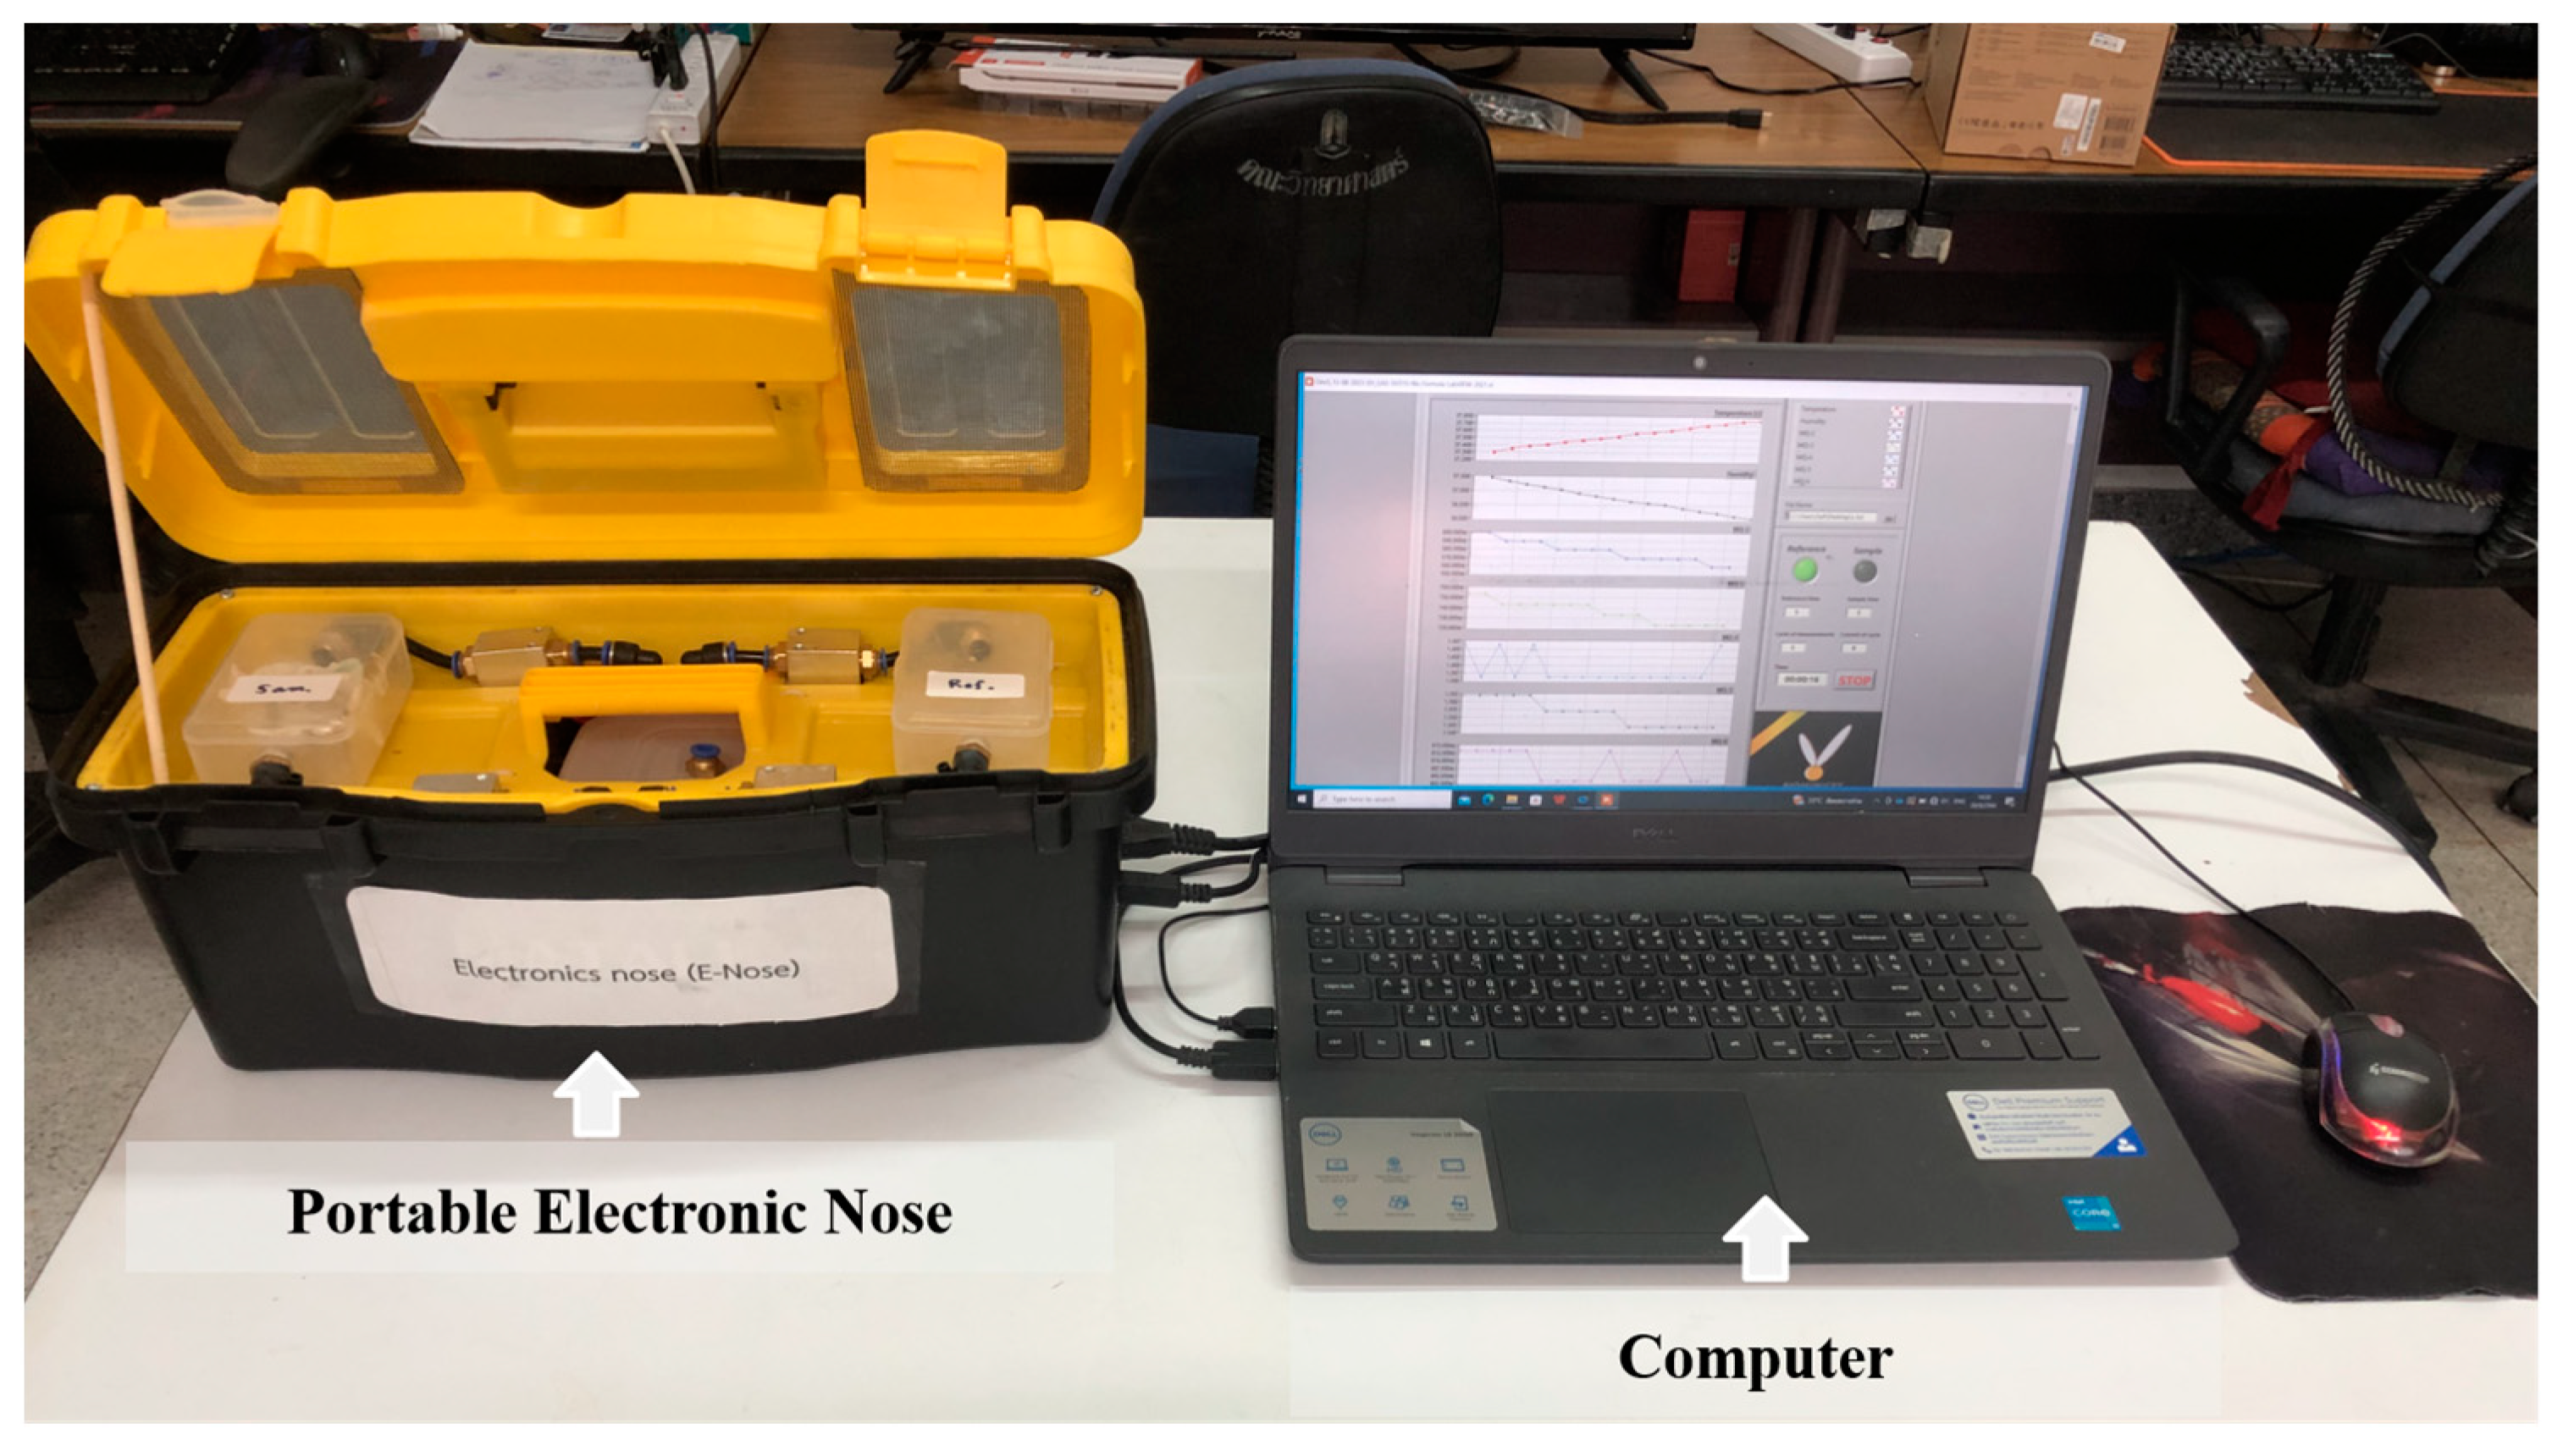
Figure 4 illustrates the configuration of the electronic nose (e-nose) system. The low-cost, portable e-nose is interfaced with a computer running the LabVIEW software via a USB connection. The system is utilized to analyze local Thai spirits through a structured testing protocol involving five cycles. Each cycle consists of alternating on–off phases, with the e-nose employing a scent convection mechanism for accurate measurement. The on–off phases are precisely timed, with each phase lasting 1 min, allowing for the sequential analysis of sample substances against normal air. The signal data captured during these cycles are derived from the peak and trough values of the measured responses. The acquired data were analyzed using Principal Component Analysis (PCA) and subsequently clustered employing K-means and MLP stratification techniques. Each sample is uniformly introduced into the testing chamber at room temperature, with a consistent volume of 10 mL per test. The airflow rate is carefully regulated at 0.7 L/minute by a miniature air pump to ensure precise and reproducible measurements.

2.4. Data Extraction and Neural Network

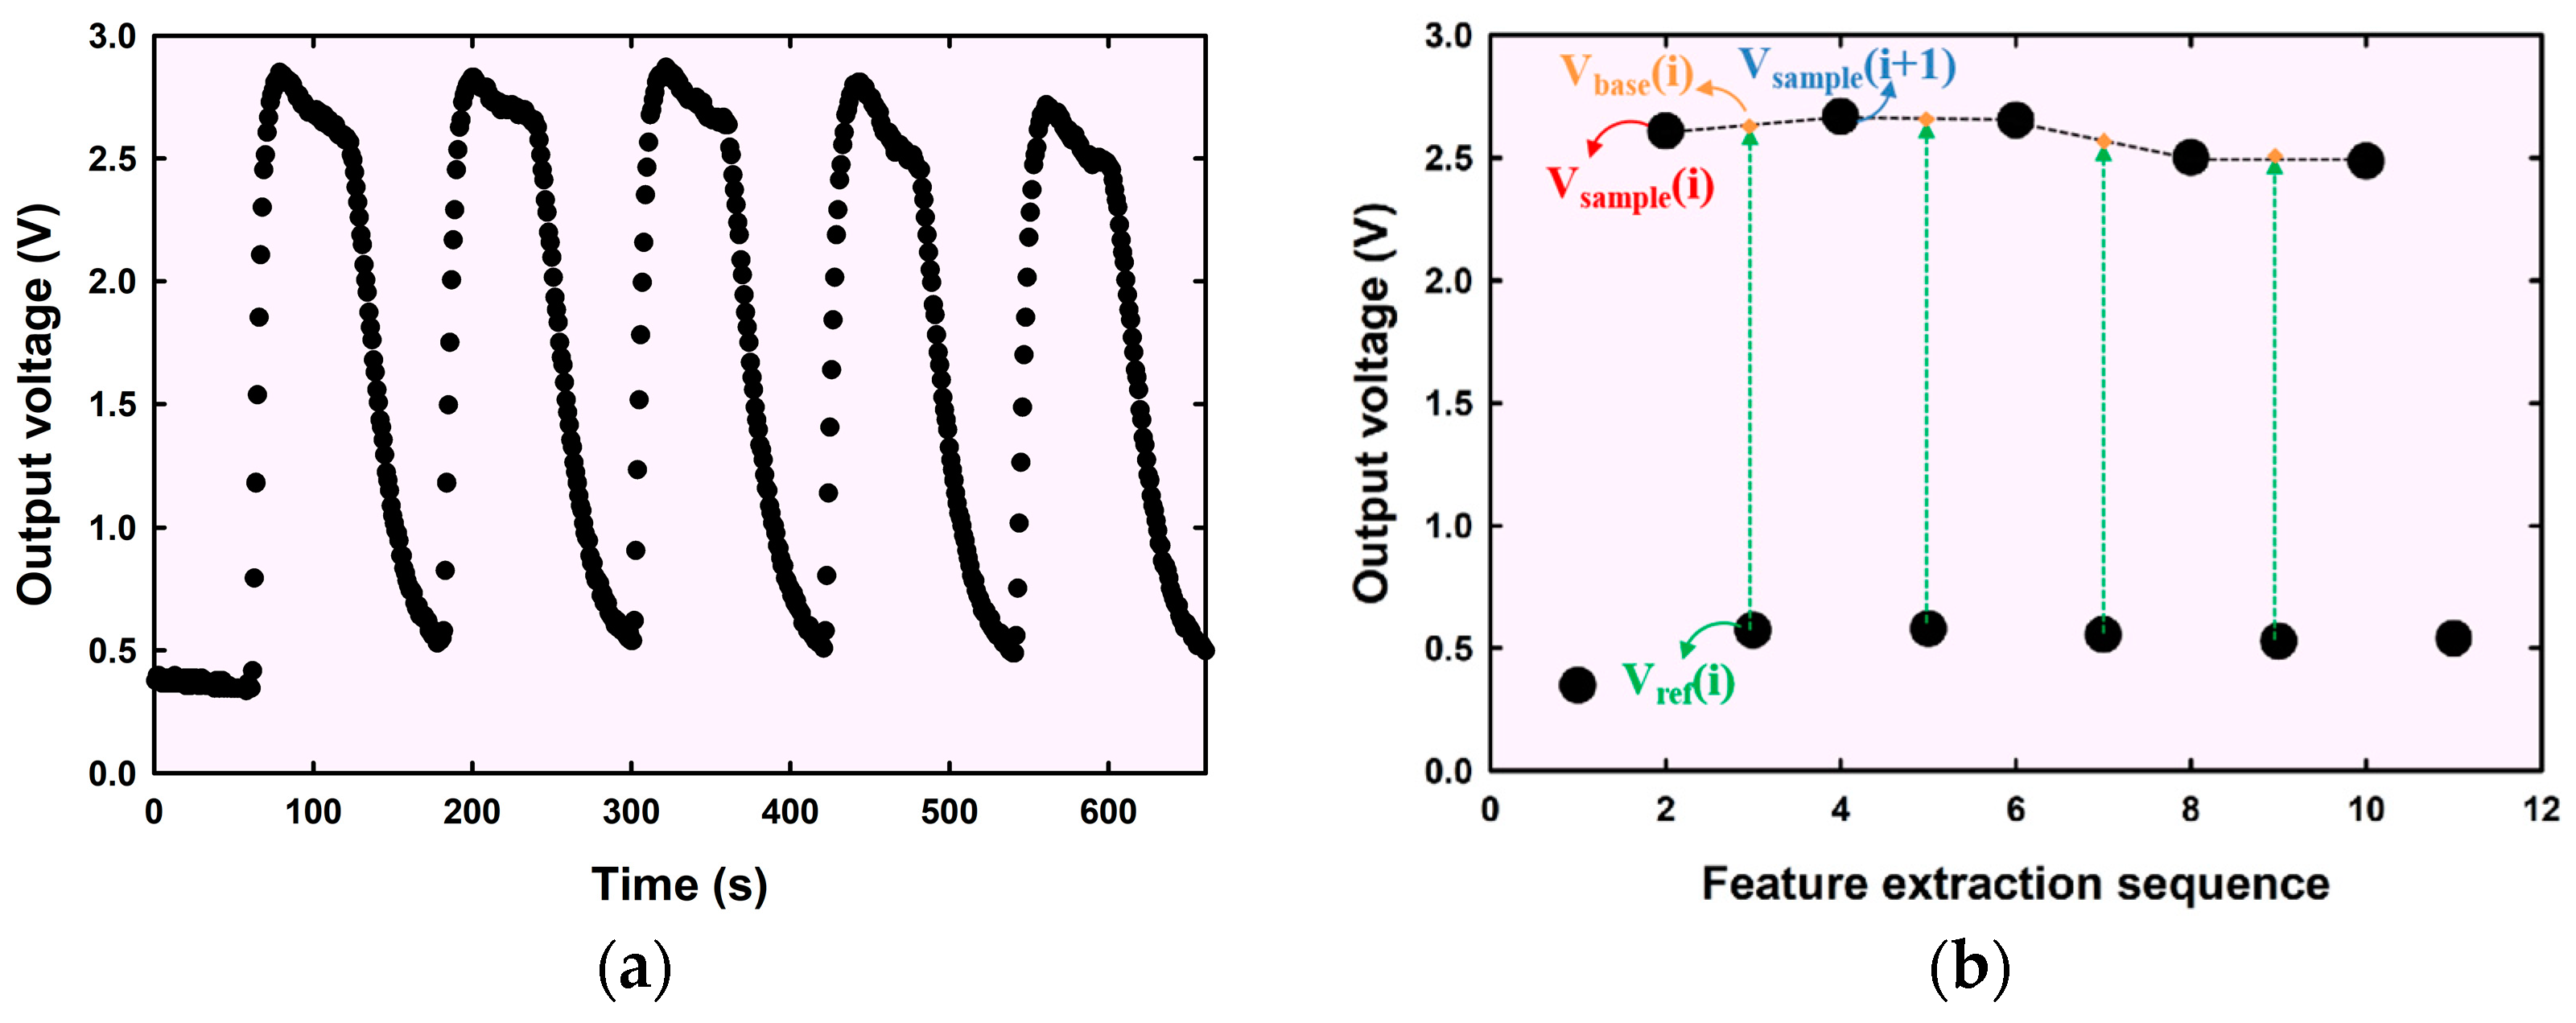
The voltage levels of each gas sensor are recorded at one-second intervals over a predetermined duration and number of measurement cycles. To initiate the system, it is essential to establish the time periods allocated for measuring odors in both the reference and sample rooms, as shown in Figure 5a. Upon configuration, the system commences obtaining measurements by first analyzing the odor in the reference room, followed by obtaining measurements in the sample room. This alternating process continues until the specified number of cycles is completed. During each cycle, the system captures and records both the maximum and minimum voltage data. These data points are subsequently extracted and stored in separate files for detailed analysis. In addition to recording the maximum and minimum values for each measurement cycle, this study also focuses on extracting the feature extraction during the odor measurement from the sample room, as shown in Figure 5b. In Figure 5b, the index “ref” denotes the reference measurement, while the index “sample” corresponds to the sample measurement. The index “base” is defined as the baseline-corrected reference value. The variable “i” represents the running number of the measurement loop, which alternates between the reference and sample rooms. To establish a baseline, linear interpolation is employed to connect two reference points (Vsample(i) and Vsample(i + 1)). The corrected reference point (Vbase(i)) is computed by projecting the sample measurement onto this baseline. Consequently, the baseline-corrected difference between the sample and reference voltages is calculated using the following formula:
Δ V c o r r e c t e d = V r e f ( i ) V b a s e ( i )
Alternatively, this difference can be expressed as a percentage as follows:
Δ V p e r c e n t a g e = V r e f ( i ) V b a s e ( i ) V b a s e ( i ) × 100 %
where
V b a s e ( i ) = V s a m p l e ( i + 1 ) V s a m p l e ( i ) 2 + V s a m p l e ( i )
This approach ensures that the voltage differences between the sample and reference measurements are accurately quantified, accounting for any baseline shifts that may occur during the measurement process.
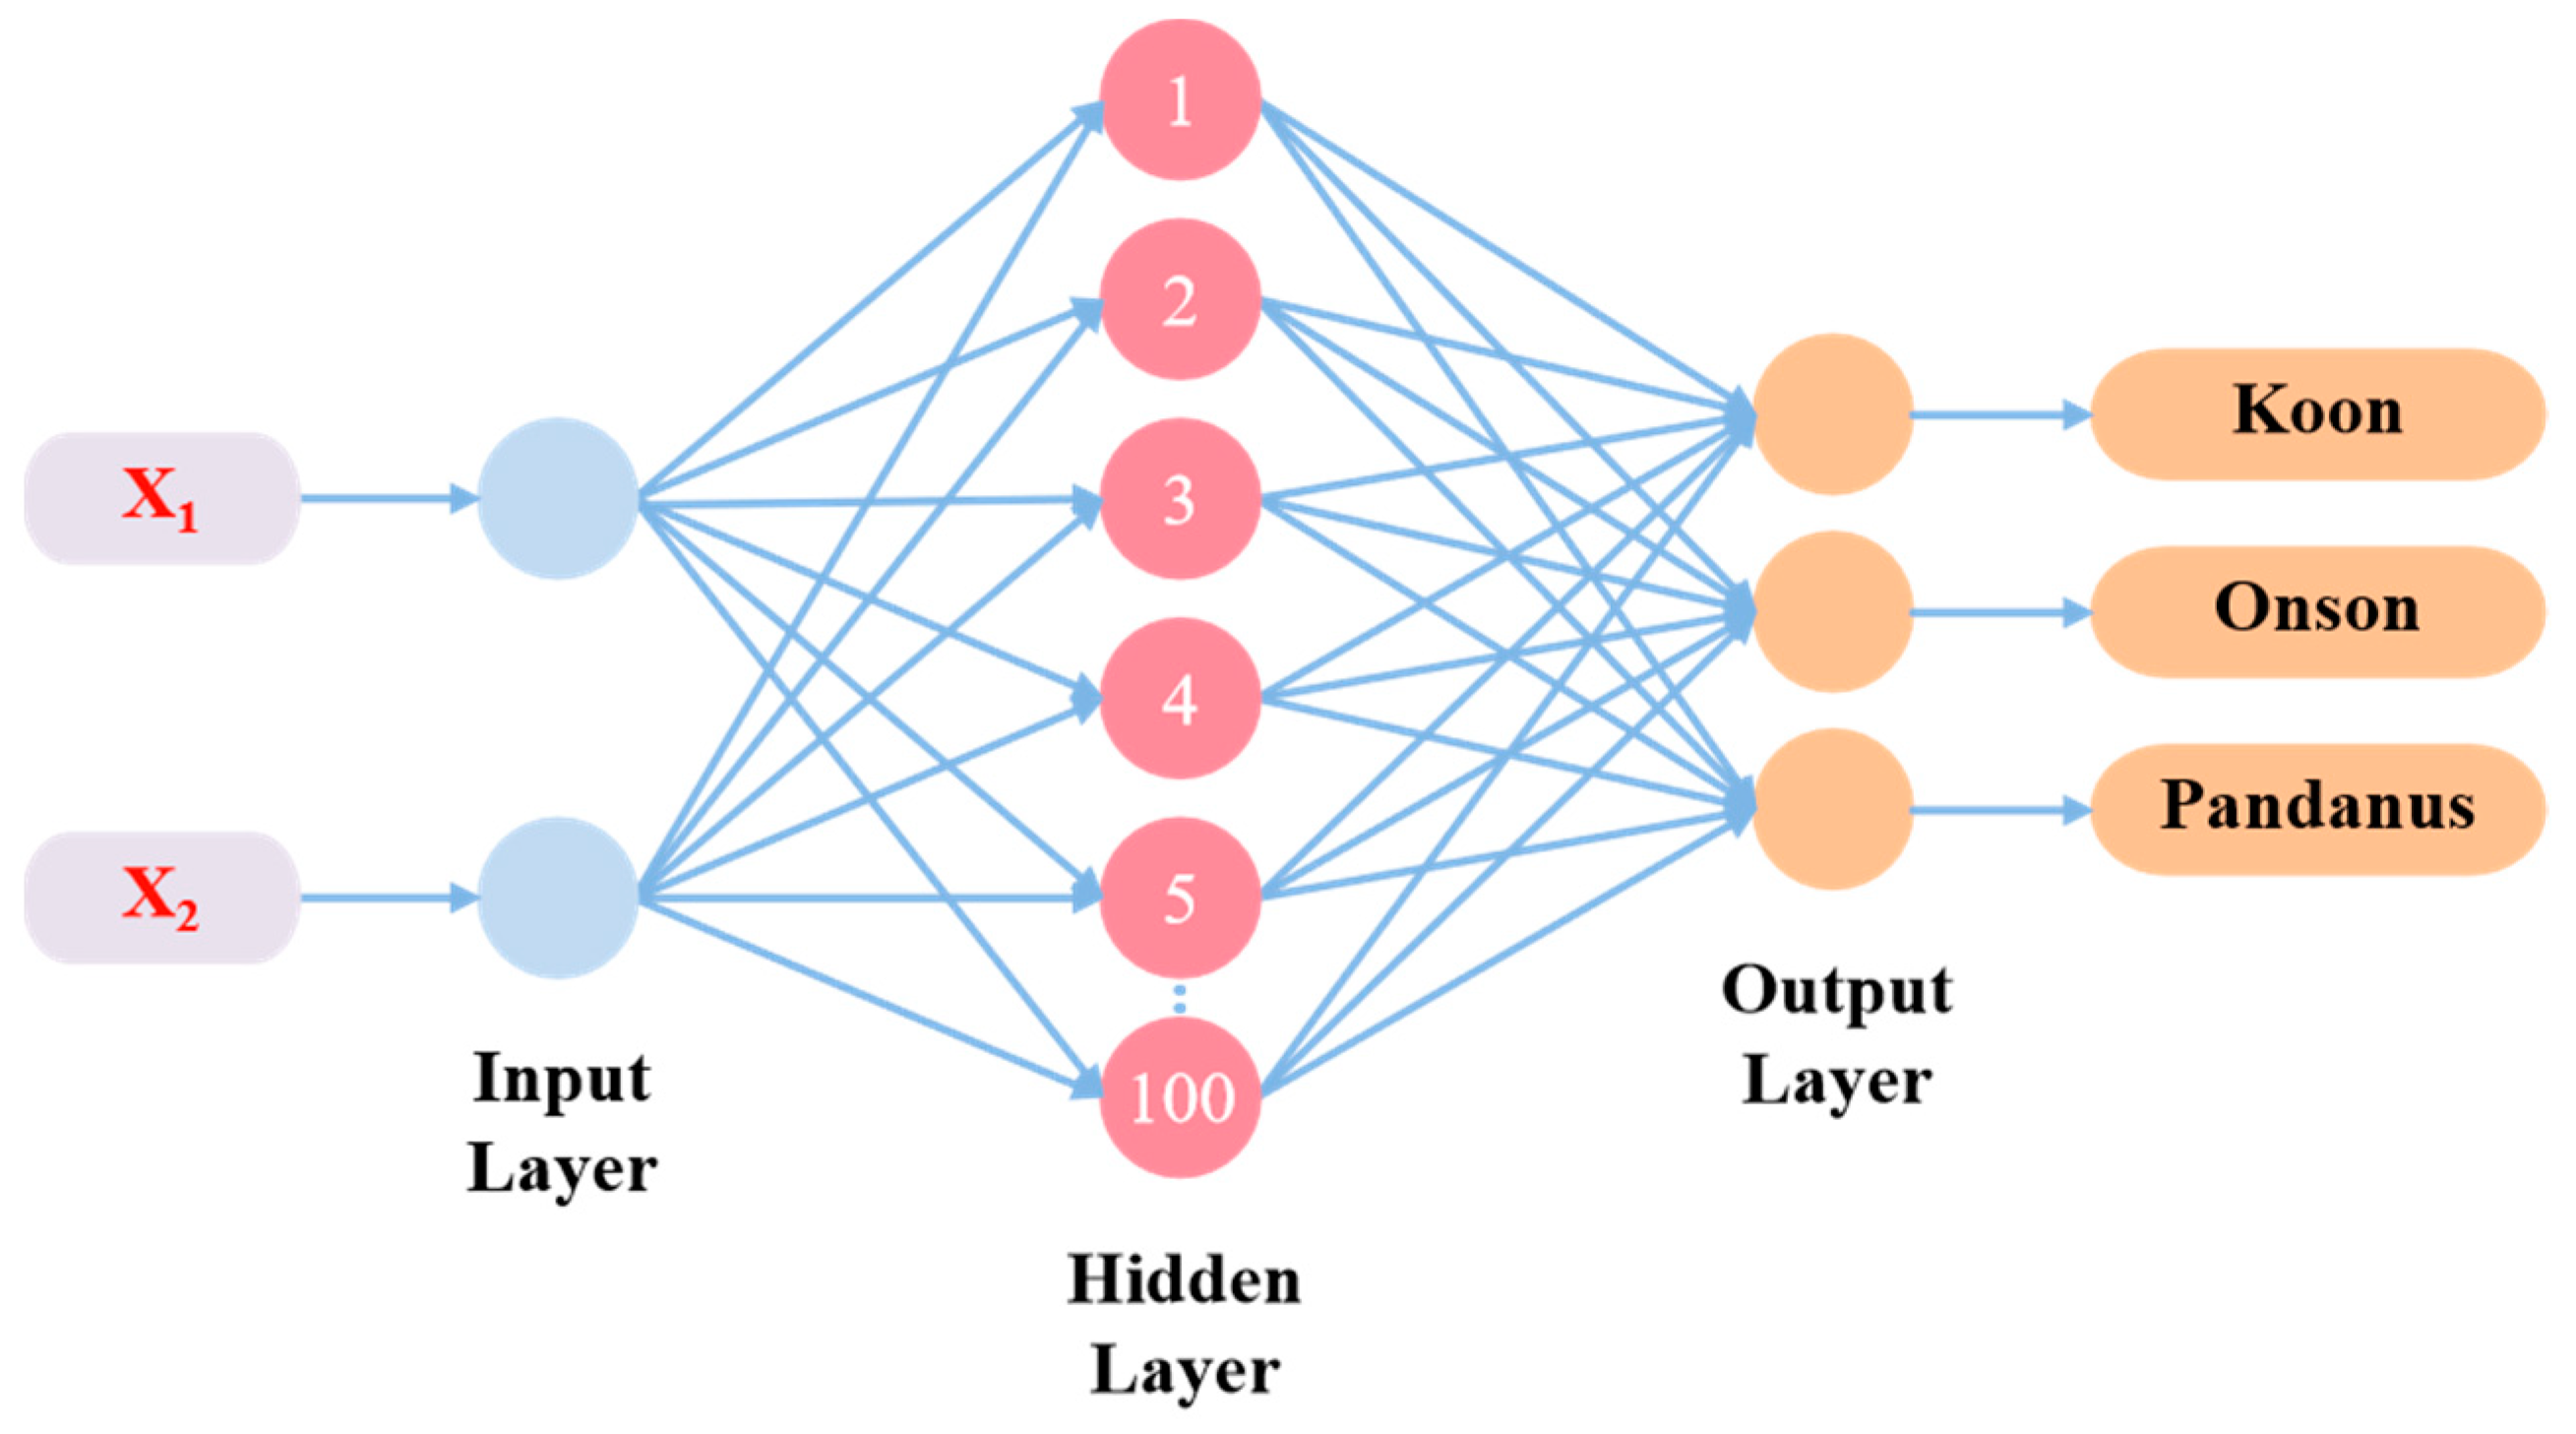
Figure 6 illustrates the architecture of a MLP with a single hidden layer, comprising two input nodes and three output nodes. The architecture is detailed as follows: The input layer includes two nodes, each representing data from an MQ gas sensor, which serves as the input features. The hidden layer consists of 100 nodes, each fully connected to the input layer, facilitating complex feature extraction and transformation. The output layer has three nodes, corresponding to the classification targets: the Koon, Onson, and Pandanus spirits. The network is trained over 1000 iterations, depending on the specific application. For data analysis and preprocessing, this study employs the NumPy, Pandas, Matplotlib, Seaborn, and Scikit-learn libraries, all implemented in Python. Additionally, the Mlxtend library is utilized to generate region area plots for enhanced visualization.

3. Results

3.1. Temperature and Humidity Sensor Response

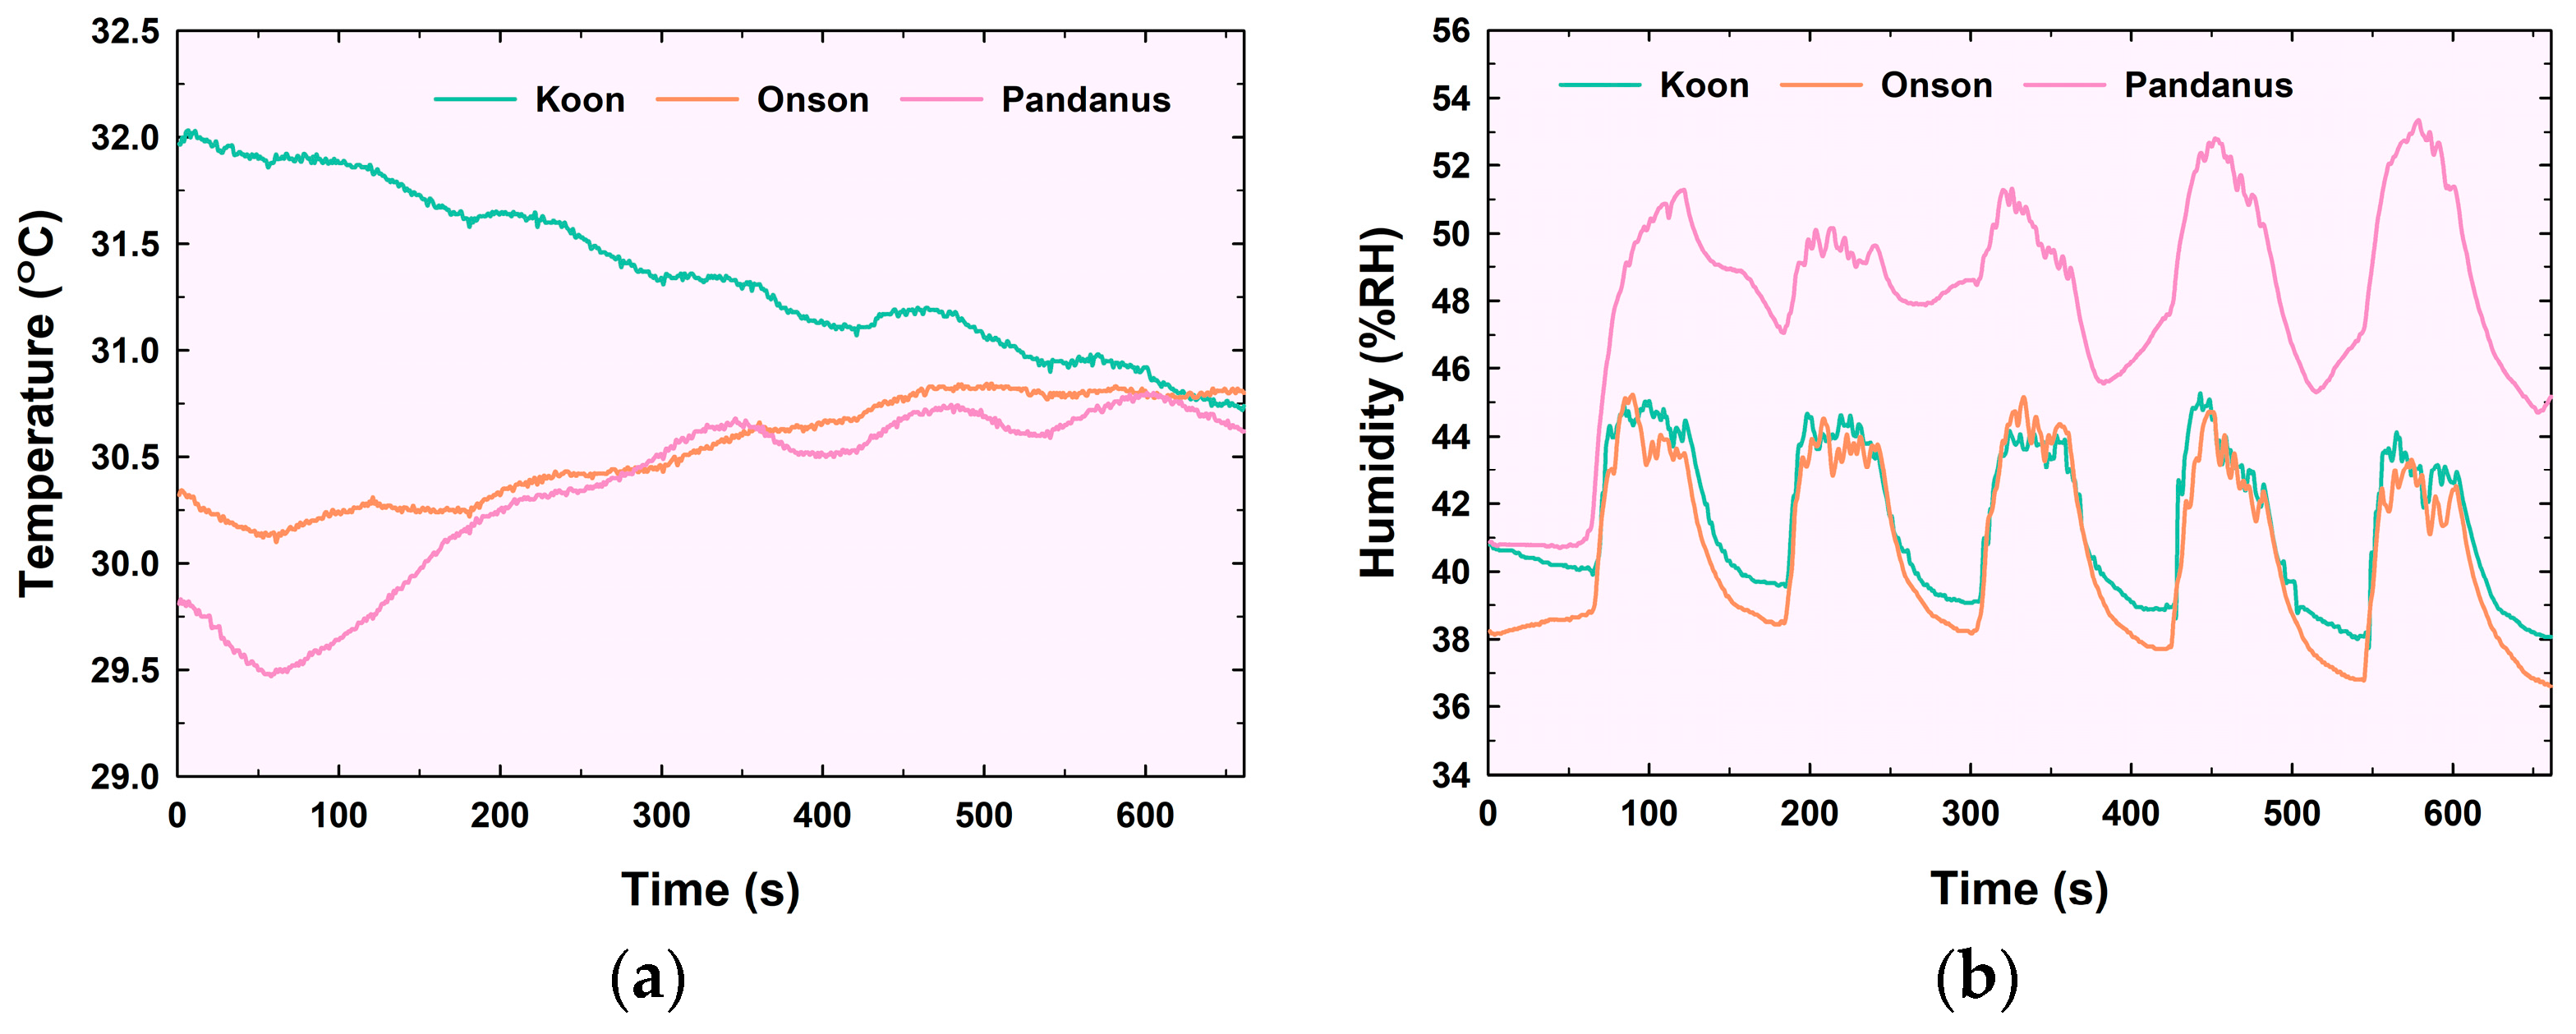
The temperature and humidity measurements in the sample room for the three samples, recorded by the SHT15 sensor, are depicted in Figure 7a,b, respectively. The test revealed that the initial temperature in the odor measurement room for the three sample types ranged from 29.8 °C to 32 °C. Throughout the measurement process, the room temperature stabilized at approximately 30.75 °C. In the sensing room, the humidity levels measured during the odor analysis of the three samples initially ranged from 38% RH to 41% RH. The humidity exhibited rhythmic variations in response to the introduced odors; it increased when air from the sample room was introduced and decreased when air from the reference room was used. Notably, the humidity levels for the Koon and Onson spirit samples were quite similar, fluctuating between 38% RH and 46% RH. The humidity level measured in the sample room containing the Pandanus spirit was notably higher compared with the other two samples. This difference is likely attributed to the higher evaporation rate of the Pandanus spirit, leading to increased accumulated humidity in its sample room. The relative humidity values ranged from 46% RH to 54% RH, exceeding those recorded for the Koon and Onson spirit samples. Averaging the humidity levels from the three samples yielded a value of 43.33 ± 4.06% RH.
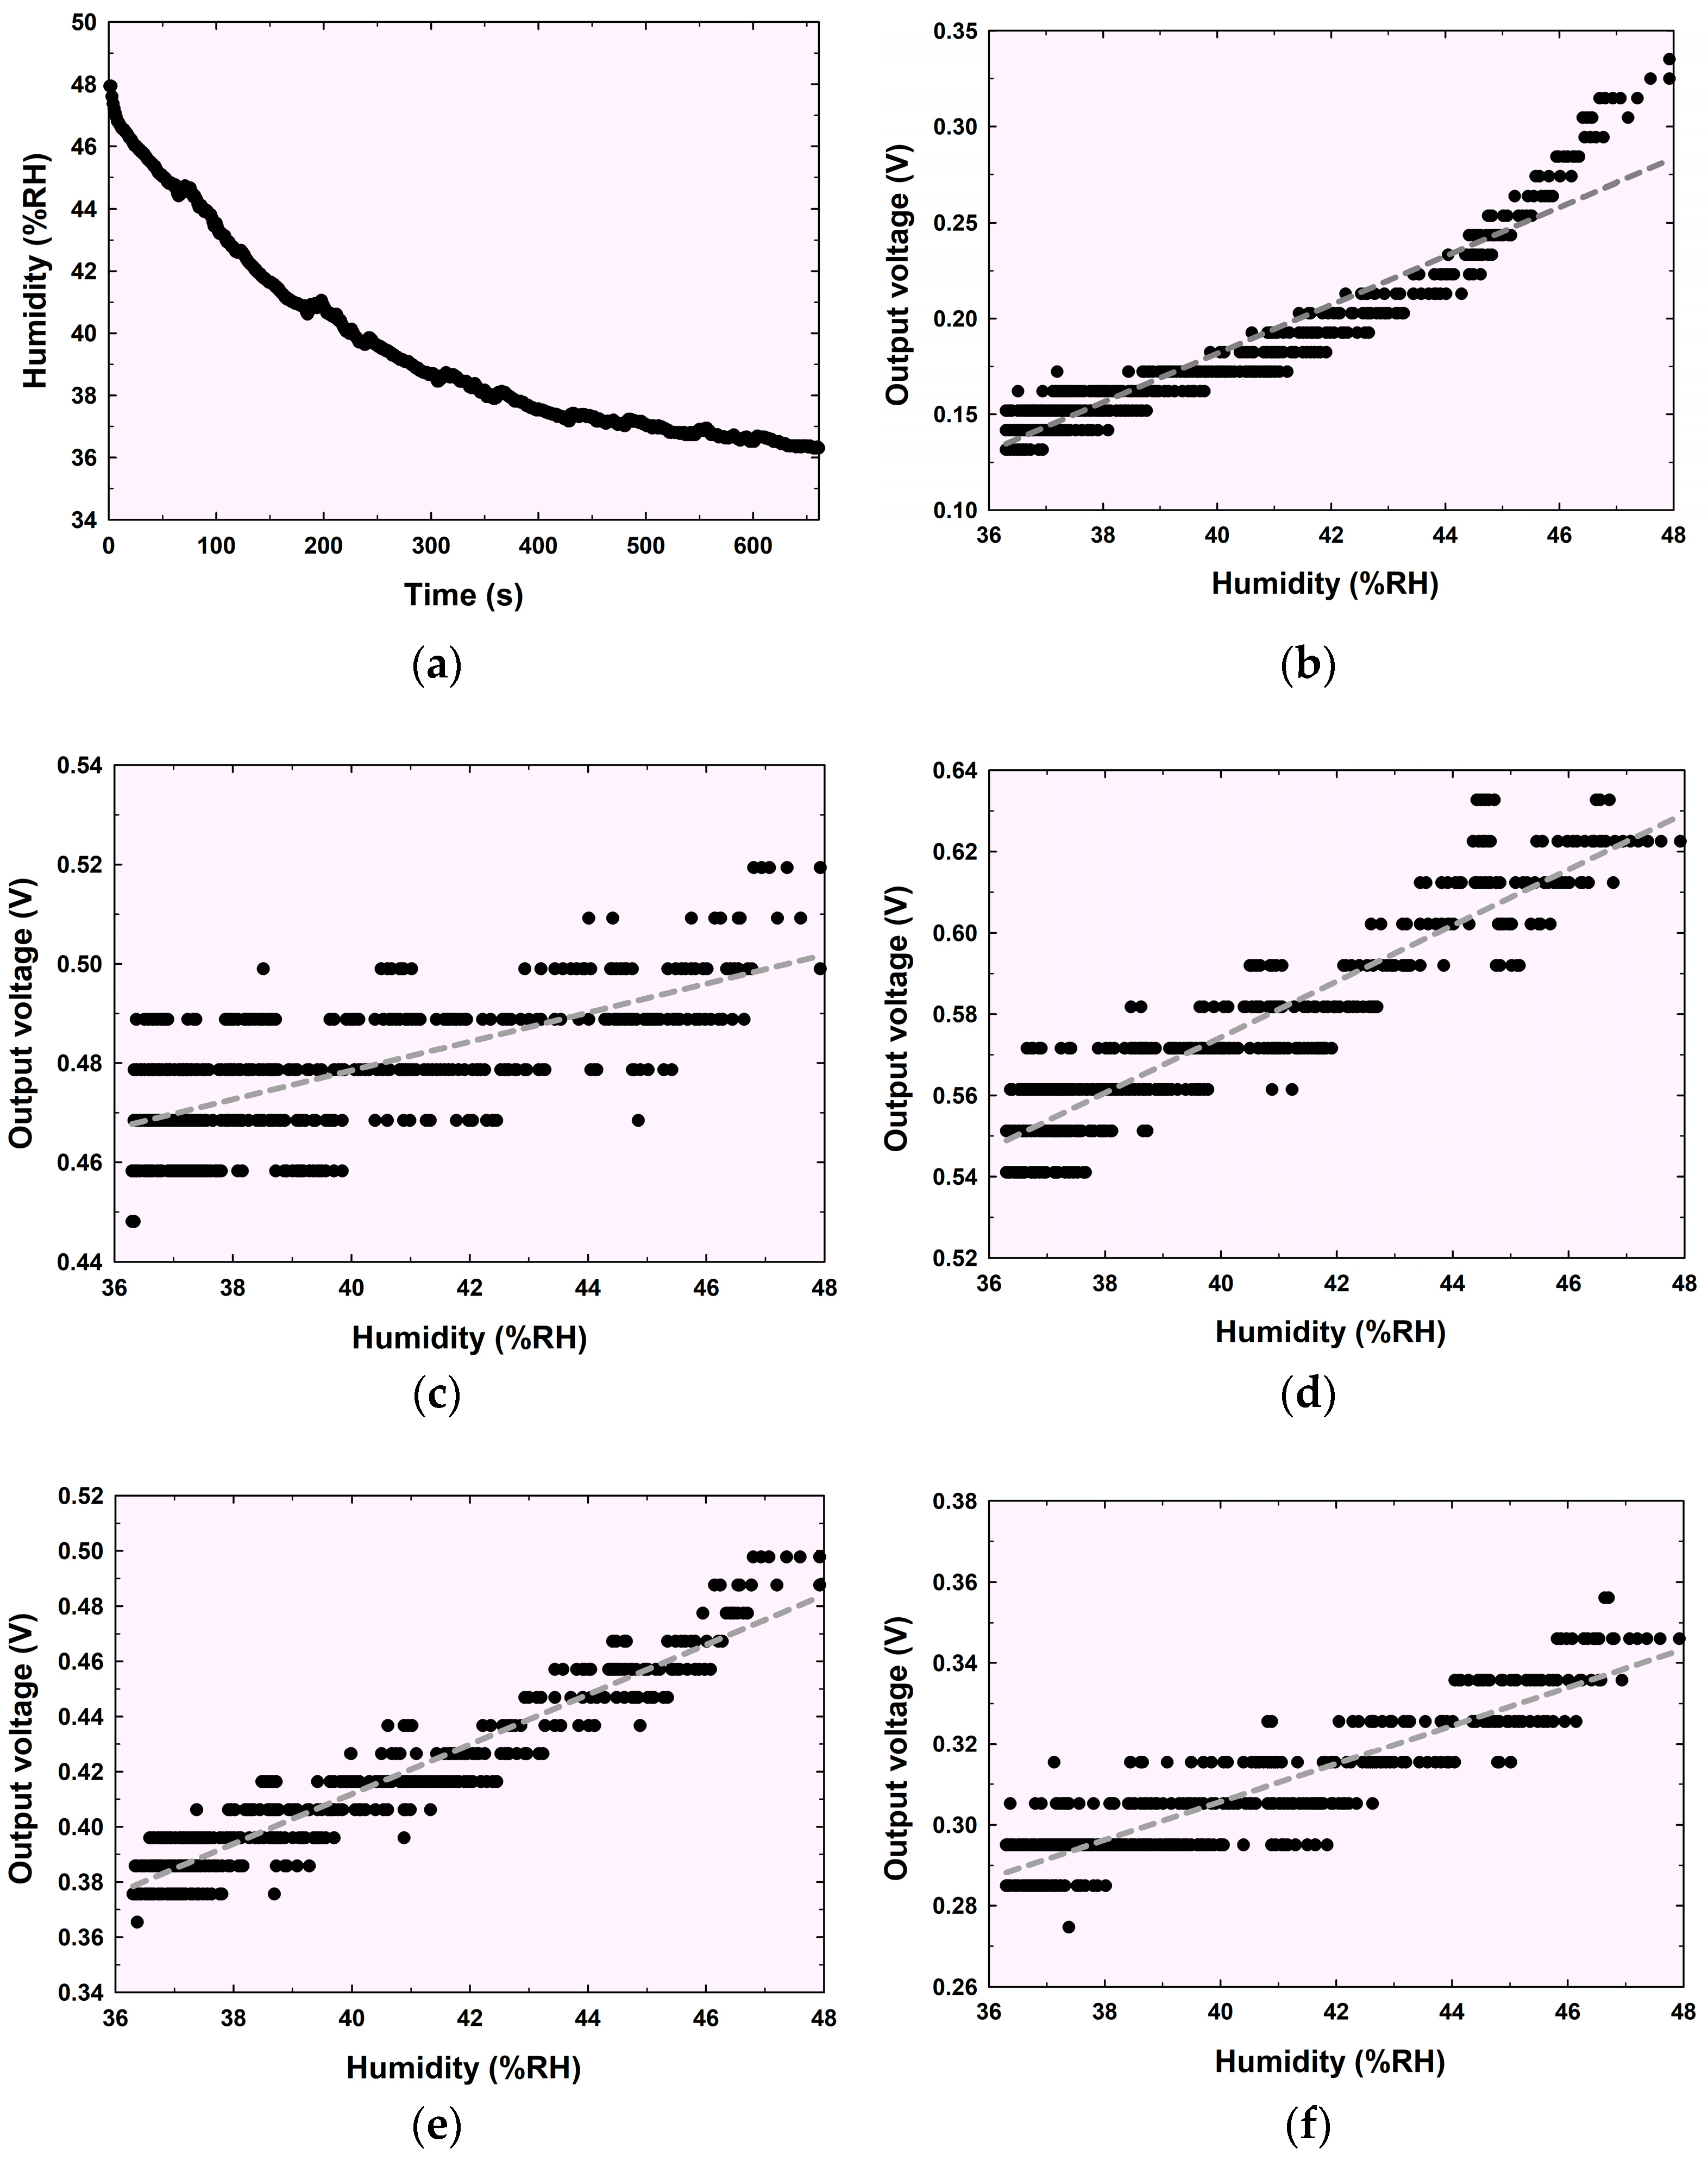
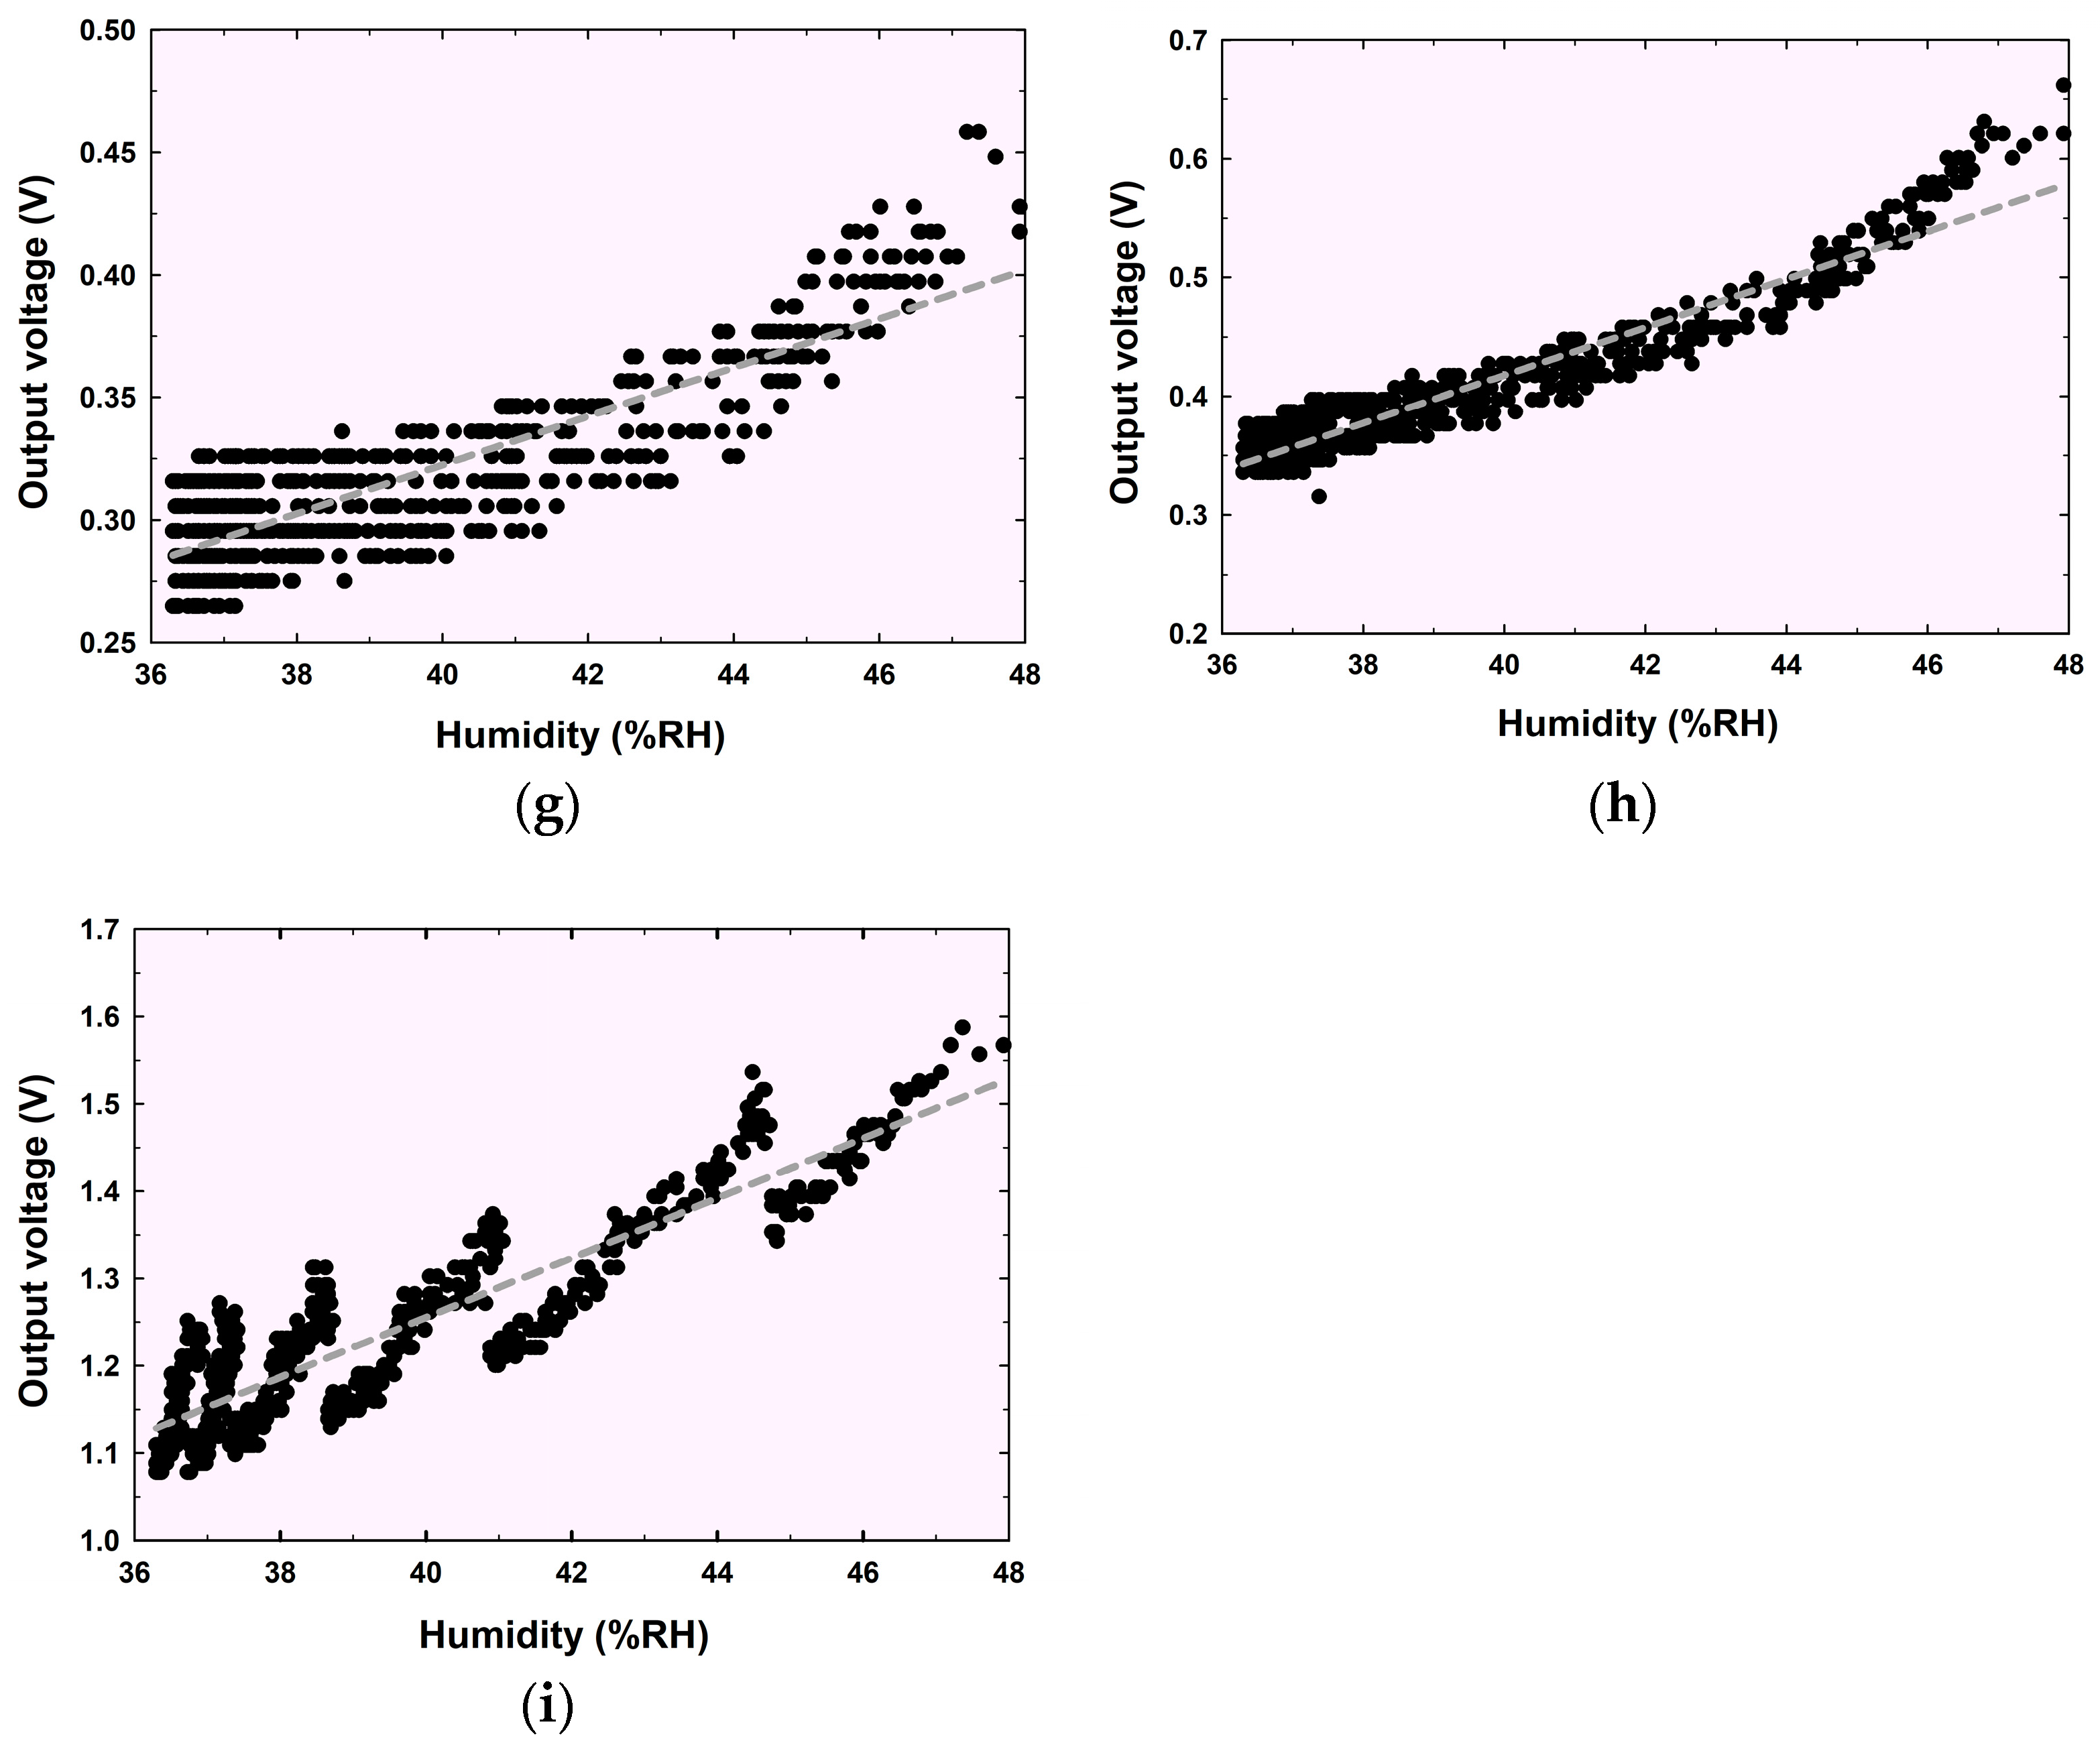
Testing the gas sensor’s response to variations in air humidity revealed a clear correlation: as the relative humidity increased, the sensor’s output voltage rose correspondingly, as shown in Figure 8. An analysis of the sensitivity (S) of each gas sensor, defined as S = Δ(Output voltage)/Δ(Humidity), demonstrated variations among the different sensors. The average sensitivities of the MQ135, MQ136, MQ137, MQ138, MQ139, MQ9, MQ6, and MQ3 sensors were calculated to be 0.013 V/%RH, 0.003 V/%RH, 0.007 V/%RH, 0.009 V/%RH, 0.005 V/%RH, 0.010 V/%RH, 0.020 V/%RH, and 0.034 V/%RH, respectively. The gray dashed line depicted in Figure 8b–i serves as a linear trend line, elucidating the correlation between humidity and output voltage. This representation effectively underscores how fluctuations in humidity levels correspond to variations in the output voltage of the sensor.

3.2. Gas Sensor Response

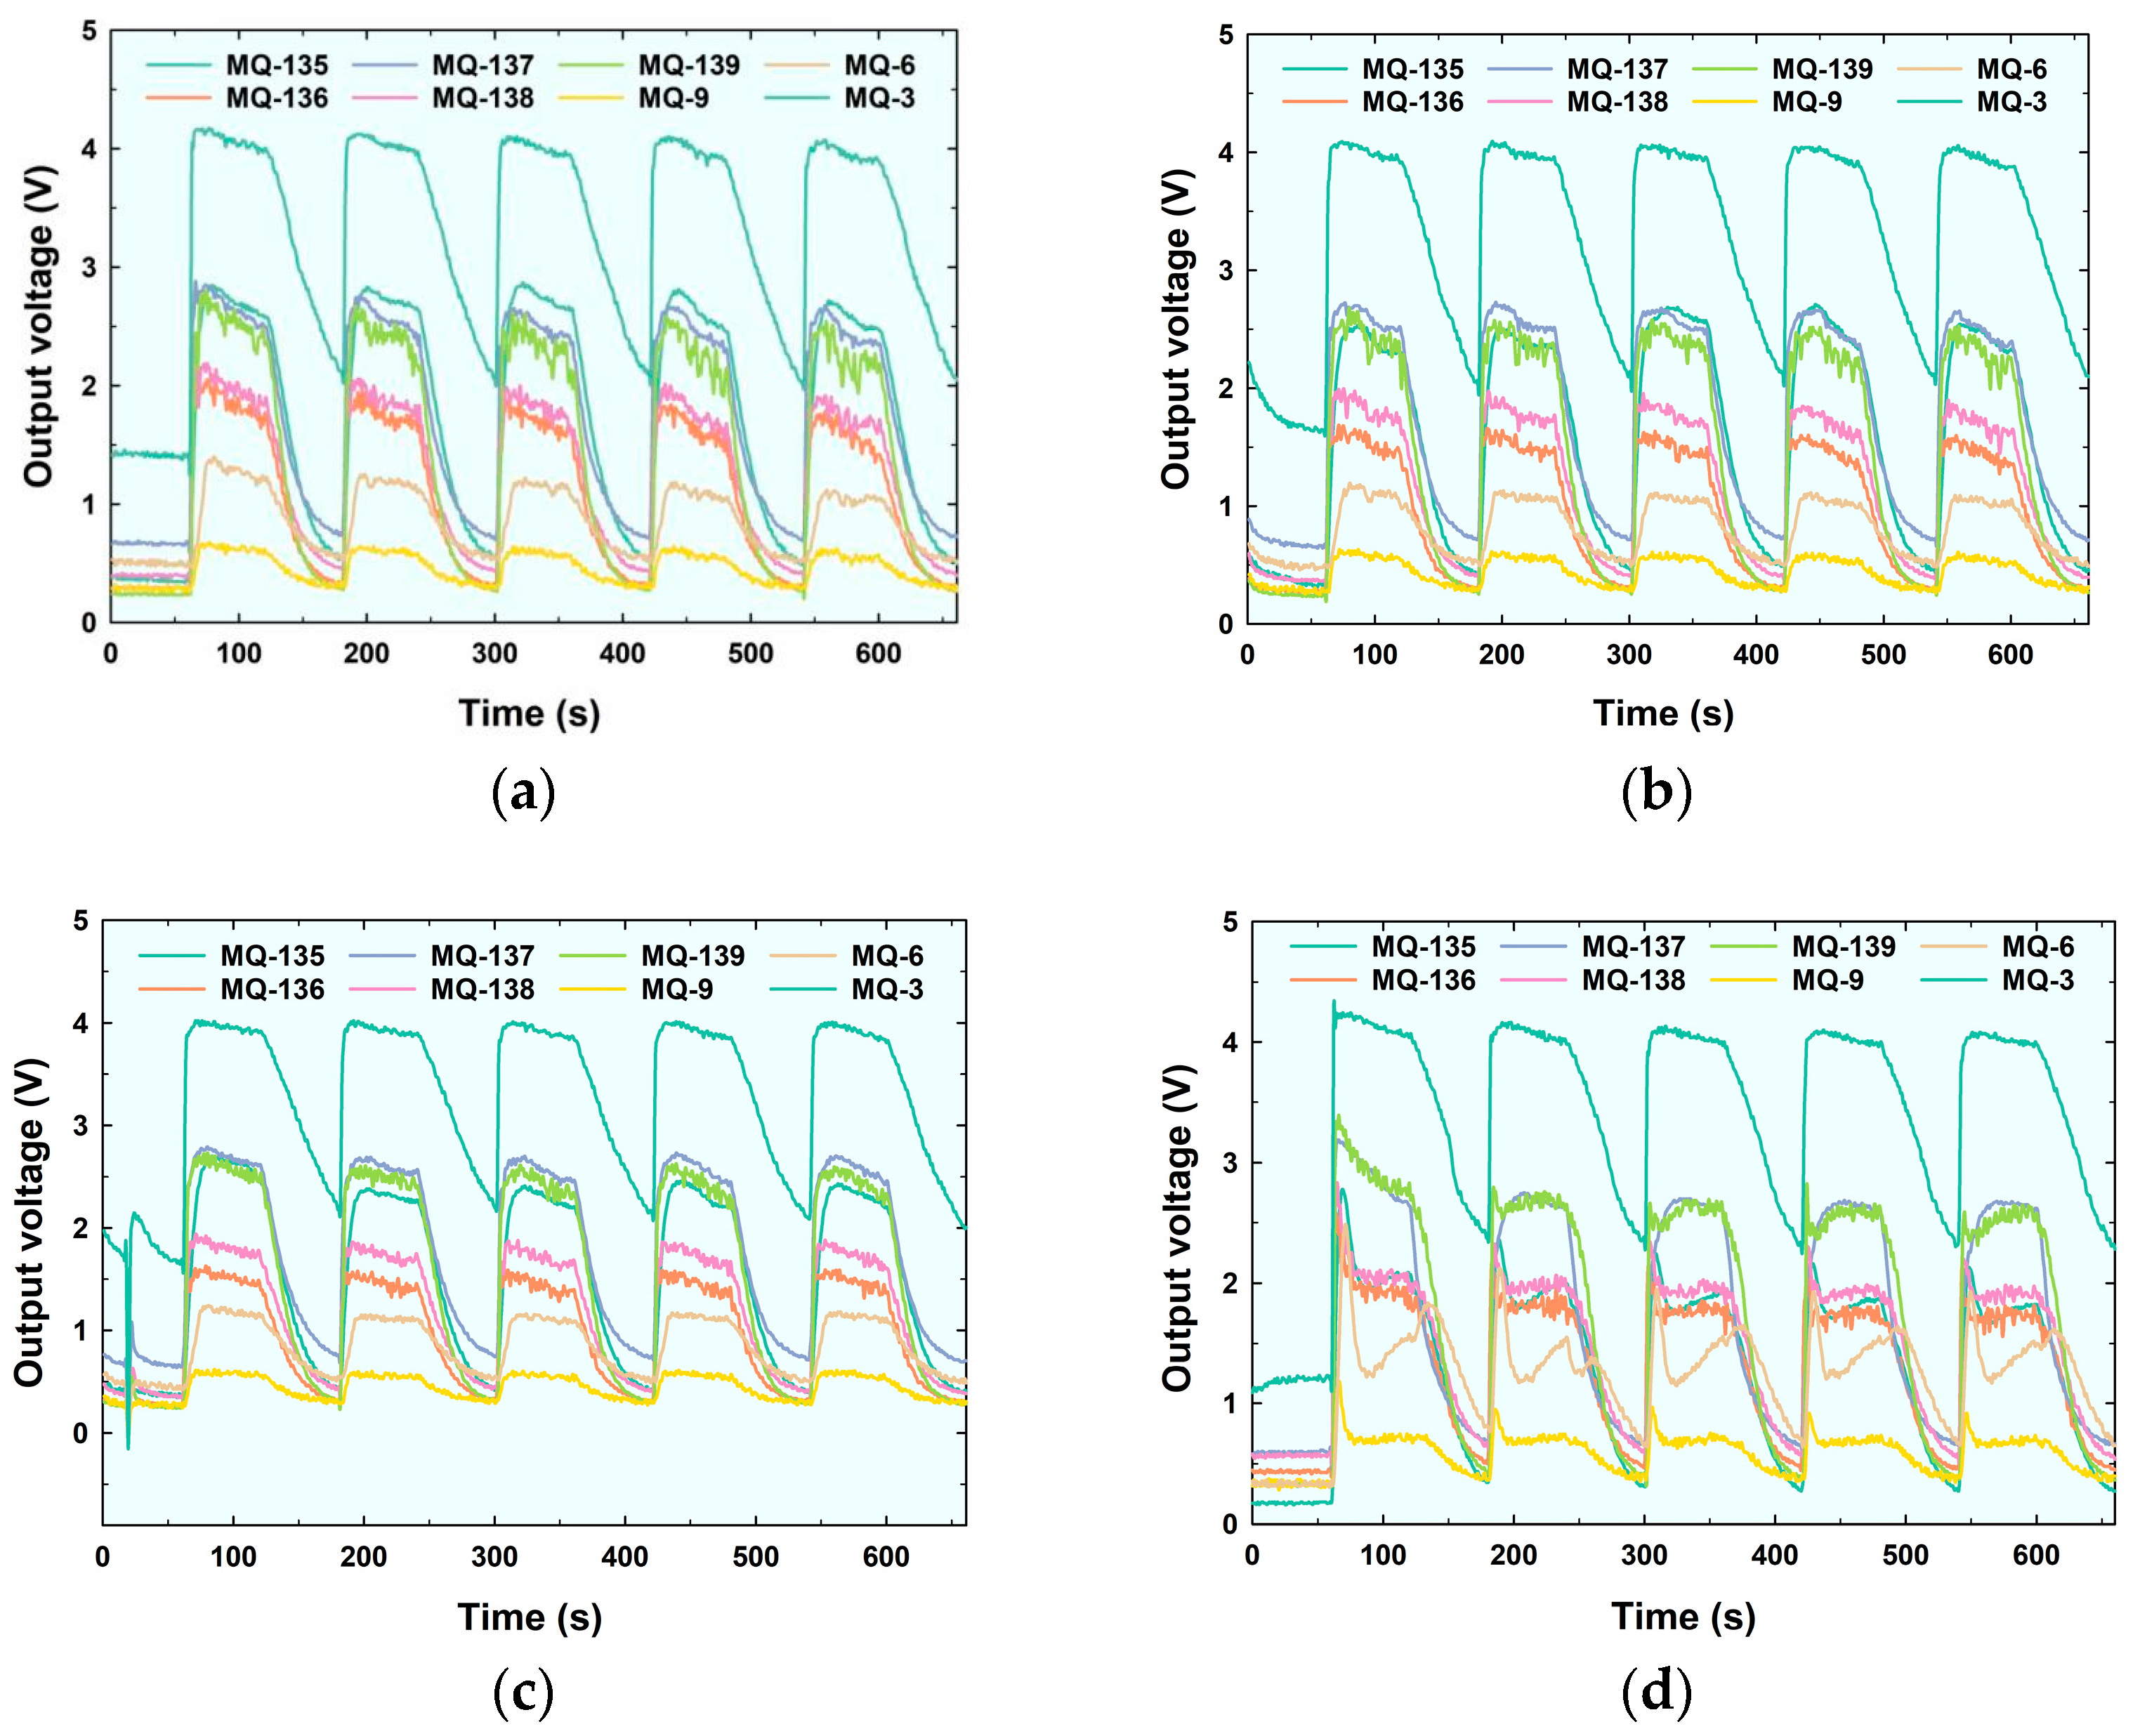
Figure 9 illustrates the gas response curves generated by the electronic nose for different local Thai craft spirits. The key differences among the samples—Koon, Onson, and Pandanus spirits—are evident in the output voltage waves, as shown in Figure 9a–c, respectively. The sensor output voltage level is continuously recorded throughout the measurement period to monitor the sensor’s response to the sample during the experiment. During each measurement, the signal strength increases in the response phase and decreases in the sensor recovery phase. The distinctive features observed during these phases enable the differentiation and identification of odors, either through manual feature extraction or by leveraging neural networks for feature learning. The signals obtained in Figure 7, Figure 8 and Figure 9 are interconnected; therefore, it is essential to control various environmental factors to minimize errors that may arise from incorrect data analysis. We must ensure that the alcohol concentration levels of the samples remain consistent, and humidity and temperature levels are carefully regulated to be uniform. This careful control helps mitigate the risk of inaccurate data analysis due to the experimental environment.

3.3. Maximum and Minimum Data Extraction from Gas Sensor Response

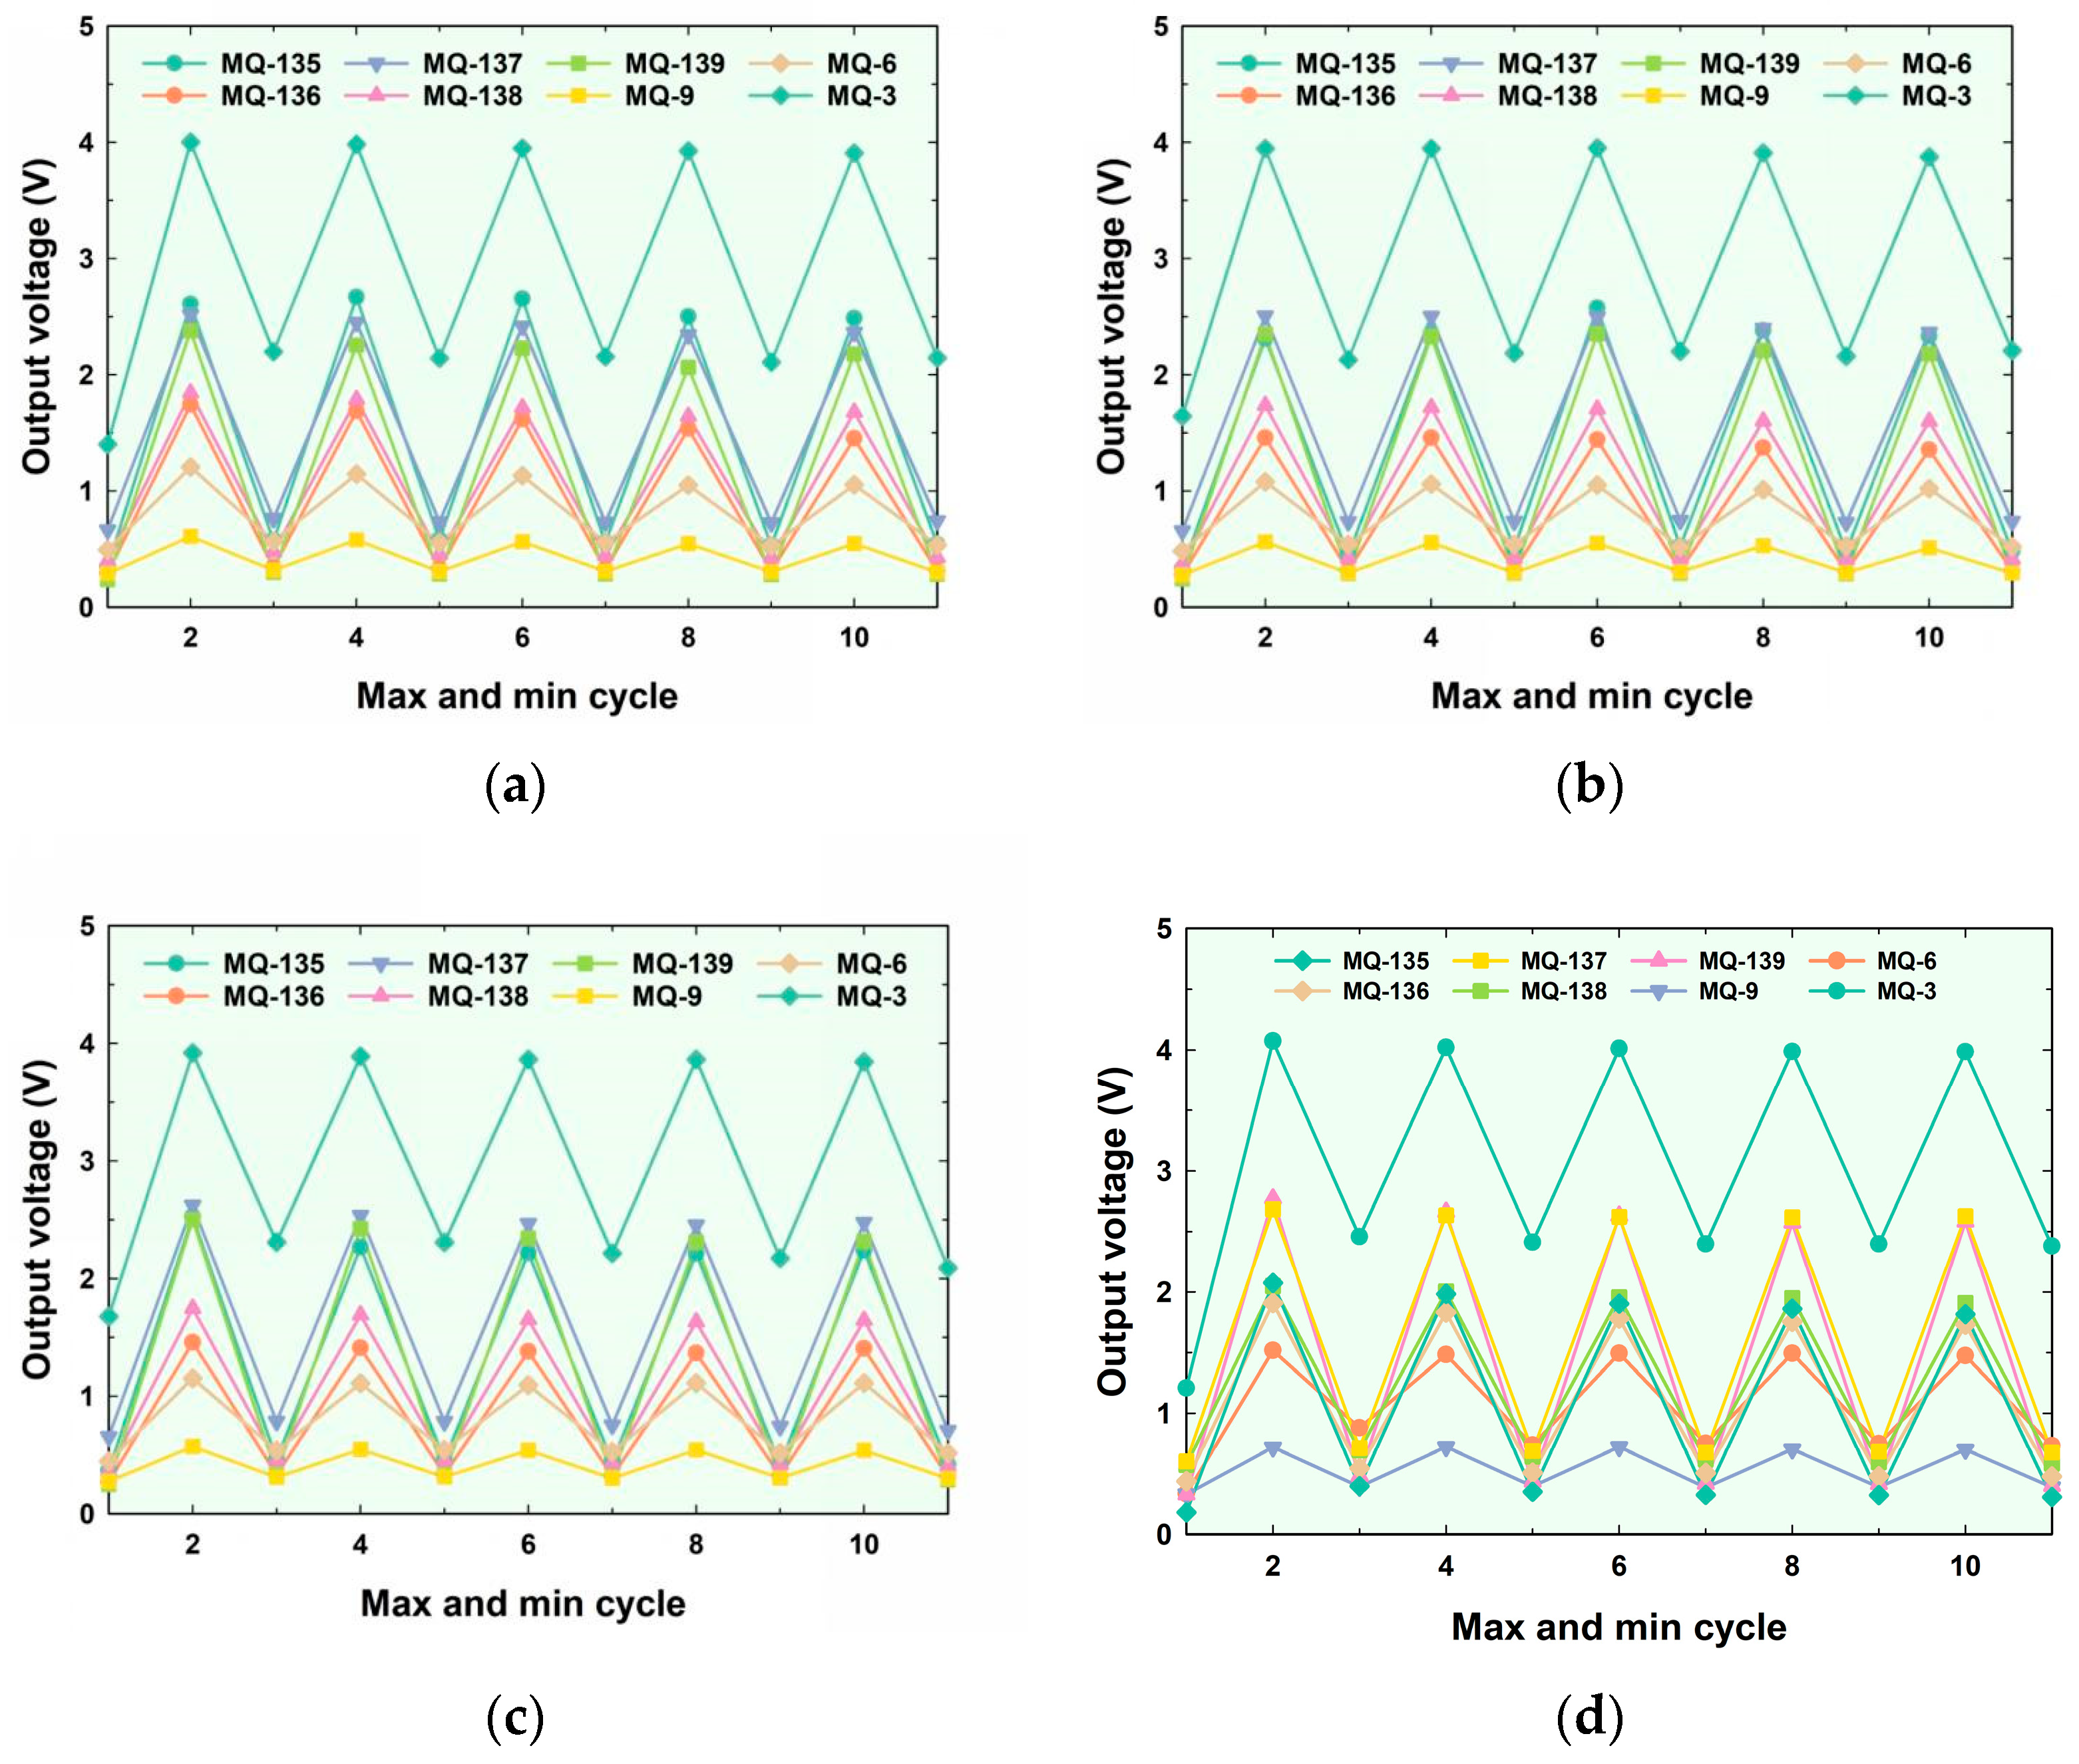
In our study, we concentrated on extracting fundamental features, specifically the maximum and minimum output voltages observed during the switching between the reference and sample environments, as illustrated in Figure 5b. To improve the accuracy, these voltage values were averaged across 10 neighboring data points. Due to the gradual shift in output voltage over time for both the reference and sample, it was crucial to correct for baseline drift as the experiment progressed, to ensure the integrity of the analysis. The distinct characteristics of the Koon, Onson, and Pandanus spirits are clearly reflected in the output voltage waveforms, as shown in Figure 10a, Figure 10b, and Figure 10c, respectively.

3.4. Classification

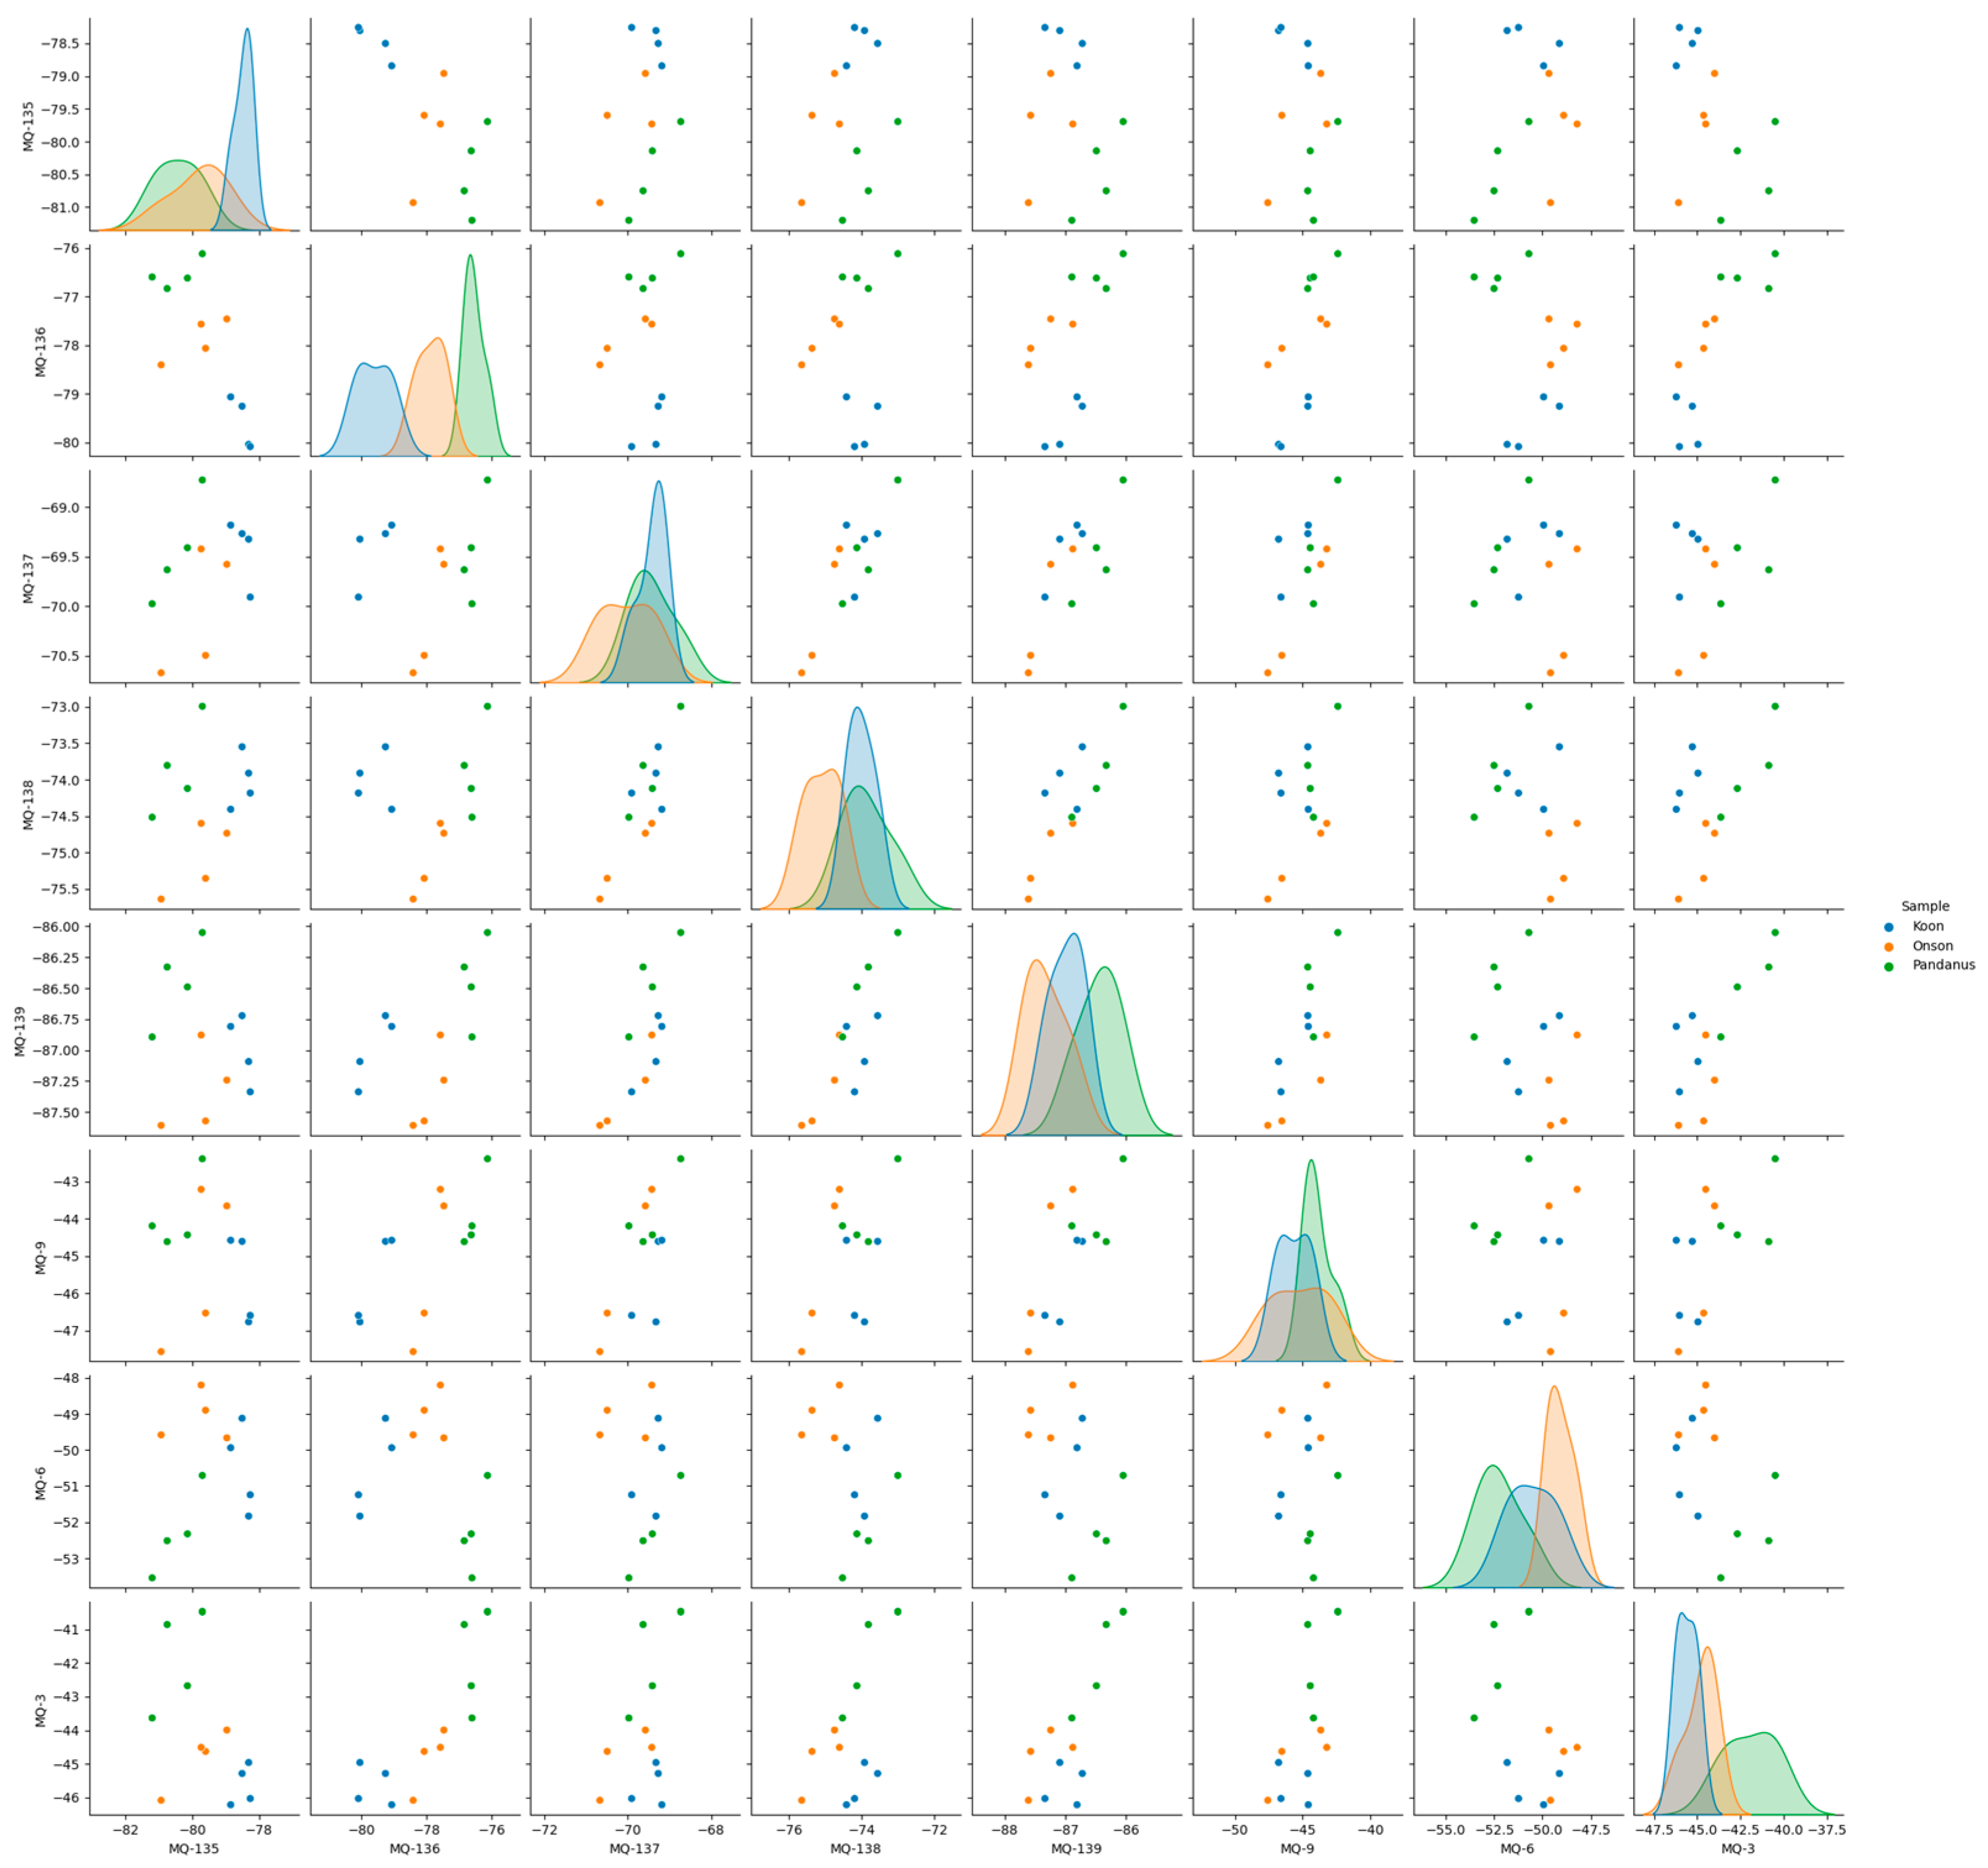
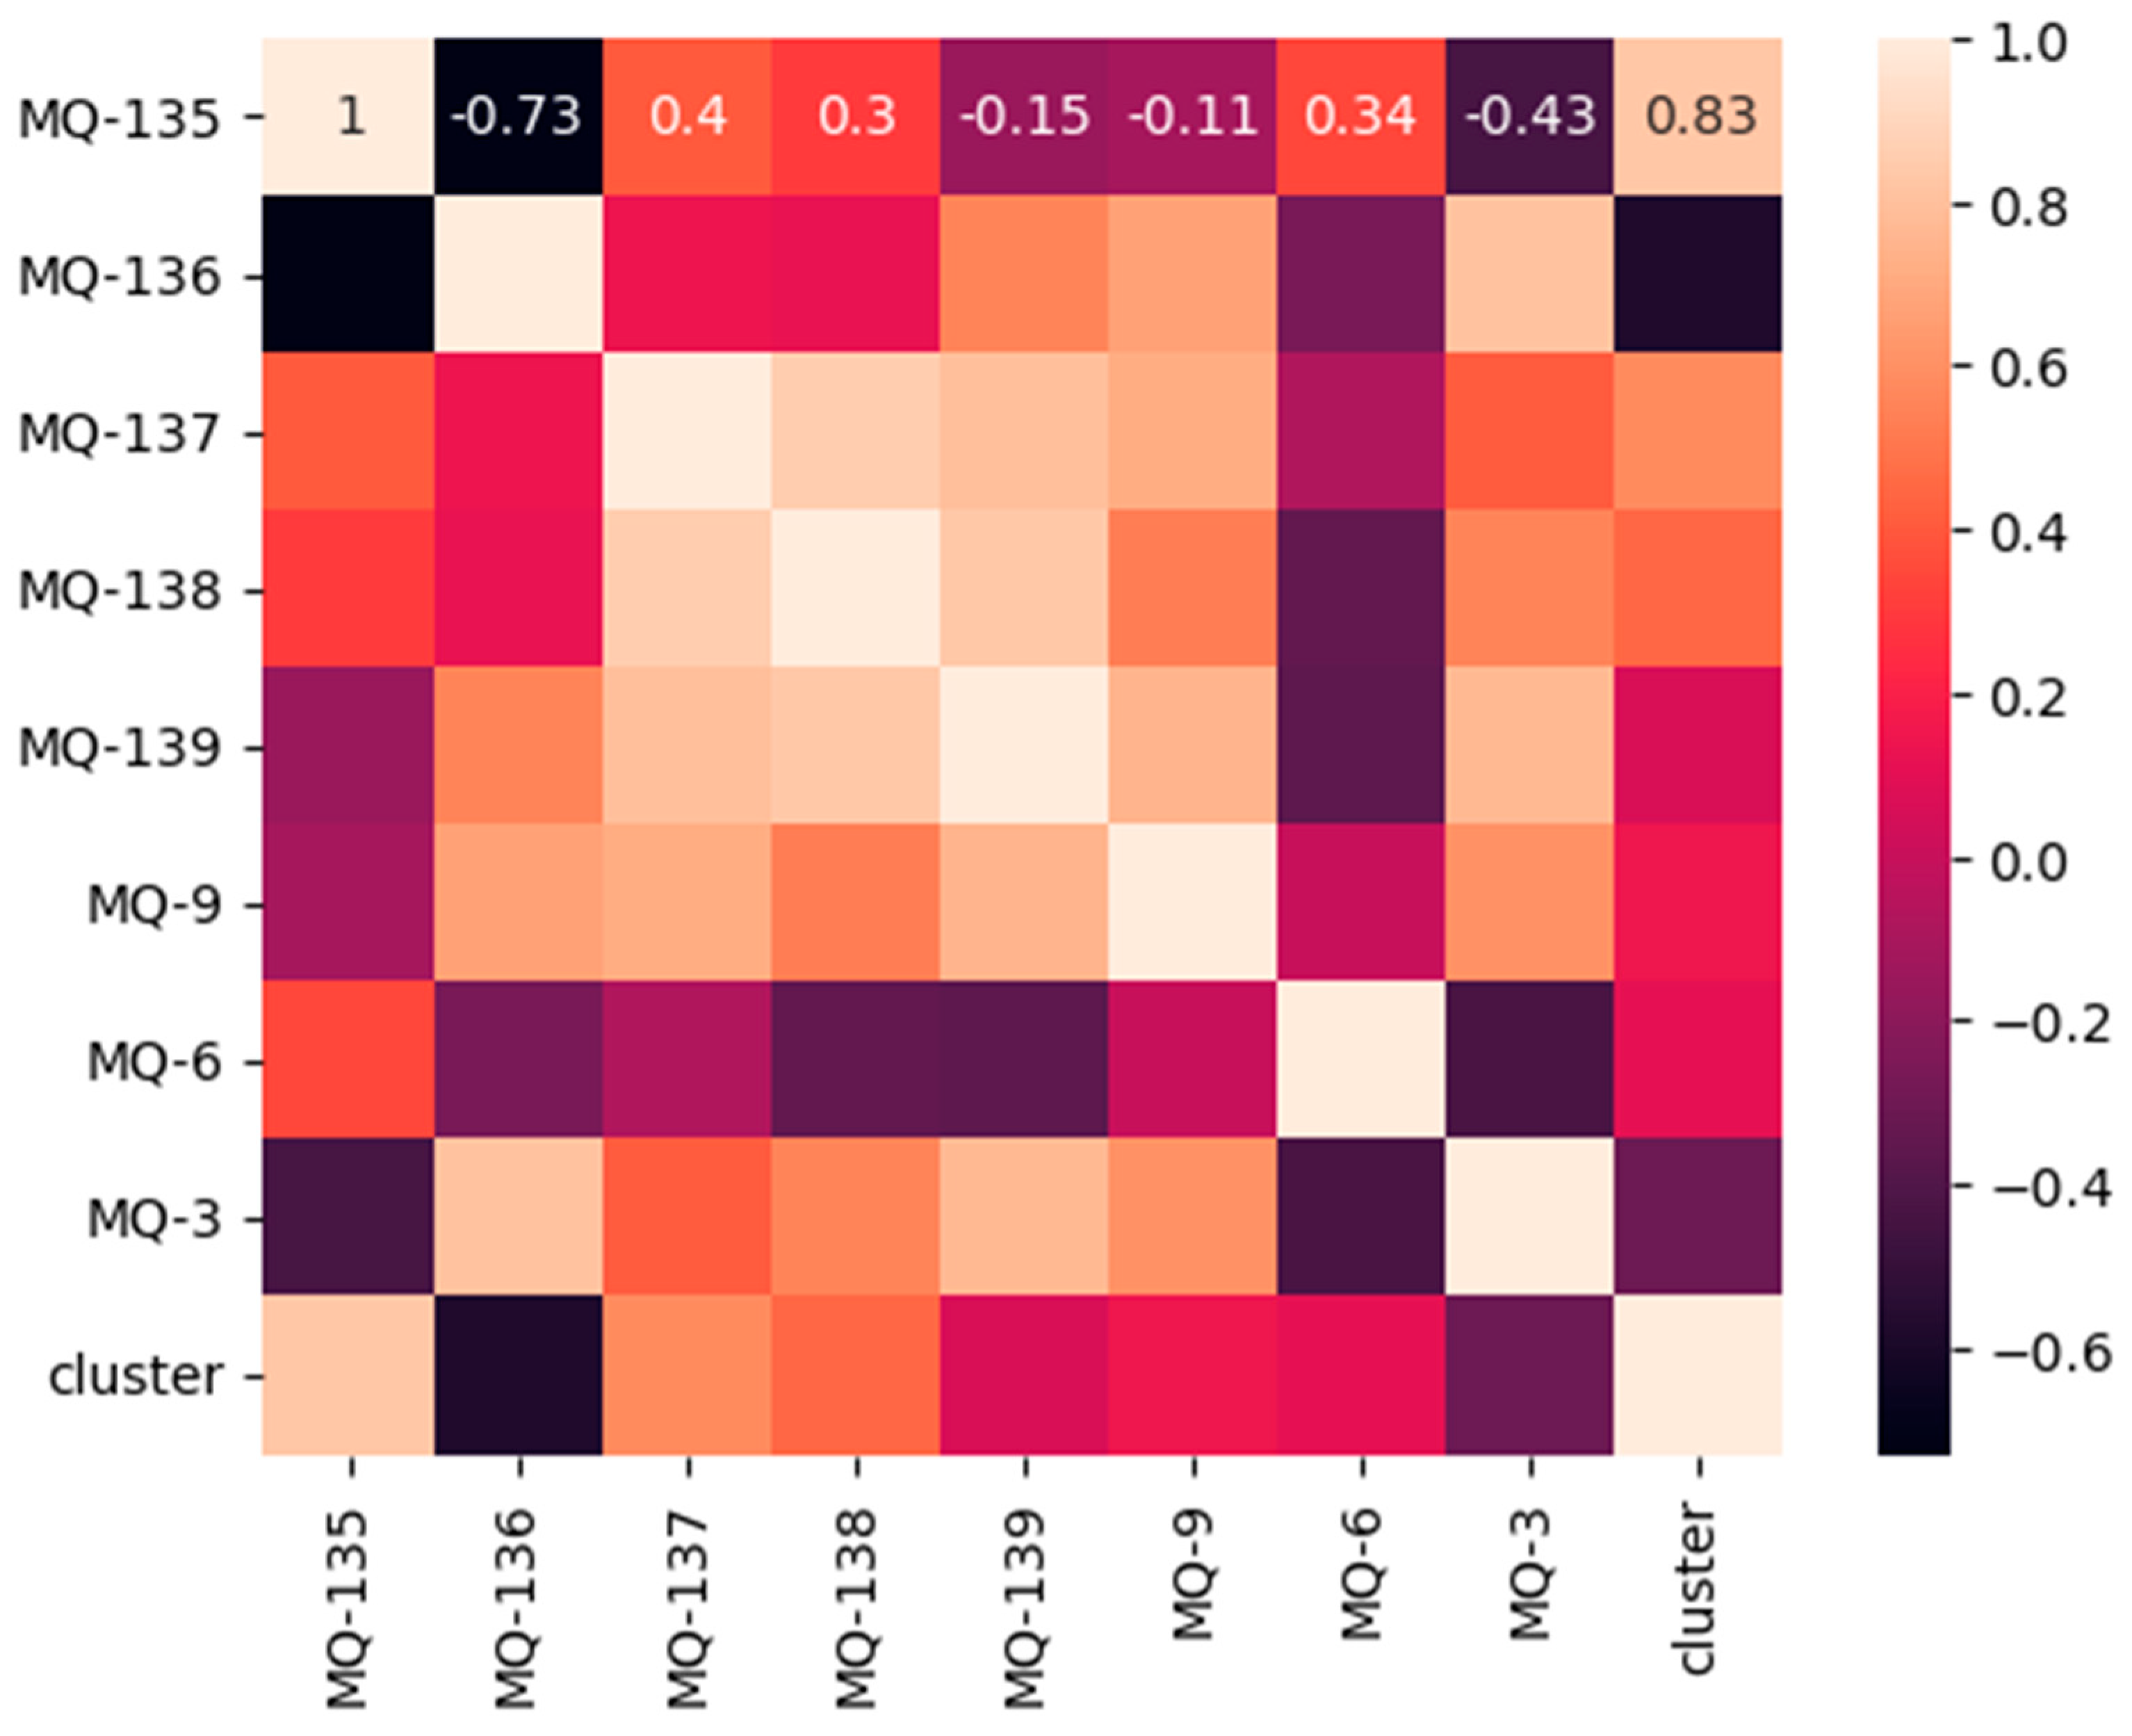
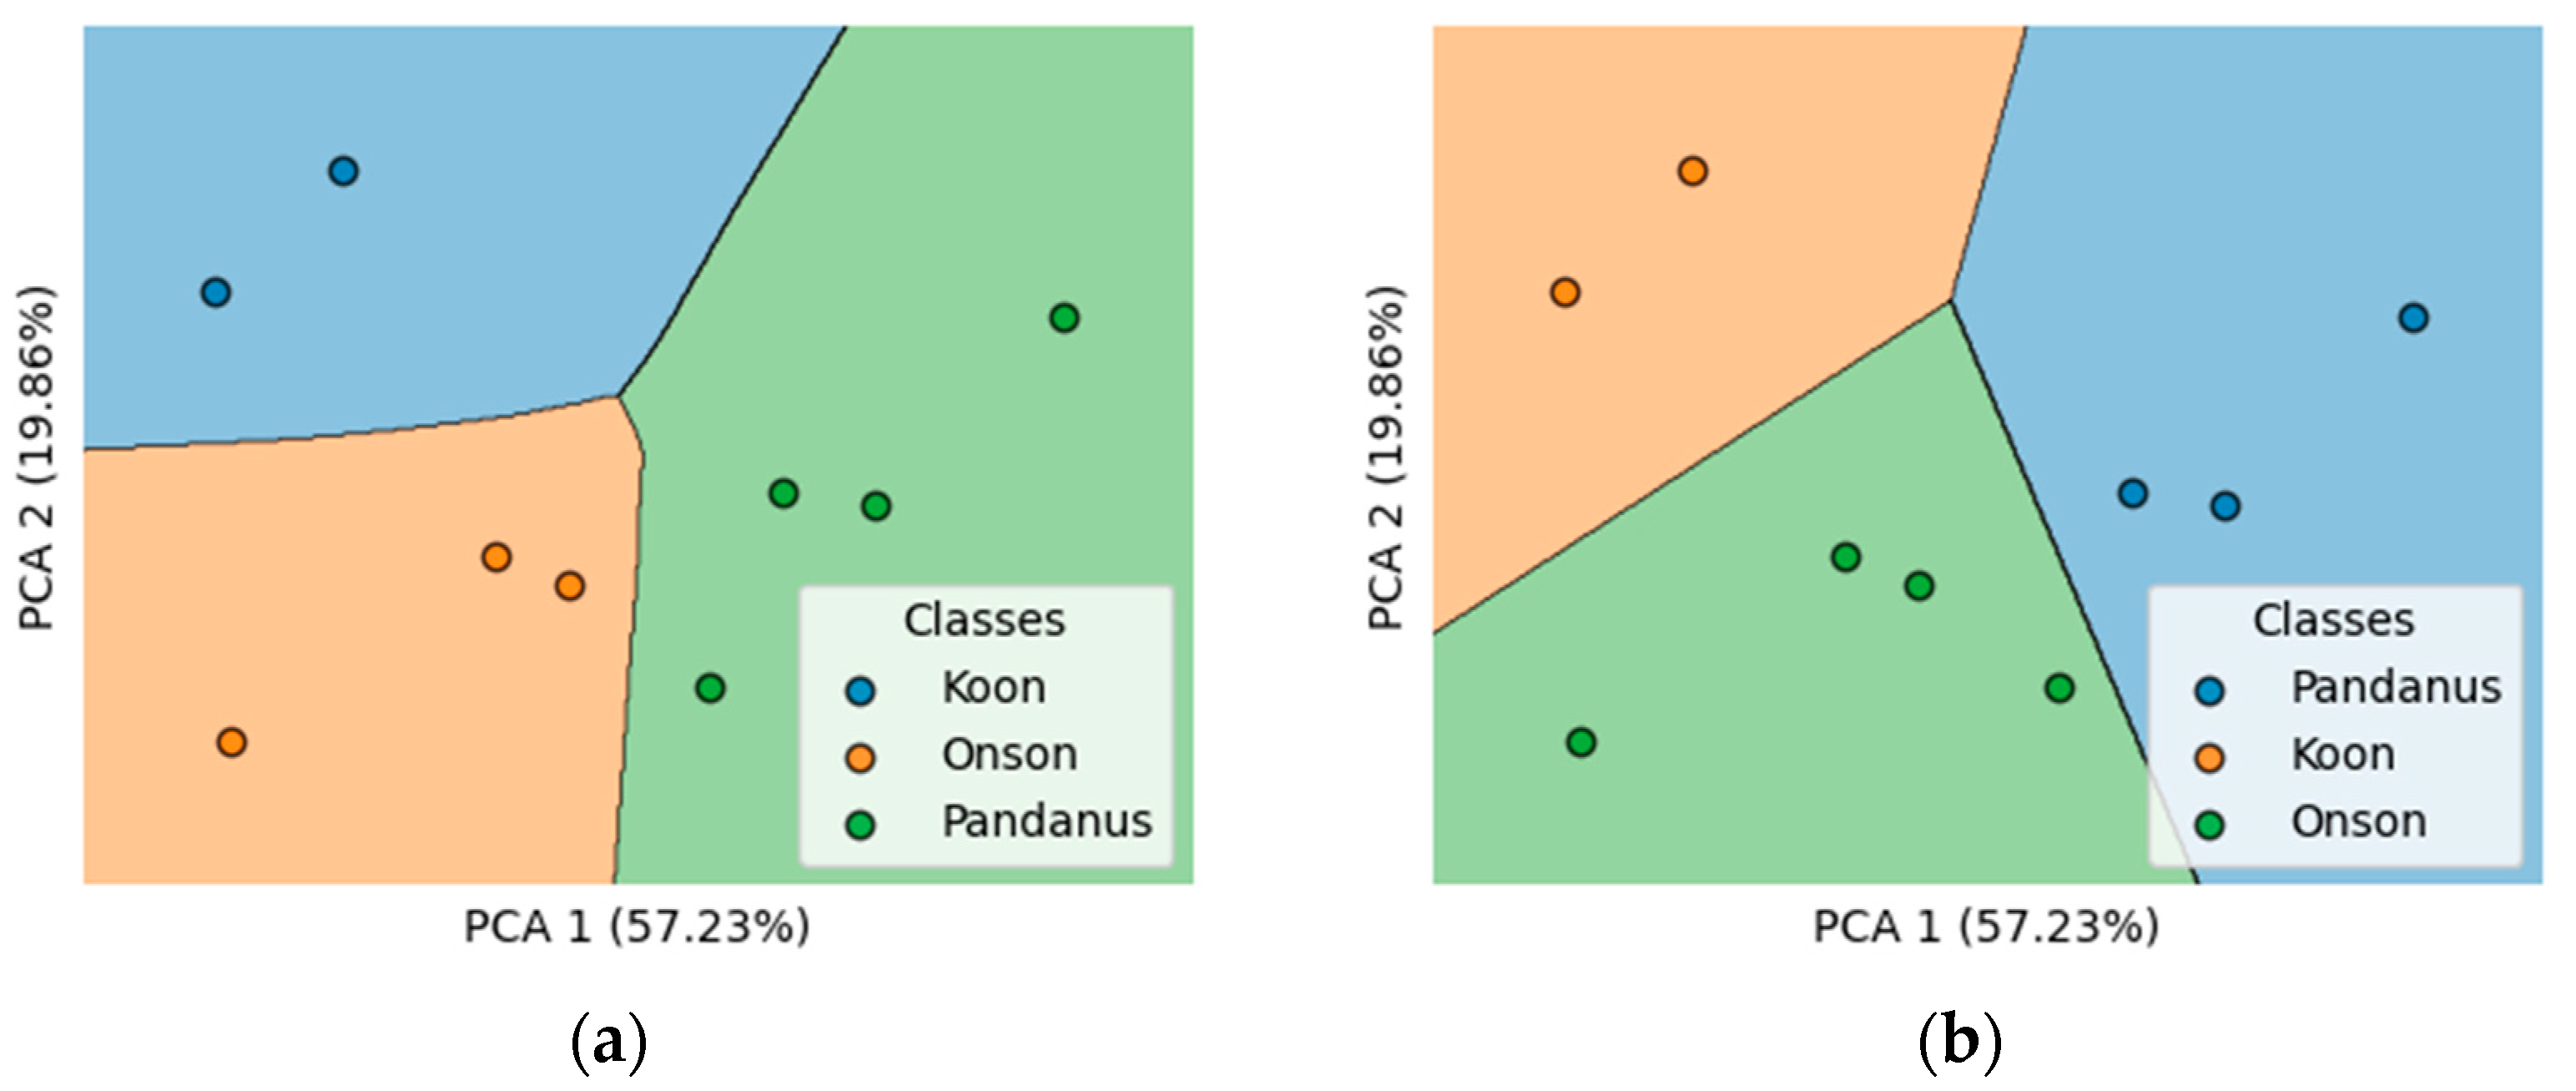
The overview of pairwise relationships (pairplot) and the detailed numerical correlations (heatmap) of gas sensor responses are illustrated in Figure 11 and Figure 12, respectively. Figure 11 is used to create a grid of scatter plots that shows the relationships between all pairs of the percentage-baseline-corrected difference between the sample and reference voltages of gas sensors. It also includes histograms or kernel density plots along the diagonal to show the distribution of individual gas sensors. Each scatter plot in the grid displays the relationship between two gas sensors, while the diagonal shows the distribution of each gas sensor individually. This plot is useful for detecting patterns, relationships, and outliers between variables. These insights are crucial for accurately grouping and classifying the distilled spirits. Our analysis indicates that the MQ-135 and MQ-136 gas sensors are highly compatible with other sensors in distinguishing between the three types of spirits. This is because no overlapping data points occur between the three samples. The MQ-136 sensor in particular demonstrated more distinct segmentation patterns than the MQ-135 when paired with other sensors. As a result, we selected the MQ-136 as the primary sensor for conducting olfactory liquor separation analysis. Leveraging the feature extraction data from the MQ-136 sensor, along with other gas sensors integrated into the electronic nose, we conducted an analysis to group and classify three types of traditional Thai distilled spirits using a MLP. Figure 12 is used to visualize data in a matrix format where values are represented by color intensity. This is particularly useful for visualizing the correlation matrix of the percentage-baseline-corrected difference between the sample and reference voltages of gas sensors. Each cell in the heatmap shows a value, and the color gradient represents the magnitude of that value. In the case of a correlation matrix, it shows how strongly each pair of variables is related. Colors vary according to the strength of the correlation (e.g., dark black for strong negative, dark red for strong positive). The graph clearly indicates that the responses of the MQ-136 and MQ-135 sensors exhibit the strongest negative correlation, whereas the responses of the MQ-137, MQ-138, and MQ-139 sensors demonstrate the most pronounced positive correlation. When data from all eight sensors were processed through the MLP algorithm to measure and distinguish the various types of local Thai craft spirits, we achieved an impressive accuracy of 100%. Despite this success, we faced challenges in visualizing a 2D decision boundary diagram due to the inherent high dimensionality of the dataset. To mitigate this issue, we employed PCA as a technique for dimensionality reduction, effectively reducing the number of input features to two. This strategic adjustment not only facilitated the visualization of the decision space in two dimensions but also allowed for a comprehensive evaluation of the performance of both the MLP and K-means clustering algorithms. By analyzing the decision boundaries in this reduced feature space, we could gain valuable insights into the classification process and the distinct characteristics of the local Thai craft spirits.
Figure 13a,b illustrate the decision regions in 2D, derived from the eight input features of the sensor array. The data were initially reduced to two dimensions using PCA before being processed by the MLP and K-means algorithms, respectively. Upon processing the reduced input features through MLP and K-means, we observed that the MLP achieved an impressive accuracy of 100% in distinguishing the various types of local Thai craft spirits, whereas the K-means demonstrated a lower accuracy of 72.23%. This phenomenon arises from the inherent characteristics of k-means clustering, where data points tend to shift toward a single centroid during the clustering process. It was observed that this grouping resulted in an error related to one particular data point. Consequently, this leads to reduced accuracy compared to the MLP method. However, we noted that utilizing eight input features requires a substantial number of sensors and entails additional steps to identify the optimal features, which in turn increases both the costs and processing time. Our findings indicate that by pinpointing a specific pair of sensors capable of effectively distinguishing the data, we can significantly reduce both the number of sensors employed and the computational steps required, all while maintaining a high level of analytical accuracy.
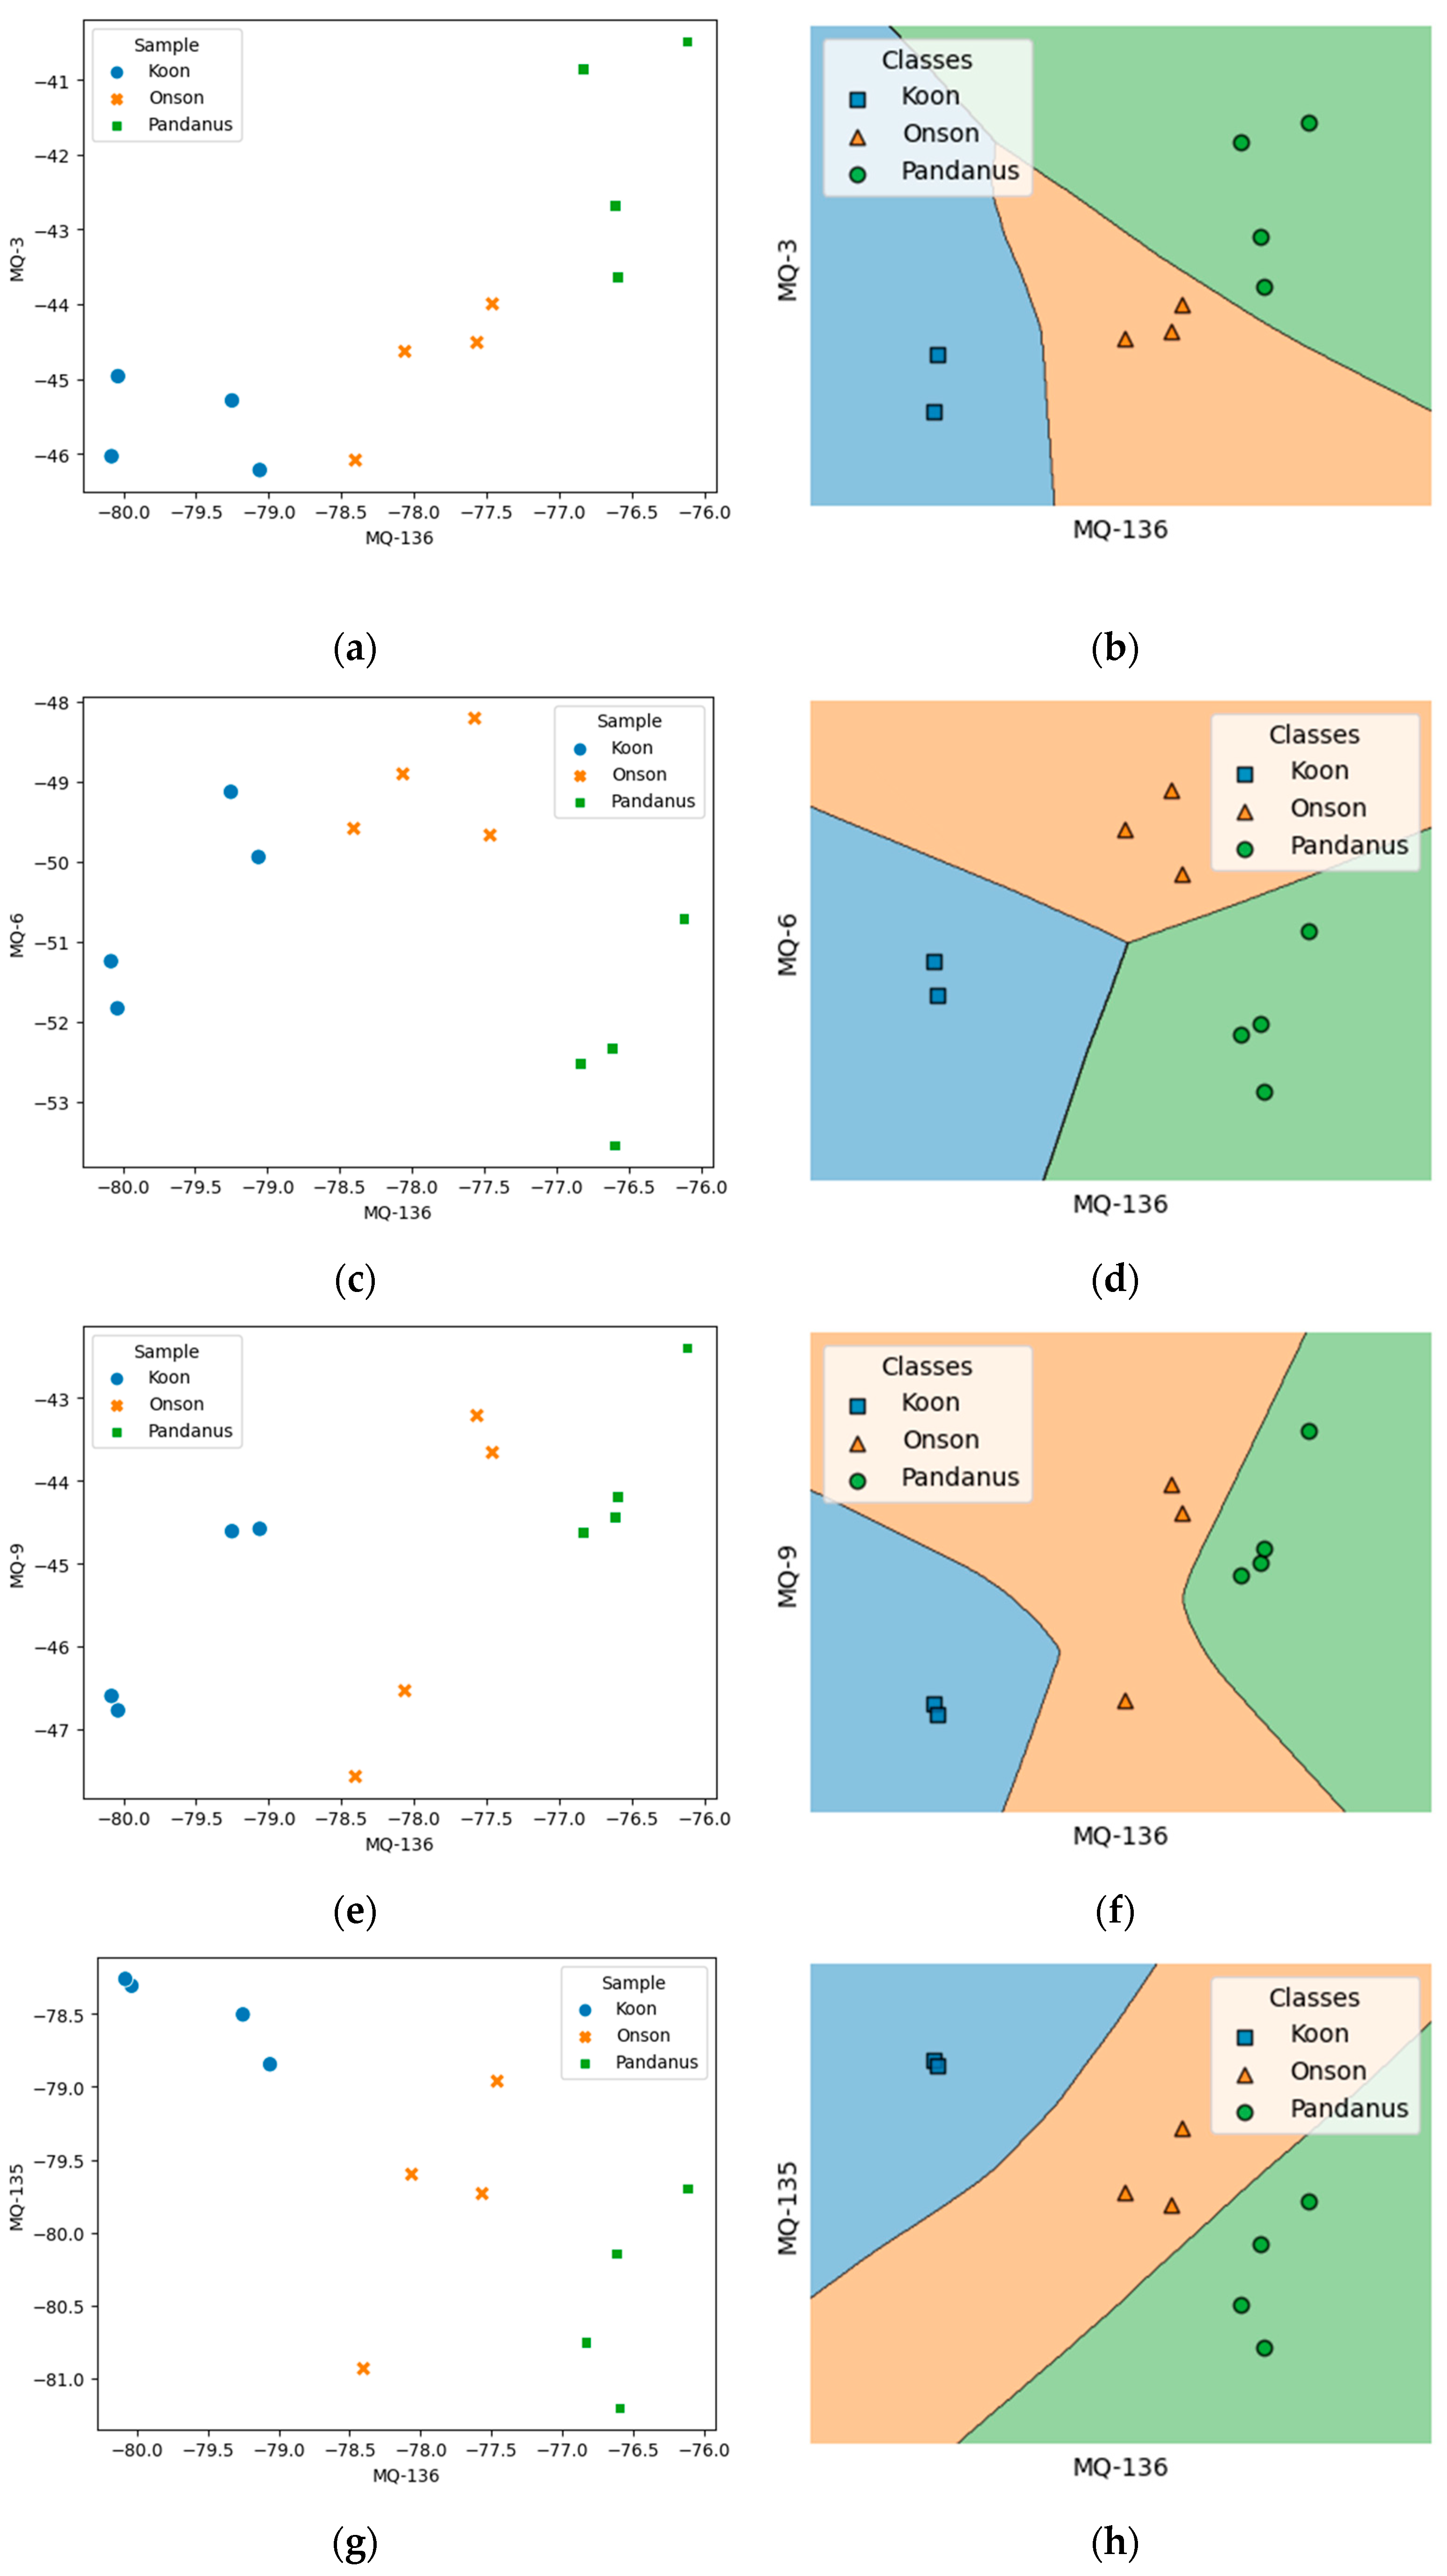
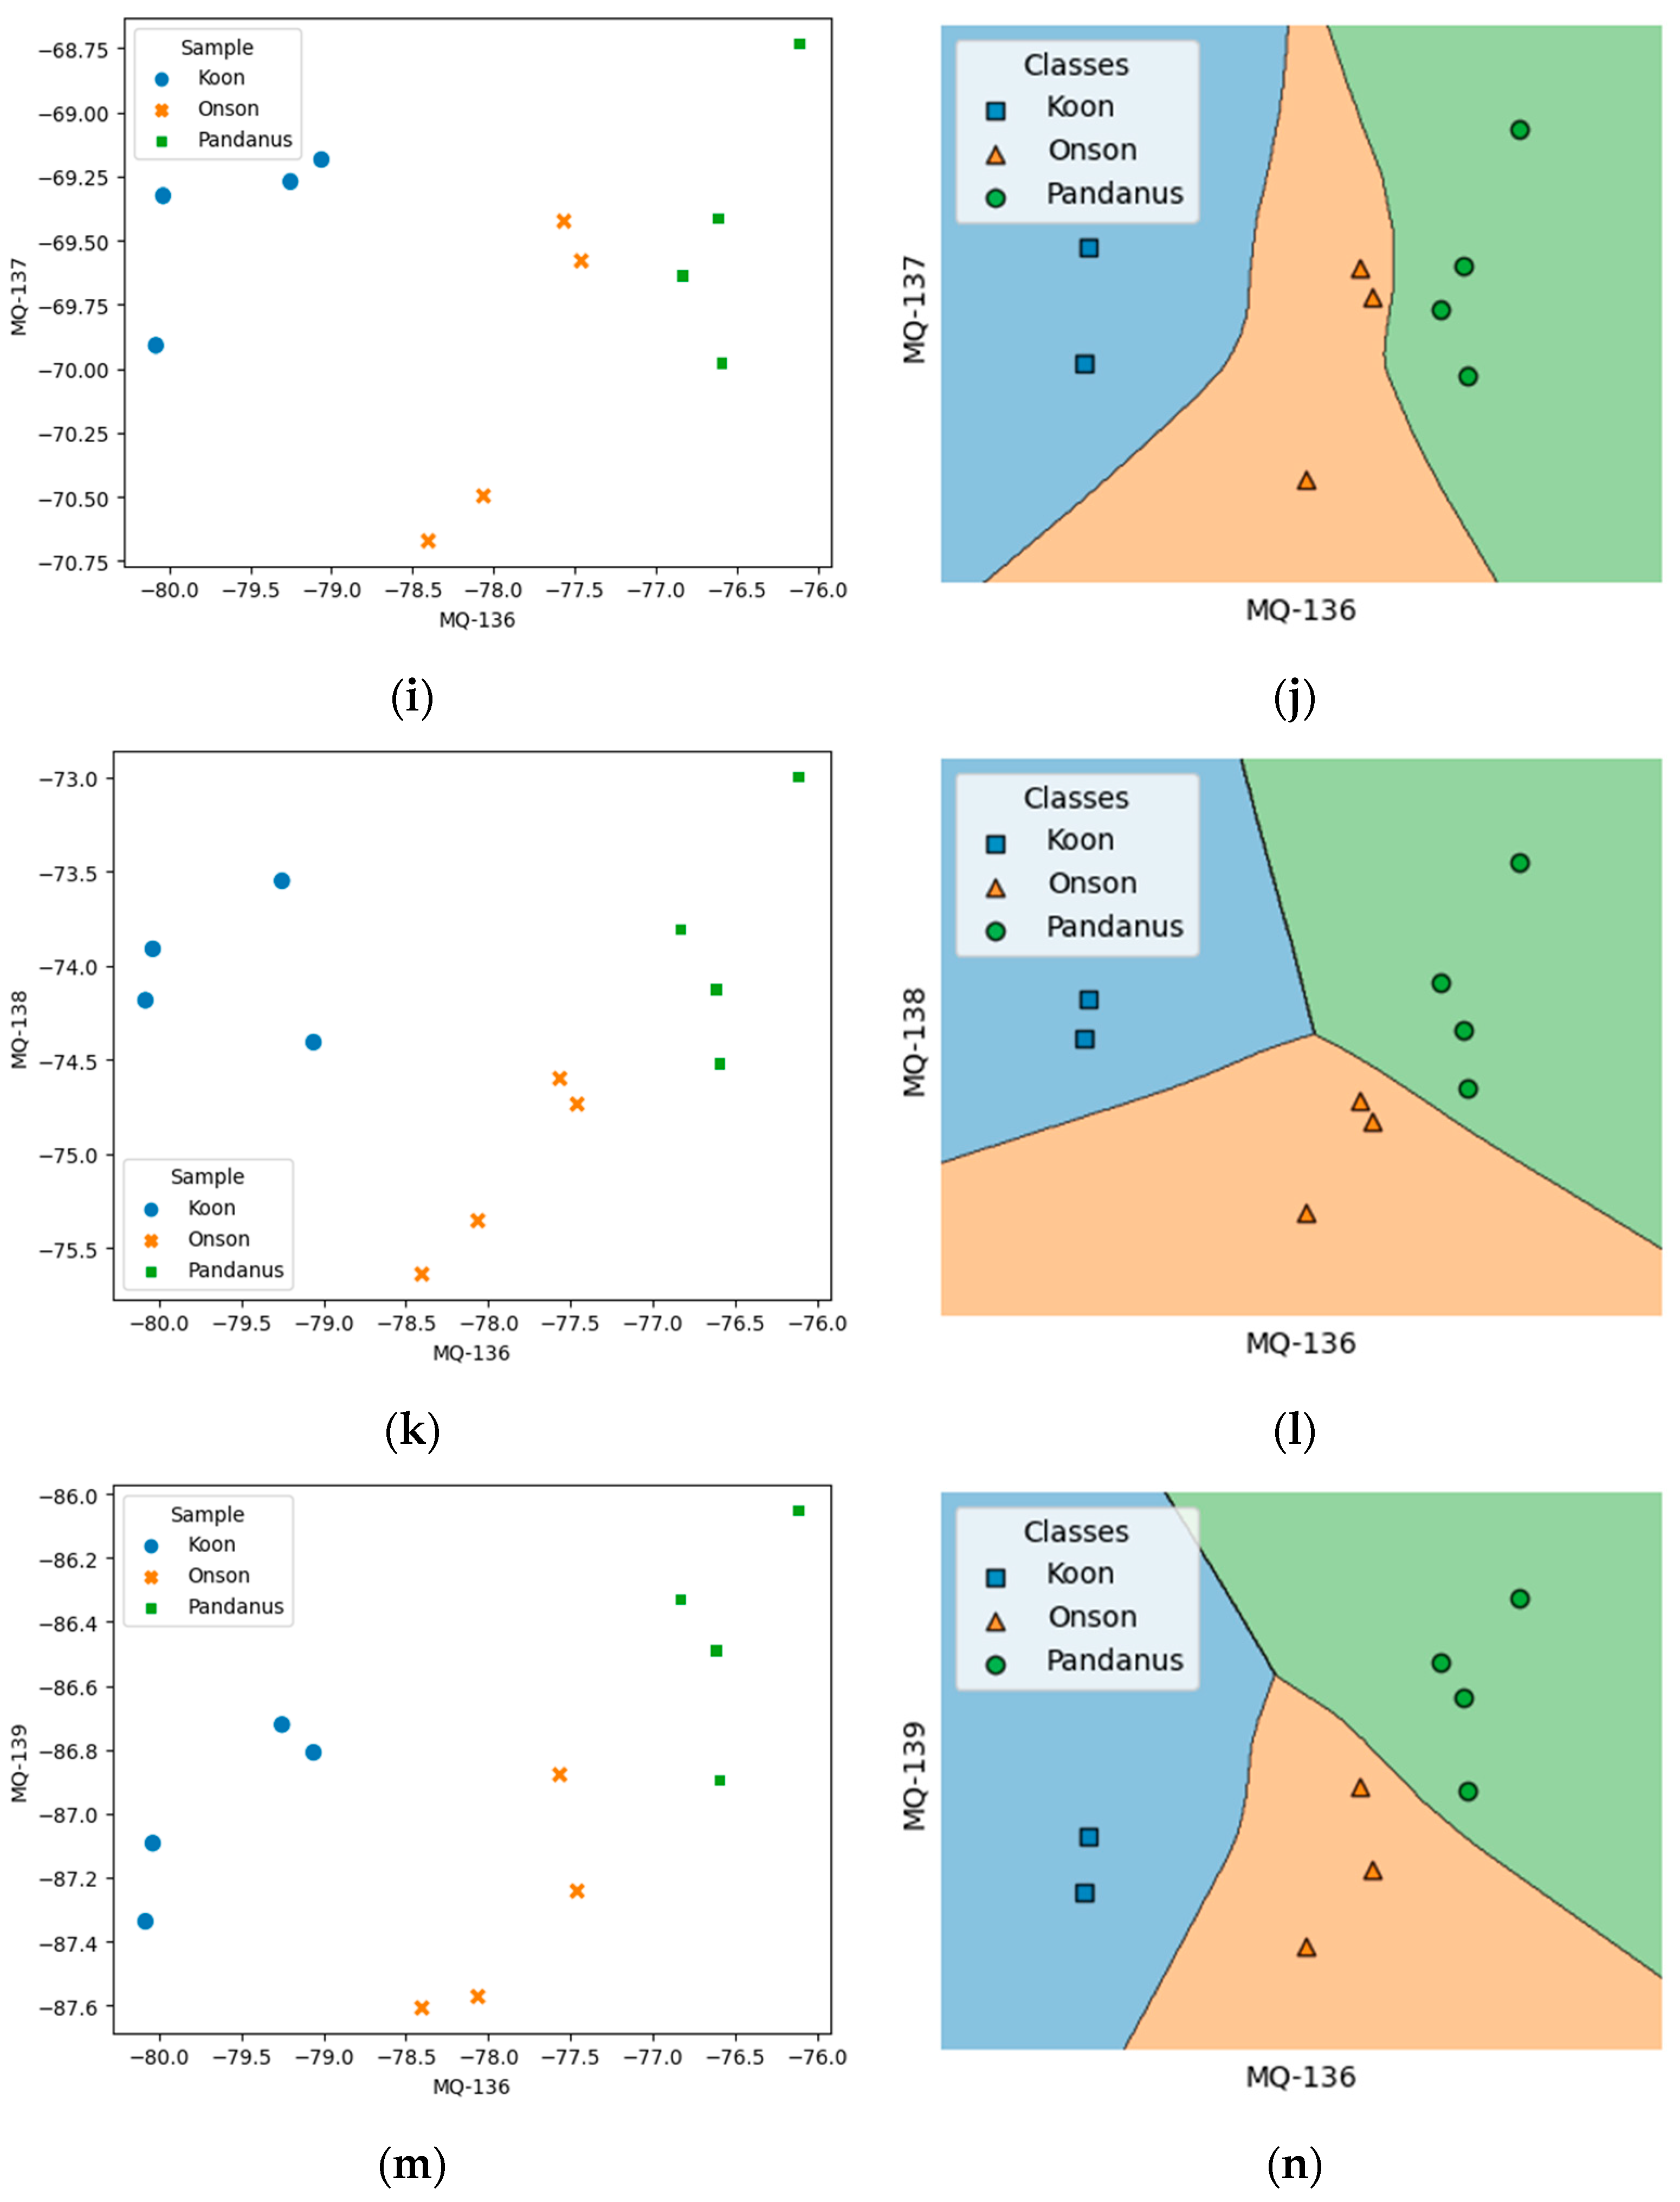
Figure 14a–n illustrate scatter plots both before and after standard scaling, showcasing the classification of local Thai craft spirits. In general, datasets often contain features with varying scales, which can lead to imbalanced weight calculations. To rectify this and ensure consistency, it is essential to scale features to a common range. Standard scaling (Z-score normalization) achieves this by adjusting each feature to have a mean of zero and a standard deviation of one. While this process reduces the magnitude of the values, it preserves the distribution of the underlying information. Figure 14b,d,f,h,j,l,n display the distribution of data obtained from the Koon, Onson, and Pandanus craft spirits. Notably, the classification achieved 100% accuracy across all datasets when using the MQ-136 sensor. Upon analyzing the segmentation positions and areas within each sensor pair, distinct patterns emerge. Typically, along the horizontal axis, the datasets are ordered from Koon to Onson, and ultimately to Pandanus. This arrangement is likely due to the variations in voltage levels recorded by the MQ-136 sensor, which increase depending on the type of spirit. Specifically, the Koon craft spirit exhibits the highest transformation rate, followed by Onson, with Pandanus showing the least. Therefore, it is anticipated that the electronic nose developed in this study will significantly enhance the measurement, control, and classification of local Thai craft spirits. The accuracy of these classifications is expected to be further refined through feature extraction and deep learning techniques, particularly with an MLP approach.
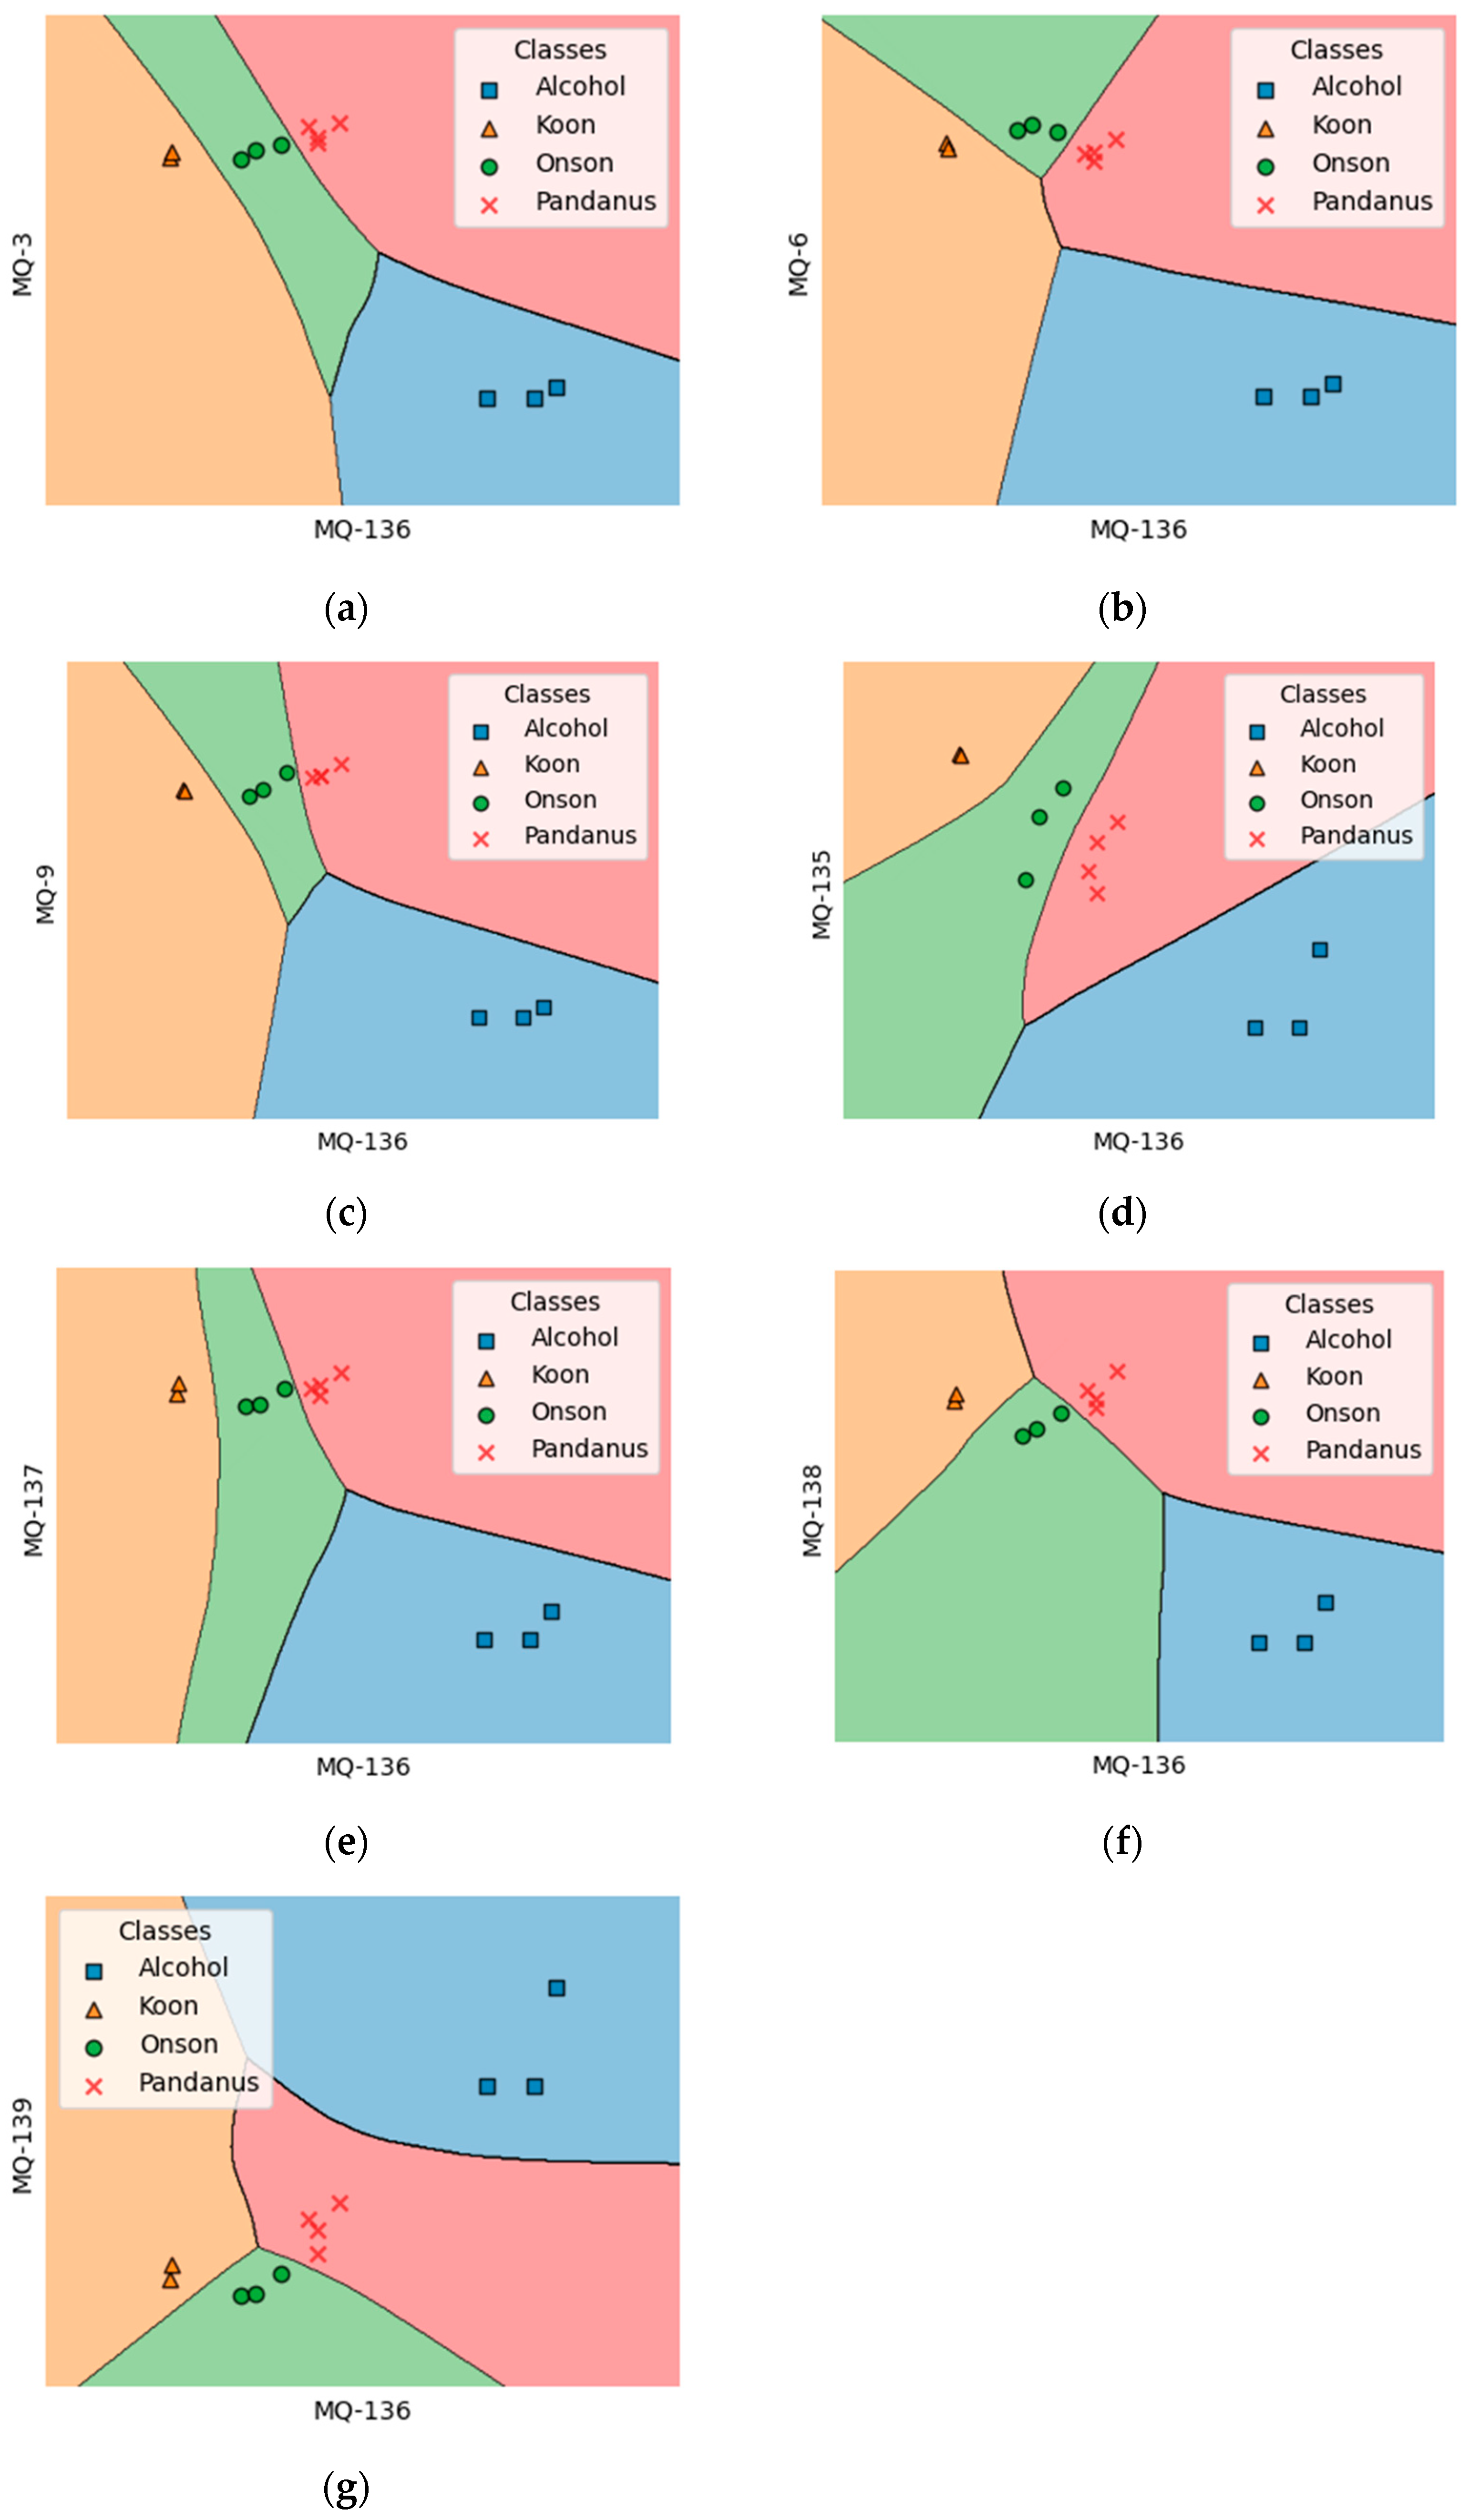
Figure 15a–g illustrate the decision regions in 2D, derived from the two input features, with four outputs: pure alcohol (95%), Koon, Onson, and Pandanus, representing local Thai craft spirits. The data distribution patterns and spatial arrangement clearly demonstrate that 95% pure alcohol is distinctly separated from the data corresponding to the three types of local Thai craft spirits, which have an alcohol concentration of approximately 40%. This indicates that variations in alcohol concentration lead to differing spatial positions in the data distribution. Despite the similar concentration levels of the three types of local Thai craft spirits, the e-nose developed in this study successfully measures and distinguishes between them, as illustrated in Figure 14 and Figure 15. This differentiation may stem from the unique raw materials and production processes used for each type of liquor, leading to the release of distinct gases or odors. We also observed that utilizing different pairs of feature data results in varying distribution patterns, while still preserving clear separation between the distribution groups. In this study, we designate the signal from the MQ-136 gas sensor as the primary feature for pairing with other gas sensors. The results of the study clearly demonstrate that using only two gas sensors is sufficient to measure and distinguish local Thai craft spirits, eliminating the need for the dimensionality reduction in feature data prior to the classification process.

4. Conclusions

This research presents an innovative approach for detecting and classifying local Thai craft spirits, employing a cost-effective, rapid-analysis portable electronic nose integrated with deep learning techniques. The e-nose system, equipped with metal oxide gas sensors and a temperature/humidity sensor, effectively captures the volatile organic compounds of Koon, Onson, and Pandanus spirits. By employing Z-score normalization and a MLP deep learning model, the study achieved 100% classification accuracy and identified distinct sensor response patterns. This approach not only establishes a robust framework for the quality control and monitoring of Thai craft spirits but also provides a scalable solution applicable to similar contexts in other countries, fostering future advancements in spirit classification technology.

Author Contributions

Conceptualization, S.H.; methodology, N.B. and S.H.; software, N.B. and S.H.; validation, N.S. and S.H.; formal analysis, P.K and S.H.; investigation, S.S. and S.H.; resources, S.H.; data curation, N.S. and S.H.; writing—original draft preparation, S.H.; writing—review and editing, S.H.; visualization, S.S., P.K. and S.H.; supervision, S.H.; project administration, S.H.; funding acquisition, S.H. All authors have read and agreed to the published version of the manuscript.

Funding

This research project was financially supported by Thailand Science Research and Innovation (TSRI).

Institutional Review Board Statement

Not applicable.

Informed Consent Statement

Not applicable.

Data Availability Statement

The original contributions presented in the study are included in the article; further inquiries can be directed to the corresponding author.

Conflicts of Interest

The authors declare no conflicts of interest.

References

  1. Persaud, K.C.; Dodd, G. Analysis of discrimination mechanisms in the mammalian olfactory system using a model nose. Nature 1982, 299, 352–355. [Google Scholar] [CrossRef] [PubMed]
  2. Bonah, E.; Huang, X.; Aheto, J.H.; Osae, R. Application of electronic nose as a non-invasive technique for odor fingerprinting and detection of bacterial foodborne pathogens: A review. J. Food Sci. Technol. 2020, 57, 1977–1990. [Google Scholar] [CrossRef] [PubMed]
  3. Persaud, K. Electronic Noses and Tongues in the Food Industry. In Electronic Noses and Tongues in Food Science; Elsevier: Amsterdam, The Netherlands, 2016; pp. 1–12. ISBN 978-0-12-800243-8. [Google Scholar]
  4. Aouadi, B.; Zaukuu, J.Z.; Vitális, F.; Bodor, Z.; Fehér, O.; Gillay, Z.; Bazar, G.; Kovacs, Z. Historical evolution and food control achievements of near infrared spectroscopy, Electronic nose, and electronic tongue-critical overview. Sensors 2020, 20, 5479. [Google Scholar] [CrossRef] [PubMed]
  5. John, A.T.; Murugappan, K.; Nisbet, D.R.; Tricoli, A. An outlook of recent advances in chemiresistive sensor-based electronic nose systems for food quality and environmental monitoring. Sensors 2021, 1, 2271. [Google Scholar] [CrossRef]
  6. Seesaard, T.; Wongchoosuk, C. Recent progress in electronic noses for fermented foods and beverages applications. Fermentation 2022, 8, 302. [Google Scholar] [CrossRef]
  7. Munekata, P.E.S.; Finardi, S.; de Souza, C.K.; Meinert, C.; Pateiro, M.; Hoffmann, T.G.; Domínguez, R.; Bertoli, S.L.; Kumar, M.; Lorenzo, J.M. Applications of electronic nose, electronic eye and electronic tongue in quality, safety and shelf life of meat and meat products: A review. Sensors 2023, 23, 672. [Google Scholar] [CrossRef]
  8. Cavallari, M.R.; Izquierdo, J.E.E.; Braga, G.S.; Dirani, E.A.T.; Pereira-da-Silva, M.A.; Rodríguez, E.F.G.; Fonseca, F.J. Enhanced sensitivity of gas sensor based on poly(3-hexylthiophene) thin-film transistors for disease diagnosis and environment monitoring. Sensors 2015, 15, 9592–9609. [Google Scholar] [CrossRef]
  9. Wilson, A.D. Review of electronic-nose technologies and algorithms to detect hazardous chemicals in the environment. Procedia Technol. 2012, 1, 453–463. [Google Scholar] [CrossRef]
  10. Wilson, A.D.; Baietto, M. Advances in electronic-nose technologies developed for biomedical applications. Sensors 2011, 11, 1105–1176. [Google Scholar] [CrossRef]
  11. Voss, A.; Schroeder, R.; Schulz, S.; Haueisen, J.; Vogler, S.; Horn, P.; Stallmach, A.; Reuken, P. Detection of liver dysfunction using a wearable electronic nose system based on semiconductor metal oxide sensors. Biosensors 2022, 12, 70. [Google Scholar] [CrossRef]
  12. Epping, R.; Koch, M. On-site detection of volatile organic compounds (vocs). Molecules 2023, 28, 1598. [Google Scholar] [CrossRef] [PubMed]
  13. Mansurova, M.; Ebert, B.E.; Blank, L.M.; Ibáñez, A.J. A breath of information: The volatilome. Curr. Genet. 2018, 64, 959–964. [Google Scholar] [CrossRef] [PubMed]
  14. Wongchoosuk, C.; Lutz, M.; Kerdcharoen, T. Detection and classification of human body odor using an electronic nose. Sensors 2009, 9, 7234–7249. [Google Scholar] [CrossRef] [PubMed]
  15. Voss, A.; Witt, K.; Kaschowitz, T.; Poitz, W.; Ebert, A.; Roser, P.; Bär, K.J. Detecting cannabis use on the human skin surface via an electronic nose system. Sensors 2014, 14, 13256–13272. [Google Scholar] [CrossRef] [PubMed]
  16. Tang, K.T.; Chiu, S.W.; Pan, C.H.; Hsieh, H.Y.; Liang, Y.S.; Liu, S.C. Development of a portable electronic nose system for the detection and classification of fruity odors. Sensors 2010, 10, 9179–9193. [Google Scholar] [CrossRef]
  17. Pan, C.H.; Hsieh, H.Y.; Tang, K.T. An analog multilayer perceptron neural network for a portable electronic nose. Sensors 2012, 13, 193–207. [Google Scholar] [CrossRef]
  18. Macías Macías, M.; Agudo, J.E.; García Manso, A.; García Orellana, C.J.; González Velasco, H.M.; Gallardo Caballero, R. A compact and low cost electronic nose for aroma detection. Sensors 2013, 13, 5528–5541. [Google Scholar] [CrossRef]
  19. Macías, M.M.; Manso, A.G.; Orellana, C.J.; Velasco, H.M.; Caballero, R.G.; Chamizo, J.C. Acetic acid detection threshold in synthetic wine samples of a portable electronic nose. Sensors 2012, 13, 208–220. [Google Scholar] [CrossRef]
  20. Hernández, E.; Pelegrí-Sebastiá, J.; Sogorb, T.; Chilo, J. Evaluation of red wine acidification using an e-nose system with venturi tool sampling. Sensors 2023, 23, 2878. [Google Scholar] [CrossRef]
  21. Han, F.; Zhang, D.; Aheto, J.H.; Feng, F.; Duan, T. Integration of a low-cost electronic nose and a voltammetric electronic tongue for red wines identification. Food Sci. Nutr. 2020, 8, 4330–4339. [Google Scholar] [CrossRef]
  22. Liu, R.; Liu, Y.; Zhu, Y.; Kortesniemi, M.; Zhu, B.; Li, H. Aromatic characteristics of passion fruit wines measured by e-nose, gc-quadrupole ms, gc-orbitrap-ms and sensory evaluation. Foods 2022, 11, 3789. [Google Scholar] [CrossRef] [PubMed]
  23. Fuentes, S.; Summerson, V.; Gonzalez Viejo, C.; Tongson, E.; Lipovetzky, N.; Wilkinson, K.L.; Szeto, C.; Unnithan, R.R. Assessment of smoke contamination in grapevine berries and taint in wines due to bushfires using a low-cost e-nose and an artificial intelligence approach. Sensors 2020, 20, 5108. [Google Scholar] [CrossRef] [PubMed]
  24. Gonzalez Viejo, C.; Fuentes, S. Digital assessment and classification of wine faults using a low-cost electronic nose, near-infrared spectroscopy and machine learning modelling. Sensors 2022, 22, 2303. [Google Scholar] [CrossRef]
  25. Aleixandre, M.; Santos, J.P.; Sayago, I.; Cabellos, J.M.; Arroyo, T.; Horrillo, M.C. A wireless and portable electronic nose to differentiate musts of different ripeness degree and grape varieties. Sensors 2015, 15, 8429–8443. [Google Scholar] [CrossRef] [PubMed]
  26. Macías, M.M.; Agudo, J.E.; Manso, A.G.; Orellana, C.J.; Velasco, H.M.; Caballero, R.G. Improving short term instability for quantitative analyses with portable electronic noses. Sensors 2014, 14, 10514–10526. [Google Scholar] [CrossRef]
  27. Huang, Y.; Doh, I.J.; Bae, E. Design and validation of a portable machine learning-based electronic nose. Sensors 2021, 21, 3923. [Google Scholar] [CrossRef]
  28. Kiani, S.; Minaei, S.; Ghasemi-Varnamkhasti, M. A portable electronic nose as an expert system for aroma-based classification of saffron. Chemometr. Intell. Lab. 2016, 156, 148–156. [Google Scholar] [CrossRef]
  29. Wu, Z.; Zhang, H.; Sun, W.; Lu, N.; Yan, M.; Wu, Y.; Hua, Z.; Fan, S. Development of a low-cost portable electronic nose for cigarette brands identification. Sensors 2020, 20, 4239. [Google Scholar] [CrossRef]
  30. Gonzalez Viejo, C.; Tongson, E.; Fuentes, S. Integrating a low-cost electronic nose and machine learning modelling to assess coffee aroma profile and intensity. Sensors 2021, 21, 2016. [Google Scholar] [CrossRef]
  31. Tyagi, H.; Daulton, E.; Bannaga, A.S.; Arasaradnam, R.P.; Covington, J.A. Non-invasive detection and staging of colorectal cancer using a portable electronic nose. Sensors 2021, 21, 5440. [Google Scholar] [CrossRef]
  32. Vanarse, A.; Osseiran, A.; Rassau, A.; van der Made, P. Application of neuromorphic olfactory approach for high-accuracy classification of malts. Sensors 2022, 22, 440. [Google Scholar] [CrossRef] [PubMed]
  33. Feng, H.; Gonzalez Viejo, C.; Vaghefi, N.; Taylor, P.W.J.; Tongson, E.; Fuentes, S. Early detection of fusarium oxysporum infection in processing tomatoes (Solanum lycopersicum) and pathogen-soil interactions using a low-cost portable electronic nose and machine learning modeling. Sensors 2022, 22, 8645. [Google Scholar] [CrossRef] [PubMed]
  34. Meléndez, F.; Arroyo, P.; Gómez-Suárez, J.; Palomeque-Mangut, S.; Suárez, J.I.; Lozano, J. Portable electronic nose based on digital and analog chemical sensors for 2,4,6-trichloroanisole discrimination. Sensors 2022, 22, 3453. [Google Scholar] [CrossRef] [PubMed]
  35. Santos, J.P.; Sayago, I.; Sanjurjo, J.L.; Perez-Coello, M.S.; Díaz-Maroto, M.C. Rapid and non-destructive analysis of corky off-flavors in natural cork stoppers by a wireless and portable electronic nose. Sensors 2022, 22, 4687. [Google Scholar] [CrossRef]
  36. Aznan, A.; Gonzalez Viejo, C.; Pang, A.; Fuentes, S. Rapid detection of fraudulent rice using low-cost digital sensing devices and machine learning. Sensors 2022, 22, 8655. [Google Scholar] [CrossRef]
  37. Gardner, J.W.; Hines, E.L.; Wilkinson, M. Application of artificial neural networks to an electronic olfactory system. Meas. Sci. Technol. 1990, 1, 446–451. [Google Scholar] [CrossRef]
  38. Gardner, J.W. Detection of vapours and odours from a multisensor array using pattern recognition. Part I. Principal component and cluster analysis. Sens. Actuators B 1991, 4, 109–116. [Google Scholar] [CrossRef]
  39. Gardner, J.W.; Hines, E.L.; Tang, H.C. Detection of vapours and odours from a multisensor array using pattern-recognition techniques Part 2. Artificial neural networks. Sens. Actuators B 1992, 9, 9–15. [Google Scholar] [CrossRef]
  40. Craven, M.A.; Gardner, J.W.; Bartlett, P.N. Electronic noses—Development and future prospects. Trends Anal. Chem. 1996, 15, 486–493. [Google Scholar] [CrossRef]
  41. Hines, E.L.; Llobet, E.; Gardner, J.W. Electronic noses: A review of signal processing techniques. IEE Proc.-Circuits Devices Sys. 1999, 146, 297–310. [Google Scholar] [CrossRef]
  42. Vorakhutttanon, K.; Widtayakornbundit, S.; Sawangwong, S. Thai distilled spirit as cultural product for local tourism development in thailand. AJPU 2023, 14, 225–239. [Google Scholar]
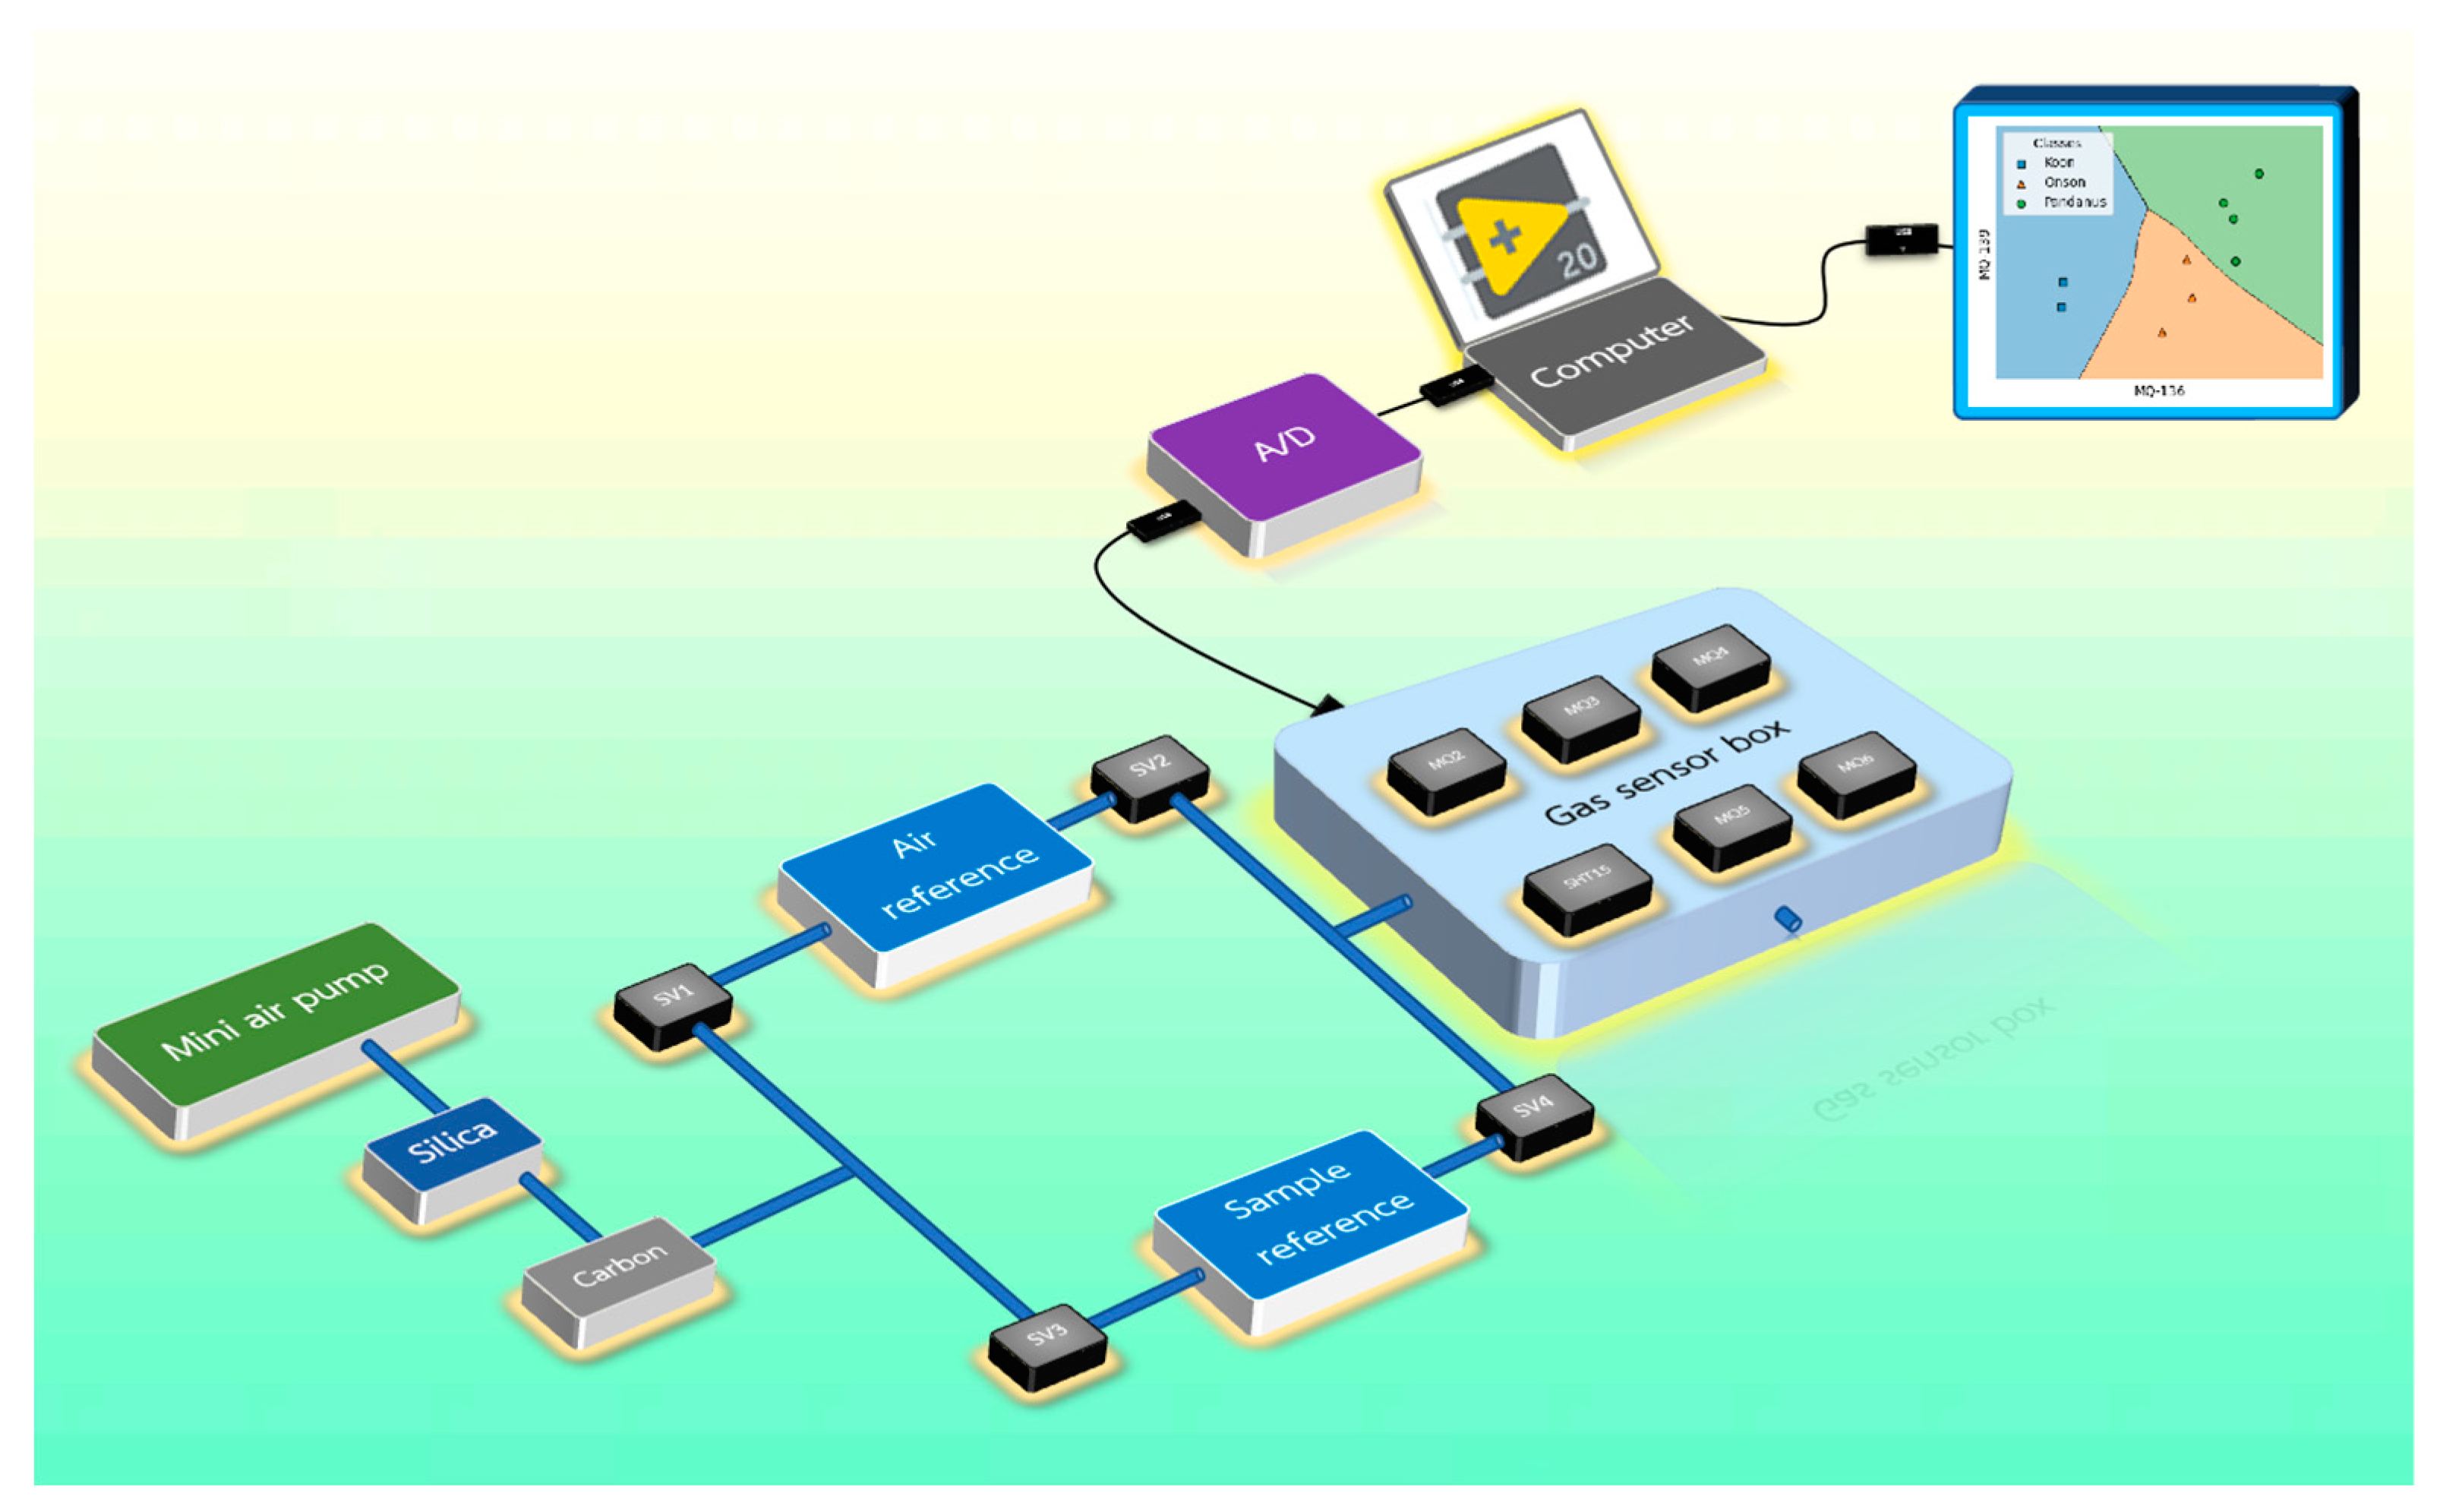
Figure 1. E-nose system.
Chemosensors 12 00221 g001
Figure 2. E-nose configuration: (a) gas flow direction and (b) sensor interface.
Chemosensors 12 00221 g002
Figure 3. A low-cost portable electronic nose: (a) top and front view and (b) inside view.
Chemosensors 12 00221 g003
Figure 4. Measurement setup.
Chemosensors 12 00221 g004
Figure 5. Data extraction: (a) sensor response and (b) data extraction.
Chemosensors 12 00221 g005
Figure 6. Multilayer perceptron architecture.
Chemosensors 12 00221 g006
Figure 7. Temperature and humidity sensing: (a) temperature and (b) humidity.
Chemosensors 12 00221 g007
Figure 8. Relationship of humidity to various quantities: (a) time, (b) MQ-135, (c) MQ-136, (d) MQ-137, (e) MQ-138, (f) MQ-139, (g) MQ-9, (h) MQ-6, and (i) MQ-3.
Chemosensors 12 00221 g008aChemosensors 12 00221 g008b
Figure 9. Gas sensor response: (a) Koon, (b) Onson, (c) Pandanus, and (d) alcohol.
Chemosensors 12 00221 g009
Figure 10. Maximum and minimum of sensor response: (a) Koon, (b) Onson, (c) Pandanus, and (d) alcohol.
Chemosensors 12 00221 g010
Figure 11. Pair plot of sensor responses based on local Thai craft spirits.
Chemosensors 12 00221 g011
Figure 12. Heatmap of correlation coefficients between gas sensors based on local Thai craft spirits.
Chemosensors 12 00221 g012
Figure 13. The decision regions in 2D derived from the 8 input features of the sensor array: (a) MLP with PCA and (b) K-means with PCA.
Chemosensors 12 00221 g013
Figure 14. Scatter plots and classifications: (a) and (b) MQ-136 vs. MQ-3, (c) and (d) MQ-136 vs. MQ-6, (e) and (f) MQ-136 vs. MQ-9, (g) and (h) MQ-136 vs. MQ-135, (i) and (j) MQ-136 vs. MQ-137, (k) and (l) MQ-136 vs. MQ-138, and (m) and (n) MQ-136 vs. MQ-139.
Chemosensors 12 00221 g014aChemosensors 12 00221 g014b
Figure 15. Classifications: (a) MQ-136 vs. MQ-3, (b) MQ-136 vs. MQ-6, (c) MQ-136 vs. MQ-9, (d) MQ-136 vs. MQ-135, (e) MQ-136 vs. MQ-137, (f) MQ-136 vs. MQ-138, and (g) MQ-136 vs. MQ-139.
Chemosensors 12 00221 g015
Table 1. Types of gas sensors used in portable electronic noses.
SensorTypes of Gases That Can Be Measured
MQ-3Alcohol, ethanol, and smoke
MQ-6LPG and butane gas
MQ-9Carbon monoxide and flammable gases
MQ-135Carbon monoxide, benzene, ammonia, alcohol, and smoke
MQ-136Hydrogen sulfide
MQ-137Ammonia
MQ-138Benzene, toluene, alcohol, acetone, propane, formaldehyde, and hydrogen
MQ-139Freon
Disclaimer/Publisher’s Note: The statements, opinions and data contained in all publications are solely those of the individual author(s) and contributor(s) and not of MDPI and/or the editor(s). MDPI and/or the editor(s) disclaim responsibility for any injury to people or property resulting from any ideas, methods, instructions or products referred to in the content.